Allegan County, MI
Allegan County Map
Allegan County Overview
120,189
TOTAL POPULATION
60,422
MALE POPULATION
59,767
FEMALE POPULATION
101.10
MALES / 100 FEMALES
98.92
FEMALES / 100 MALES
40.4
MEDIAN AGE
3.0
AVG FAMILY SIZE
2.7
AVG HOUSEHOLD SIZE
$35,220
PER CAPITA INCOME
$86,347
AVG FAMILY INCOME
$75,543
AVG HOUSEHOLD INCOME
36.2%
WAGE / INCOME GAP [ % ]
63.8¢/ $1
WAGE / INCOME GAP [ $ ]
$11,671
FAMILY INCOME DEFICIT
0.41
INEQUALITY / GINI INDEX
59,065
LABOR FORCE [ PEOPLE ]
62.0%
PERCENT IN LABOR FORCE
3.4%
UNEMPLOYMENT RATE
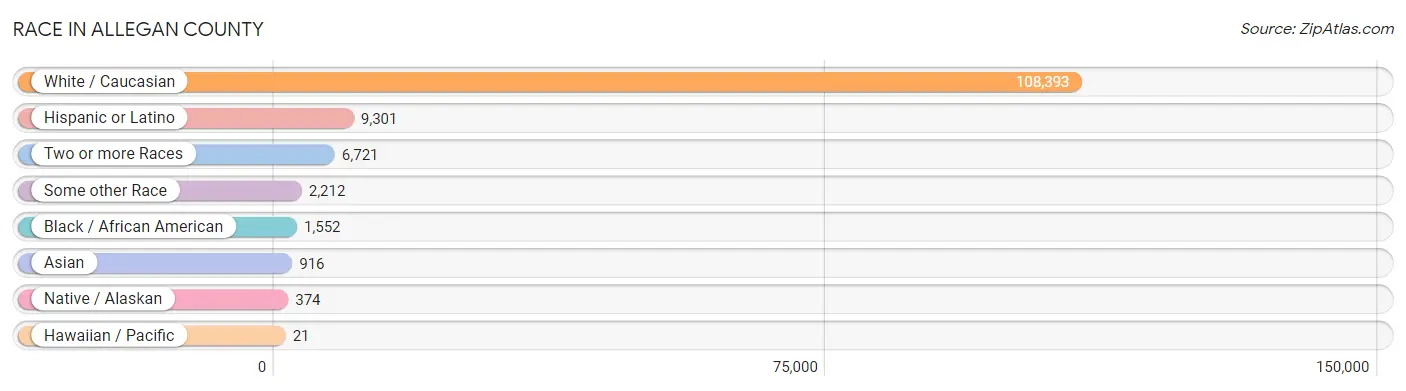
Race in Allegan County
The most populous races in Allegan County are White / Caucasian (108,393 | 90.2%), Hispanic or Latino (9,301 | 7.7%), and Two or more Races (6,721 | 5.6%).
| Race | # Population | % Population |
| Asian | 916 | 0.8% |
| Black / African American | 1,552 | 1.3% |
| Hawaiian / Pacific | 21 | 0.0% |
| Hispanic or Latino | 9,301 | 7.7% |
| Native / Alaskan | 374 | 0.3% |
| White / Caucasian | 108,393 | 90.2% |
| Two or more Races | 6,721 | 5.6% |
| Some other Race | 2,212 | 1.8% |
| Total | 120,189 | 100.0% |
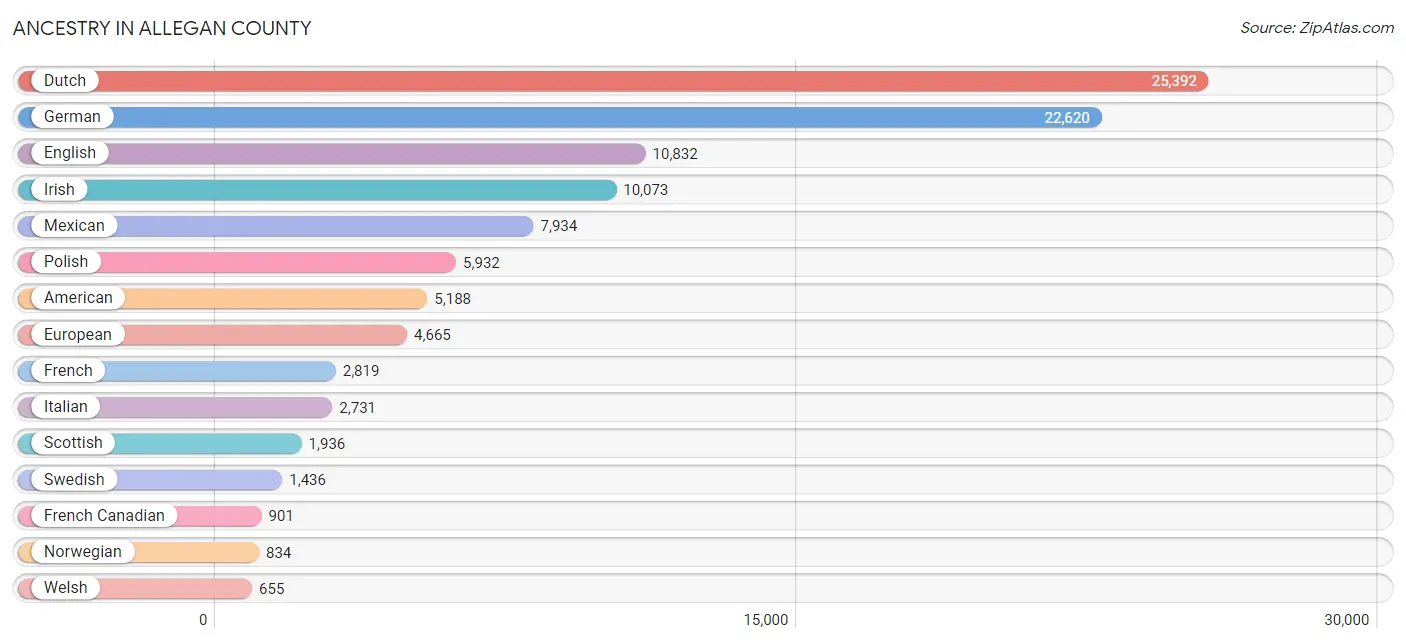
Ancestry in Allegan County
The most populous ancestries reported in Allegan County are Dutch (25,392 | 21.1%), German (22,620 | 18.8%), English (10,832 | 9.0%), Irish (10,073 | 8.4%), and Mexican (7,934 | 6.6%), together accounting for 63.9% of all Allegan County residents.
| Ancestry | # Population | % Population |
| African | 49 | 0.0% |
| Alaska Native | 2 | 0.0% |
| Albanian | 10 | 0.0% |
| American | 5,188 | 4.3% |
| Apache | 59 | 0.1% |
| Arab | 260 | 0.2% |
| Argentinean | 27 | 0.0% |
| Australian | 118 | 0.1% |
| Austrian | 179 | 0.2% |
| Belgian | 107 | 0.1% |
| Bhutanese | 154 | 0.1% |
| Blackfeet | 70 | 0.1% |
| British | 284 | 0.2% |
| Bulgarian | 15 | 0.0% |
| Burmese | 162 | 0.1% |
| Cambodian | 4 | 0.0% |
| Canadian | 142 | 0.1% |
| Celtic | 21 | 0.0% |
| Central American | 245 | 0.2% |
| Central American Indian | 69 | 0.1% |
| Cherokee | 313 | 0.3% |
| Cheyenne | 4 | 0.0% |
| Chilean | 17 | 0.0% |
| Chippewa | 371 | 0.3% |
| Colombian | 21 | 0.0% |
| Colville | 1 | 0.0% |
| Costa Rican | 15 | 0.0% |
| Creek | 14 | 0.0% |
| Croatian | 141 | 0.1% |
| Cuban | 84 | 0.1% |
| Czech | 419 | 0.4% |
| Czechoslovakian | 67 | 0.1% |
| Danish | 413 | 0.3% |
| Dominican | 5 | 0.0% |
| Dutch | 25,392 | 21.1% |
| Eastern European | 162 | 0.1% |
| English | 10,832 | 9.0% |
| Ethiopian | 25 | 0.0% |
| European | 4,665 | 3.9% |
| Finnish | 435 | 0.4% |
| French | 2,819 | 2.4% |
| French American Indian | 17 | 0.0% |
| French Canadian | 901 | 0.7% |
| German | 22,620 | 18.8% |
| Ghanaian | 7 | 0.0% |
| Greek | 104 | 0.1% |
| Guatemalan | 129 | 0.1% |
| Haitian | 13 | 0.0% |
| Honduran | 57 | 0.1% |
| Hungarian | 441 | 0.4% |
| Indian (Asian) | 181 | 0.2% |
| Irish | 10,073 | 8.4% |
| Israeli | 9 | 0.0% |
| Italian | 2,731 | 2.3% |
| Jamaican | 9 | 0.0% |
| Japanese | 110 | 0.1% |
| Korean | 256 | 0.2% |
| Laotian | 4 | 0.0% |
| Latvian | 52 | 0.0% |
| Lebanese | 237 | 0.2% |
| Lithuanian | 554 | 0.5% |
| Macedonian | 54 | 0.0% |
| Malaysian | 99 | 0.1% |
| Maltese | 10 | 0.0% |
| Mexican | 7,934 | 6.6% |
| Mexican American Indian | 136 | 0.1% |
| Mongolian | 2 | 0.0% |
| Native Hawaiian | 23 | 0.0% |
| New Zealander | 3 | 0.0% |
| Nigerian | 67 | 0.1% |
| Northern European | 93 | 0.1% |
| Norwegian | 834 | 0.7% |
| Ottawa | 65 | 0.1% |
| Pakistani | 79 | 0.1% |
| Panamanian | 34 | 0.0% |
| Pennsylvania German | 70 | 0.1% |
| Peruvian | 58 | 0.1% |
| Polish | 5,932 | 4.9% |
| Portuguese | 79 | 0.1% |
| Potawatomi | 330 | 0.3% |
| Puerto Rican | 558 | 0.5% |
| Puget Sound Salish | 6 | 0.0% |
| Romanian | 34 | 0.0% |
| Russian | 356 | 0.3% |
| Salvadoran | 10 | 0.0% |
| Samoan | 14 | 0.0% |
| Scandinavian | 566 | 0.5% |
| Scotch-Irish | 617 | 0.5% |
| Scottish | 1,936 | 1.6% |
| Seminole | 28 | 0.0% |
| Serbian | 14 | 0.0% |
| Sioux | 2 | 0.0% |
| Slavic | 47 | 0.0% |
| Slovak | 116 | 0.1% |
| Slovene | 5 | 0.0% |
| South African | 10 | 0.0% |
| South American | 181 | 0.2% |
| South American Indian | 24 | 0.0% |
| Spaniard | 76 | 0.1% |
| Spanish | 38 | 0.0% |
| Spanish American | 3 | 0.0% |
| Sri Lankan | 71 | 0.1% |
| Subsaharan African | 192 | 0.2% |
| Swedish | 1,436 | 1.2% |
| Swiss | 197 | 0.2% |
| Syrian | 8 | 0.0% |
| Thai | 181 | 0.2% |
| Turkish | 5 | 0.0% |
| Ugandan | 9 | 0.0% |
| Ukrainian | 102 | 0.1% |
| Venezuelan | 58 | 0.1% |
| Welsh | 655 | 0.5% |
| Yugoslavian | 95 | 0.1% | View All 113 Rows |
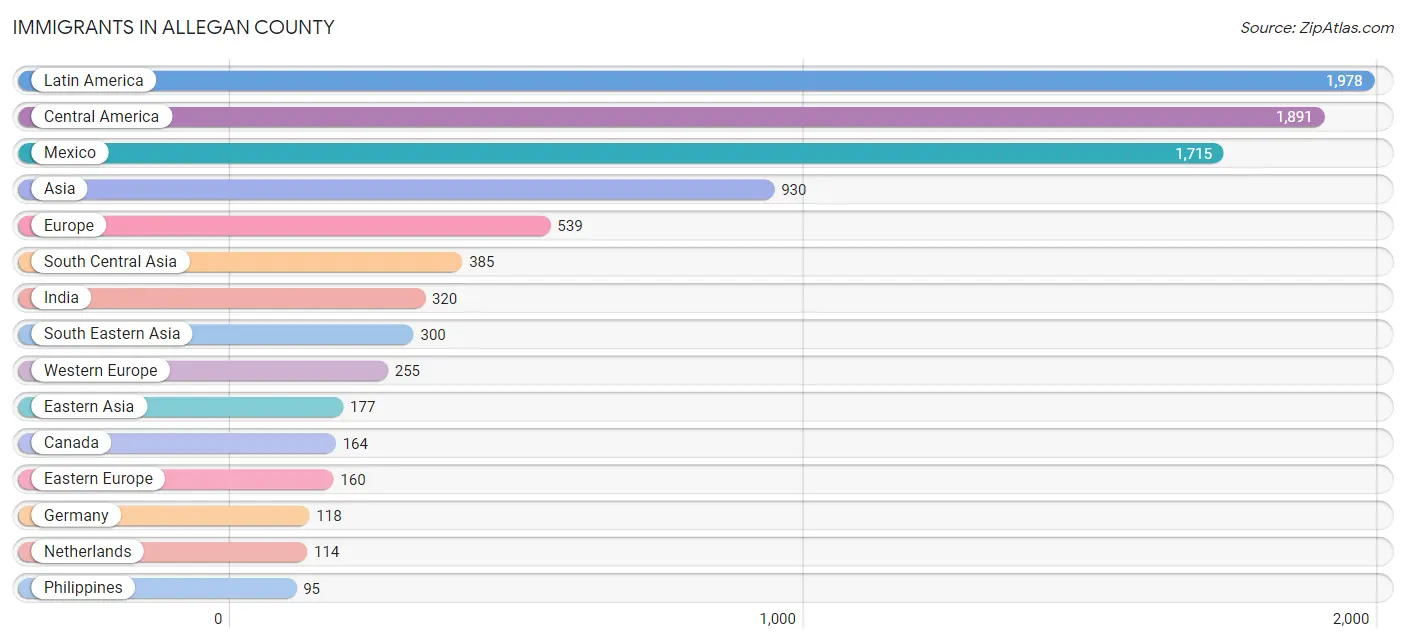
Immigrants in Allegan County
The most numerous immigrant groups reported in Allegan County came from Latin America (1,978 | 1.7%), Central America (1,891 | 1.6%), Mexico (1,715 | 1.4%), Asia (930 | 0.8%), and Europe (539 | 0.4%), together accounting for 5.9% of all Allegan County residents.
| Immigration Origin | # Population | % Population |
| Africa | 41 | 0.0% |
| Argentina | 20 | 0.0% |
| Asia | 930 | 0.8% |
| Australia | 10 | 0.0% |
| Austria | 3 | 0.0% |
| Bangladesh | 3 | 0.0% |
| Belgium | 20 | 0.0% |
| Bosnia and Herzegovina | 7 | 0.0% |
| Brazil | 14 | 0.0% |
| Bulgaria | 8 | 0.0% |
| Cambodia | 61 | 0.1% |
| Canada | 164 | 0.1% |
| Caribbean | 30 | 0.0% |
| Central America | 1,891 | 1.6% |
| China | 79 | 0.1% |
| Costa Rica | 15 | 0.0% |
| Cuba | 6 | 0.0% |
| Czechoslovakia | 7 | 0.0% |
| Denmark | 1 | 0.0% |
| Dominican Republic | 11 | 0.0% |
| Eastern Africa | 34 | 0.0% |
| Eastern Asia | 177 | 0.2% |
| Eastern Europe | 160 | 0.1% |
| El Salvador | 5 | 0.0% |
| England | 26 | 0.0% |
| Ethiopia | 20 | 0.0% |
| Europe | 539 | 0.4% |
| Germany | 118 | 0.1% |
| Ghana | 2 | 0.0% |
| Guatemala | 92 | 0.1% |
| Honduras | 6 | 0.0% |
| India | 320 | 0.3% |
| Indonesia | 31 | 0.0% |
| Israel | 4 | 0.0% |
| Italy | 31 | 0.0% |
| Jamaica | 9 | 0.0% |
| Japan | 60 | 0.1% |
| Korea | 38 | 0.0% |
| Laos | 28 | 0.0% |
| Latin America | 1,978 | 1.7% |
| Latvia | 5 | 0.0% |
| Lebanon | 55 | 0.1% |
| Malaysia | 6 | 0.0% |
| Mexico | 1,715 | 1.4% |
| Nepal | 4 | 0.0% |
| Netherlands | 114 | 0.1% |
| Northern Europe | 93 | 0.1% |
| Oceania | 13 | 0.0% |
| Pakistan | 26 | 0.0% |
| Panama | 58 | 0.1% |
| Peru | 23 | 0.0% |
| Philippines | 95 | 0.1% |
| Poland | 70 | 0.1% |
| Russia | 59 | 0.1% |
| South Africa | 5 | 0.0% |
| South America | 57 | 0.1% |
| South Central Asia | 385 | 0.3% |
| South Eastern Asia | 300 | 0.3% |
| Southern Europe | 31 | 0.0% |
| Sri Lanka | 32 | 0.0% |
| Thailand | 34 | 0.0% |
| Turkey | 9 | 0.0% |
| Uganda | 14 | 0.0% |
| Ukraine | 4 | 0.0% |
| Vietnam | 45 | 0.0% |
| Western Africa | 2 | 0.0% |
| Western Asia | 68 | 0.1% |
| Western Europe | 255 | 0.2% | View All 68 Rows |
Sex and Age in Allegan County
Sex and Age in Allegan County
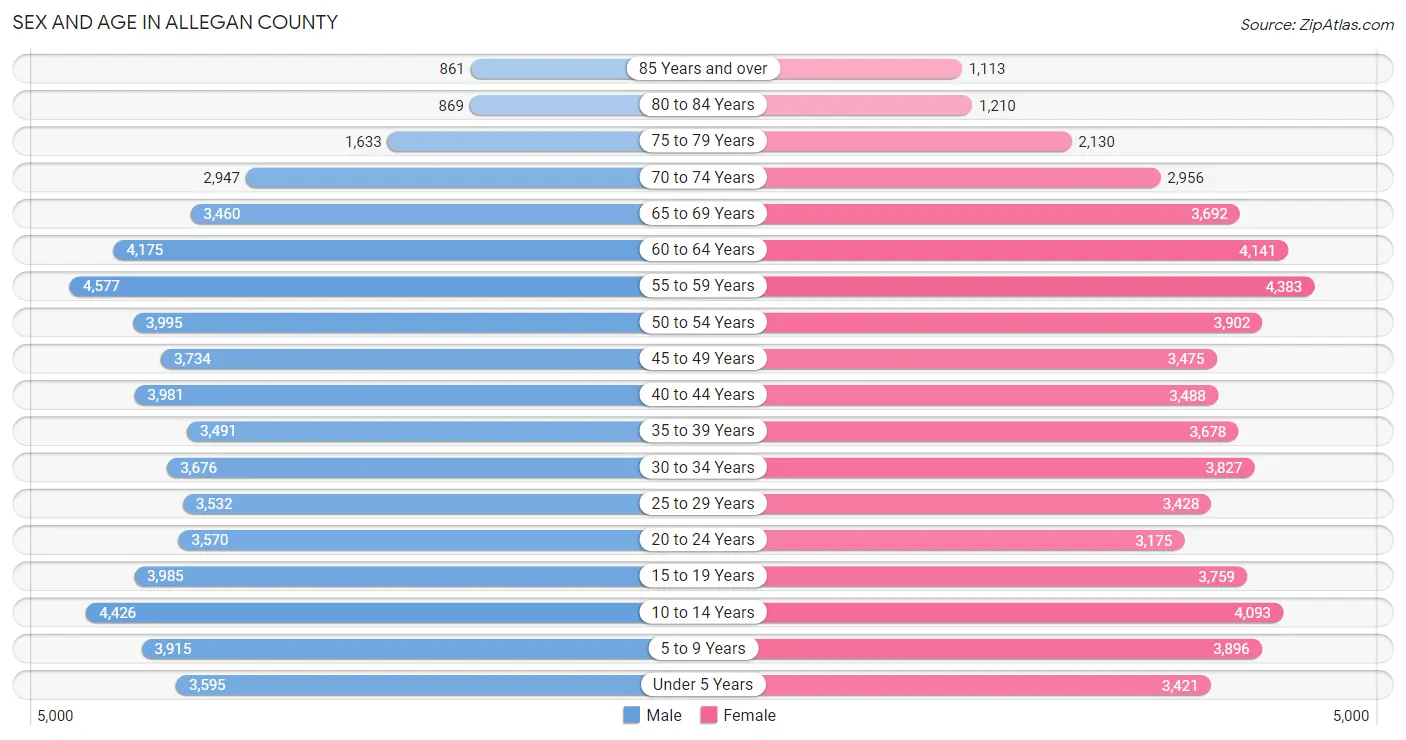
The most populous age groups in Allegan County are 55 to 59 Years (4,577 | 7.6%) for men and 55 to 59 Years (4,383 | 7.3%) for women.
| Age Bracket | Male | Female |
| Under 5 Years | 3,595 (5.9%) | 3,421 (5.7%) |
| 5 to 9 Years | 3,915 (6.5%) | 3,896 (6.5%) |
| 10 to 14 Years | 4,426 (7.3%) | 4,093 (6.9%) |
| 15 to 19 Years | 3,985 (6.6%) | 3,759 (6.3%) |
| 20 to 24 Years | 3,570 (5.9%) | 3,175 (5.3%) |
| 25 to 29 Years | 3,532 (5.9%) | 3,428 (5.7%) |
| 30 to 34 Years | 3,676 (6.1%) | 3,827 (6.4%) |
| 35 to 39 Years | 3,491 (5.8%) | 3,678 (6.1%) |
| 40 to 44 Years | 3,981 (6.6%) | 3,488 (5.8%) |
| 45 to 49 Years | 3,734 (6.2%) | 3,475 (5.8%) |
| 50 to 54 Years | 3,995 (6.6%) | 3,902 (6.5%) |
| 55 to 59 Years | 4,577 (7.6%) | 4,383 (7.3%) |
| 60 to 64 Years | 4,175 (6.9%) | 4,141 (6.9%) |
| 65 to 69 Years | 3,460 (5.7%) | 3,692 (6.2%) |
| 70 to 74 Years | 2,947 (4.9%) | 2,956 (5.0%) |
| 75 to 79 Years | 1,633 (2.7%) | 2,130 (3.6%) |
| 80 to 84 Years | 869 (1.4%) | 1,210 (2.0%) |
| 85 Years and over | 861 (1.4%) | 1,113 (1.9%) |
| Total | 60,422 (100.0%) | 59,767 (100.0%) |
Families and Households in Allegan County
Median Family Size in Allegan County
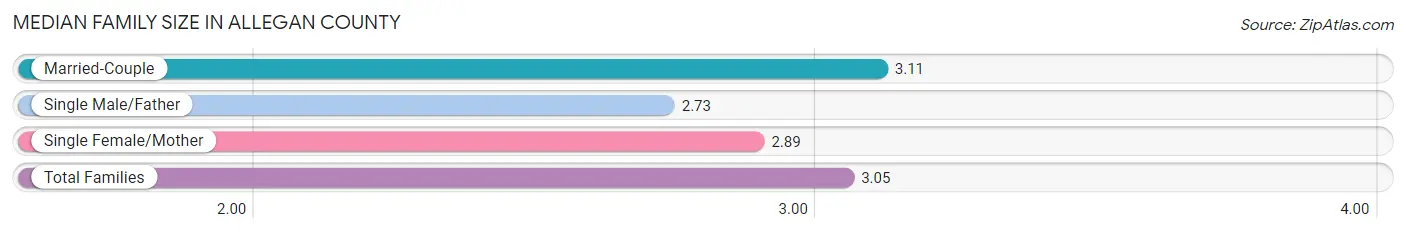
The median family size in Allegan County is 3.05 persons per family, with married-couple families (26,250 | 79.0%) accounting for the largest median family size of 3.11 persons per family. On the other hand, single male/father families (2,467 | 7.4%) represent the smallest median family size with 2.73 persons per family.
| Family Type | # Families | Family Size |
| Married-Couple | 26,250 (79.0%) | 3.11 |
| Single Male/Father | 2,467 (7.4%) | 2.73 |
| Single Female/Mother | 4,506 (13.6%) | 2.89 |
| Total Families | 33,223 (100.0%) | 3.05 |
Median Household Size in Allegan County
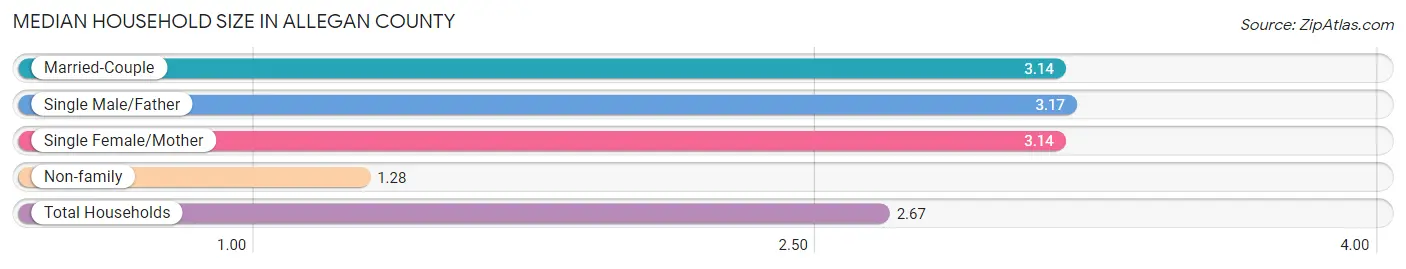
The median household size in Allegan County is 2.67 persons per household, with single male/father households (2,467 | 5.5%) accounting for the largest median household size of 3.17 persons per household. non-family households (11,398 | 25.5%) represent the smallest median household size with 1.28 persons per household.
| Household Type | # Households | Household Size |
| Married-Couple | 26,250 (58.8%) | 3.14 |
| Single Male/Father | 2,467 (5.5%) | 3.17 |
| Single Female/Mother | 4,506 (10.1%) | 3.14 |
| Non-family | 11,398 (25.5%) | 1.28 |
| Total Households | 44,621 (100.0%) | 2.67 |
Household Size by Marriage Status in Allegan County
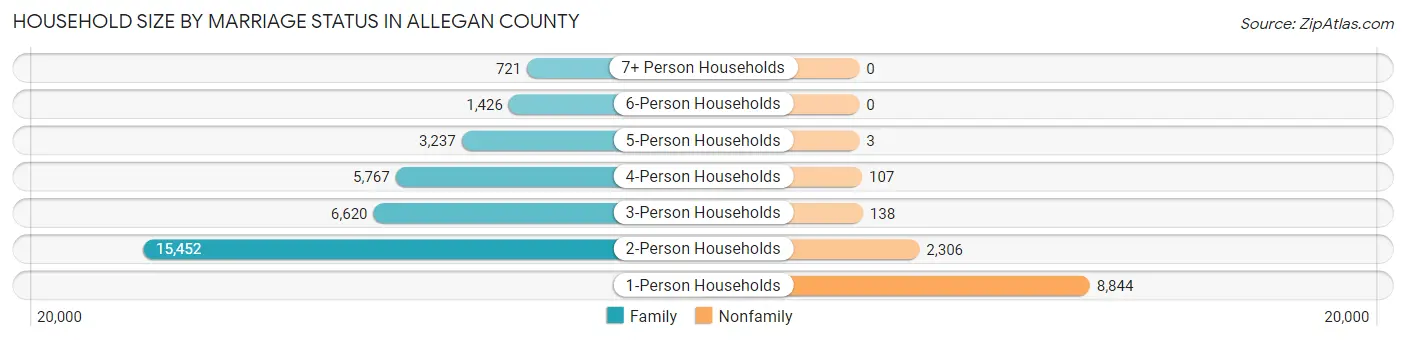
Out of a total of 44,621 households in Allegan County, 33,223 (74.5%) are family households, while 11,398 (25.5%) are nonfamily households. The most numerous type of family households are 2-person households, comprising 15,452, and the most common type of nonfamily households are 1-person households, comprising 8,844.
| Household Size | Family Households | Nonfamily Households |
| 1-Person Households | - | 8,844 (19.8%) |
| 2-Person Households | 15,452 (34.6%) | 2,306 (5.2%) |
| 3-Person Households | 6,620 (14.8%) | 138 (0.3%) |
| 4-Person Households | 5,767 (12.9%) | 107 (0.2%) |
| 5-Person Households | 3,237 (7.2%) | 3 (0.0%) |
| 6-Person Households | 1,426 (3.2%) | 0 (0.0%) |
| 7+ Person Households | 721 (1.6%) | 0 (0.0%) |
| Total | 33,223 (74.5%) | 11,398 (25.5%) |
Female Fertility in Allegan County
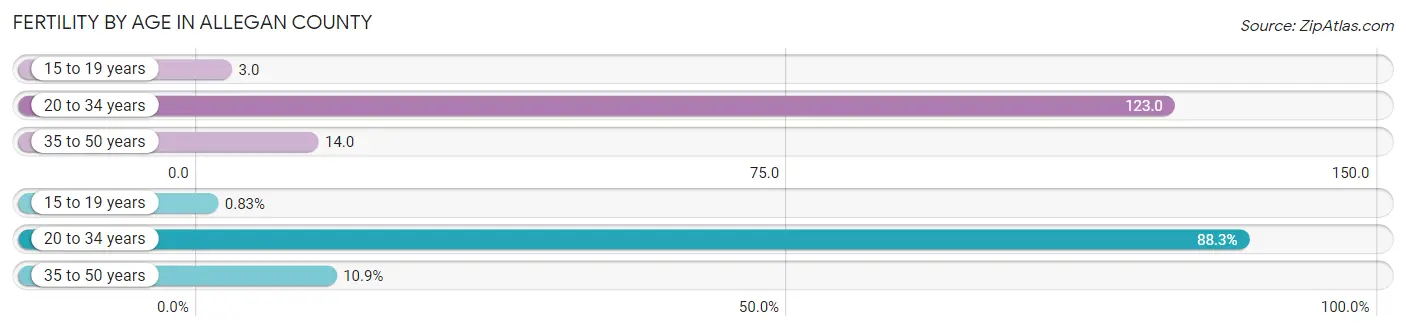
Fertility by Age in Allegan County
Average fertility rate in Allegan County is 57.0 births per 1,000 women. Women in the age bracket of 20 to 34 years have the highest fertility rate with 123.0 births per 1,000 women. Women in the age bracket of 20 to 34 years acount for 88.3% of all women with births.
| Age Bracket | Women with Births | Births / 1,000 Women |
| 15 to 19 years | 12 (0.8%) | 3.0 |
| 20 to 34 years | 1,284 (88.3%) | 123.0 |
| 35 to 50 years | 158 (10.9%) | 14.0 |
| Total | 1,454 (100.0%) | 57.0 |
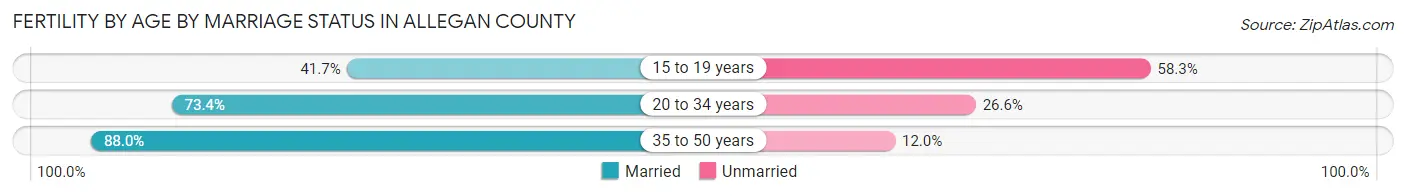
Fertility by Age by Marriage Status in Allegan County
74.7% of women with births (1,454) in Allegan County are married. The highest percentage of unmarried women with births falls into 15 to 19 years age bracket with 58.3% of them unmarried at the time of birth, while the lowest percentage of unmarried women with births belong to 35 to 50 years age bracket with 12.0% of them unmarried.
| Age Bracket | Married | Unmarried |
| 15 to 19 years | 5 (41.7%) | 7 (58.3%) |
| 20 to 34 years | 942 (73.4%) | 342 (26.6%) |
| 35 to 50 years | 139 (88.0%) | 19 (12.0%) |
| Total | 1,086 (74.7%) | 368 (25.3%) |
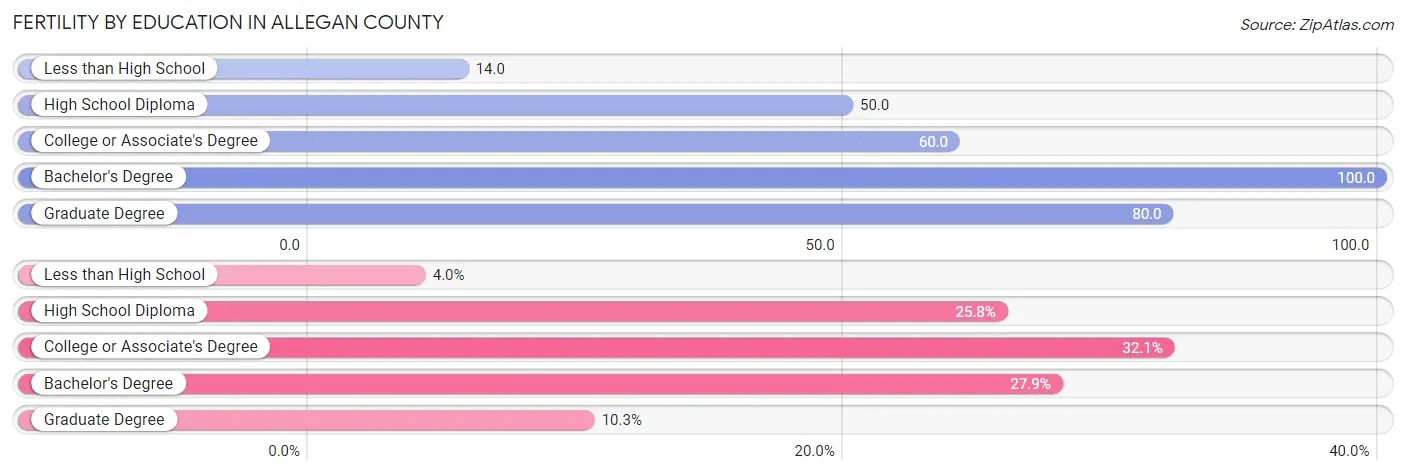
Fertility by Education in Allegan County
Average fertility rate in Allegan County is 57.0 births per 1,000 women. Women with the education attainment of bachelor's degree have the highest fertility rate of 100.0 births per 1,000 women, while women with the education attainment of less than high school have the lowest fertility at 14.0 births per 1,000 women. Women with the education attainment of college or associate's degree represent 32.1% of all women with births.
| Educational Attainment | Women with Births | Births / 1,000 Women |
| Less than High School | 58 (4.0%) | 14.0 |
| High School Diploma | 375 (25.8%) | 50.0 |
| College or Associate's Degree | 466 (32.1%) | 60.0 |
| Bachelor's Degree | 405 (27.9%) | 100.0 |
| Graduate Degree | 150 (10.3%) | 80.0 |
| Total | 1,454 (100.0%) | 57.0 |
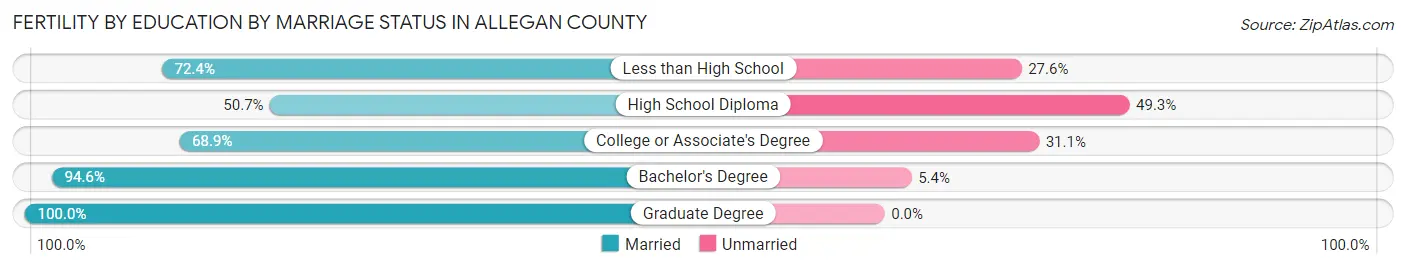
Fertility by Education by Marriage Status in Allegan County
25.3% of women with births in Allegan County are unmarried. Women with the educational attainment of graduate degree are most likely to be married with 100.0% of them married at childbirth, while women with the educational attainment of high school diploma are least likely to be married with 49.3% of them unmarried at childbirth.
| Educational Attainment | Married | Unmarried |
| Less than High School | 42 (72.4%) | 16 (27.6%) |
| High School Diploma | 190 (50.7%) | 185 (49.3%) |
| College or Associate's Degree | 321 (68.9%) | 145 (31.1%) |
| Bachelor's Degree | 383 (94.6%) | 22 (5.4%) |
| Graduate Degree | 150 (100.0%) | 0 (0.0%) |
| Total | 1,086 (74.7%) | 368 (25.3%) |
Income in Allegan County
Income Overview in Allegan County
Per Capita Income in Allegan County is $35,220, while median incomes of families and households are $86,347 and $75,543 respectively.
| Characteristic | Number | Measure |
| Per Capita Income | 120,189 | $35,220 |
| Median Family Income | 33,223 | $86,347 |
| Mean Family Income | 33,223 | $102,666 |
| Median Household Income | 44,621 | $75,543 |
| Mean Household Income | 44,621 | $93,470 |
| Income Deficit | 33,223 | $11,671 |
| Wage / Income Gap (%) | 120,189 | 36.19% |
| Wage / Income Gap ($) | 120,189 | 63.81¢ per $1 |
| Gini / Inequality Index | 120,189 | 0.41 |
Earnings by Sex in Allegan County
Average Earnings in Allegan County are $41,508, $50,831 for men and $32,434 for women, a difference of 36.2%.
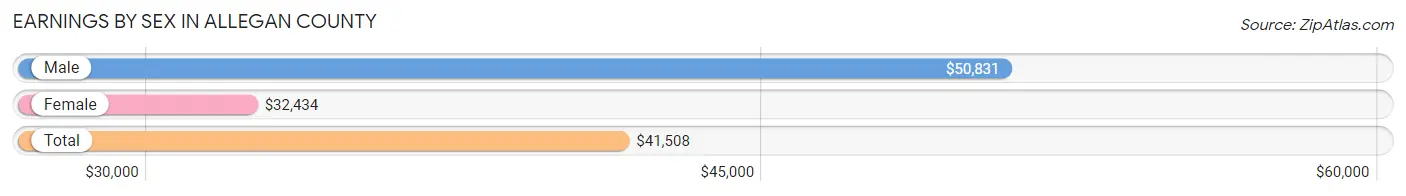
| Sex | Number | Average Earnings |
| Male | 33,754 (54.0%) | $50,831 |
| Female | 28,790 (46.0%) | $32,434 |
| Total | 62,544 (100.0%) | $41,508 |
Earnings by Sex by Income Bracket in Allegan County
The most common earnings brackets in Allegan County are $100,000+ for men (4,607 | 13.7%) and $30,000 to $34,999 for women (2,219 | 7.7%).
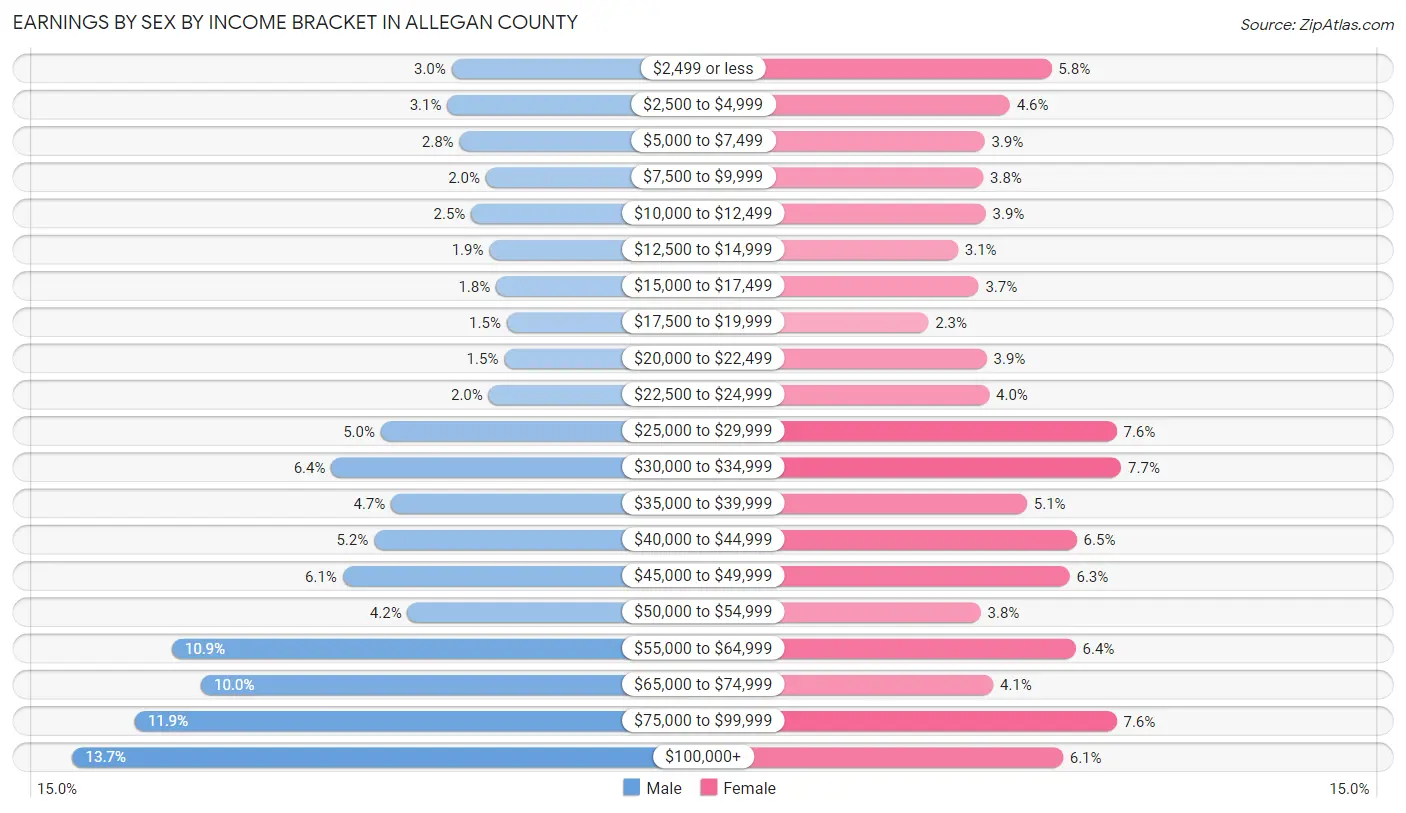
| Income | Male | Female |
| $2,499 or less | 1,011 (3.0%) | 1,656 (5.8%) |
| $2,500 to $4,999 | 1,053 (3.1%) | 1,318 (4.6%) |
| $5,000 to $7,499 | 937 (2.8%) | 1,115 (3.9%) |
| $7,500 to $9,999 | 687 (2.0%) | 1,102 (3.8%) |
| $10,000 to $12,499 | 826 (2.5%) | 1,123 (3.9%) |
| $12,500 to $14,999 | 656 (1.9%) | 899 (3.1%) |
| $15,000 to $17,499 | 590 (1.8%) | 1,066 (3.7%) |
| $17,500 to $19,999 | 491 (1.5%) | 660 (2.3%) |
| $20,000 to $22,499 | 513 (1.5%) | 1,131 (3.9%) |
| $22,500 to $24,999 | 661 (2.0%) | 1,153 (4.0%) |
| $25,000 to $29,999 | 1,686 (5.0%) | 2,182 (7.6%) |
| $30,000 to $34,999 | 2,152 (6.4%) | 2,219 (7.7%) |
| $35,000 to $39,999 | 1,587 (4.7%) | 1,457 (5.1%) |
| $40,000 to $44,999 | 1,747 (5.2%) | 1,859 (6.5%) |
| $45,000 to $49,999 | 2,046 (6.1%) | 1,802 (6.3%) |
| $50,000 to $54,999 | 1,431 (4.2%) | 1,083 (3.8%) |
| $55,000 to $64,999 | 3,667 (10.9%) | 1,852 (6.4%) |
| $65,000 to $74,999 | 3,390 (10.0%) | 1,183 (4.1%) |
| $75,000 to $99,999 | 4,016 (11.9%) | 2,183 (7.6%) |
| $100,000+ | 4,607 (13.7%) | 1,747 (6.1%) |
| Total | 33,754 (100.0%) | 28,790 (100.0%) |
Earnings by Sex by Educational Attainment in Allegan County
Average earnings in Allegan County are $56,779 for men and $37,598 for women, a difference of 33.8%. Men with an educational attainment of graduate degree enjoy the highest average annual earnings of $72,979, while those with less than high school education earn the least with $45,246. Women with an educational attainment of graduate degree earn the most with the average annual earnings of $69,421, while those with less than high school education have the smallest earnings of $25,729.
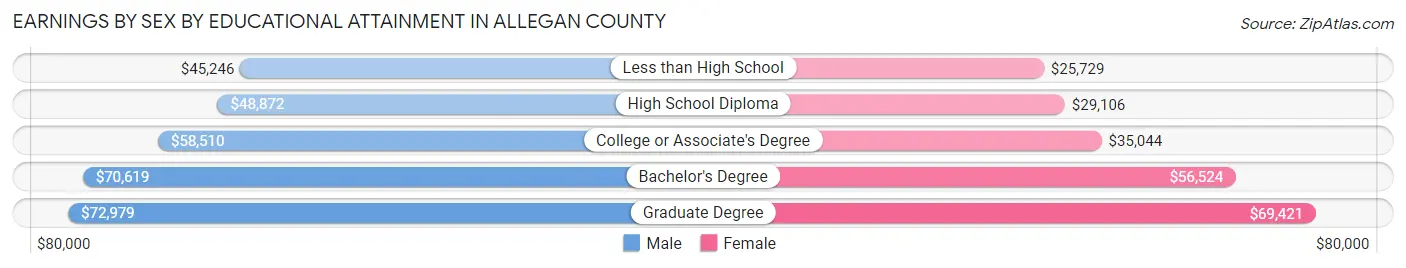
| Educational Attainment | Male Income | Female Income |
| Less than High School | $45,246 | $25,729 |
| High School Diploma | $48,872 | $29,106 |
| College or Associate's Degree | $58,510 | $35,044 |
| Bachelor's Degree | $70,619 | $56,524 |
| Graduate Degree | $72,979 | $69,421 |
| Total | $56,779 | $37,598 |
Family Income in Allegan County
Family Income Brackets in Allegan County
According to the Allegan County family income data, there are 7,209 families falling into the $100,000 to $149,999 income range, which is the most common income bracket and makes up 21.7% of all families. Conversely, the $10,000 to $14,999 income bracket is the least frequent group with only 532 families (1.6%) belonging to this category.
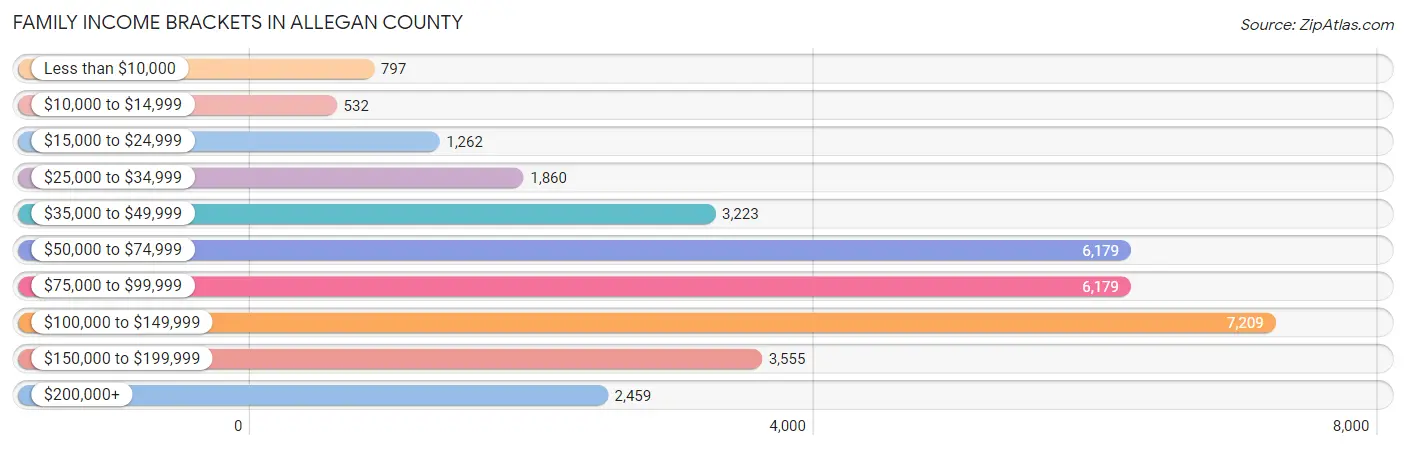
| Income Bracket | # Families | % Families |
| Less than $10,000 | 797 | 2.4% |
| $10,000 to $14,999 | 532 | 1.6% |
| $15,000 to $24,999 | 1,262 | 3.8% |
| $25,000 to $34,999 | 1,860 | 5.6% |
| $35,000 to $49,999 | 3,223 | 9.7% |
| $50,000 to $74,999 | 6,179 | 18.6% |
| $75,000 to $99,999 | 6,179 | 18.6% |
| $100,000 to $149,999 | 7,209 | 21.7% |
| $150,000 to $199,999 | 3,555 | 10.7% |
| $200,000+ | 2,459 | 7.4% |
Family Income by Famaliy Size in Allegan County
4-person families (5,420 | 16.3%) account for the highest median family income in Allegan County with $110,572 per family, while 2-person families (16,488 | 49.6%) have the highest median income of $36,948 per family member.
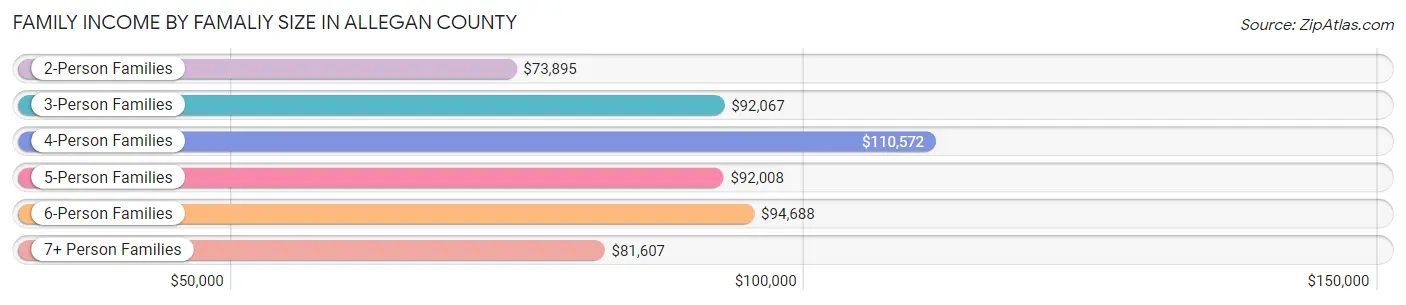
| Income Bracket | # Families | Median Income |
| 2-Person Families | 16,488 (49.6%) | $73,895 |
| 3-Person Families | 6,307 (19.0%) | $92,067 |
| 4-Person Families | 5,420 (16.3%) | $110,572 |
| 5-Person Families | 3,120 (9.4%) | $92,008 |
| 6-Person Families | 1,391 (4.2%) | $94,688 |
| 7+ Person Families | 497 (1.5%) | $81,607 |
| Total | 33,223 (100.0%) | $86,347 |
Family Income by Number of Earners in Allegan County
The median family income in Allegan County is $86,347, with families comprising 3+ earners (4,277) having the highest median family income of $133,591, while families with no earners (5,672) have the lowest median family income of $49,429, accounting for 12.9% and 17.1% of families, respectively.
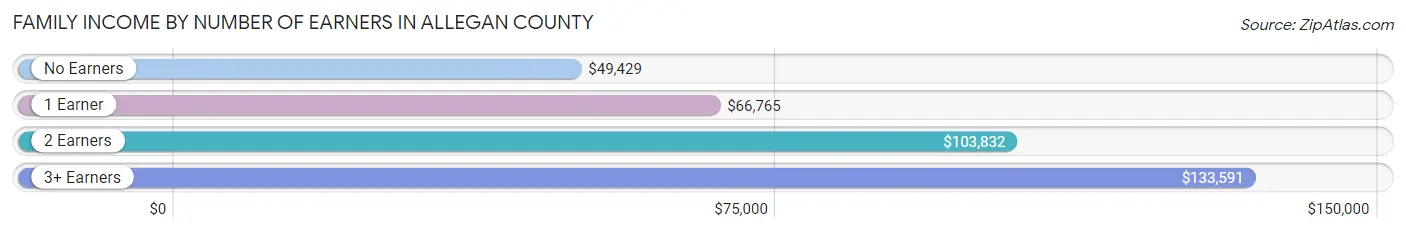
| Number of Earners | # Families | Median Income |
| No Earners | 5,672 (17.1%) | $49,429 |
| 1 Earner | 10,060 (30.3%) | $66,765 |
| 2 Earners | 13,214 (39.8%) | $103,832 |
| 3+ Earners | 4,277 (12.9%) | $133,591 |
| Total | 33,223 (100.0%) | $86,347 |
Household Income in Allegan County
Household Income Brackets in Allegan County
With 8,255 households falling in the category, the $50,000 to $74,999 income range is the most frequent in Allegan County, accounting for 18.5% of all households. In contrast, only 937 households (2.1%) fall into the $10,000 to $14,999 income bracket, making it the least populous group.
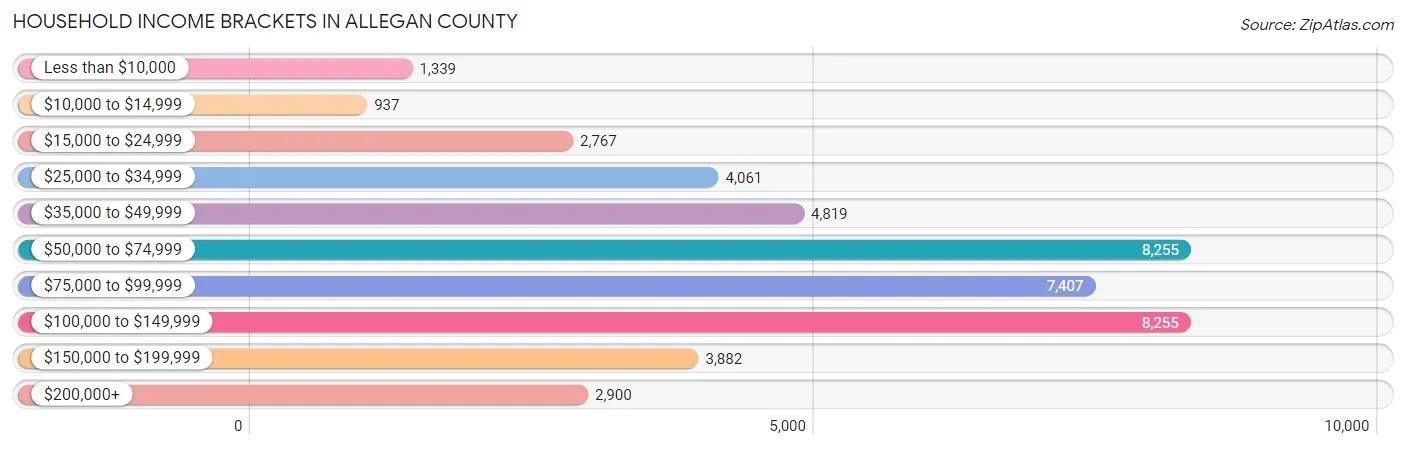
| Income Bracket | # Households | % Households |
| Less than $10,000 | 1,339 | 3.0% |
| $10,000 to $14,999 | 937 | 2.1% |
| $15,000 to $24,999 | 2,767 | 6.2% |
| $25,000 to $34,999 | 4,061 | 9.1% |
| $35,000 to $49,999 | 4,819 | 10.8% |
| $50,000 to $74,999 | 8,255 | 18.5% |
| $75,000 to $99,999 | 7,407 | 16.6% |
| $100,000 to $149,999 | 8,255 | 18.5% |
| $150,000 to $199,999 | 3,882 | 8.7% |
| $200,000+ | 2,900 | 6.5% |
Household Income by Householder Age in Allegan County
The median household income in Allegan County is $75,543, with the highest median household income of $87,663 found in the 45 to 64 years age bracket for the primary householder. A total of 17,500 households (39.2%) fall into this category. Meanwhile, the 15 to 24 years age bracket for the primary householder has the lowest median household income of $46,894, with 934 households (2.1%) in this group.
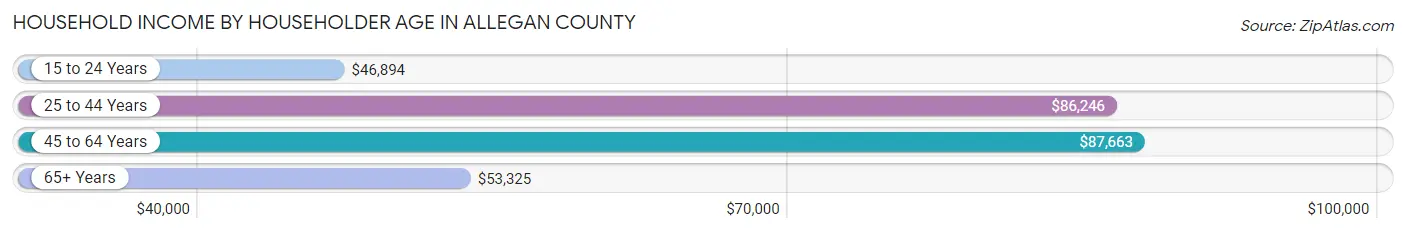
| Income Bracket | # Households | Median Income |
| 15 to 24 Years | 934 (2.1%) | $46,894 |
| 25 to 44 Years | 13,860 (31.1%) | $86,246 |
| 45 to 64 Years | 17,500 (39.2%) | $87,663 |
| 65+ Years | 12,327 (27.6%) | $53,325 |
| Total | 44,621 (100.0%) | $75,543 |
Poverty in Allegan County
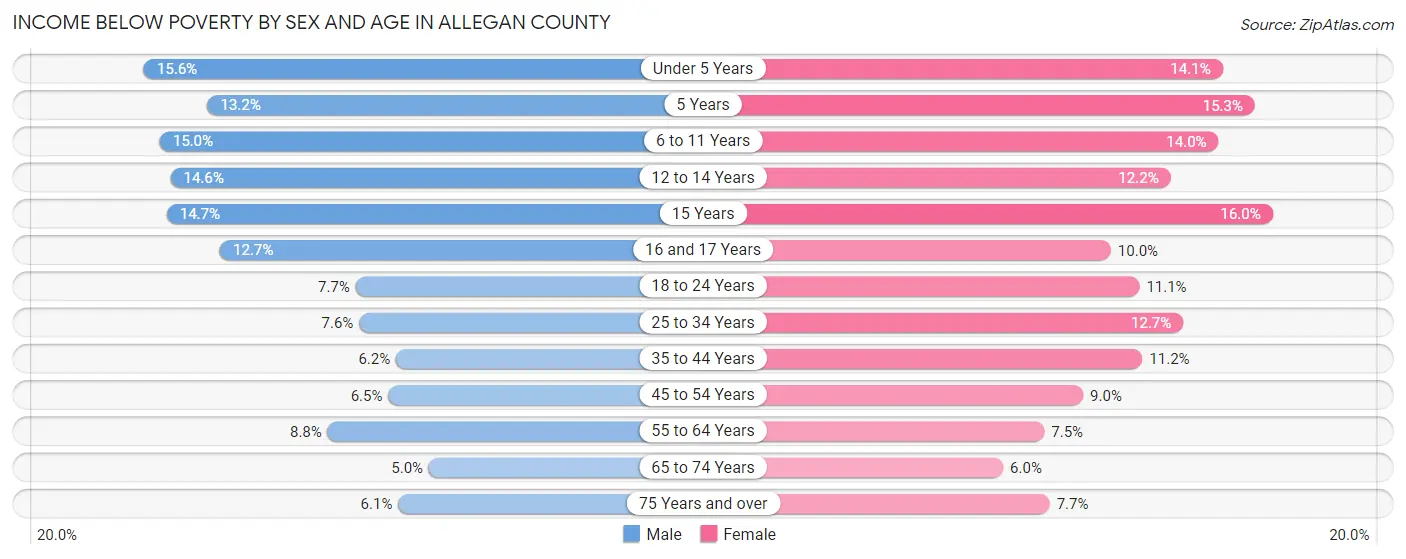
Income Below Poverty by Sex and Age in Allegan County
With 8.8% poverty level for males and 10.2% for females among the residents of Allegan County, under 5 year old males and 15 year old females are the most vulnerable to poverty, with 554 males (15.6%) and 130 females (16.0%) in their respective age groups living below the poverty level.
| Age Bracket | Male | Female |
| Under 5 Years | 554 (15.6%) | 480 (14.1%) |
| 5 Years | 112 (13.2%) | 92 (15.3%) |
| 6 to 11 Years | 689 (15.0%) | 669 (14.0%) |
| 12 to 14 Years | 407 (14.6%) | 291 (12.2%) |
| 15 Years | 112 (14.7%) | 130 (16.0%) |
| 16 and 17 Years | 223 (12.7%) | 171 (10.0%) |
| 18 to 24 Years | 385 (7.7%) | 485 (11.1%) |
| 25 to 34 Years | 542 (7.6%) | 918 (12.7%) |
| 35 to 44 Years | 462 (6.2%) | 798 (11.2%) |
| 45 to 54 Years | 496 (6.5%) | 659 (9.0%) |
| 55 to 64 Years | 763 (8.7%) | 639 (7.5%) |
| 65 to 74 Years | 314 (5.0%) | 395 (6.0%) |
| 75 Years and over | 198 (6.1%) | 323 (7.7%) |
| Total | 5,257 (8.8%) | 6,050 (10.2%) |
Income Above Poverty by Sex and Age in Allegan County
According to the poverty statistics in Allegan County, males aged 65 to 74 years and females aged 65 to 74 years are the age groups that are most secure financially, with 95.0% of males and 94.0% of females in these age groups living above the poverty line.
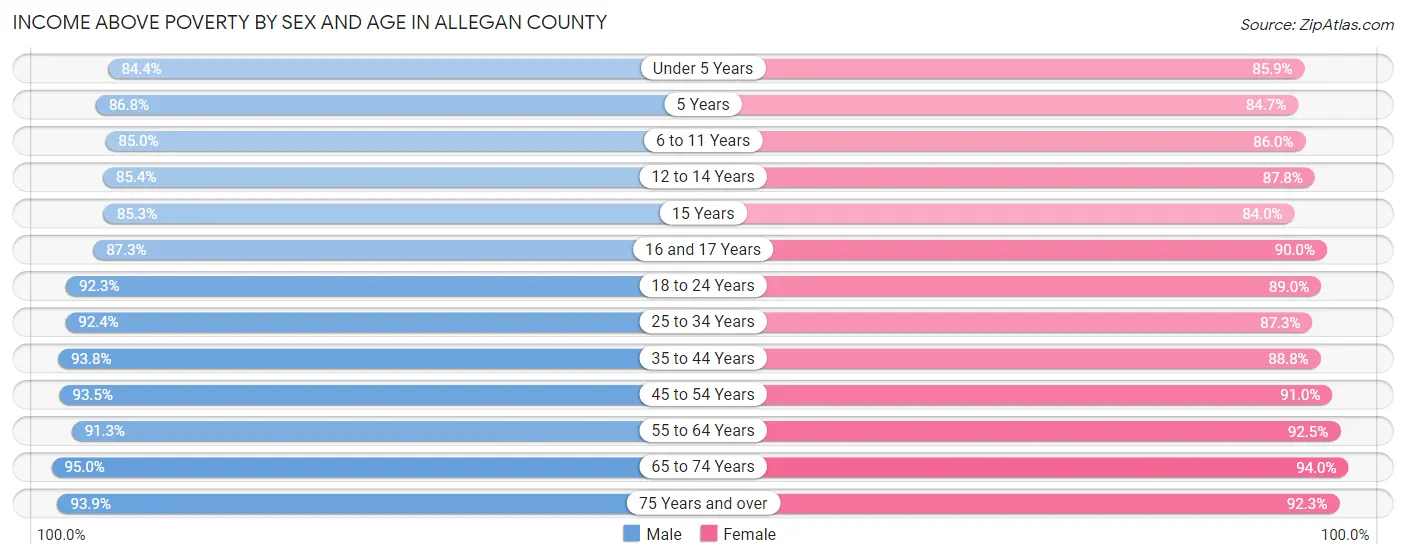
| Age Bracket | Male | Female |
| Under 5 Years | 3,003 (84.4%) | 2,918 (85.9%) |
| 5 Years | 736 (86.8%) | 508 (84.7%) |
| 6 to 11 Years | 3,910 (85.0%) | 4,116 (86.0%) |
| 12 to 14 Years | 2,384 (85.4%) | 2,095 (87.8%) |
| 15 Years | 649 (85.3%) | 683 (84.0%) |
| 16 and 17 Years | 1,528 (87.3%) | 1,540 (90.0%) |
| 18 to 24 Years | 4,606 (92.3%) | 3,904 (88.9%) |
| 25 to 34 Years | 6,608 (92.4%) | 6,327 (87.3%) |
| 35 to 44 Years | 6,978 (93.8%) | 6,351 (88.8%) |
| 45 to 54 Years | 7,137 (93.5%) | 6,692 (91.0%) |
| 55 to 64 Years | 7,960 (91.2%) | 7,863 (92.5%) |
| 65 to 74 Years | 5,980 (95.0%) | 6,202 (94.0%) |
| 75 Years and over | 3,033 (93.9%) | 3,860 (92.3%) |
| Total | 54,512 (91.2%) | 53,059 (89.8%) |
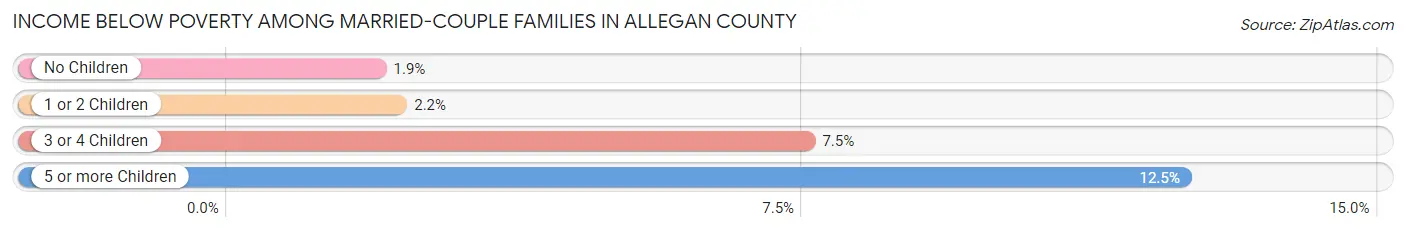
Income Below Poverty Among Married-Couple Families in Allegan County
The poverty statistics for married-couple families in Allegan County show that 2.7% or 715 of the total 26,250 families live below the poverty line. Families with 5 or more children have the highest poverty rate of 12.4%, comprising of 31 families. On the other hand, families with no children have the lowest poverty rate of 1.9%, which includes 310 families.
| Children | Above Poverty | Below Poverty |
| No Children | 15,649 (98.1%) | 310 (1.9%) |
| 1 or 2 Children | 7,033 (97.8%) | 159 (2.2%) |
| 3 or 4 Children | 2,635 (92.5%) | 215 (7.5%) |
| 5 or more Children | 218 (87.5%) | 31 (12.4%) |
| Total | 25,535 (97.3%) | 715 (2.7%) |
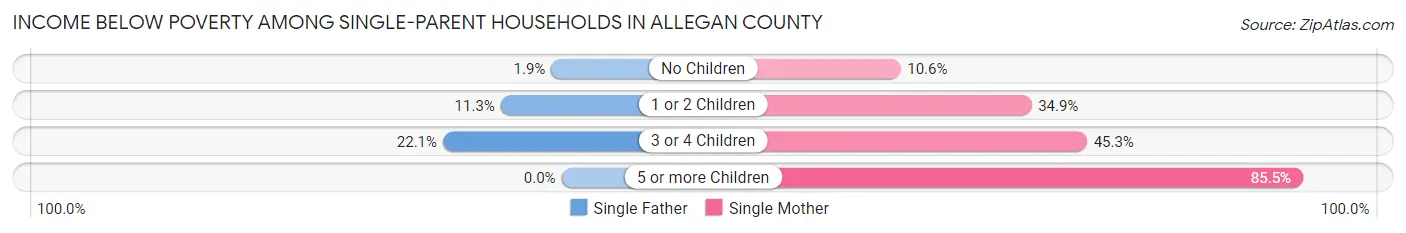
Income Below Poverty Among Single-Parent Households in Allegan County
According to the poverty data in Allegan County, 9.6% or 236 single-father households and 27.6% or 1,242 single-mother households are living below the poverty line. Among single-father households, those with 3 or 4 children have the highest poverty rate, with 76 households (22.1%) experiencing poverty. Likewise, among single-mother households, those with 5 or more children have the highest poverty rate, with 130 households (85.5%) falling below the poverty line.
| Children | Single Father | Single Mother |
| No Children | 16 (1.9%) | 192 (10.5%) |
| 1 or 2 Children | 144 (11.3%) | 767 (34.9%) |
| 3 or 4 Children | 76 (22.1%) | 153 (45.3%) |
| 5 or more Children | 0 (0.0%) | 130 (85.5%) |
| Total | 236 (9.6%) | 1,242 (27.6%) |
Income Below Poverty Among Married-Couple vs Single-Parent Households in Allegan County
The poverty data for Allegan County shows that 715 of the married-couple family households (2.7%) and 1,478 of the single-parent households (21.2%) are living below the poverty level. Within the married-couple family households, those with 5 or more children have the highest poverty rate, with 31 households (12.4%) falling below the poverty line. Among the single-parent households, those with 5 or more children have the highest poverty rate, with 130 household (78.8%) living below poverty.
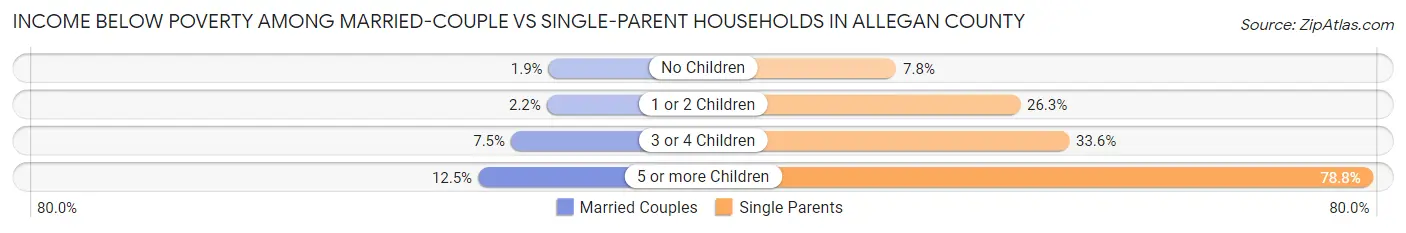
| Children | Married-Couple Families | Single-Parent Households |
| No Children | 310 (1.9%) | 208 (7.8%) |
| 1 or 2 Children | 159 (2.2%) | 911 (26.3%) |
| 3 or 4 Children | 215 (7.5%) | 229 (33.6%) |
| 5 or more Children | 31 (12.4%) | 130 (78.8%) |
| Total | 715 (2.7%) | 1,478 (21.2%) |
Employment Characteristics in Allegan County
Employment by Class of Employer in Allegan County
Among the 56,188 employed individuals in Allegan County, private company employees (41,061 | 73.1%), not-for-profit organizations (4,872 | 8.7%), and self-employed (not incorporated) (3,648 | 6.5%) make up the most common classes of employment.
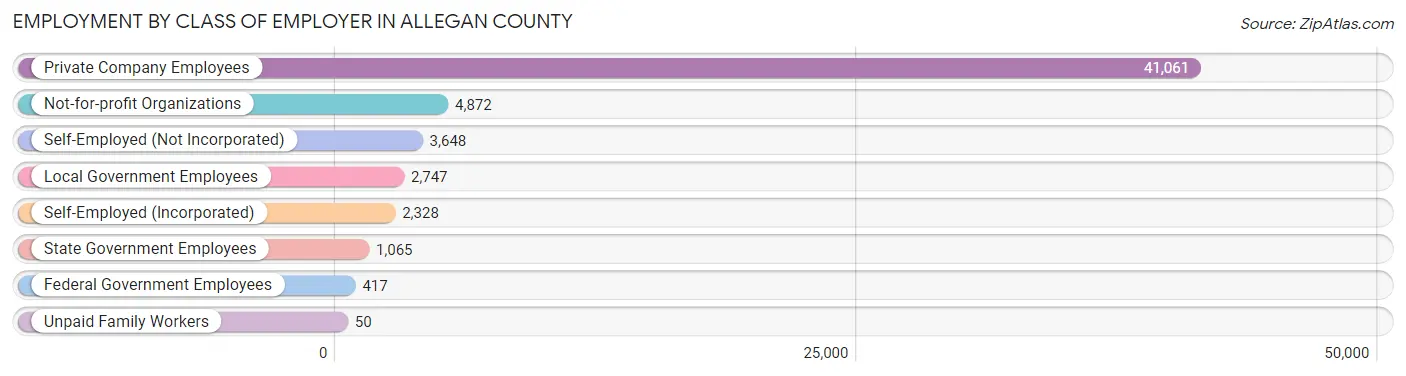
| Employer Class | # Employees | % Employees |
| Private Company Employees | 41,061 | 73.1% |
| Self-Employed (Incorporated) | 2,328 | 4.1% |
| Self-Employed (Not Incorporated) | 3,648 | 6.5% |
| Not-for-profit Organizations | 4,872 | 8.7% |
| Local Government Employees | 2,747 | 4.9% |
| State Government Employees | 1,065 | 1.9% |
| Federal Government Employees | 417 | 0.7% |
| Unpaid Family Workers | 50 | 0.1% |
| Total | 56,188 | 100.0% |
Employment Status by Age in Allegan County
According to the labor force statistics for Allegan County, out of the total population over 16 years of age (95,266), 62.0% or 59,065 individuals are in the labor force, with 3.4% or 2,008 of them unemployed. The age group with the highest labor force participation rate is 25 to 29 years, with 85.0% or 5,916 individuals in the labor force. Within the labor force, the 16 to 19 years age range has the highest percentage of unemployed individuals, with 9.1% or 238 of them being unemployed.
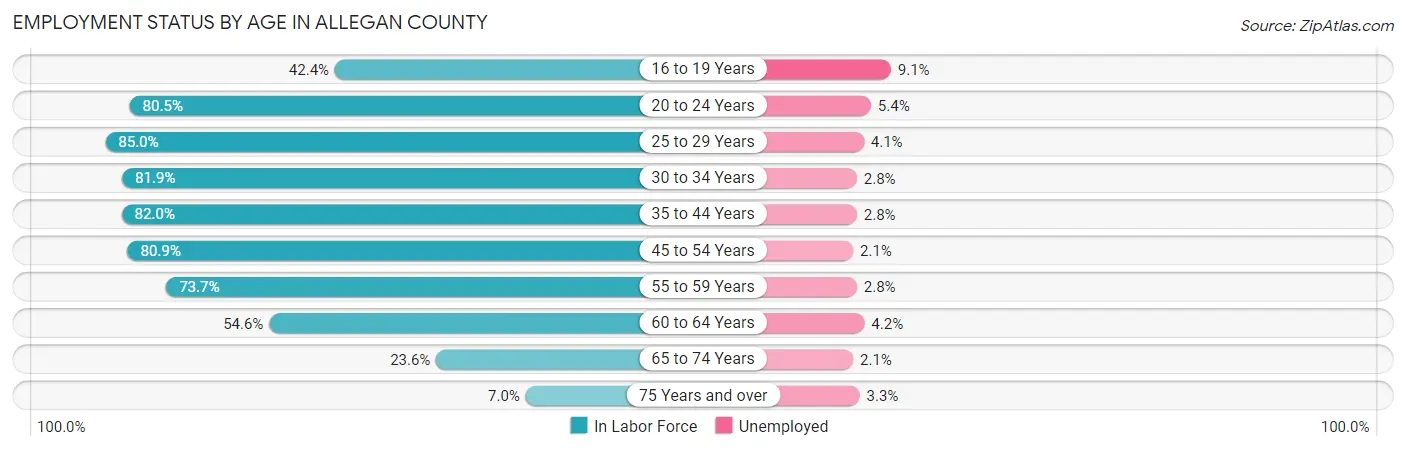
| Age Bracket | In Labor Force | Unemployed |
| 16 to 19 Years | 2,615 (42.4%) | 238 (9.1%) |
| 20 to 24 Years | 5,430 (80.5%) | 293 (5.4%) |
| 25 to 29 Years | 5,916 (85.0%) | 243 (4.1%) |
| 30 to 34 Years | 6,145 (81.9%) | 172 (2.8%) |
| 35 to 44 Years | 12,003 (82.0%) | 336 (2.8%) |
| 45 to 54 Years | 12,221 (80.9%) | 257 (2.1%) |
| 55 to 59 Years | 6,604 (73.7%) | 185 (2.8%) |
| 60 to 64 Years | 4,541 (54.6%) | 191 (4.2%) |
| 65 to 74 Years | 3,081 (23.6%) | 65 (2.1%) |
| 75 Years and over | 547 (7.0%) | 18 (3.3%) |
| Total | 59,065 (62.0%) | 2,008 (3.4%) |
Employment Status by Educational Attainment in Allegan County
According to labor force statistics for Allegan County, 77.1% of individuals (47,403) out of the total population between 25 and 64 years of age (61,483) are in the labor force, with 2.9% or 1,375 of them being unemployed. The group with the highest labor force participation rate are those with the educational attainment of bachelor's degree or higher, with 87.5% or 13,212 individuals in the labor force. Within the labor force, individuals with less than high school education have the highest percentage of unemployment, with 7.2% or 185 of them being unemployed.
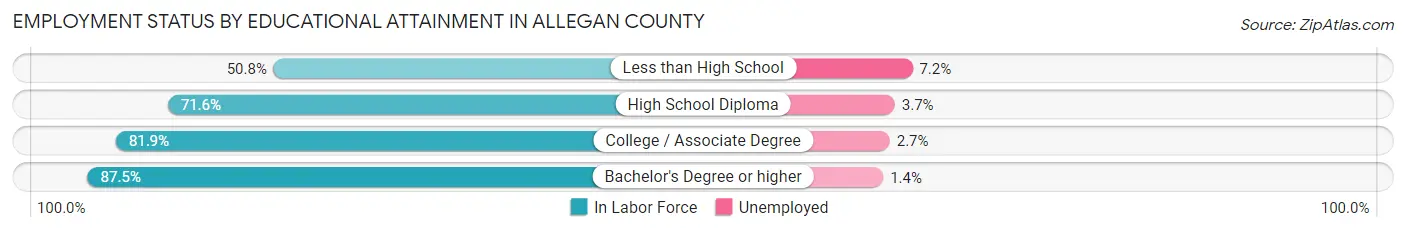
| Educational Attainment | In Labor Force | Unemployed |
| Less than High School | 2,564 (50.8%) | 363 (7.2%) |
| High School Diploma | 15,313 (71.6%) | 791 (3.7%) |
| College / Associate Degree | 16,337 (81.9%) | 539 (2.7%) |
| Bachelor's Degree or higher | 13,212 (87.5%) | 211 (1.4%) |
| Total | 47,403 (77.1%) | 1,783 (2.9%) |
Employment Occupations by Sex in Allegan County
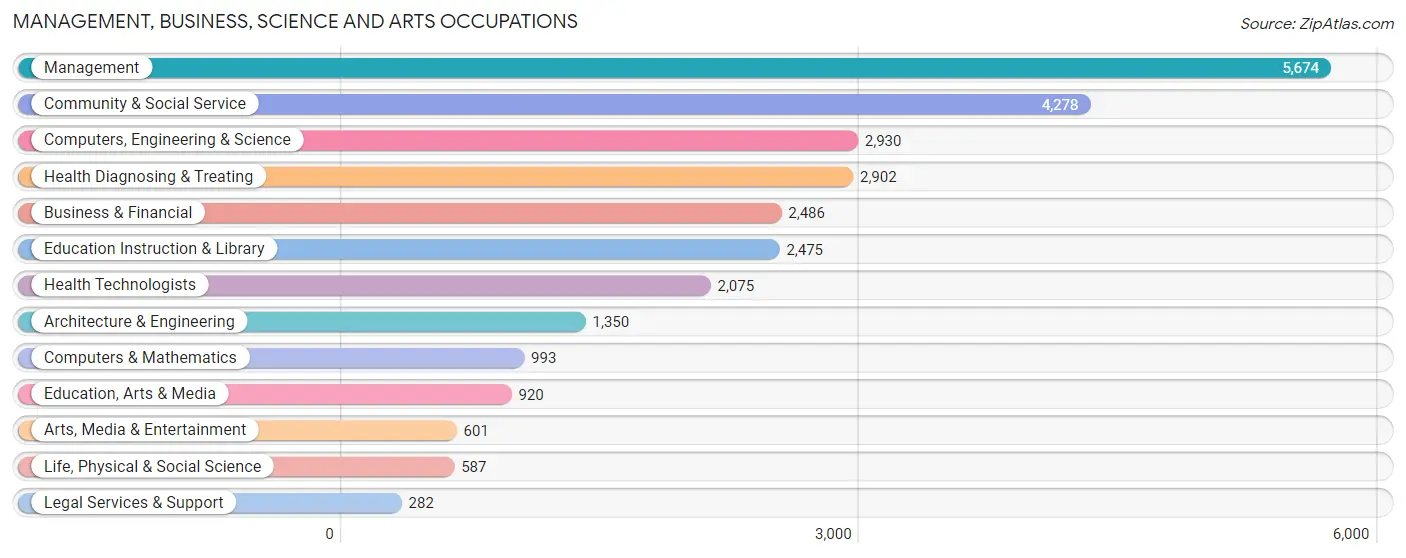
Management, Business, Science and Arts Occupations
The most common Management, Business, Science and Arts occupations in Allegan County are Management (5,674 | 10.0%), Community & Social Service (4,278 | 7.5%), Computers, Engineering & Science (2,930 | 5.1%), Health Diagnosing & Treating (2,902 | 5.1%), and Business & Financial (2,486 | 4.4%).
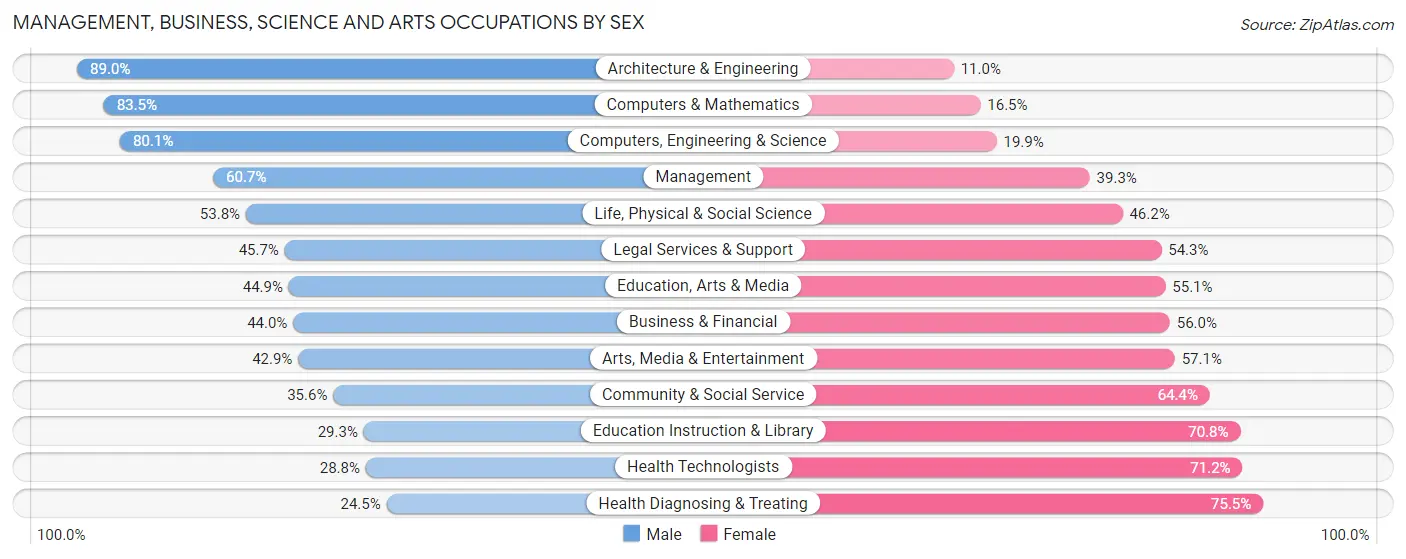
Management, Business, Science and Arts Occupations by Sex
Within the Management, Business, Science and Arts occupations in Allegan County, the most male-oriented occupations are Architecture & Engineering (89.0%), Computers & Mathematics (83.5%), and Computers, Engineering & Science (80.1%), while the most female-oriented occupations are Health Diagnosing & Treating (75.5%), Health Technologists (71.2%), and Education Instruction & Library (70.8%).
| Occupation | Male | Female |
| Management | 3,443 (60.7%) | 2,231 (39.3%) |
| Business & Financial | 1,093 (44.0%) | 1,393 (56.0%) |
| Computers, Engineering & Science | 2,347 (80.1%) | 583 (19.9%) |
| Computers & Mathematics | 829 (83.5%) | 164 (16.5%) |
| Architecture & Engineering | 1,202 (89.0%) | 148 (11.0%) |
| Life, Physical & Social Science | 316 (53.8%) | 271 (46.2%) |
| Community & Social Service | 1,524 (35.6%) | 2,754 (64.4%) |
| Education, Arts & Media | 413 (44.9%) | 507 (55.1%) |
| Legal Services & Support | 129 (45.7%) | 153 (54.3%) |
| Education Instruction & Library | 724 (29.2%) | 1,751 (70.8%) |
| Arts, Media & Entertainment | 258 (42.9%) | 343 (57.1%) |
| Health Diagnosing & Treating | 711 (24.5%) | 2,191 (75.5%) |
| Health Technologists | 598 (28.8%) | 1,477 (71.2%) |
| Total (Category) | 9,118 (49.9%) | 9,152 (50.1%) |
| Total (Overall) | 30,997 (54.3%) | 26,050 (45.7%) |
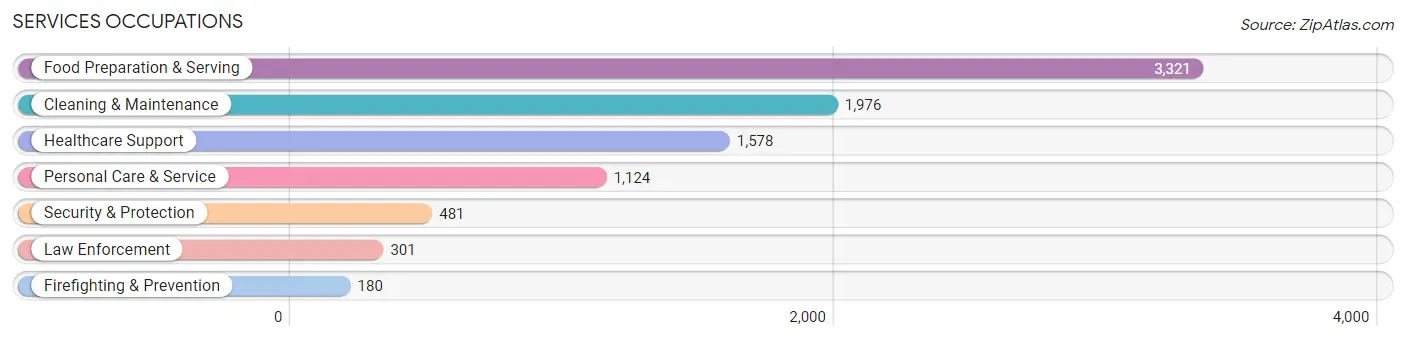
Services Occupations
The most common Services occupations in Allegan County are Food Preparation & Serving (3,321 | 5.8%), Cleaning & Maintenance (1,976 | 3.5%), Healthcare Support (1,578 | 2.8%), Personal Care & Service (1,124 | 2.0%), and Security & Protection (481 | 0.8%).
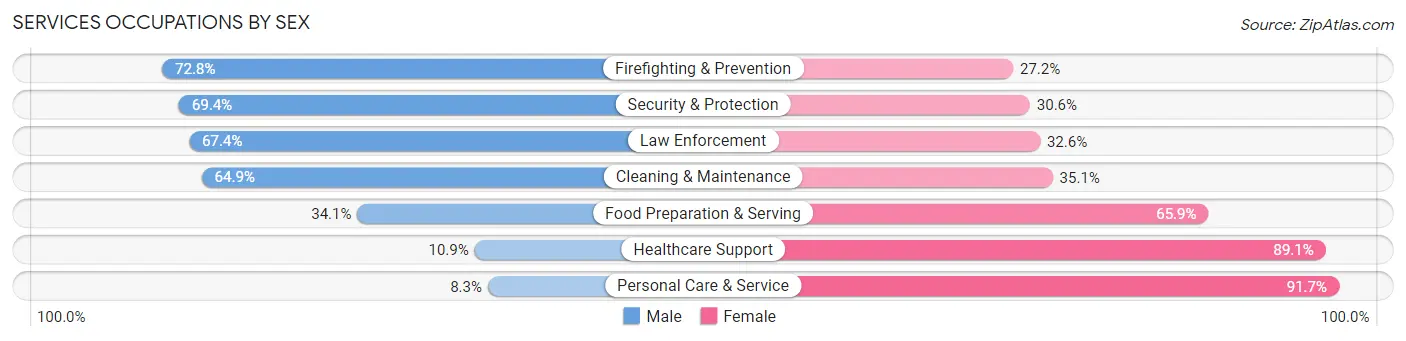
Services Occupations by Sex
Within the Services occupations in Allegan County, the most male-oriented occupations are Firefighting & Prevention (72.8%), Security & Protection (69.4%), and Law Enforcement (67.4%), while the most female-oriented occupations are Personal Care & Service (91.7%), Healthcare Support (89.1%), and Food Preparation & Serving (65.9%).
| Occupation | Male | Female |
| Healthcare Support | 172 (10.9%) | 1,406 (89.1%) |
| Security & Protection | 334 (69.4%) | 147 (30.6%) |
| Firefighting & Prevention | 131 (72.8%) | 49 (27.2%) |
| Law Enforcement | 203 (67.4%) | 98 (32.6%) |
| Food Preparation & Serving | 1,133 (34.1%) | 2,188 (65.9%) |
| Cleaning & Maintenance | 1,283 (64.9%) | 693 (35.1%) |
| Personal Care & Service | 93 (8.3%) | 1,031 (91.7%) |
| Total (Category) | 3,015 (35.5%) | 5,465 (64.4%) |
| Total (Overall) | 30,997 (54.3%) | 26,050 (45.7%) |
Sales and Office Occupations
The most common Sales and Office occupations in Allegan County are Office & Administration (6,251 | 11.0%), and Sales & Related (4,779 | 8.4%).

Sales and Office Occupations by Sex

| Occupation | Male | Female |
| Sales & Related | 2,447 (51.2%) | 2,332 (48.8%) |
| Office & Administration | 1,212 (19.4%) | 5,039 (80.6%) |
| Total (Category) | 3,659 (33.2%) | 7,371 (66.8%) |
| Total (Overall) | 30,997 (54.3%) | 26,050 (45.7%) |
Natural Resources, Construction and Maintenance Occupations
The most common Natural Resources, Construction and Maintenance occupations in Allegan County are Construction & Extraction (3,271 | 5.7%), Installation, Maintenance & Repair (2,702 | 4.7%), and Farming, Fishing & Forestry (481 | 0.8%).

Natural Resources, Construction and Maintenance Occupations by Sex
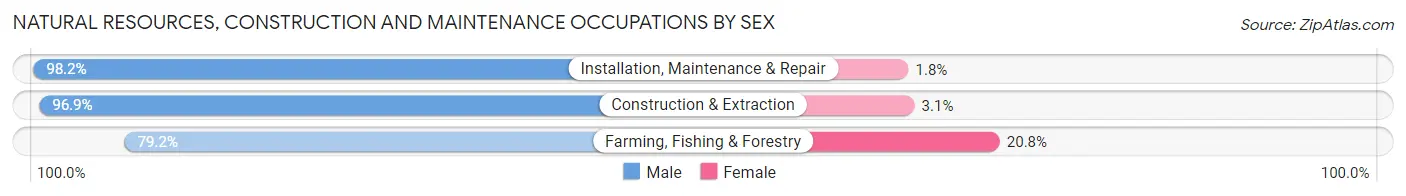
| Occupation | Male | Female |
| Farming, Fishing & Forestry | 381 (79.2%) | 100 (20.8%) |
| Construction & Extraction | 3,171 (96.9%) | 100 (3.1%) |
| Installation, Maintenance & Repair | 2,653 (98.2%) | 49 (1.8%) |
| Total (Category) | 6,205 (96.1%) | 249 (3.9%) |
| Total (Overall) | 30,997 (54.3%) | 26,050 (45.7%) |
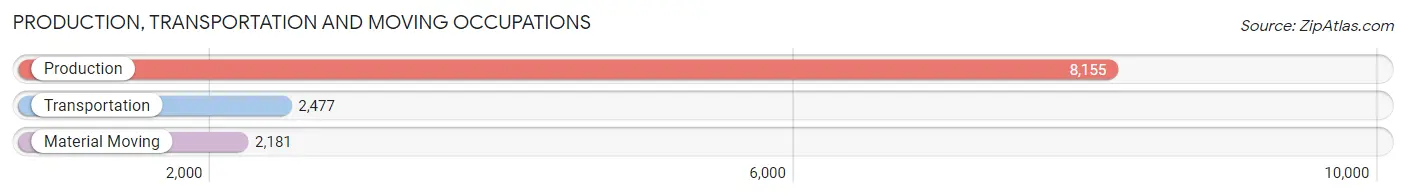
Production, Transportation and Moving Occupations
The most common Production, Transportation and Moving occupations in Allegan County are Production (8,155 | 14.3%), Transportation (2,477 | 4.3%), and Material Moving (2,181 | 3.8%).
Production, Transportation and Moving Occupations by Sex
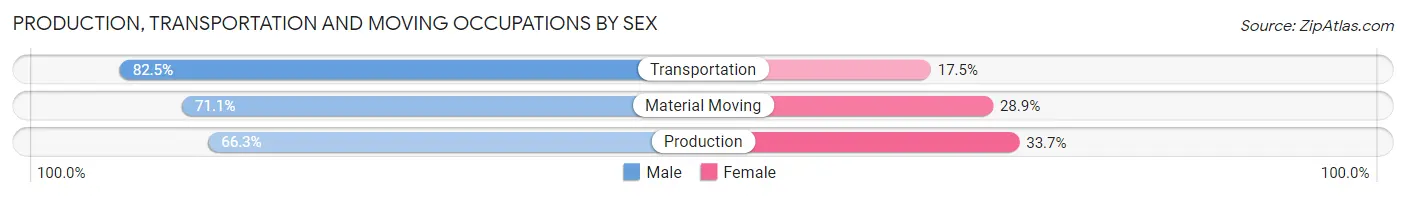
| Occupation | Male | Female |
| Production | 5,405 (66.3%) | 2,750 (33.7%) |
| Transportation | 2,044 (82.5%) | 433 (17.5%) |
| Material Moving | 1,551 (71.1%) | 630 (28.9%) |
| Total (Category) | 9,000 (70.2%) | 3,813 (29.8%) |
| Total (Overall) | 30,997 (54.3%) | 26,050 (45.7%) |
Employment Industries by Sex in Allegan County
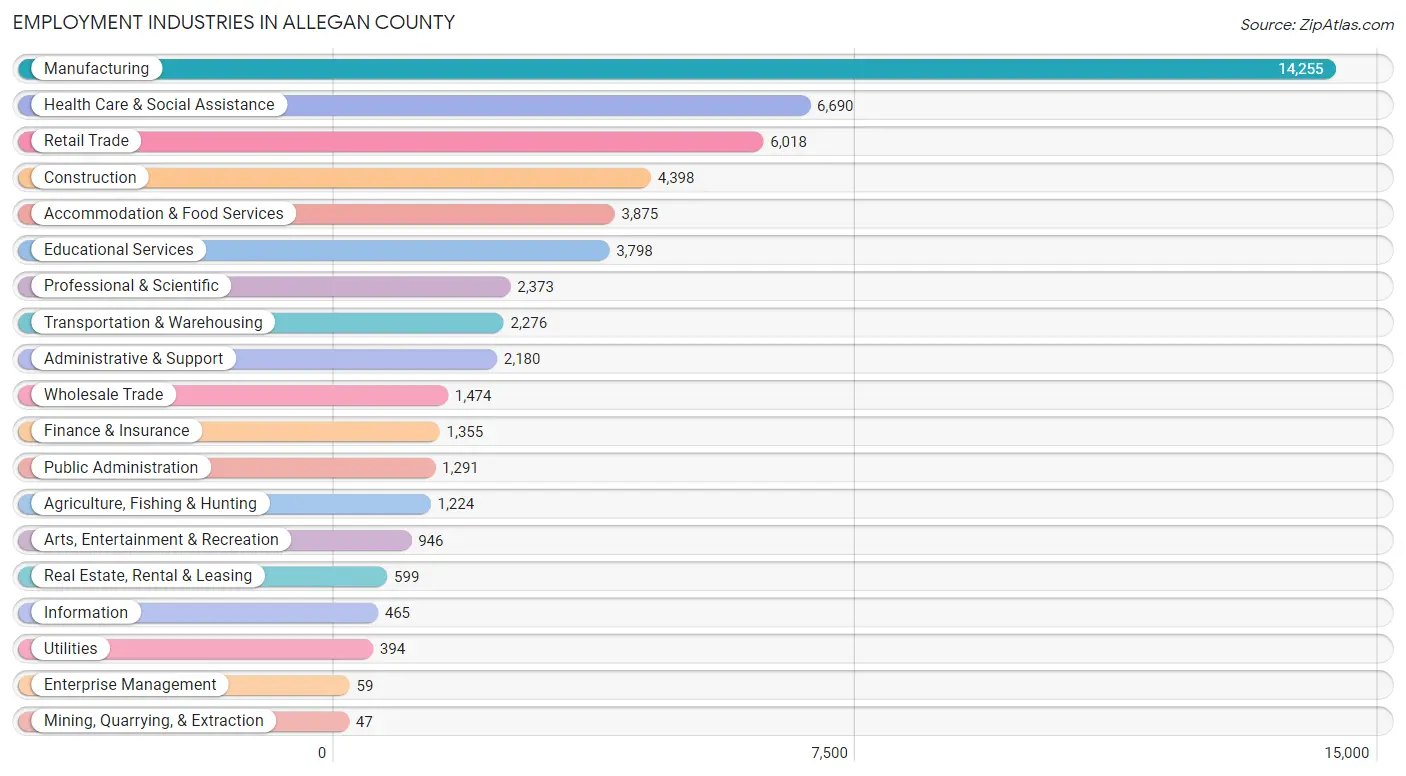
Employment Industries in Allegan County
The major employment industries in Allegan County include Manufacturing (14,255 | 25.0%), Health Care & Social Assistance (6,690 | 11.7%), Retail Trade (6,018 | 10.5%), Construction (4,398 | 7.7%), and Accommodation & Food Services (3,875 | 6.8%).
Employment Industries by Sex in Allegan County
The Allegan County industries that see more men than women are Construction (89.5%), Mining, Quarrying, & Extraction (89.4%), and Utilities (79.9%), whereas the industries that tend to have a higher number of women are Enterprise Management (100.0%), Health Care & Social Assistance (82.7%), and Finance & Insurance (76.9%).
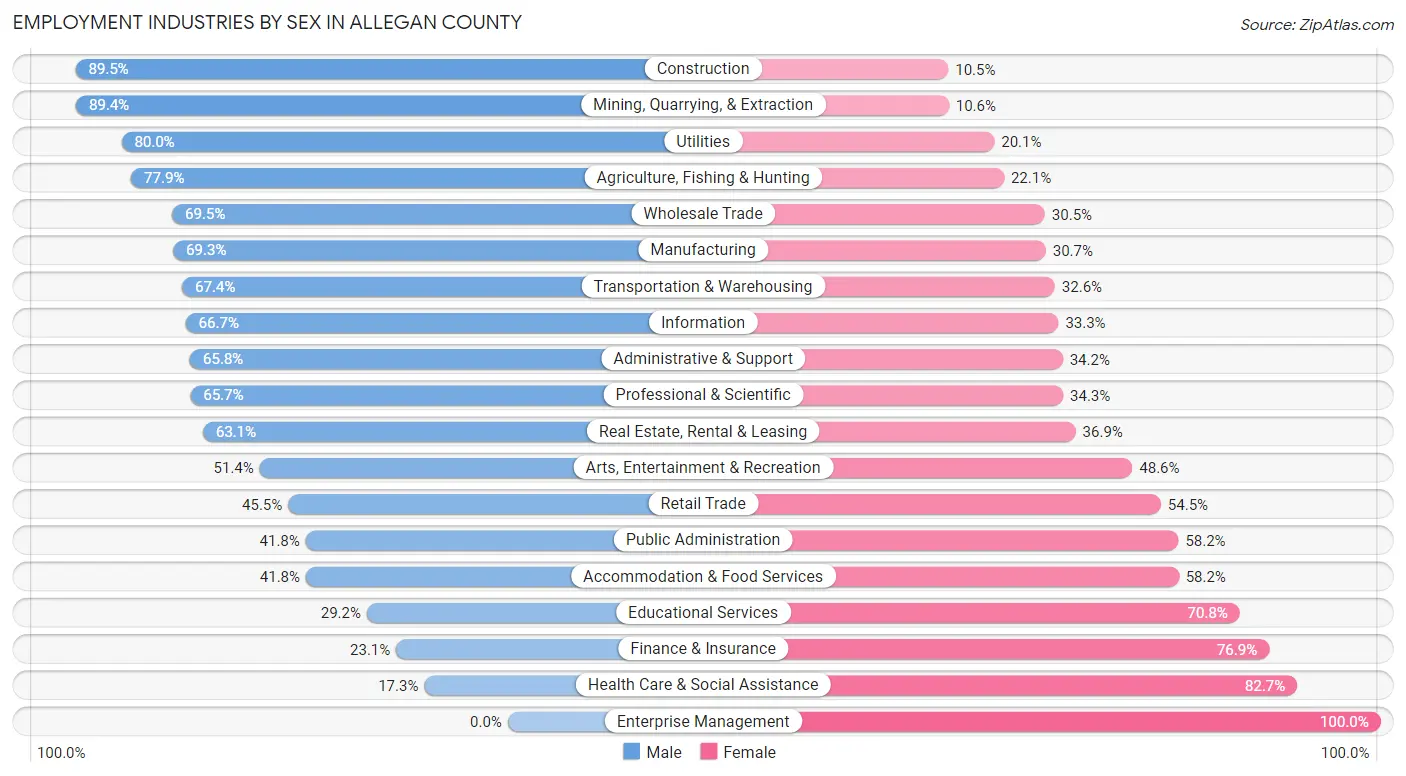
| Industry | Male | Female |
| Agriculture, Fishing & Hunting | 954 (77.9%) | 270 (22.1%) |
| Mining, Quarrying, & Extraction | 42 (89.4%) | 5 (10.6%) |
| Construction | 3,935 (89.5%) | 463 (10.5%) |
| Manufacturing | 9,876 (69.3%) | 4,379 (30.7%) |
| Wholesale Trade | 1,024 (69.5%) | 450 (30.5%) |
| Retail Trade | 2,736 (45.5%) | 3,282 (54.5%) |
| Transportation & Warehousing | 1,534 (67.4%) | 742 (32.6%) |
| Utilities | 315 (79.9%) | 79 (20.1%) |
| Information | 310 (66.7%) | 155 (33.3%) |
| Finance & Insurance | 313 (23.1%) | 1,042 (76.9%) |
| Real Estate, Rental & Leasing | 378 (63.1%) | 221 (36.9%) |
| Professional & Scientific | 1,559 (65.7%) | 814 (34.3%) |
| Enterprise Management | 0 (0.0%) | 59 (100.0%) |
| Administrative & Support | 1,434 (65.8%) | 746 (34.2%) |
| Educational Services | 1,108 (29.2%) | 2,690 (70.8%) |
| Health Care & Social Assistance | 1,156 (17.3%) | 5,534 (82.7%) |
| Arts, Entertainment & Recreation | 486 (51.4%) | 460 (48.6%) |
| Accommodation & Food Services | 1,619 (41.8%) | 2,256 (58.2%) |
| Public Administration | 540 (41.8%) | 751 (58.2%) |
| Total | 30,997 (54.3%) | 26,050 (45.7%) |
Education in Allegan County
School Enrollment in Allegan County
The most common levels of schooling among the 26,965 students in Allegan County are middle school (6,877 | 25.5%), high school (6,589 | 24.4%), and elementary school (6,150 | 22.8%).
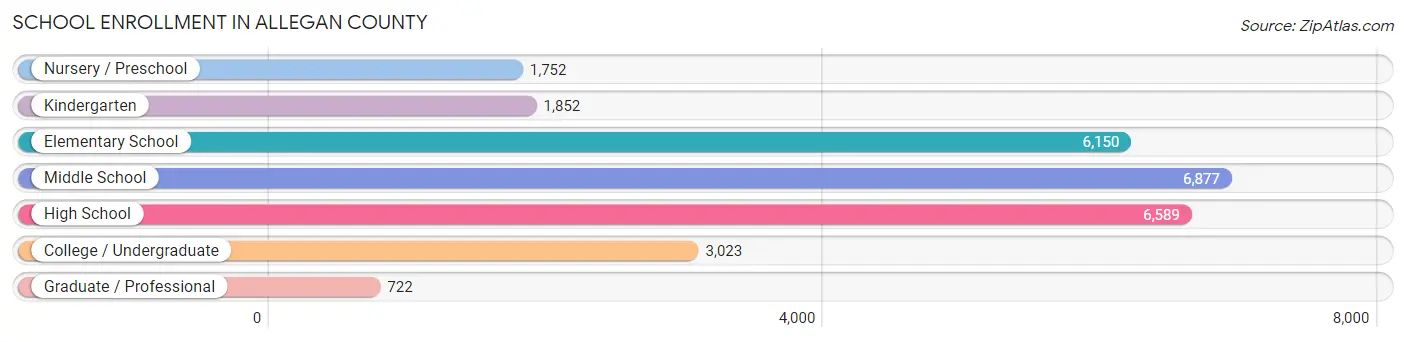
| School Level | # Students | % Students |
| Nursery / Preschool | 1,752 | 6.5% |
| Kindergarten | 1,852 | 6.9% |
| Elementary School | 6,150 | 22.8% |
| Middle School | 6,877 | 25.5% |
| High School | 6,589 | 24.4% |
| College / Undergraduate | 3,023 | 11.2% |
| Graduate / Professional | 722 | 2.7% |
| Total | 26,965 | 100.0% |
School Enrollment by Age by Funding Source in Allegan County
Out of a total of 26,965 students who are enrolled in schools in Allegan County, 4,045 (15.0%) attend a private institution, while the remaining 22,920 (85.0%) are enrolled in public schools. The age group of 35 years and over has the highest likelihood of being enrolled in private schools, with 420 (48.3% in the age bracket) enrolled. Conversely, the age group of 10 to 14 year olds has the lowest likelihood of being enrolled in a private school, with 7,491 (88.7% in the age bracket) attending a public institution.
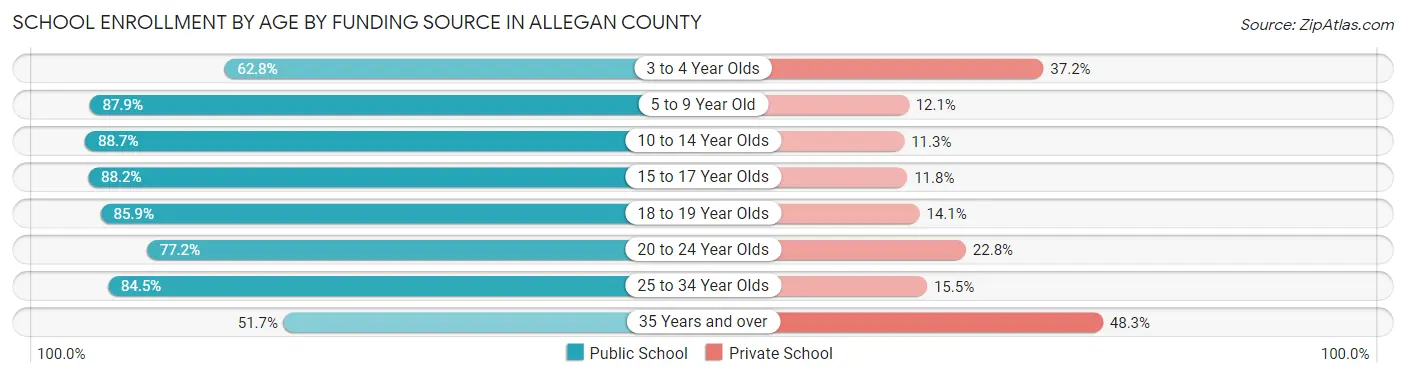
| Age Bracket | Public School | Private School |
| 3 to 4 Year Olds | 822 (62.8%) | 487 (37.2%) |
| 5 to 9 Year Old | 6,622 (87.9%) | 912 (12.1%) |
| 10 to 14 Year Olds | 7,491 (88.7%) | 952 (11.3%) |
| 15 to 17 Year Olds | 4,325 (88.2%) | 581 (11.8%) |
| 18 to 19 Year Olds | 1,348 (85.9%) | 222 (14.1%) |
| 20 to 24 Year Olds | 1,160 (77.2%) | 342 (22.8%) |
| 25 to 34 Year Olds | 702 (84.5%) | 129 (15.5%) |
| 35 Years and over | 450 (51.7%) | 420 (48.3%) |
| Total | 22,920 (85.0%) | 4,045 (15.0%) |
Educational Attainment by Field of Study in Allegan County
Business (4,499 | 20.7%), education (3,228 | 14.8%), science & technology (2,488 | 11.4%), arts & humanities (2,010 | 9.2%), and engineering (1,300 | 6.0%) are the most common fields of study among 21,771 individuals in Allegan County who have obtained a bachelor's degree or higher.
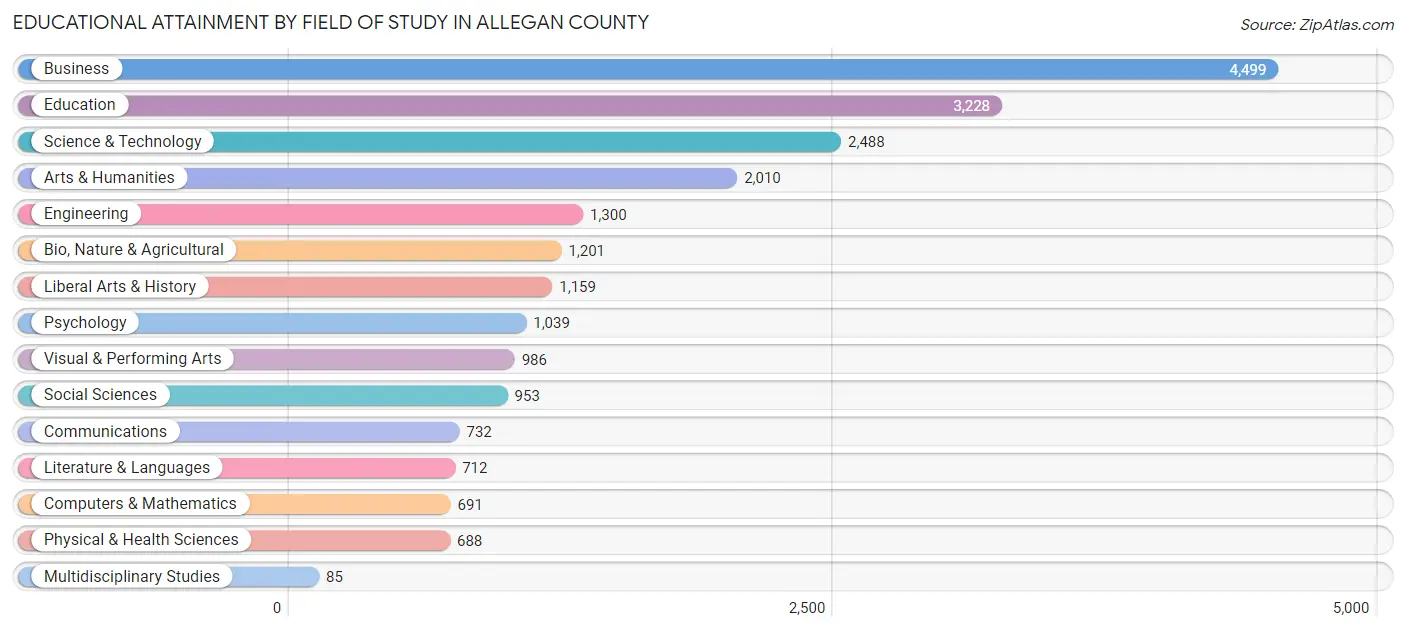
| Field of Study | # Graduates | % Graduates |
| Computers & Mathematics | 691 | 3.2% |
| Bio, Nature & Agricultural | 1,201 | 5.5% |
| Physical & Health Sciences | 688 | 3.2% |
| Psychology | 1,039 | 4.8% |
| Social Sciences | 953 | 4.4% |
| Engineering | 1,300 | 6.0% |
| Multidisciplinary Studies | 85 | 0.4% |
| Science & Technology | 2,488 | 11.4% |
| Business | 4,499 | 20.7% |
| Education | 3,228 | 14.8% |
| Literature & Languages | 712 | 3.3% |
| Liberal Arts & History | 1,159 | 5.3% |
| Visual & Performing Arts | 986 | 4.5% |
| Communications | 732 | 3.4% |
| Arts & Humanities | 2,010 | 9.2% |
| Total | 21,771 | 100.0% |
Transportation & Commute in Allegan County
Vehicle Availability by Sex in Allegan County
The most prevalent vehicle ownership categories in Allegan County are males with 2 vehicles (13,791, accounting for 45.0%) and females with 2 vehicles (10,431, making up 54.4%).
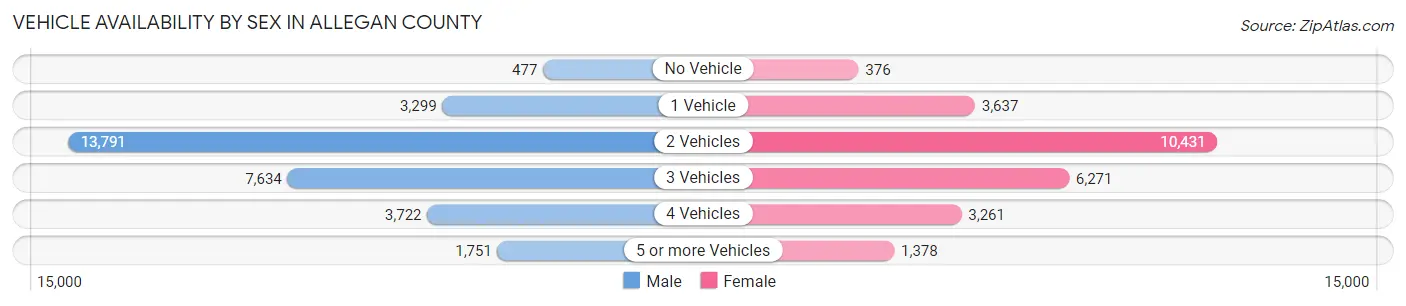
| Vehicles Available | Male | Female |
| No Vehicle | 477 (1.6%) | 376 (1.5%) |
| 1 Vehicle | 3,299 (10.8%) | 3,637 (14.3%) |
| 2 Vehicles | 13,791 (45.0%) | 10,431 (41.1%) |
| 3 Vehicles | 7,634 (24.9%) | 6,271 (24.7%) |
| 4 Vehicles | 3,722 (12.1%) | 3,261 (12.9%) |
| 5 or more Vehicles | 1,751 (5.7%) | 1,378 (5.4%) |
| Total | 30,674 (100.0%) | 25,354 (100.0%) |
Commute Time in Allegan County
The most frequently occuring commute durations in Allegan County are 20 to 24 minutes (9,630 commuters, 18.5%), 30 to 34 minutes (7,610 commuters, 14.6%), and 10 to 14 minutes (7,076 commuters, 13.6%).
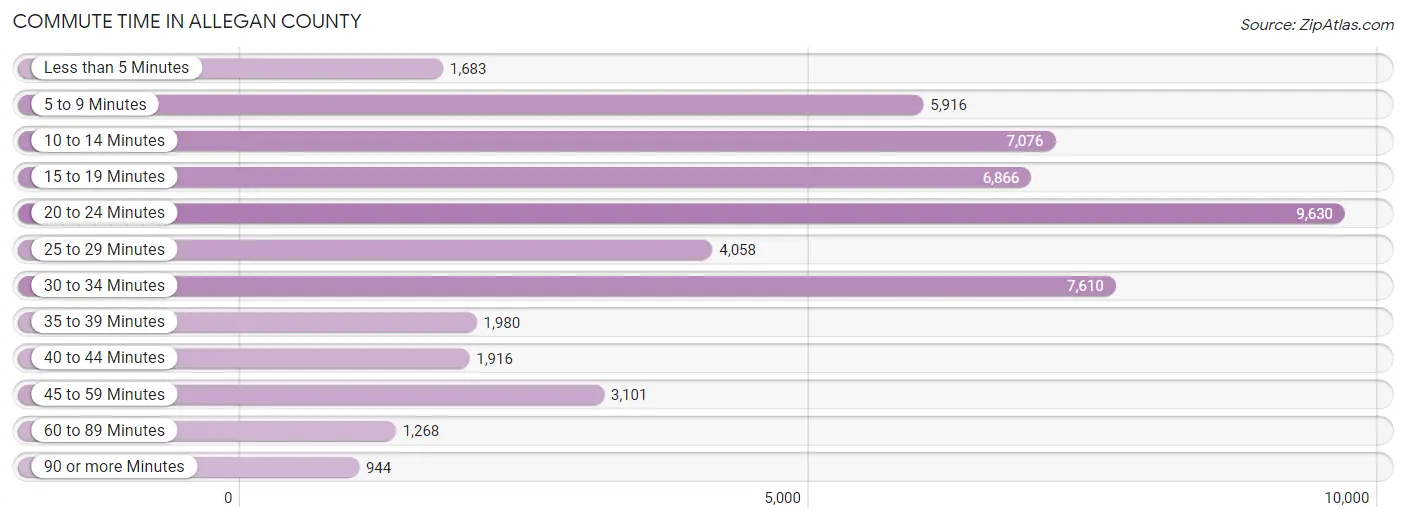
| Commute Time | # Commuters | % Commuters |
| Less than 5 Minutes | 1,683 | 3.2% |
| 5 to 9 Minutes | 5,916 | 11.4% |
| 10 to 14 Minutes | 7,076 | 13.6% |
| 15 to 19 Minutes | 6,866 | 13.2% |
| 20 to 24 Minutes | 9,630 | 18.5% |
| 25 to 29 Minutes | 4,058 | 7.8% |
| 30 to 34 Minutes | 7,610 | 14.6% |
| 35 to 39 Minutes | 1,980 | 3.8% |
| 40 to 44 Minutes | 1,916 | 3.7% |
| 45 to 59 Minutes | 3,101 | 6.0% |
| 60 to 89 Minutes | 1,268 | 2.4% |
| 90 or more Minutes | 944 | 1.8% |
Commute Time by Sex in Allegan County
The most common commute times in Allegan County are 20 to 24 minutes (5,397 commuters, 18.8%) for males and 20 to 24 minutes (4,233 commuters, 18.2%) for females.
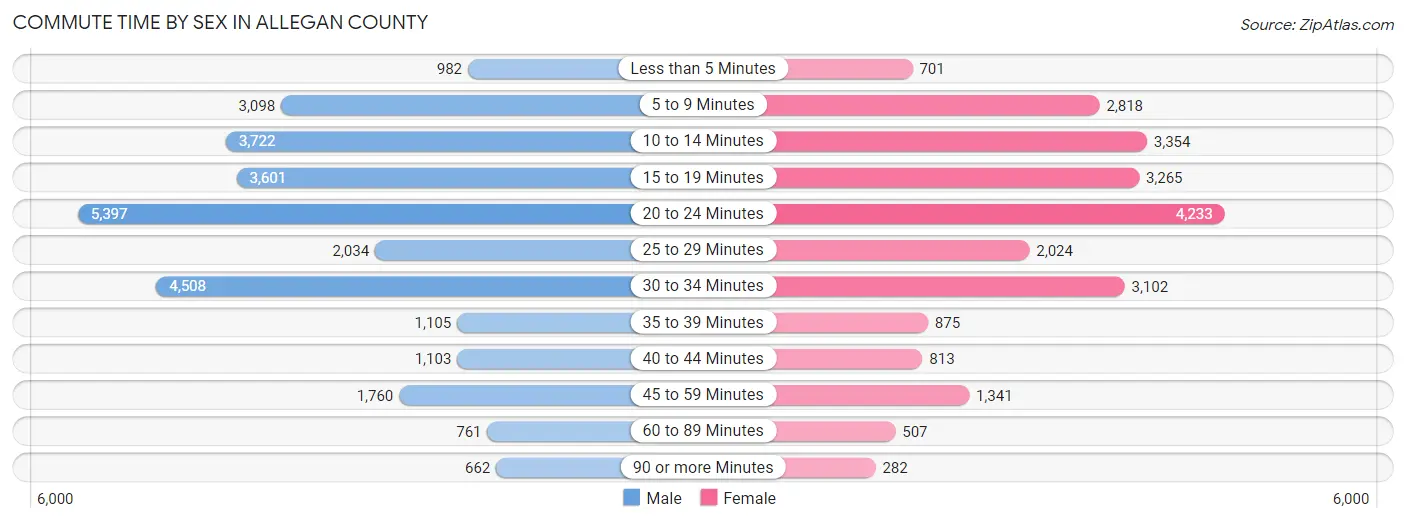
| Commute Time | Male | Female |
| Less than 5 Minutes | 982 (3.4%) | 701 (3.0%) |
| 5 to 9 Minutes | 3,098 (10.8%) | 2,818 (12.1%) |
| 10 to 14 Minutes | 3,722 (13.0%) | 3,354 (14.4%) |
| 15 to 19 Minutes | 3,601 (12.5%) | 3,265 (14.0%) |
| 20 to 24 Minutes | 5,397 (18.8%) | 4,233 (18.2%) |
| 25 to 29 Minutes | 2,034 (7.1%) | 2,024 (8.7%) |
| 30 to 34 Minutes | 4,508 (15.7%) | 3,102 (13.3%) |
| 35 to 39 Minutes | 1,105 (3.8%) | 875 (3.7%) |
| 40 to 44 Minutes | 1,103 (3.8%) | 813 (3.5%) |
| 45 to 59 Minutes | 1,760 (6.1%) | 1,341 (5.8%) |
| 60 to 89 Minutes | 761 (2.6%) | 507 (2.2%) |
| 90 or more Minutes | 662 (2.3%) | 282 (1.2%) |
Time of Departure to Work by Sex in Allegan County
The most frequent times of departure to work in Allegan County are 6:00 AM to 6:29 AM (4,612, 16.1%) for males and 7:00 AM to 7:29 AM (4,229, 18.1%) for females.
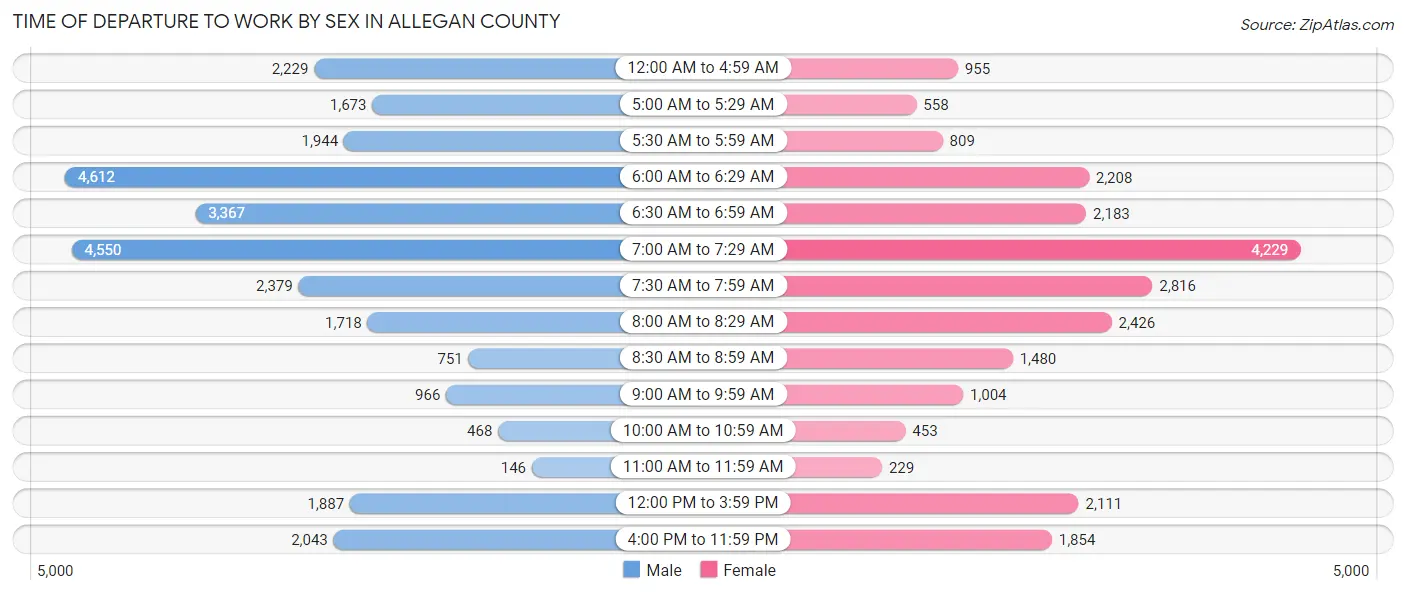
| Time of Departure | Male | Female |
| 12:00 AM to 4:59 AM | 2,229 (7.8%) | 955 (4.1%) |
| 5:00 AM to 5:29 AM | 1,673 (5.8%) | 558 (2.4%) |
| 5:30 AM to 5:59 AM | 1,944 (6.8%) | 809 (3.5%) |
| 6:00 AM to 6:29 AM | 4,612 (16.1%) | 2,208 (9.5%) |
| 6:30 AM to 6:59 AM | 3,367 (11.7%) | 2,183 (9.4%) |
| 7:00 AM to 7:29 AM | 4,550 (15.8%) | 4,229 (18.1%) |
| 7:30 AM to 7:59 AM | 2,379 (8.3%) | 2,816 (12.1%) |
| 8:00 AM to 8:29 AM | 1,718 (6.0%) | 2,426 (10.4%) |
| 8:30 AM to 8:59 AM | 751 (2.6%) | 1,480 (6.4%) |
| 9:00 AM to 9:59 AM | 966 (3.4%) | 1,004 (4.3%) |
| 10:00 AM to 10:59 AM | 468 (1.6%) | 453 (1.9%) |
| 11:00 AM to 11:59 AM | 146 (0.5%) | 229 (1.0%) |
| 12:00 PM to 3:59 PM | 1,887 (6.6%) | 2,111 (9.0%) |
| 4:00 PM to 11:59 PM | 2,043 (7.1%) | 1,854 (8.0%) |
| Total | 28,733 (100.0%) | 23,315 (100.0%) |
Housing Occupancy in Allegan County
Occupancy by Ownership in Allegan County
Of the total 44,621 dwellings in Allegan County, owner-occupied units account for 37,991 (85.1%), while renter-occupied units make up 6,630 (14.9%).
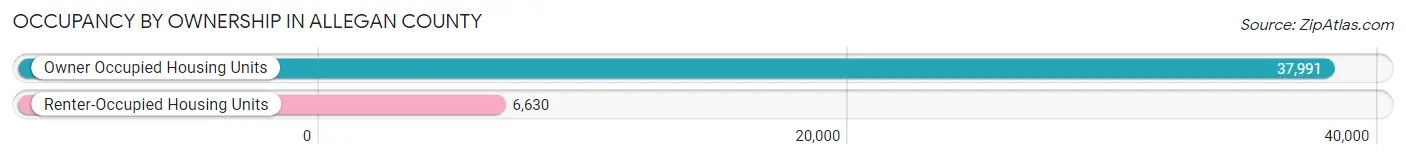
| Occupancy | # Housing Units | % Housing Units |
| Owner Occupied Housing Units | 37,991 | 85.1% |
| Renter-Occupied Housing Units | 6,630 | 14.9% |
| Total Occupied Housing Units | 44,621 | 100.0% |
Occupancy by Household Size in Allegan County
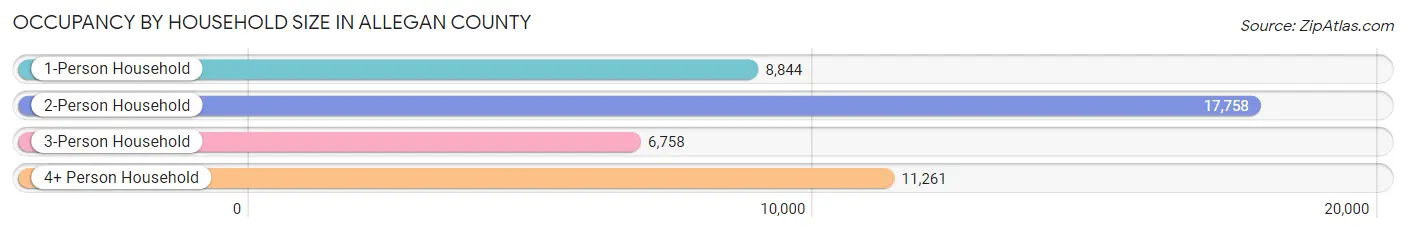
| Household Size | # Housing Units | % Housing Units |
| 1-Person Household | 8,844 | 19.8% |
| 2-Person Household | 17,758 | 39.8% |
| 3-Person Household | 6,758 | 15.1% |
| 4+ Person Household | 11,261 | 25.2% |
| Total Housing Units | 44,621 | 100.0% |
Occupancy by Ownership by Household Size in Allegan County
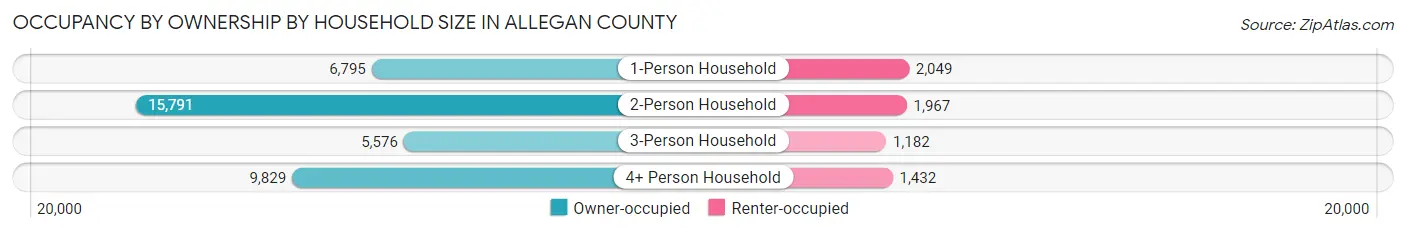
| Household Size | Owner-occupied | Renter-occupied |
| 1-Person Household | 6,795 (76.8%) | 2,049 (23.2%) |
| 2-Person Household | 15,791 (88.9%) | 1,967 (11.1%) |
| 3-Person Household | 5,576 (82.5%) | 1,182 (17.5%) |
| 4+ Person Household | 9,829 (87.3%) | 1,432 (12.7%) |
| Total Housing Units | 37,991 (85.1%) | 6,630 (14.9%) |
Occupancy by Educational Attainment in Allegan County
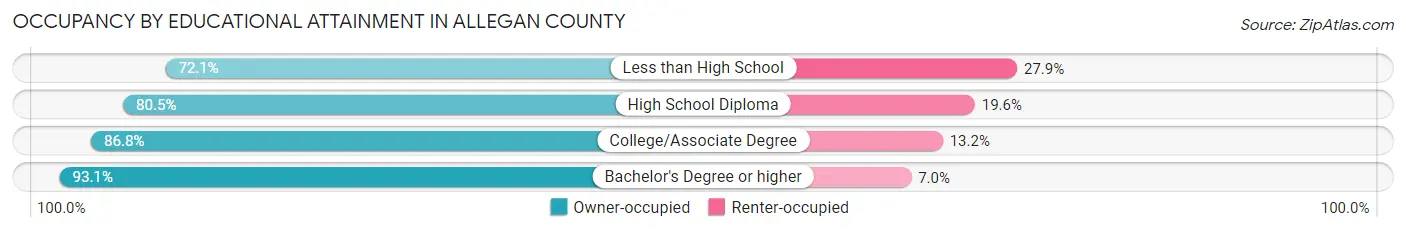
| Household Size | Owner-occupied | Renter-occupied |
| Less than High School | 2,457 (72.1%) | 952 (27.9%) |
| High School Diploma | 12,026 (80.4%) | 2,922 (19.6%) |
| College/Associate Degree | 12,922 (86.8%) | 1,965 (13.2%) |
| Bachelor's Degree or higher | 10,586 (93.0%) | 791 (7.0%) |
Occupancy by Age of Householder in Allegan County
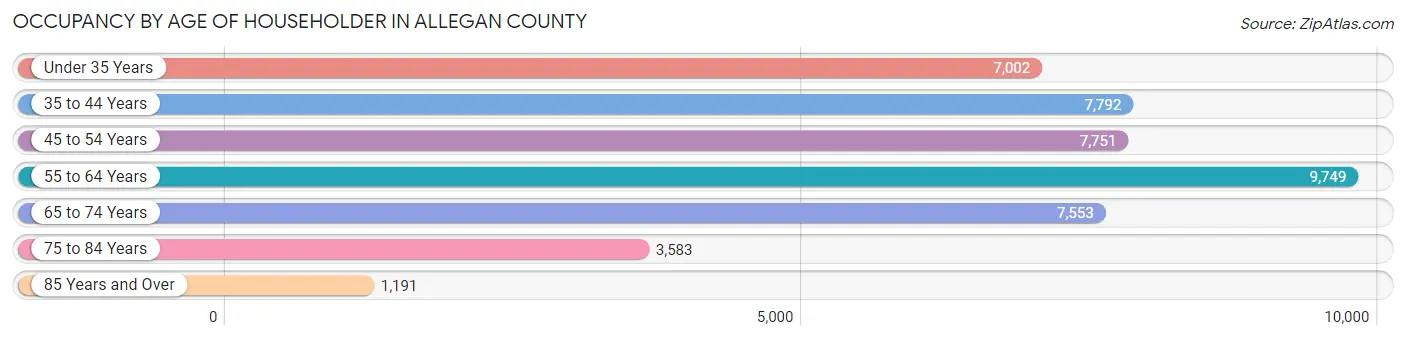
| Age Bracket | # Households | % Households |
| Under 35 Years | 7,002 | 15.7% |
| 35 to 44 Years | 7,792 | 17.5% |
| 45 to 54 Years | 7,751 | 17.4% |
| 55 to 64 Years | 9,749 | 21.8% |
| 65 to 74 Years | 7,553 | 16.9% |
| 75 to 84 Years | 3,583 | 8.0% |
| 85 Years and Over | 1,191 | 2.7% |
| Total | 44,621 | 100.0% |
Housing Finances in Allegan County
Median Income by Occupancy in Allegan County
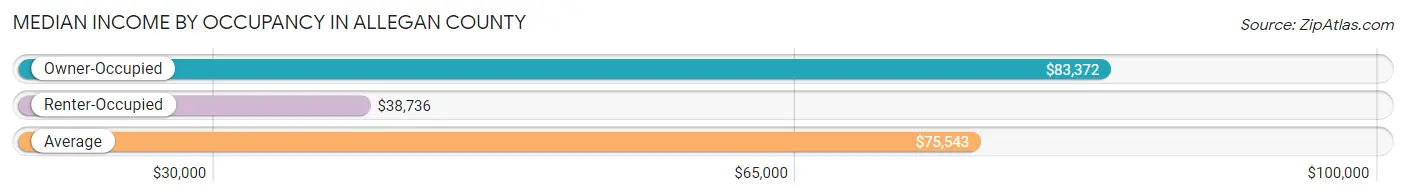
| Occupancy Type | # Households | Median Income |
| Owner-Occupied | 37,991 (85.1%) | $83,372 |
| Renter-Occupied | 6,630 (14.9%) | $38,736 |
| Average | 44,621 (100.0%) | $75,543 |
Occupancy by Householder Income Bracket in Allegan County
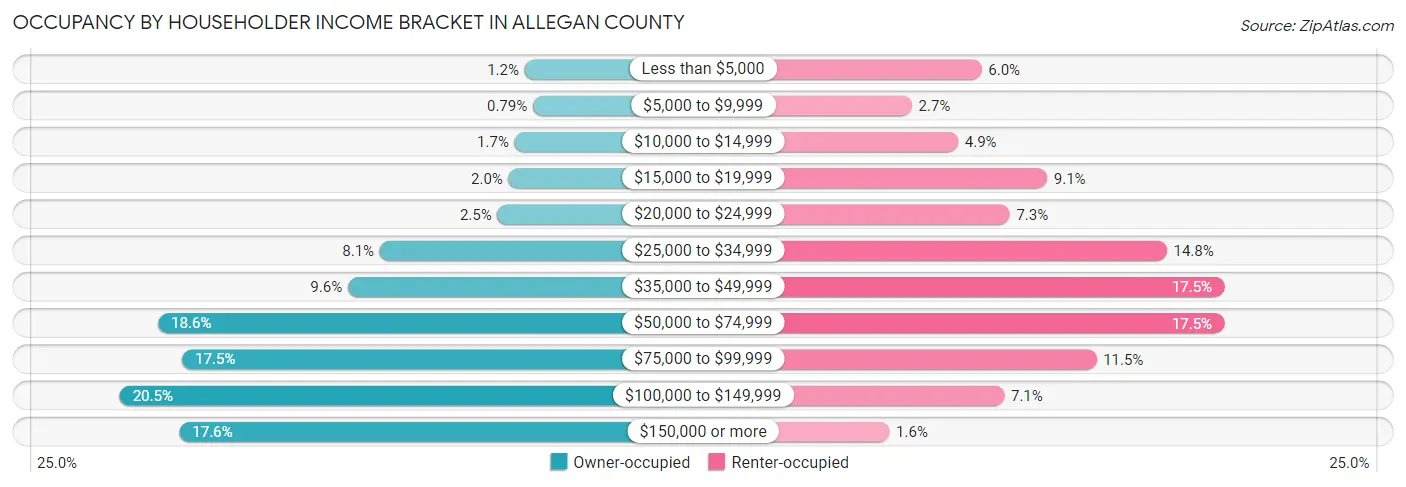
| Income Bracket | Owner-occupied | Renter-occupied |
| Less than $5,000 | 450 (1.2%) | 397 (6.0%) |
| $5,000 to $9,999 | 301 (0.8%) | 177 (2.7%) |
| $10,000 to $14,999 | 632 (1.7%) | 323 (4.9%) |
| $15,000 to $19,999 | 741 (1.9%) | 604 (9.1%) |
| $20,000 to $24,999 | 942 (2.5%) | 486 (7.3%) |
| $25,000 to $34,999 | 3,069 (8.1%) | 982 (14.8%) |
| $35,000 to $49,999 | 3,649 (9.6%) | 1,163 (17.5%) |
| $50,000 to $74,999 | 7,083 (18.6%) | 1,163 (17.5%) |
| $75,000 to $99,999 | 6,650 (17.5%) | 760 (11.5%) |
| $100,000 to $149,999 | 7,776 (20.5%) | 469 (7.1%) |
| $150,000 or more | 6,698 (17.6%) | 106 (1.6%) |
| Total | 37,991 (100.0%) | 6,630 (100.0%) |
Monthly Housing Cost Tiers in Allegan County
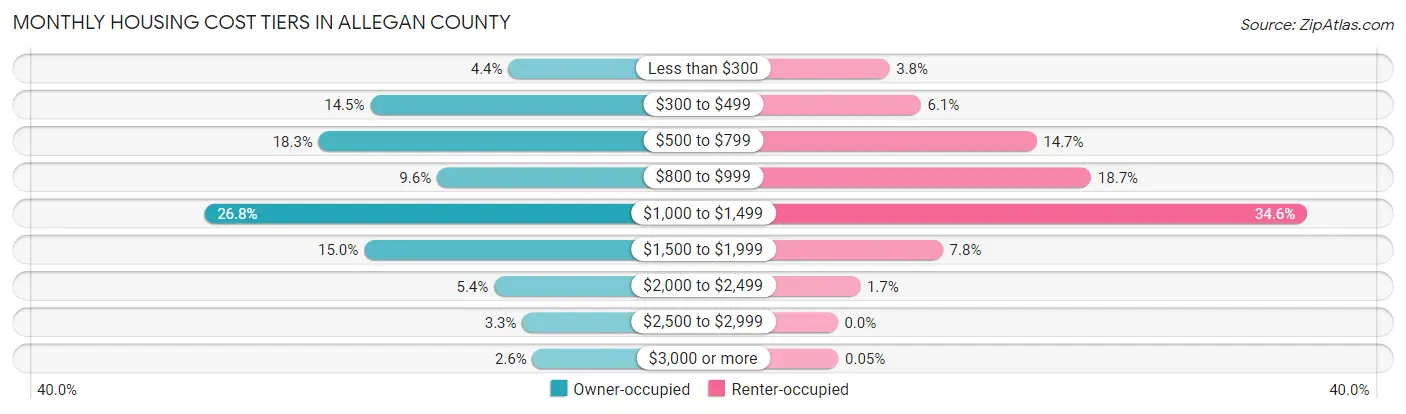
| Monthly Cost | Owner-occupied | Renter-occupied |
| Less than $300 | 1,662 (4.4%) | 253 (3.8%) |
| $300 to $499 | 5,524 (14.5%) | 406 (6.1%) |
| $500 to $799 | 6,967 (18.3%) | 971 (14.6%) |
| $800 to $999 | 3,657 (9.6%) | 1,238 (18.7%) |
| $1,000 to $1,499 | 10,170 (26.8%) | 2,293 (34.6%) |
| $1,500 to $1,999 | 5,700 (15.0%) | 514 (7.7%) |
| $2,000 to $2,499 | 2,058 (5.4%) | 110 (1.7%) |
| $2,500 to $2,999 | 1,268 (3.3%) | 0 (0.0%) |
| $3,000 or more | 985 (2.6%) | 3 (0.1%) |
| Total | 37,991 (100.0%) | 6,630 (100.0%) |
Physical Housing Characteristics in Allegan County
Housing Structures in Allegan County
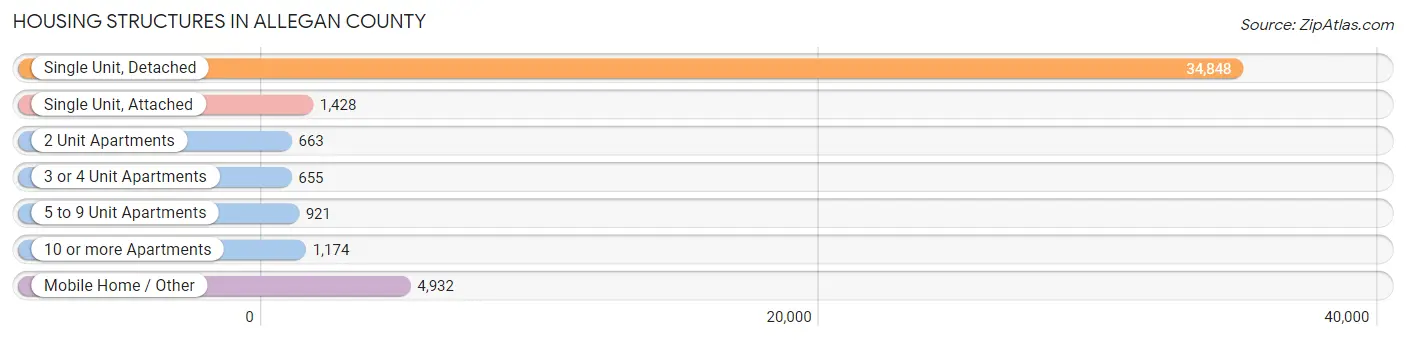
| Structure Type | # Housing Units | % Housing Units |
| Single Unit, Detached | 34,848 | 78.1% |
| Single Unit, Attached | 1,428 | 3.2% |
| 2 Unit Apartments | 663 | 1.5% |
| 3 or 4 Unit Apartments | 655 | 1.5% |
| 5 to 9 Unit Apartments | 921 | 2.1% |
| 10 or more Apartments | 1,174 | 2.6% |
| Mobile Home / Other | 4,932 | 11.1% |
| Total | 44,621 | 100.0% |
Housing Structures by Occupancy in Allegan County
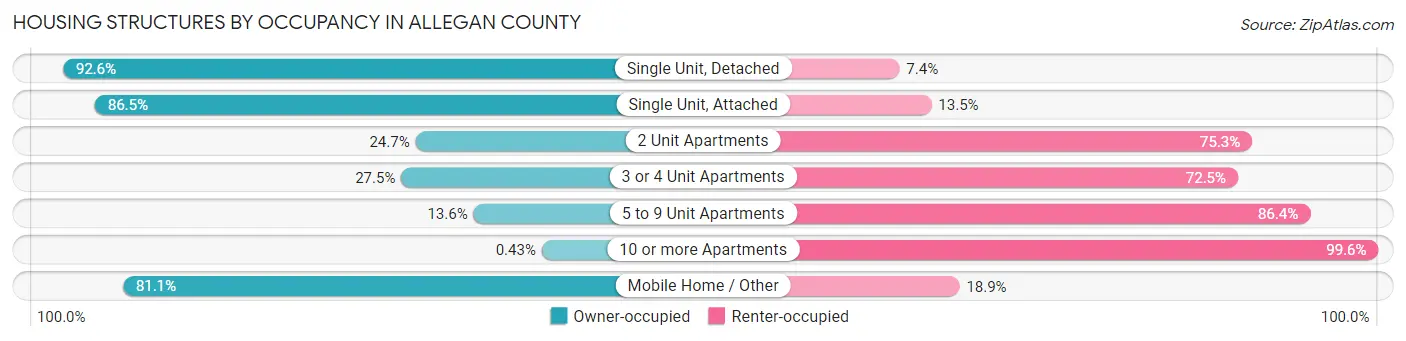
| Structure Type | Owner-occupied | Renter-occupied |
| Single Unit, Detached | 32,283 (92.6%) | 2,565 (7.4%) |
| Single Unit, Attached | 1,235 (86.5%) | 193 (13.5%) |
| 2 Unit Apartments | 164 (24.7%) | 499 (75.3%) |
| 3 or 4 Unit Apartments | 180 (27.5%) | 475 (72.5%) |
| 5 to 9 Unit Apartments | 125 (13.6%) | 796 (86.4%) |
| 10 or more Apartments | 5 (0.4%) | 1,169 (99.6%) |
| Mobile Home / Other | 3,999 (81.1%) | 933 (18.9%) |
| Total | 37,991 (85.1%) | 6,630 (14.9%) |
Housing Structures by Number of Rooms in Allegan County
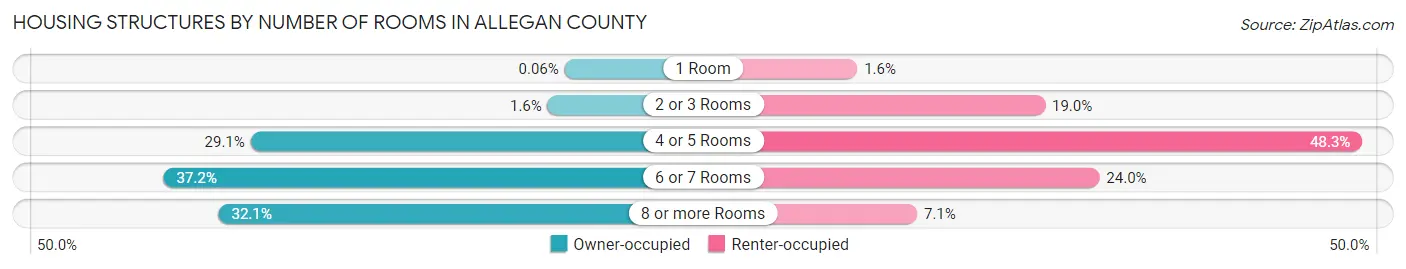
| Number of Rooms | Owner-occupied | Renter-occupied |
| 1 Room | 21 (0.1%) | 106 (1.6%) |
| 2 or 3 Rooms | 620 (1.6%) | 1,258 (19.0%) |
| 4 or 5 Rooms | 11,056 (29.1%) | 3,202 (48.3%) |
| 6 or 7 Rooms | 14,115 (37.1%) | 1,591 (24.0%) |
| 8 or more Rooms | 12,179 (32.1%) | 473 (7.1%) |
| Total | 37,991 (100.0%) | 6,630 (100.0%) |
Housing Structure by Heating Type in Allegan County
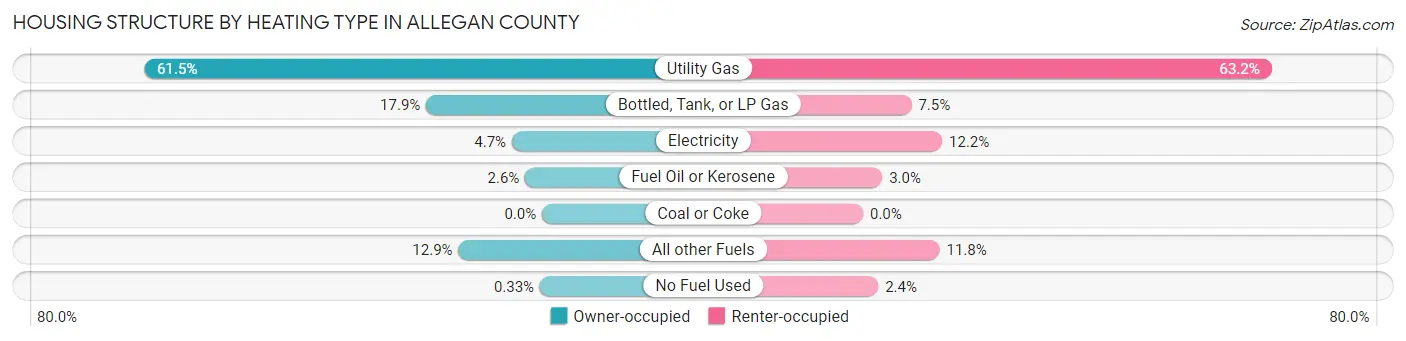
| Heating Type | Owner-occupied | Renter-occupied |
| Utility Gas | 23,378 (61.5%) | 4,187 (63.1%) |
| Bottled, Tank, or LP Gas | 6,807 (17.9%) | 496 (7.5%) |
| Electricity | 1,769 (4.7%) | 810 (12.2%) |
| Fuel Oil or Kerosene | 994 (2.6%) | 197 (3.0%) |
| Coal or Coke | 0 (0.0%) | 0 (0.0%) |
| All other Fuels | 4,917 (12.9%) | 784 (11.8%) |
| No Fuel Used | 126 (0.3%) | 156 (2.4%) |
| Total | 37,991 (100.0%) | 6,630 (100.0%) |
Household Vehicle Usage in Allegan County
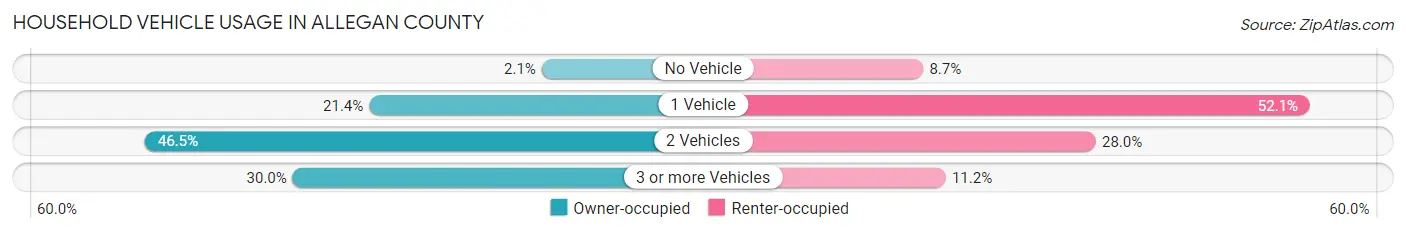
| Vehicles per Household | Owner-occupied | Renter-occupied |
| No Vehicle | 789 (2.1%) | 576 (8.7%) |
| 1 Vehicle | 8,133 (21.4%) | 3,453 (52.1%) |
| 2 Vehicles | 17,679 (46.5%) | 1,858 (28.0%) |
| 3 or more Vehicles | 11,390 (30.0%) | 743 (11.2%) |
| Total | 37,991 (100.0%) | 6,630 (100.0%) |
Real Estate & Mortgages in Allegan County
Real Estate and Mortgage Overview in Allegan County
| Characteristic | Without Mortgage | With Mortgage |
| Housing Units | 15,460 | 22,531 |
| Median Property Value | $210,600 | $232,500 |
| Median Household Income | $61,786 | $4,867 |
| Monthly Housing Costs | $531 | $915 |
| Real Estate Taxes | $2,616 | $1,274 |
Property Value by Mortgage Status in Allegan County
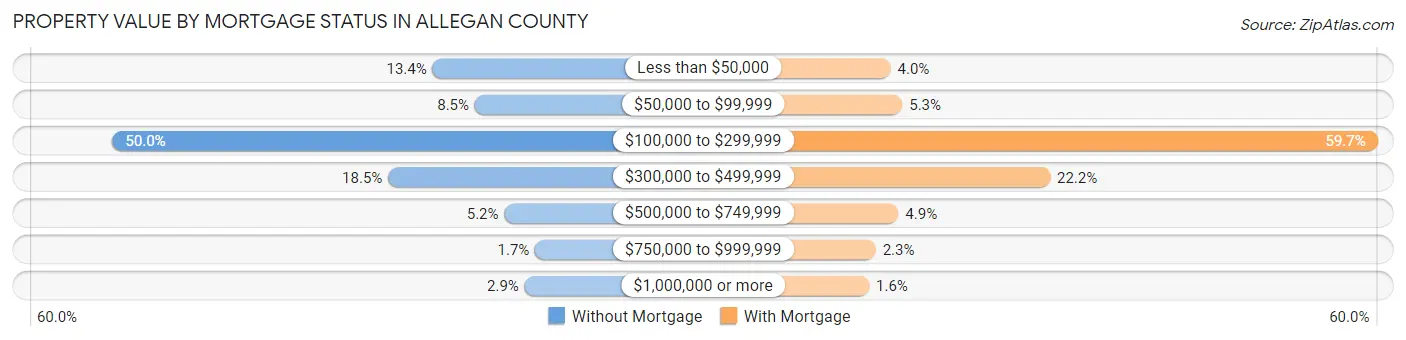
| Property Value | Without Mortgage | With Mortgage |
| Less than $50,000 | 2,068 (13.4%) | 904 (4.0%) |
| $50,000 to $99,999 | 1,320 (8.5%) | 1,204 (5.3%) |
| $100,000 to $299,999 | 7,724 (50.0%) | 13,440 (59.7%) |
| $300,000 to $499,999 | 2,852 (18.4%) | 5,009 (22.2%) |
| $500,000 to $749,999 | 800 (5.2%) | 1,103 (4.9%) |
| $750,000 to $999,999 | 255 (1.7%) | 521 (2.3%) |
| $1,000,000 or more | 441 (2.9%) | 350 (1.5%) |
| Total | 15,460 (100.0%) | 22,531 (100.0%) |
Household Income by Mortgage Status in Allegan County
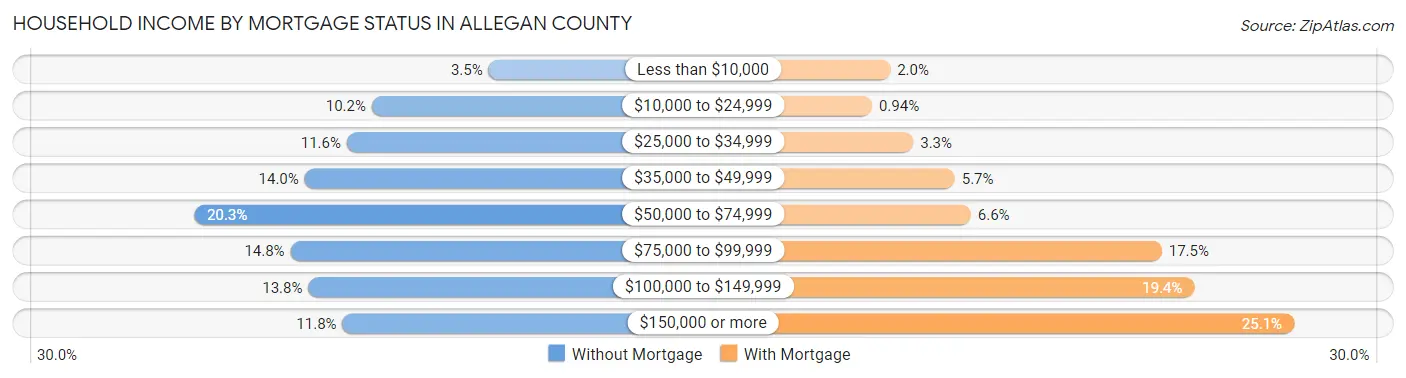
| Household Income | Without Mortgage | With Mortgage |
| Less than $10,000 | 539 (3.5%) | 445 (2.0%) |
| $10,000 to $24,999 | 1,571 (10.2%) | 212 (0.9%) |
| $25,000 to $34,999 | 1,792 (11.6%) | 744 (3.3%) |
| $35,000 to $49,999 | 2,165 (14.0%) | 1,277 (5.7%) |
| $50,000 to $74,999 | 3,141 (20.3%) | 1,484 (6.6%) |
| $75,000 to $99,999 | 2,289 (14.8%) | 3,942 (17.5%) |
| $100,000 to $149,999 | 2,132 (13.8%) | 4,361 (19.4%) |
| $150,000 or more | 1,831 (11.8%) | 5,644 (25.1%) |
| Total | 15,460 (100.0%) | 22,531 (100.0%) |
Property Value to Household Income Ratio in Allegan County
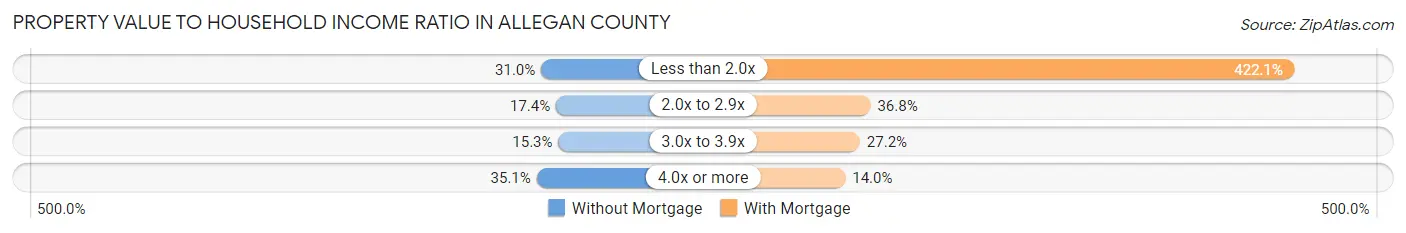
| Value-to-Income Ratio | Without Mortgage | With Mortgage |
| Less than 2.0x | 4,785 (30.9%) | 95,101 (422.1%) |
| 2.0x to 2.9x | 2,696 (17.4%) | 8,301 (36.8%) |
| 3.0x to 3.9x | 2,371 (15.3%) | 6,135 (27.2%) |
| 4.0x or more | 5,418 (35.0%) | 3,142 (14.0%) |
| Total | 15,460 (100.0%) | 22,531 (100.0%) |
Real Estate Taxes by Mortgage Status in Allegan County

| Property Taxes | Without Mortgage | With Mortgage |
| Less than $800 | 723 (4.7%) | 49 (0.2%) |
| $800 to $1,499 | 1,885 (12.2%) | 632 (2.8%) |
| $800 to $1,499 | 10,776 (69.7%) | 2,699 (12.0%) |
| Total | 15,460 (100.0%) | 22,531 (100.0%) |
Health & Disability in Allegan County
Health Insurance Coverage by Age in Allegan County
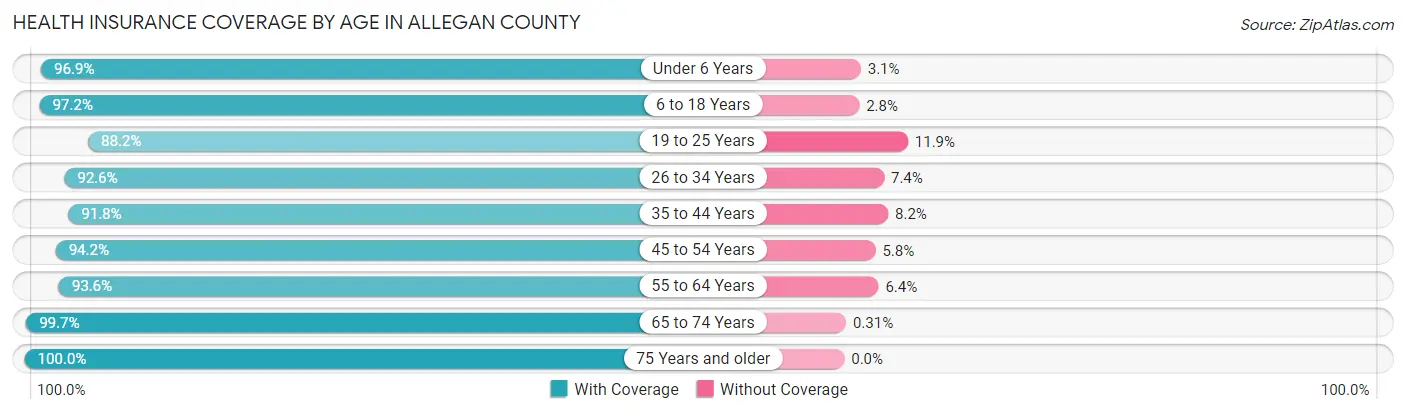
| Age Bracket | With Coverage | Without Coverage |
| Under 6 Years | 8,247 (96.9%) | 262 (3.1%) |
| 6 to 18 Years | 20,922 (97.2%) | 598 (2.8%) |
| 19 to 25 Years | 8,127 (88.1%) | 1,092 (11.8%) |
| 26 to 34 Years | 11,980 (92.6%) | 959 (7.4%) |
| 35 to 44 Years | 13,393 (91.8%) | 1,191 (8.2%) |
| 45 to 54 Years | 14,078 (94.2%) | 869 (5.8%) |
| 55 to 64 Years | 16,126 (93.6%) | 1,099 (6.4%) |
| 65 to 74 Years | 12,851 (99.7%) | 40 (0.3%) |
| 75 Years and older | 7,414 (100.0%) | 0 (0.0%) |
| Total | 113,138 (94.9%) | 6,110 (5.1%) |
Health Insurance Coverage by Citizenship Status in Allegan County

| Citizenship Status | With Coverage | Without Coverage |
| Native Born | 8,247 (96.9%) | 262 (3.1%) |
| Foreign Born, Citizen | 20,922 (97.2%) | 598 (2.8%) |
| Foreign Born, not a Citizen | 8,127 (88.1%) | 1,092 (11.8%) |
Health Insurance Coverage by Household Income in Allegan County
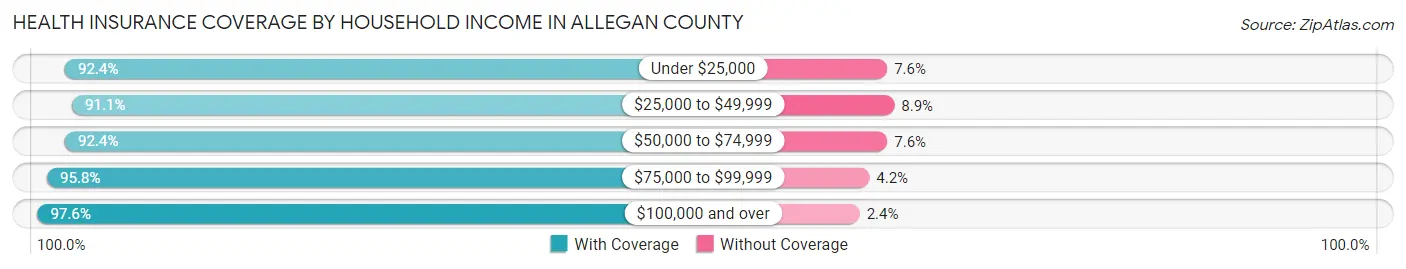
| Household Income | With Coverage | Without Coverage |
| Under $25,000 | 8,815 (92.4%) | 723 (7.6%) |
| $25,000 to $49,999 | 16,879 (91.1%) | 1,652 (8.9%) |
| $50,000 to $74,999 | 19,587 (92.4%) | 1,611 (7.6%) |
| $75,000 to $99,999 | 20,246 (95.8%) | 895 (4.2%) |
| $100,000 and over | 47,281 (97.6%) | 1,171 (2.4%) |
Public vs Private Health Insurance Coverage by Age in Allegan County
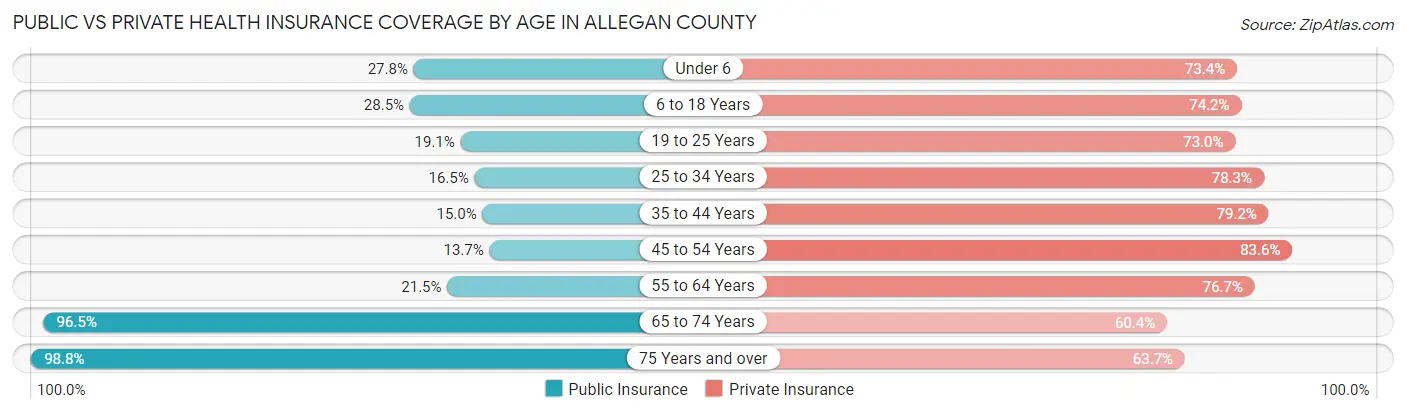
| Age Bracket | Public Insurance | Private Insurance |
| Under 6 | 2,363 (27.8%) | 6,242 (73.4%) |
| 6 to 18 Years | 6,129 (28.5%) | 15,959 (74.2%) |
| 19 to 25 Years | 1,758 (19.1%) | 6,734 (73.0%) |
| 25 to 34 Years | 2,132 (16.5%) | 10,134 (78.3%) |
| 35 to 44 Years | 2,188 (15.0%) | 11,555 (79.2%) |
| 45 to 54 Years | 2,048 (13.7%) | 12,495 (83.6%) |
| 55 to 64 Years | 3,708 (21.5%) | 13,204 (76.7%) |
| 65 to 74 Years | 12,439 (96.5%) | 7,781 (60.4%) |
| 75 Years and over | 7,323 (98.8%) | 4,721 (63.7%) |
| Total | 40,088 (33.6%) | 88,825 (74.5%) |
Disability Status by Sex by Age in Allegan County
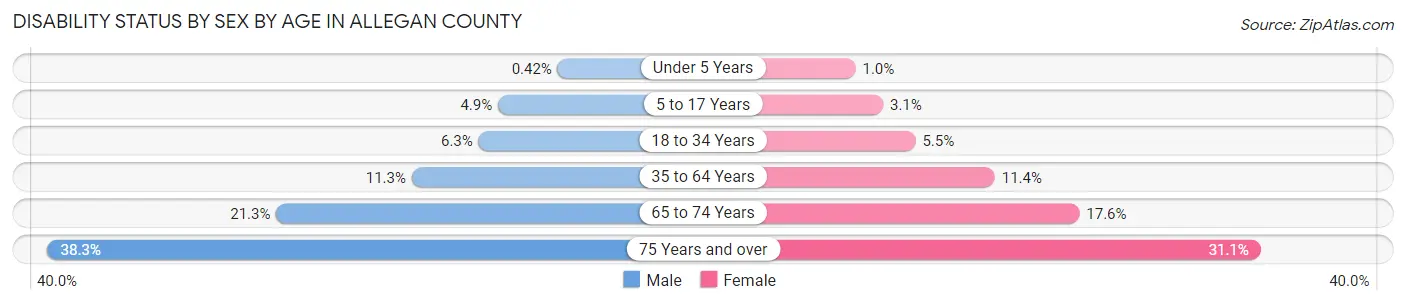
| Age Bracket | Male | Female |
| Under 5 Years | 15 (0.4%) | 35 (1.0%) |
| 5 to 17 Years | 526 (4.9%) | 322 (3.1%) |
| 18 to 34 Years | 765 (6.3%) | 637 (5.5%) |
| 35 to 64 Years | 2,673 (11.3%) | 2,613 (11.4%) |
| 65 to 74 Years | 1,341 (21.3%) | 1,164 (17.6%) |
| 75 Years and over | 1,237 (38.3%) | 1,301 (31.1%) |
Disability Class by Sex by Age in Allegan County
Disability Class: Hearing Difficulty
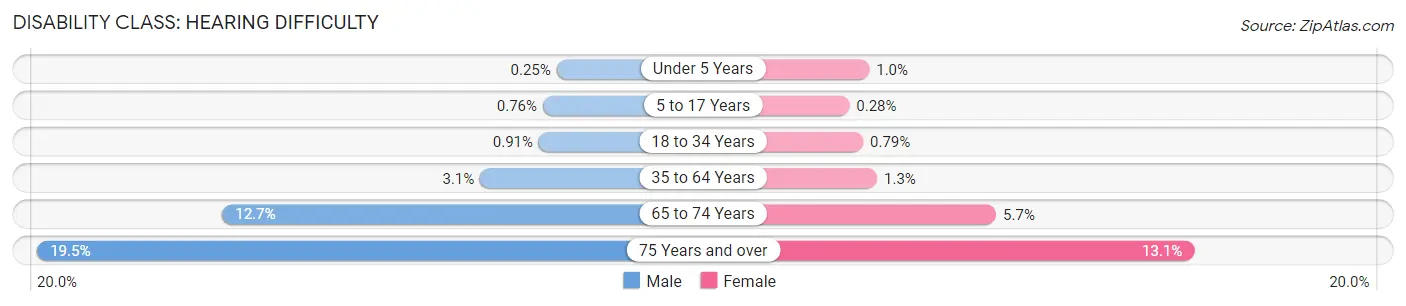
| Age Bracket | Male | Female |
| Under 5 Years | 9 (0.3%) | 35 (1.0%) |
| 5 to 17 Years | 83 (0.8%) | 29 (0.3%) |
| 18 to 34 Years | 111 (0.9%) | 92 (0.8%) |
| 35 to 64 Years | 735 (3.1%) | 301 (1.3%) |
| 65 to 74 Years | 797 (12.7%) | 378 (5.7%) |
| 75 Years and over | 631 (19.5%) | 547 (13.1%) |
Disability Class: Vision Difficulty
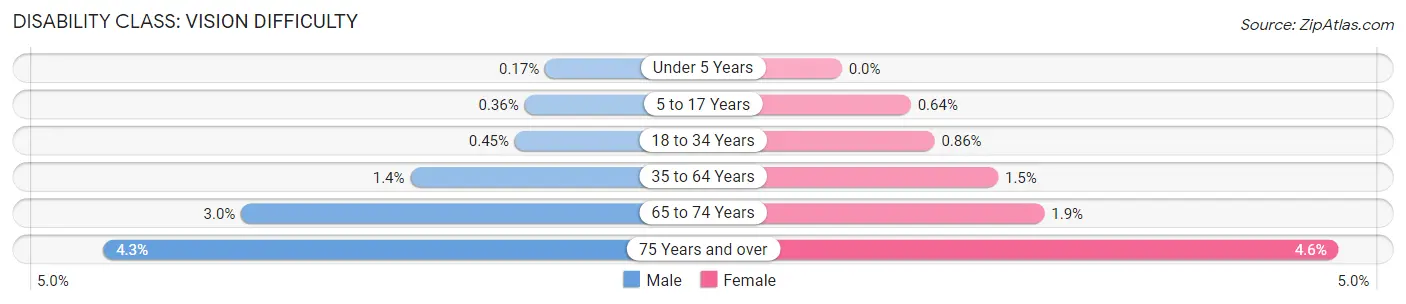
| Age Bracket | Male | Female |
| Under 5 Years | 6 (0.2%) | 0 (0.0%) |
| 5 to 17 Years | 39 (0.4%) | 67 (0.6%) |
| 18 to 34 Years | 55 (0.4%) | 100 (0.9%) |
| 35 to 64 Years | 338 (1.4%) | 334 (1.5%) |
| 65 to 74 Years | 188 (3.0%) | 124 (1.9%) |
| 75 Years and over | 138 (4.3%) | 193 (4.6%) |
Disability Class: Cognitive Difficulty
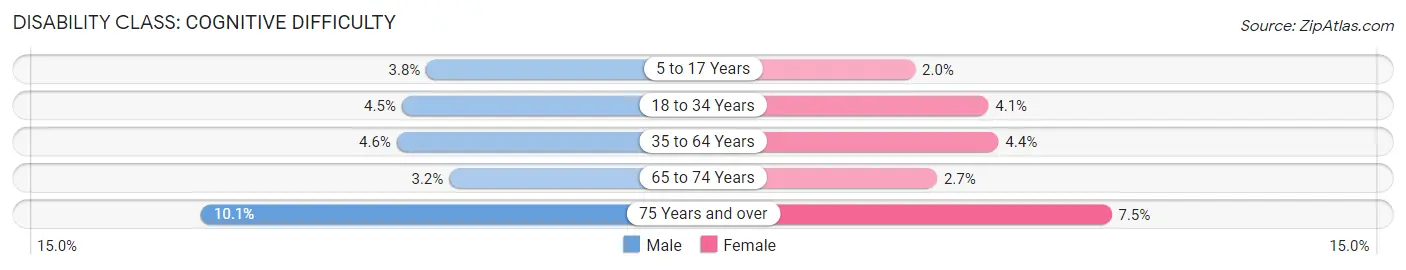
| Age Bracket | Male | Female |
| 5 to 17 Years | 415 (3.8%) | 214 (2.0%) |
| 18 to 34 Years | 547 (4.5%) | 475 (4.1%) |
| 35 to 64 Years | 1,101 (4.6%) | 1,003 (4.4%) |
| 65 to 74 Years | 200 (3.2%) | 175 (2.6%) |
| 75 Years and over | 326 (10.1%) | 314 (7.5%) |
Disability Class: Ambulatory Difficulty
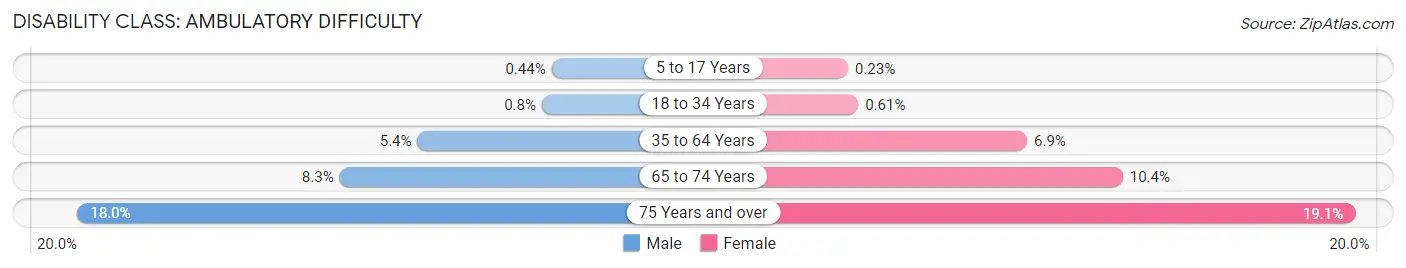
| Age Bracket | Male | Female |
| 5 to 17 Years | 48 (0.4%) | 24 (0.2%) |
| 18 to 34 Years | 97 (0.8%) | 71 (0.6%) |
| 35 to 64 Years | 1,288 (5.4%) | 1,583 (6.9%) |
| 65 to 74 Years | 523 (8.3%) | 688 (10.4%) |
| 75 Years and over | 583 (18.0%) | 797 (19.1%) |
Disability Class: Self-Care Difficulty
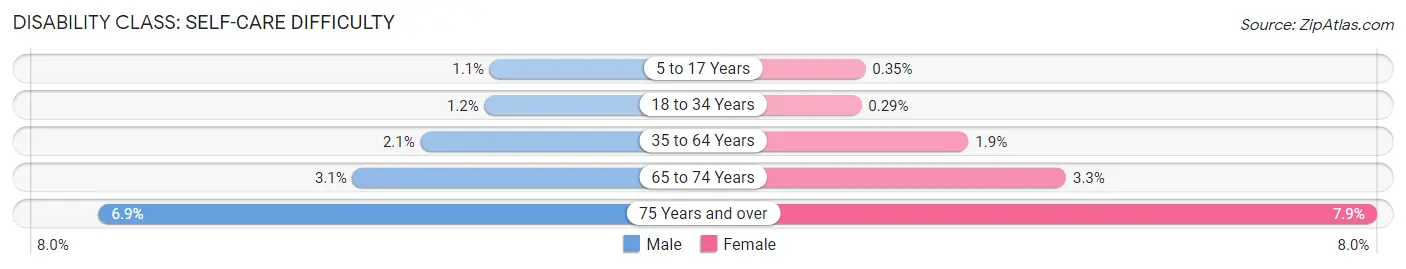
| Age Bracket | Male | Female |
| 5 to 17 Years | 118 (1.1%) | 37 (0.4%) |
| 18 to 34 Years | 142 (1.2%) | 34 (0.3%) |
| 35 to 64 Years | 503 (2.1%) | 433 (1.9%) |
| 65 to 74 Years | 197 (3.1%) | 220 (3.3%) |
| 75 Years and over | 223 (6.9%) | 332 (7.9%) |
Technology Access in Allegan County
Computing Device Access in Allegan County
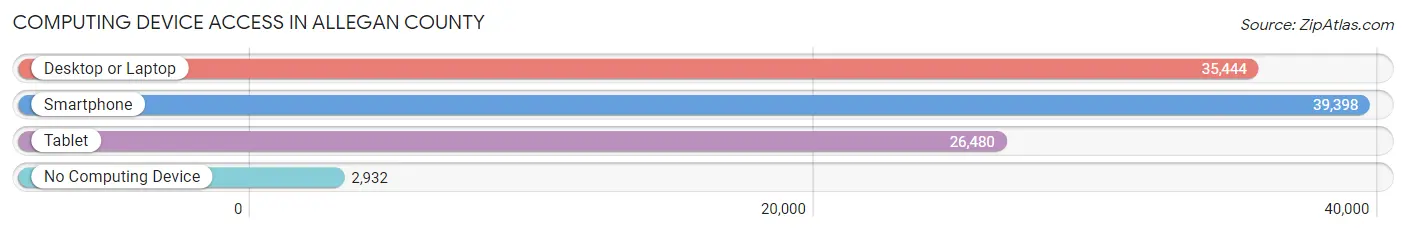
| Device Type | # Households | % Households |
| Desktop or Laptop | 35,444 | 79.4% |
| Smartphone | 39,398 | 88.3% |
| Tablet | 26,480 | 59.3% |
| No Computing Device | 2,932 | 6.6% |
| Total | 44,621 | 100.0% |
Internet Access in Allegan County
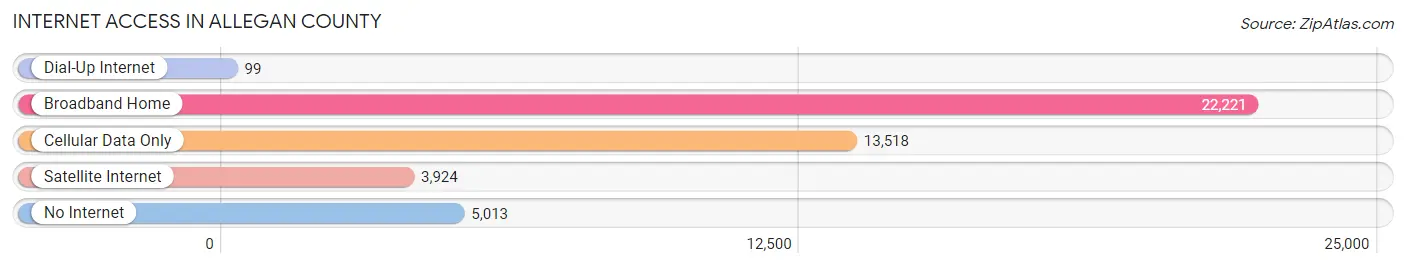
| Internet Type | # Households | % Households |
| Dial-Up Internet | 99 | 0.2% |
| Broadband Home | 22,221 | 49.8% |
| Cellular Data Only | 13,518 | 30.3% |
| Satellite Internet | 3,924 | 8.8% |
| No Internet | 5,013 | 11.2% |
| Total | 44,621 | 100.0% |
Allegan County Summary
Allegan County is located in the southwestern corner of Michigan, and is part of the Grand Rapids-Wyoming Metropolitan Statistical Area. It is bordered by Lake Michigan to the west, Kalamazoo County to the north, Van Buren County to the east, and the state of Indiana to the south. The county seat is Allegan, and the largest city is Holland. As of the 2010 census, the population was 111,408.
Geography
Allegan County is located in the southwestern corner of Michigan, and is part of the Grand Rapids-Wyoming Metropolitan Statistical Area. It is bordered by Lake Michigan to the west, Kalamazoo County to the north, Van Buren County to the east, and the state of Indiana to the south. The county has a total area of 1,818 square miles, of which 1,788 square miles is land and 30 square miles is water. The county is divided into two distinct regions: the northern portion is mostly flat, while the southern portion is hilly and heavily forested.
The Kalamazoo River runs through the county, and there are several lakes, including Gun Lake, Goguac Lake, and Pine Lake. The county is also home to several state parks, including Allegan State Game Area, Yankee Springs Recreation Area, and the Allegan State Forest.
Economy
Allegan County is home to a diverse economy, with a mix of manufacturing, agriculture, and tourism. The county is home to several large employers, including Perrigo, a pharmaceutical company, and Gentex, an automotive parts manufacturer. The county is also home to several smaller companies, including several wineries, breweries, and distilleries.
Agriculture is an important part of the county's economy, with corn, soybeans, and wheat being the primary crops. The county is also home to several dairy farms, and is a major producer of apples, peaches, and other fruits.
Tourism is also an important part of the county's economy, with several popular attractions, including the Allegan County Fair, the Saugatuck Dunes State Park, and the Allegan County Historical Museum.
Demographics
As of the 2010 census, the population of Allegan County was 111,408, with a population density of 62.2 people per square mile. The racial makeup of the county was 91.2% White, 2.7% African American, 0.7% Native American, 1.7% Asian, 0.1% Pacific Islander, 2.2% from other races, and 1.9% from two or more races. Hispanic or Latino of any race were 5.2% of the population.
The median income for a household in the county was $48,845, and the median income for a family was $58,945. The per capita income for the county was $24,845. About 8.2% of families and 11.2% of the population were below the poverty line, including 15.2% of those under age 18 and 6.2% of those age 65 or over.
Allegan County is home to several higher education institutions, including Allegan Community College, Davenport University, and Western Michigan University. The county is also home to several private schools, including Allegan Christian School and Allegan High School.
Common Questions
What is the Total Population of Allegan County?
Total Population of Allegan County is 120,189.
What is the Total Male Population of Allegan County?
Total Male Population of Allegan County is 60,422.
What is the Total Female Population of Allegan County?
Total Female Population of Allegan County is 59,767.
What is the Ratio of Males per 100 Females in Allegan County?
There are 101.10 Males per 100 Females in Allegan County.
What is the Ratio of Females per 100 Males in Allegan County?
There are 98.92 Females per 100 Males in Allegan County.
What is the Median Population Age in Allegan County?
Median Population Age in Allegan County is 40.4 Years.
What is the Average Family Size in Allegan County
Average Family Size in Allegan County is 3.0 People.
What is the Average Household Size in Allegan County
Average Household Size in Allegan County is 2.7 People.
What is Per Capita Income in Allegan County?
Per Capita income in Allegan County is $35,220.
What is the Median Family Income in Allegan County?
Median Family Income in Allegan County is $86,347.
What is the Median Household income in Allegan County?
Median Household Income in Allegan County is $75,543.
What is Income or Wage Gap in Allegan County?
Income or Wage Gap in Allegan County is 36.2%.
Women in Allegan County earn 63.8 cents for every dollar earned by a man.
What is Family Income Deficit in Allegan County?
Family Income Deficit in Allegan County is $11,671.
Families that are below poverty line in Allegan County earn $11,671 less on average than the poverty threshold level.
What is Inequality or Gini Index in Allegan County?
Inequality or Gini Index in Allegan County is 0.41.
How Large is the Labor Force in Allegan County?
There are 59,065 People in the Labor Forcein in Allegan County.
What is the Percentage of People in the Labor Force in Allegan County?
62.0% of People are in the Labor Force in Allegan County.
What is the Unemployment Rate in Allegan County?
Unemployment Rate in Allegan County is 3.4%.