Union Grove, TX
Union Grove Map
Union Grove Overview
844
TOTAL POPULATION
450
MALE POPULATION
394
FEMALE POPULATION
114.21
MALES / 100 FEMALES
87.56
FEMALES / 100 MALES
27.7
MEDIAN AGE
3.2
AVG FAMILY SIZE
3.1
AVG HOUSEHOLD SIZE
$68,199
PER CAPITA INCOME
$250,001
AVG FAMILY INCOME
$197,083
AVG HOUSEHOLD INCOME
78.1%
WAGE / INCOME GAP [ % ]
21.9¢/ $1
WAGE / INCOME GAP [ $ ]
0.35
INEQUALITY / GINI INDEX
459
LABOR FORCE [ PEOPLE ]
80.7%
PERCENT IN LABOR FORCE
0.9%
UNEMPLOYMENT RATE
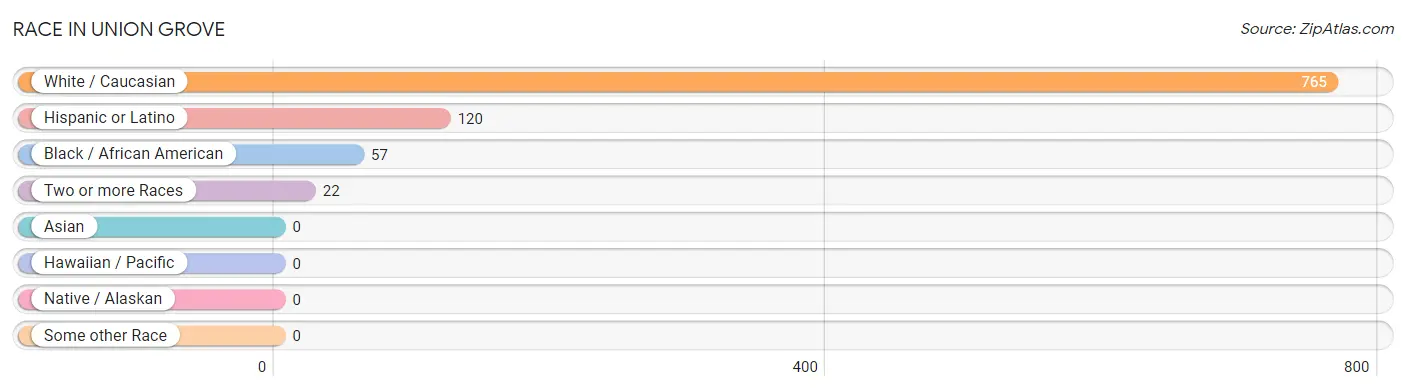
Race in Union Grove
The most populous races in Union Grove are White / Caucasian (765 | 90.6%), Hispanic or Latino (120 | 14.2%), and Black / African American (57 | 6.8%).
| Race | # Population | % Population |
| Asian | 0 | 0.0% |
| Black / African American | 57 | 6.8% |
| Hawaiian / Pacific | 0 | 0.0% |
| Hispanic or Latino | 120 | 14.2% |
| Native / Alaskan | 0 | 0.0% |
| White / Caucasian | 765 | 90.6% |
| Two or more Races | 22 | 2.6% |
| Some other Race | 0 | 0.0% |
| Total | 844 | 100.0% |
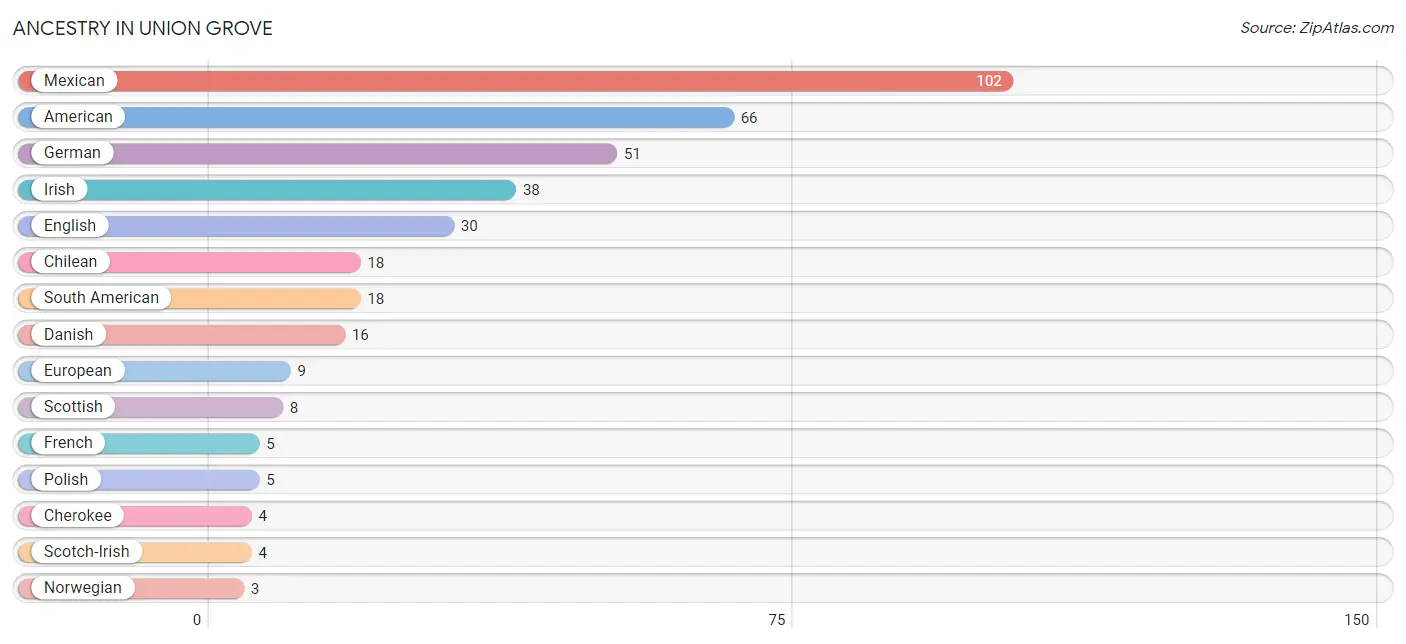
Ancestry in Union Grove
The most populous ancestries reported in Union Grove are Mexican (102 | 12.1%), American (66 | 7.8%), German (51 | 6.0%), Irish (38 | 4.5%), and English (30 | 3.5%), together accounting for 34.0% of all Union Grove residents.
| Ancestry | # Population | % Population |
| American | 66 | 7.8% |
| Cherokee | 4 | 0.5% |
| Chickasaw | 2 | 0.2% |
| Chilean | 18 | 2.1% |
| Danish | 16 | 1.9% |
| Eastern European | 1 | 0.1% |
| English | 30 | 3.5% |
| European | 9 | 1.1% |
| French | 5 | 0.6% |
| German | 51 | 6.0% |
| Irish | 38 | 4.5% |
| Mexican | 102 | 12.1% |
| Norwegian | 3 | 0.4% |
| Polish | 5 | 0.6% |
| Russian | 1 | 0.1% |
| Scotch-Irish | 4 | 0.5% |
| Scottish | 8 | 0.9% |
| South American | 18 | 2.1% | View All 18 Rows |
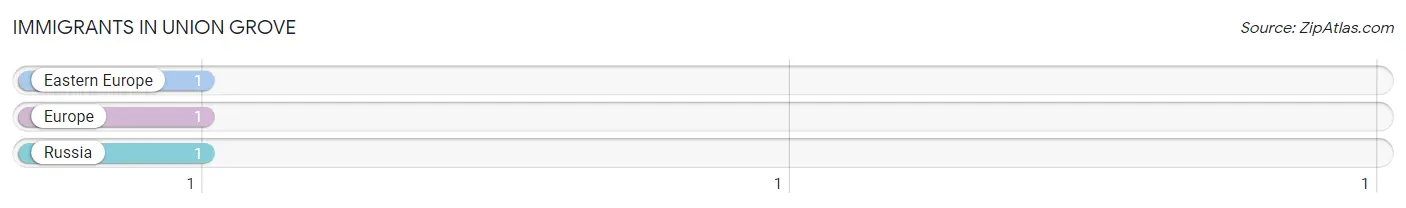
Immigrants in Union Grove
The most numerous immigrant groups reported in Union Grove came from Eastern Europe (1 | 0.1%), Europe (1 | 0.1%), and Russia (1 | 0.1%), together accounting for 0.4% of all Union Grove residents.
| Immigration Origin | # Population | % Population |
| Eastern Europe | 1 | 0.1% |
| Europe | 1 | 0.1% |
| Russia | 1 | 0.1% | View All 3 Rows |
Sex and Age in Union Grove
Sex and Age in Union Grove
The most populous age groups in Union Grove are 25 to 29 Years (130 | 28.9%) for men and 25 to 29 Years (117 | 29.7%) for women.
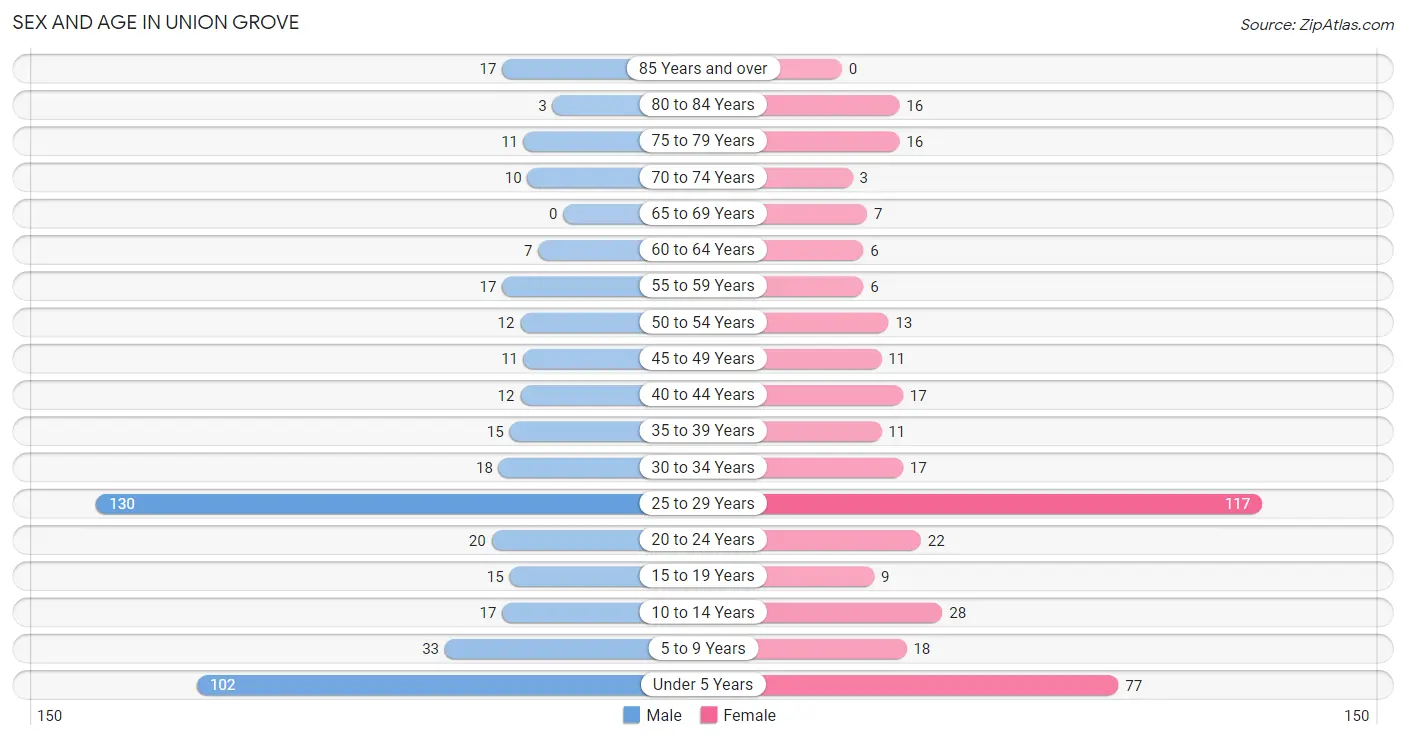
| Age Bracket | Male | Female |
| Under 5 Years | 102 (22.7%) | 77 (19.5%) |
| 5 to 9 Years | 33 (7.3%) | 18 (4.6%) |
| 10 to 14 Years | 17 (3.8%) | 28 (7.1%) |
| 15 to 19 Years | 15 (3.3%) | 9 (2.3%) |
| 20 to 24 Years | 20 (4.4%) | 22 (5.6%) |
| 25 to 29 Years | 130 (28.9%) | 117 (29.7%) |
| 30 to 34 Years | 18 (4.0%) | 17 (4.3%) |
| 35 to 39 Years | 15 (3.3%) | 11 (2.8%) |
| 40 to 44 Years | 12 (2.7%) | 17 (4.3%) |
| 45 to 49 Years | 11 (2.4%) | 11 (2.8%) |
| 50 to 54 Years | 12 (2.7%) | 13 (3.3%) |
| 55 to 59 Years | 17 (3.8%) | 6 (1.5%) |
| 60 to 64 Years | 7 (1.6%) | 6 (1.5%) |
| 65 to 69 Years | 0 (0.0%) | 7 (1.8%) |
| 70 to 74 Years | 10 (2.2%) | 3 (0.8%) |
| 75 to 79 Years | 11 (2.4%) | 16 (4.1%) |
| 80 to 84 Years | 3 (0.7%) | 16 (4.1%) |
| 85 Years and over | 17 (3.8%) | 0 (0.0%) |
| Total | 450 (100.0%) | 394 (100.0%) |
Families and Households in Union Grove
Median Family Size in Union Grove
The median family size in Union Grove is 3.23 persons per family, with single female/mother families (22 | 8.8%) accounting for the largest median family size of 6.32 persons per family. On the other hand, single male/father families (25 | 10.0%) represent the smallest median family size with 2.68 persons per family.
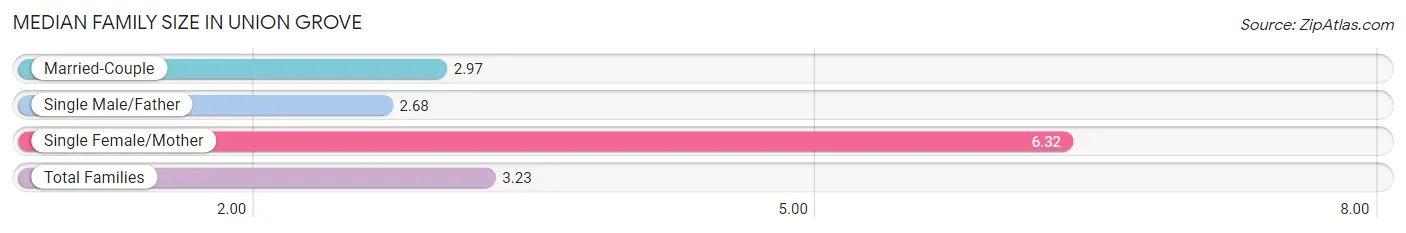
| Family Type | # Families | Family Size |
| Married-Couple | 204 (81.3%) | 2.97 |
| Single Male/Father | 25 (10.0%) | 2.68 |
| Single Female/Mother | 22 (8.8%) | 6.32 |
| Total Families | 251 (100.0%) | 3.23 |
Median Household Size in Union Grove
The median household size in Union Grove is 3.09 persons per household, with single female/mother households (22 | 8.1%) accounting for the largest median household size of 6.55 persons per household. non-family households (22 | 8.1%) represent the smallest median household size with 1.05 persons per household.
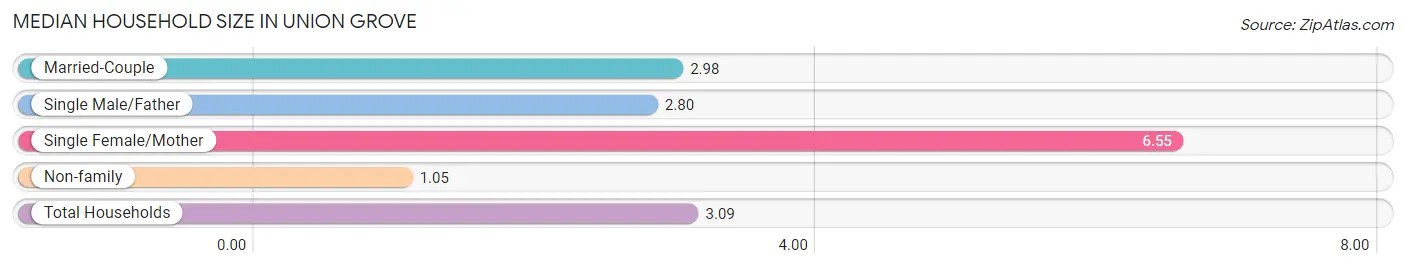
| Household Type | # Households | Household Size |
| Married-Couple | 204 (74.7%) | 2.98 |
| Single Male/Father | 25 (9.2%) | 2.80 |
| Single Female/Mother | 22 (8.1%) | 6.55 |
| Non-family | 22 (8.1%) | 1.05 |
| Total Households | 273 (100.0%) | 3.09 |
Household Size by Marriage Status in Union Grove
Out of a total of 273 households in Union Grove, 251 (91.9%) are family households, while 22 (8.1%) are nonfamily households. The most numerous type of family households are 3-person households, comprising 130, and the most common type of nonfamily households are 1-person households, comprising 20.
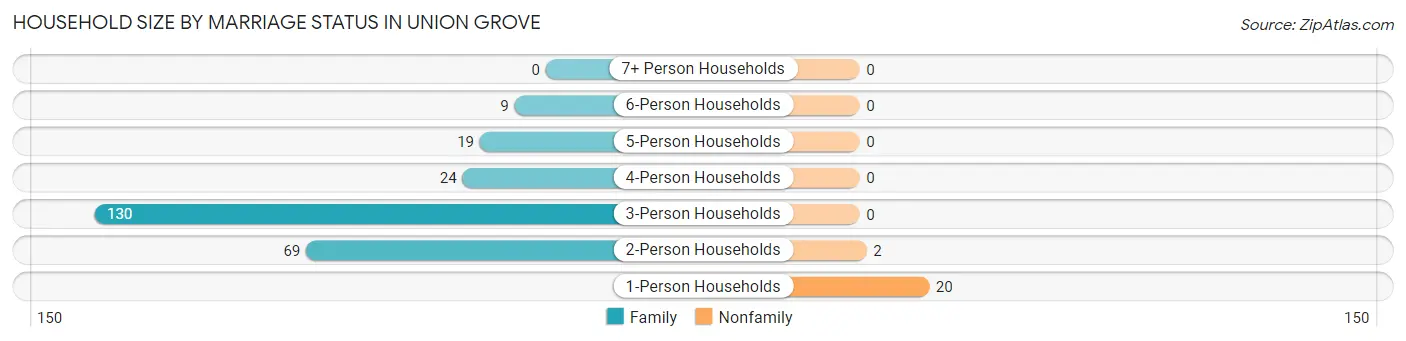
| Household Size | Family Households | Nonfamily Households |
| 1-Person Households | - | 20 (7.3%) |
| 2-Person Households | 69 (25.3%) | 2 (0.7%) |
| 3-Person Households | 130 (47.6%) | 0 (0.0%) |
| 4-Person Households | 24 (8.8%) | 0 (0.0%) |
| 5-Person Households | 19 (7.0%) | 0 (0.0%) |
| 6-Person Households | 9 (3.3%) | 0 (0.0%) |
| 7+ Person Households | 0 (0.0%) | 0 (0.0%) |
| Total | 251 (91.9%) | 22 (8.1%) |
Female Fertility in Union Grove
Fertility by Age in Union Grove
Average fertility rate in Union Grove is 48.0 births per 1,000 women. Women in the age bracket of 20 to 34 years have the highest fertility rate with 64.0 births per 1,000 women. Women in the age bracket of 20 to 34 years acount for 100.0% of all women with births.
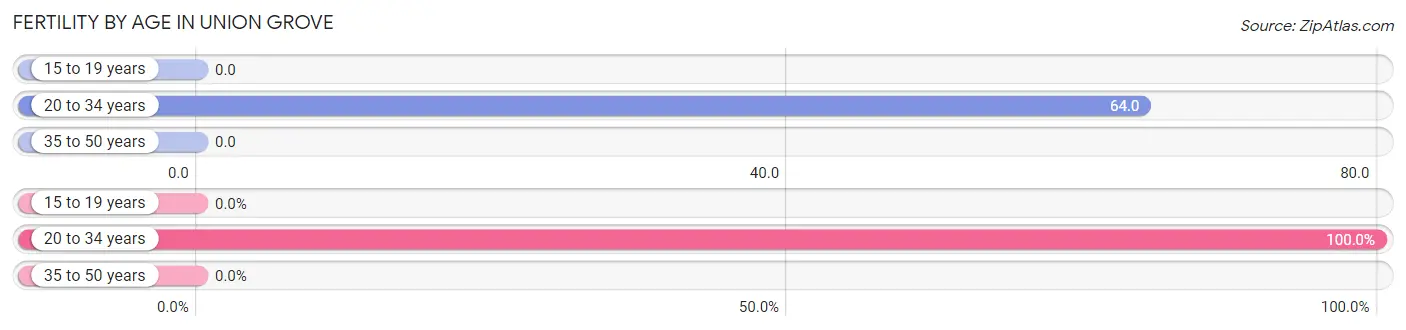
| Age Bracket | Women with Births | Births / 1,000 Women |
| 15 to 19 years | 0 (0.0%) | 0.0 |
| 20 to 34 years | 10 (100.0%) | 64.0 |
| 35 to 50 years | 0 (0.0%) | 0.0 |
| Total | 10 (100.0%) | 48.0 |
Fertility by Age by Marriage Status in Union Grove
30.0% of women with births (10) in Union Grove are married. The highest percentage of unmarried women with births falls into 20 to 34 years age bracket with 70.0% of them unmarried at the time of birth, while the lowest percentage of unmarried women with births belong to 20 to 34 years age bracket with 70.0% of them unmarried.
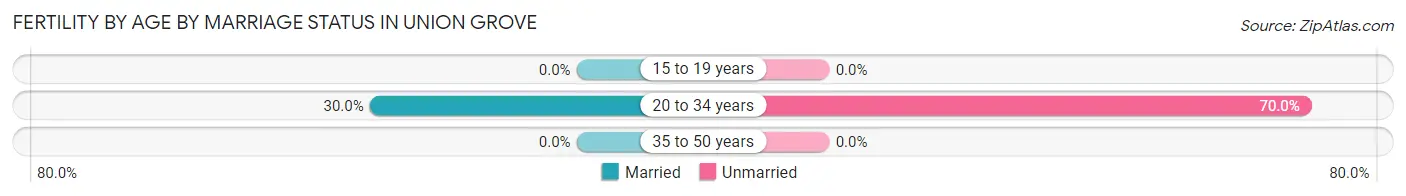
| Age Bracket | Married | Unmarried |
| 15 to 19 years | 0 (0.0%) | 0 (0.0%) |
| 20 to 34 years | 3 (30.0%) | 7 (70.0%) |
| 35 to 50 years | 0 (0.0%) | 0 (0.0%) |
| Total | 3 (30.0%) | 7 (70.0%) |
Fertility by Education in Union Grove
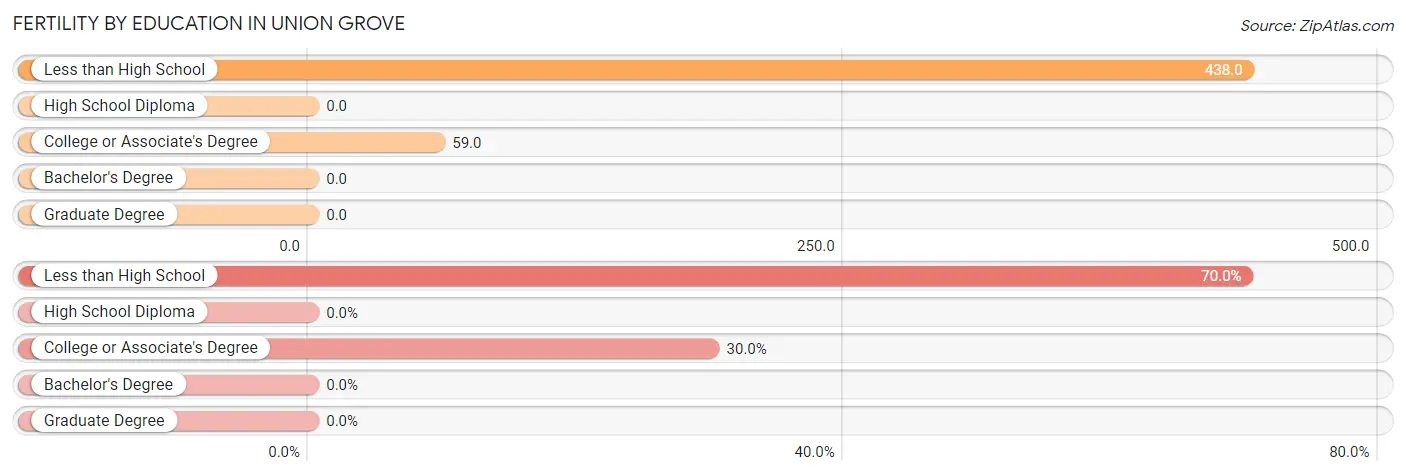
| Educational Attainment | Women with Births | Births / 1,000 Women |
| Less than High School | 7 (70.0%) | 438.0 |
| High School Diploma | 0 (0.0%) | 0.0 |
| College or Associate's Degree | 3 (30.0%) | 59.0 |
| Bachelor's Degree | 0 (0.0%) | 0.0 |
| Graduate Degree | 0 (0.0%) | 0.0 |
| Total | 10 (100.0%) | 48.0 |
Fertility by Education by Marriage Status in Union Grove
70.0% of women with births in Union Grove are unmarried. Women with the educational attainment of college or associate's degree are most likely to be married with 100.0% of them married at childbirth, while women with the educational attainment of less than high school are least likely to be married with 100.0% of them unmarried at childbirth.
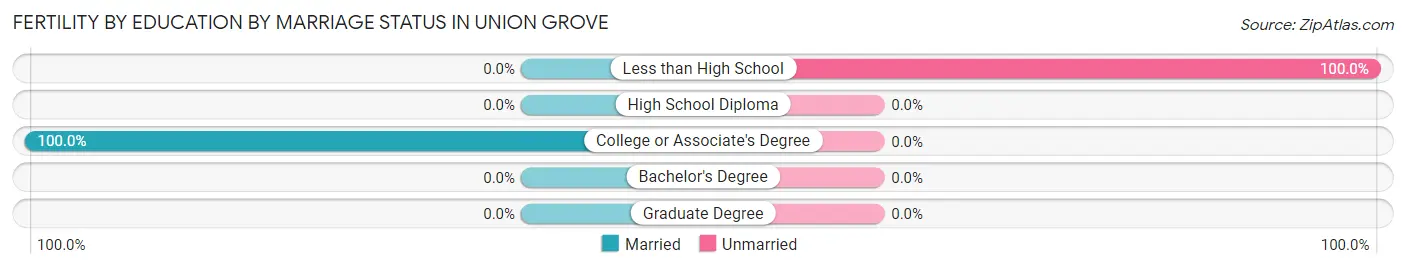
| Educational Attainment | Married | Unmarried |
| Less than High School | 0 (0.0%) | 7 (100.0%) |
| High School Diploma | 0 (0.0%) | 0 (0.0%) |
| College or Associate's Degree | 3 (100.0%) | 0 (0.0%) |
| Bachelor's Degree | 0 (0.0%) | 0 (0.0%) |
| Graduate Degree | 0 (0.0%) | 0 (0.0%) |
| Total | 3 (30.0%) | 7 (70.0%) |
Income in Union Grove
Income Overview in Union Grove
Per Capita Income in Union Grove is $68,199, while median incomes of families and households are $250,001 and $197,083 respectively.
| Characteristic | Number | Measure |
| Per Capita Income | 844 | $68,199 |
| Median Family Income | 251 | $250,001 |
| Mean Family Income | 251 | $221,509 |
| Median Household Income | 273 | $197,083 |
| Mean Household Income | 273 | $208,359 |
| Income Deficit | 251 | $0 |
| Wage / Income Gap (%) | 844 | 78.07% |
| Wage / Income Gap ($) | 844 | 21.93¢ per $1 |
| Gini / Inequality Index | 844 | 0.35 |
Earnings by Sex in Union Grove
Average Earnings in Union Grove are $38,125, $132,634 for men and $29,091 for women, a difference of 78.1%.
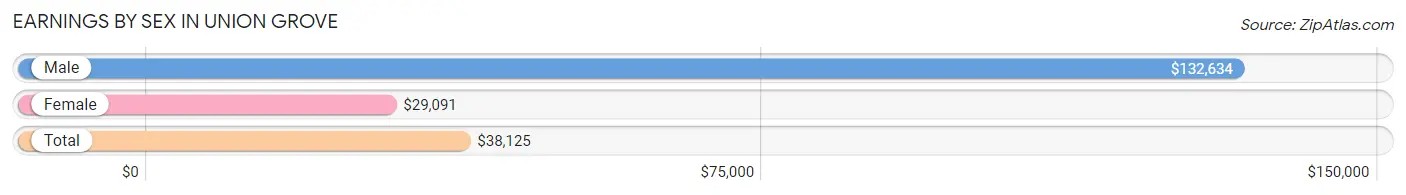
| Sex | Number | Average Earnings |
| Male | 255 (55.1%) | $132,634 |
| Female | 208 (44.9%) | $29,091 |
| Total | 463 (100.0%) | $38,125 |
Earnings by Sex by Income Bracket in Union Grove
The most common earnings brackets in Union Grove are $100,000+ for men (152 | 59.6%) and $25,000 to $29,999 for women (112 | 53.8%).
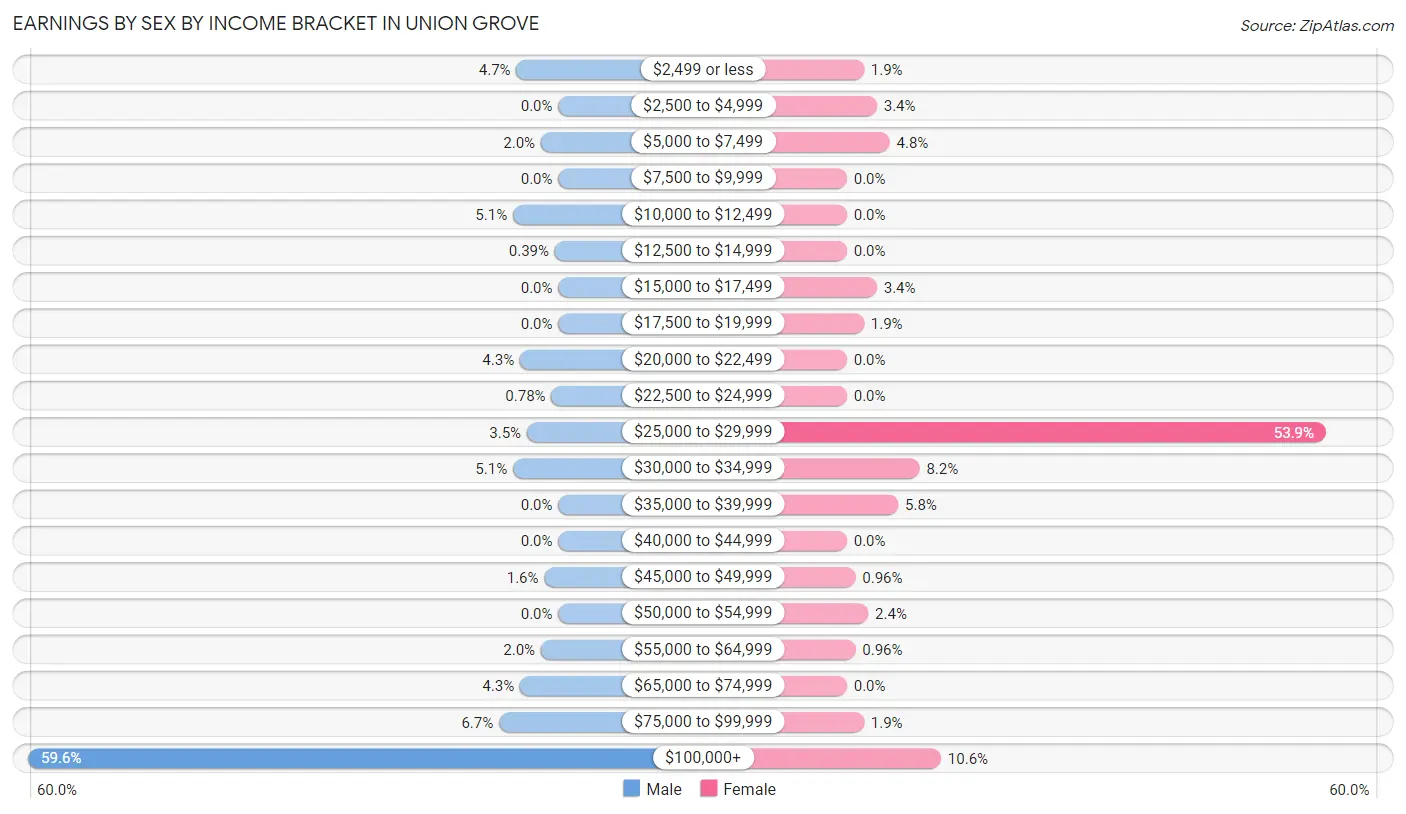
| Income | Male | Female |
| $2,499 or less | 12 (4.7%) | 4 (1.9%) |
| $2,500 to $4,999 | 0 (0.0%) | 7 (3.4%) |
| $5,000 to $7,499 | 5 (2.0%) | 10 (4.8%) |
| $7,500 to $9,999 | 0 (0.0%) | 0 (0.0%) |
| $10,000 to $12,499 | 13 (5.1%) | 0 (0.0%) |
| $12,500 to $14,999 | 1 (0.4%) | 0 (0.0%) |
| $15,000 to $17,499 | 0 (0.0%) | 7 (3.4%) |
| $17,500 to $19,999 | 0 (0.0%) | 4 (1.9%) |
| $20,000 to $22,499 | 11 (4.3%) | 0 (0.0%) |
| $22,500 to $24,999 | 2 (0.8%) | 0 (0.0%) |
| $25,000 to $29,999 | 9 (3.5%) | 112 (53.8%) |
| $30,000 to $34,999 | 13 (5.1%) | 17 (8.2%) |
| $35,000 to $39,999 | 0 (0.0%) | 12 (5.8%) |
| $40,000 to $44,999 | 0 (0.0%) | 0 (0.0%) |
| $45,000 to $49,999 | 4 (1.6%) | 2 (1.0%) |
| $50,000 to $54,999 | 0 (0.0%) | 5 (2.4%) |
| $55,000 to $64,999 | 5 (2.0%) | 2 (1.0%) |
| $65,000 to $74,999 | 11 (4.3%) | 0 (0.0%) |
| $75,000 to $99,999 | 17 (6.7%) | 4 (1.9%) |
| $100,000+ | 152 (59.6%) | 22 (10.6%) |
| Total | 255 (100.0%) | 208 (100.0%) |
Earnings by Sex by Educational Attainment in Union Grove
Average earnings in Union Grove are $132,965 for men and $28,989 for women, a difference of 78.2%. Men with an educational attainment of college or associate's degree enjoy the highest average annual earnings of $90,417, while those with high school diploma education earn the least with $66,136. Women with an educational attainment of college or associate's degree earn the most with the average annual earnings of $50,000, while those with high school diploma education have the smallest earnings of $16,875.
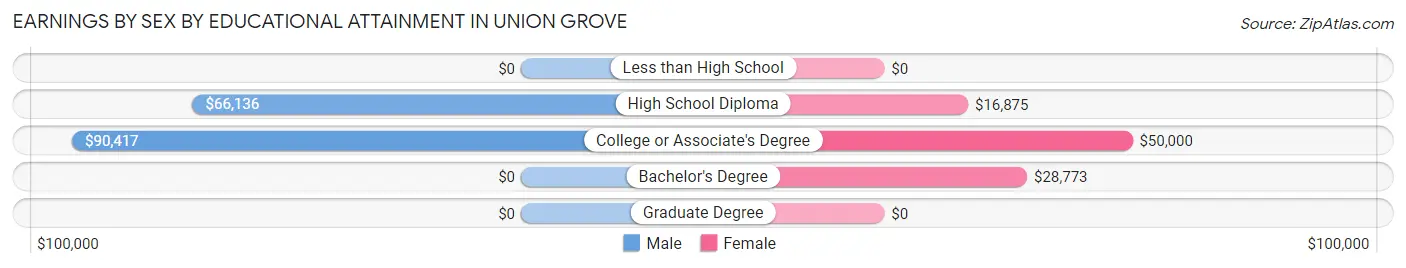
| Educational Attainment | Male Income | Female Income |
| Less than High School | - | - |
| High School Diploma | $66,136 | $16,875 |
| College or Associate's Degree | $90,417 | $50,000 |
| Bachelor's Degree | - | - |
| Graduate Degree | - | - |
| Total | $132,965 | $28,989 |
Family Income in Union Grove
Family Income Brackets in Union Grove
According to the Union Grove family income data, there are 134 families falling into the $200,000+ income range, which is the most common income bracket and makes up 53.4% of all families.
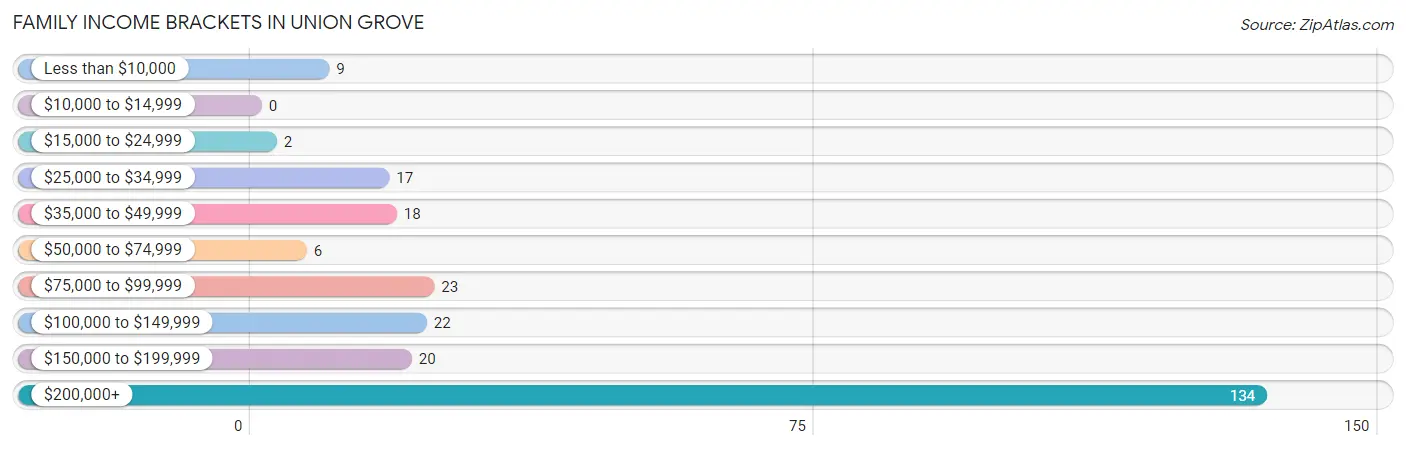
| Income Bracket | # Families | % Families |
| Less than $10,000 | 9 | 3.6% |
| $10,000 to $14,999 | 0 | 0.0% |
| $15,000 to $24,999 | 2 | 0.8% |
| $25,000 to $34,999 | 17 | 6.8% |
| $35,000 to $49,999 | 18 | 7.2% |
| $50,000 to $74,999 | 6 | 2.4% |
| $75,000 to $99,999 | 23 | 9.2% |
| $100,000 to $149,999 | 22 | 8.8% |
| $150,000 to $199,999 | 20 | 8.0% |
| $200,000+ | 134 | 53.4% |
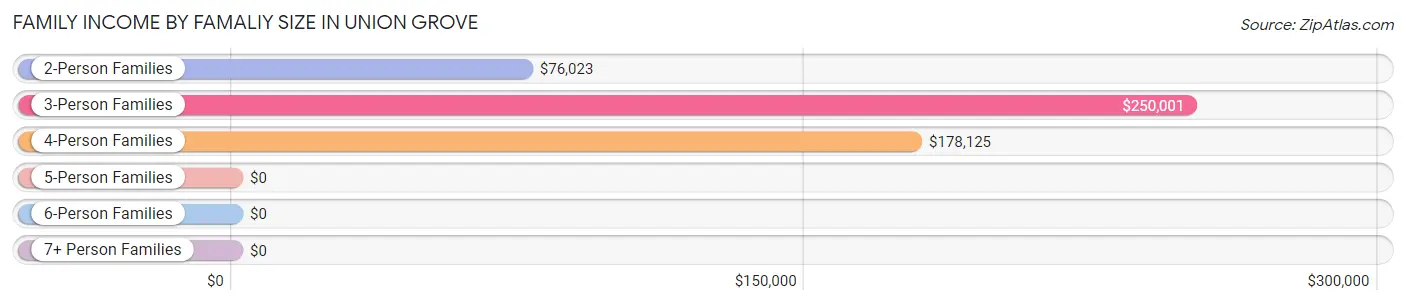
Family Income by Famaliy Size in Union Grove
3-person families (132 | 52.6%) account for the highest median family income in Union Grove with $250,001 per family, while 3-person families (132 | 52.6%) have the highest median income of $83,334 per family member.
| Income Bracket | # Families | Median Income |
| 2-Person Families | 69 (27.5%) | $76,023 |
| 3-Person Families | 132 (52.6%) | $250,001 |
| 4-Person Families | 25 (10.0%) | $178,125 |
| 5-Person Families | 23 (9.2%) | $0 |
| 6-Person Families | 2 (0.8%) | $0 |
| 7+ Person Families | 0 (0.0%) | $0 |
| Total | 251 (100.0%) | $250,001 |
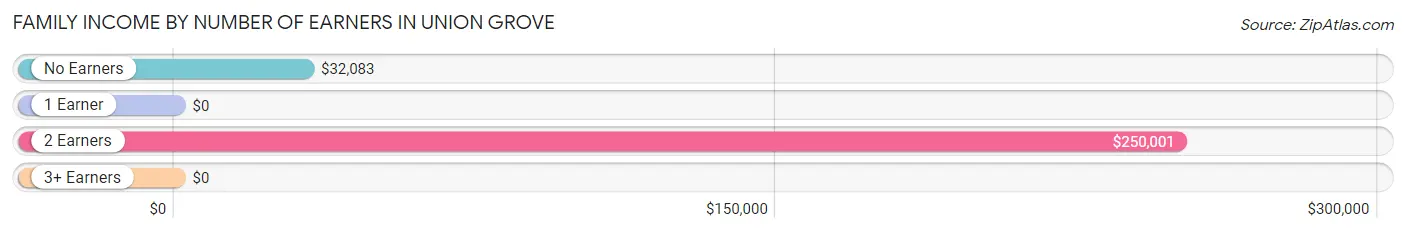
Family Income by Number of Earners in Union Grove
| Number of Earners | # Families | Median Income |
| No Earners | 29 (11.6%) | $32,083 |
| 1 Earner | 32 (12.8%) | $0 |
| 2 Earners | 176 (70.1%) | $250,001 |
| 3+ Earners | 14 (5.6%) | $0 |
| Total | 251 (100.0%) | $250,001 |
Household Income in Union Grove
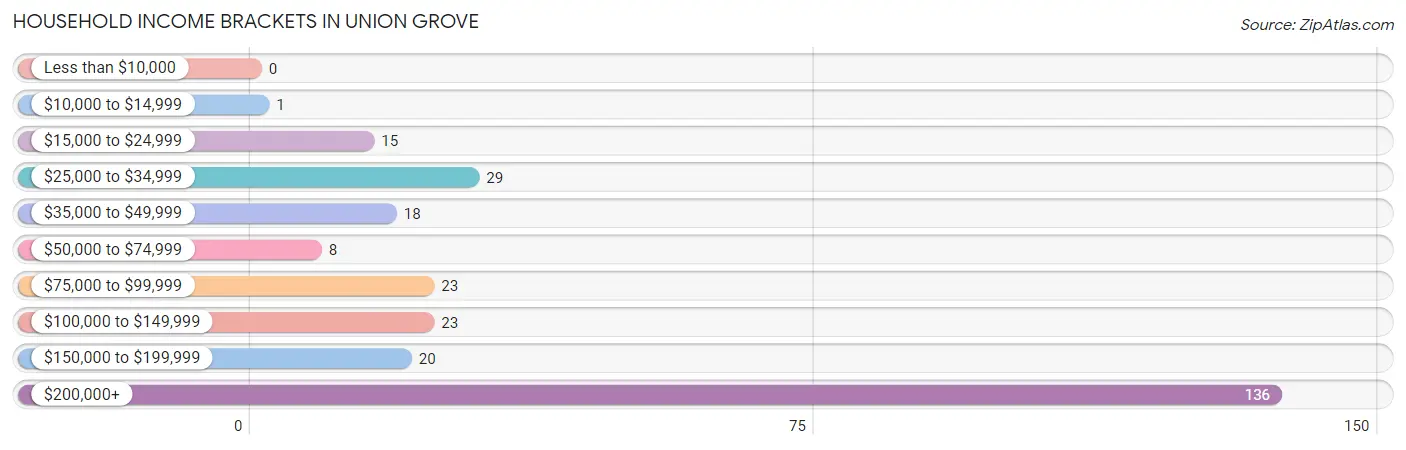
Household Income Brackets in Union Grove
With 136 households falling in the category, the $200,000+ income range is the most frequent in Union Grove, accounting for 49.8% of all households.
| Income Bracket | # Households | % Households |
| Less than $10,000 | 0 | 0.0% |
| $10,000 to $14,999 | 1 | 0.4% |
| $15,000 to $24,999 | 15 | 5.5% |
| $25,000 to $34,999 | 29 | 10.6% |
| $35,000 to $49,999 | 18 | 6.6% |
| $50,000 to $74,999 | 8 | 2.9% |
| $75,000 to $99,999 | 23 | 8.4% |
| $100,000 to $149,999 | 23 | 8.4% |
| $150,000 to $199,999 | 20 | 7.3% |
| $200,000+ | 136 | 49.8% |
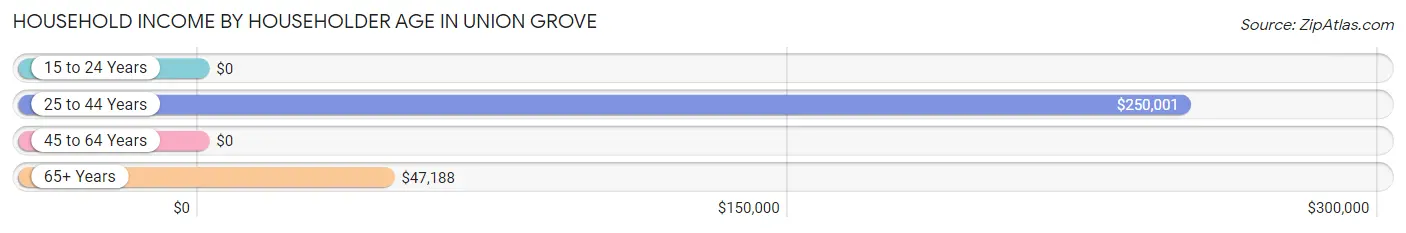
Household Income by Householder Age in Union Grove
The median household income in Union Grove is $197,083, with the highest median household income of $250,001 found in the 25 to 44 years age bracket for the primary householder. A total of 176 households (64.5%) fall into this category. Meanwhile, the 15 to 24 years age bracket for the primary householder has the lowest median household income of $0, with 2 households (0.7%) in this group.
| Income Bracket | # Households | Median Income |
| 15 to 24 Years | 2 (0.7%) | $0 |
| 25 to 44 Years | 176 (64.5%) | $250,001 |
| 45 to 64 Years | 42 (15.4%) | $0 |
| 65+ Years | 53 (19.4%) | $47,188 |
| Total | 273 (100.0%) | $197,083 |
Poverty in Union Grove
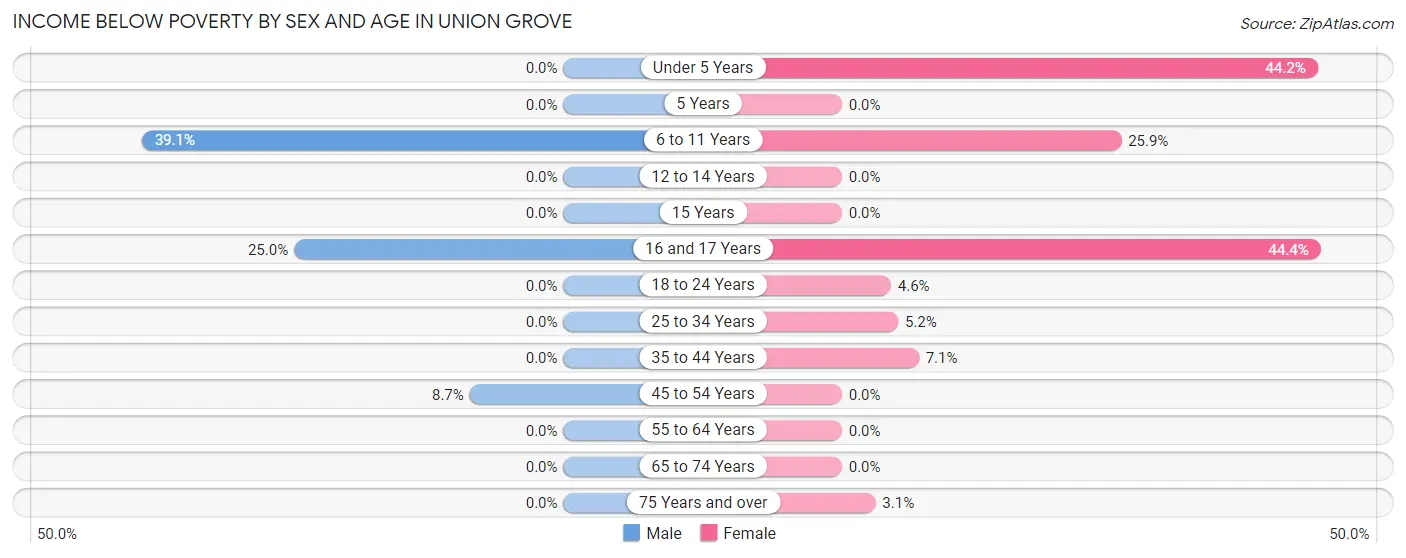
Income Below Poverty by Sex and Age in Union Grove
With 3.1% poverty level for males and 14.2% for females among the residents of Union Grove, 6 to 11 year old males and 16 and 17 year old females are the most vulnerable to poverty, with 9 males (39.1%) and 4 females (44.4%) in their respective age groups living below the poverty level.
| Age Bracket | Male | Female |
| Under 5 Years | 0 (0.0%) | 34 (44.2%) |
| 5 Years | 0 (0.0%) | 0 (0.0%) |
| 6 to 11 Years | 9 (39.1%) | 7 (25.9%) |
| 12 to 14 Years | 0 (0.0%) | 0 (0.0%) |
| 15 Years | 0 (0.0%) | 0 (0.0%) |
| 16 and 17 Years | 3 (25.0%) | 4 (44.4%) |
| 18 to 24 Years | 0 (0.0%) | 1 (4.5%) |
| 25 to 34 Years | 0 (0.0%) | 7 (5.2%) |
| 35 to 44 Years | 0 (0.0%) | 2 (7.1%) |
| 45 to 54 Years | 2 (8.7%) | 0 (0.0%) |
| 55 to 64 Years | 0 (0.0%) | 0 (0.0%) |
| 65 to 74 Years | 0 (0.0%) | 0 (0.0%) |
| 75 Years and over | 0 (0.0%) | 1 (3.1%) |
| Total | 14 (3.1%) | 56 (14.2%) |
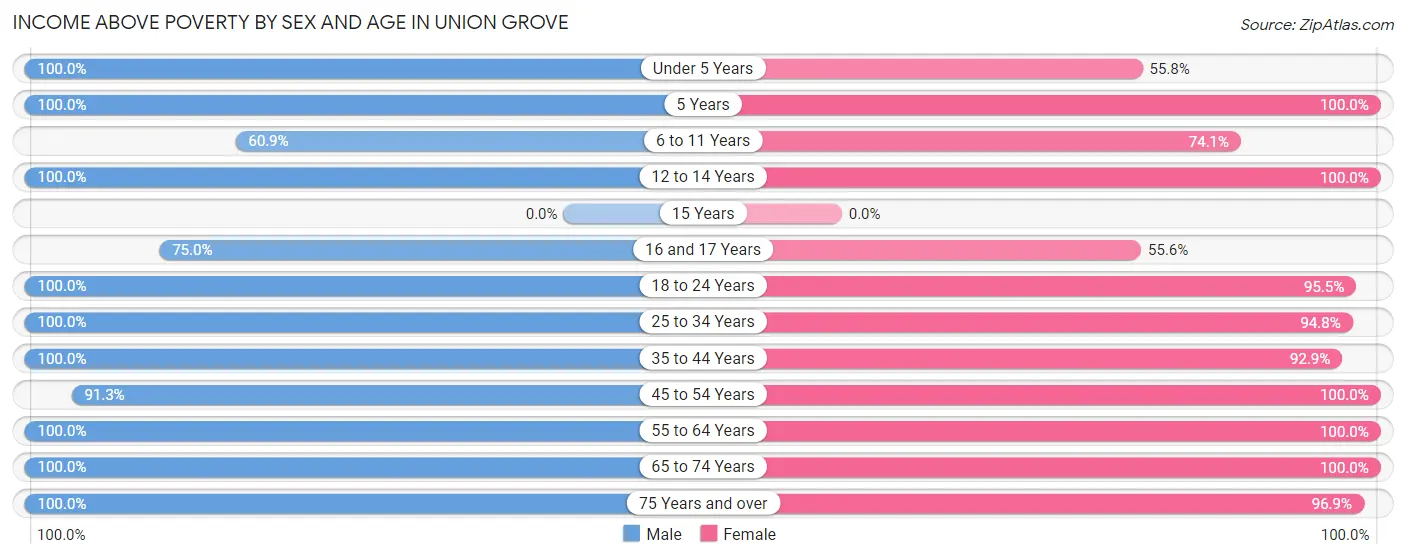
Income Above Poverty by Sex and Age in Union Grove
According to the poverty statistics in Union Grove, males aged under 5 years and females aged 5 years are the age groups that are most secure financially, with 100.0% of males and 100.0% of females in these age groups living above the poverty line.
| Age Bracket | Male | Female |
| Under 5 Years | 102 (100.0%) | 43 (55.8%) |
| 5 Years | 13 (100.0%) | 1 (100.0%) |
| 6 to 11 Years | 14 (60.9%) | 20 (74.1%) |
| 12 to 14 Years | 14 (100.0%) | 18 (100.0%) |
| 15 Years | 0 (0.0%) | 0 (0.0%) |
| 16 and 17 Years | 9 (75.0%) | 5 (55.6%) |
| 18 to 24 Years | 23 (100.0%) | 21 (95.5%) |
| 25 to 34 Years | 148 (100.0%) | 127 (94.8%) |
| 35 to 44 Years | 27 (100.0%) | 26 (92.9%) |
| 45 to 54 Years | 21 (91.3%) | 24 (100.0%) |
| 55 to 64 Years | 24 (100.0%) | 12 (100.0%) |
| 65 to 74 Years | 10 (100.0%) | 10 (100.0%) |
| 75 Years and over | 31 (100.0%) | 31 (96.9%) |
| Total | 436 (96.9%) | 338 (85.8%) |
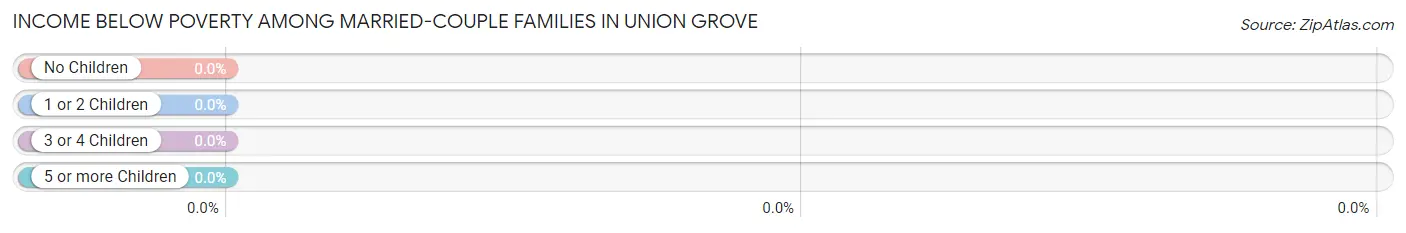
Income Below Poverty Among Married-Couple Families in Union Grove
| Children | Above Poverty | Below Poverty |
| No Children | 53 (100.0%) | 0 (0.0%) |
| 1 or 2 Children | 142 (100.0%) | 0 (0.0%) |
| 3 or 4 Children | 9 (100.0%) | 0 (0.0%) |
| 5 or more Children | 0 (0.0%) | 0 (0.0%) |
| Total | 204 (100.0%) | 0 (0.0%) |
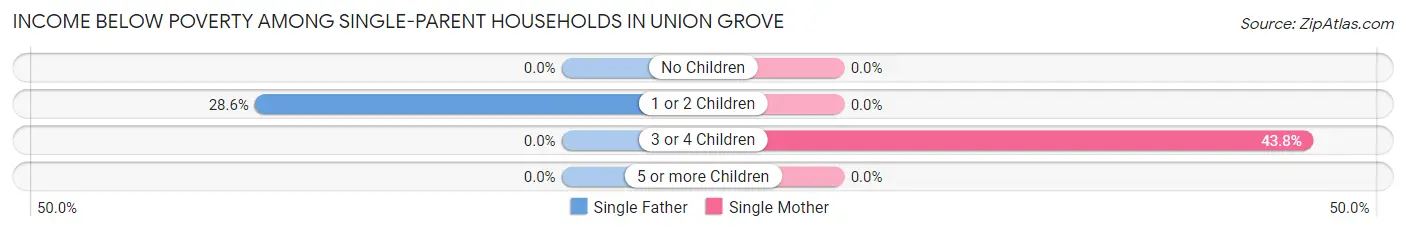
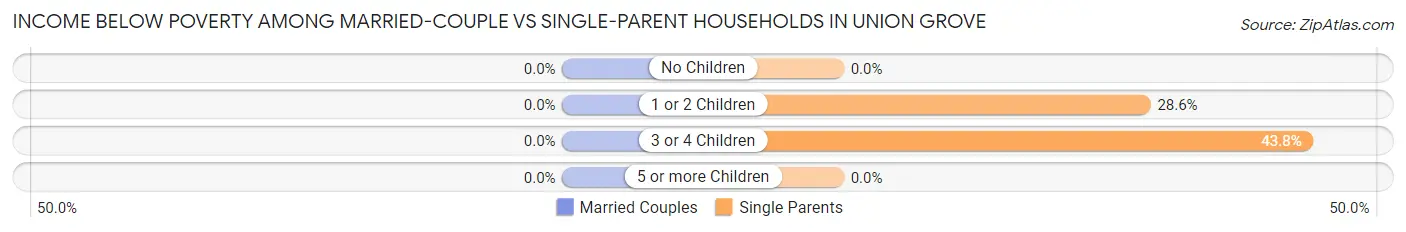
Income Below Poverty Among Single-Parent Households in Union Grove
According to the poverty data in Union Grove, 8.0% or 2 single-father households and 31.8% or 7 single-mother households are living below the poverty line. Among single-father households, those with 1 or 2 children have the highest poverty rate, with 2 households (28.6%) experiencing poverty. Likewise, among single-mother households, those with 3 or 4 children have the highest poverty rate, with 7 households (43.8%) falling below the poverty line.
| Children | Single Father | Single Mother |
| No Children | 0 (0.0%) | 0 (0.0%) |
| 1 or 2 Children | 2 (28.6%) | 0 (0.0%) |
| 3 or 4 Children | 0 (0.0%) | 7 (43.8%) |
| 5 or more Children | 0 (0.0%) | 0 (0.0%) |
| Total | 2 (8.0%) | 7 (31.8%) |
Income Below Poverty Among Married-Couple vs Single-Parent Households in Union Grove
| Children | Married-Couple Families | Single-Parent Households |
| No Children | 0 (0.0%) | 0 (0.0%) |
| 1 or 2 Children | 0 (0.0%) | 2 (28.6%) |
| 3 or 4 Children | 0 (0.0%) | 7 (43.8%) |
| 5 or more Children | 0 (0.0%) | 0 (0.0%) |
| Total | 0 (0.0%) | 9 (19.2%) |
Employment Characteristics in Union Grove
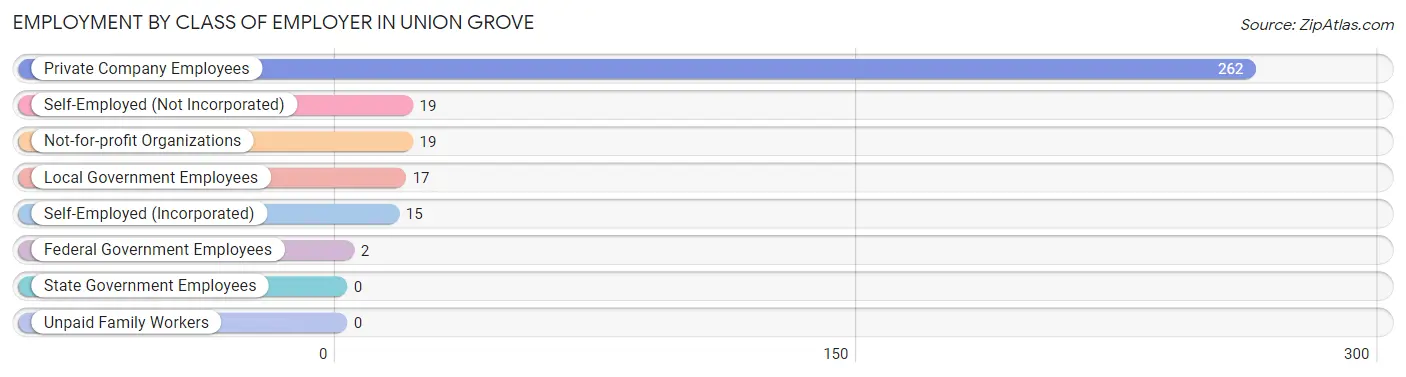
Employment by Class of Employer in Union Grove
Among the 334 employed individuals in Union Grove, private company employees (262 | 78.4%), self-employed (not incorporated) (19 | 5.7%), and not-for-profit organizations (19 | 5.7%) make up the most common classes of employment.
| Employer Class | # Employees | % Employees |
| Private Company Employees | 262 | 78.4% |
| Self-Employed (Incorporated) | 15 | 4.5% |
| Self-Employed (Not Incorporated) | 19 | 5.7% |
| Not-for-profit Organizations | 19 | 5.7% |
| Local Government Employees | 17 | 5.1% |
| State Government Employees | 0 | 0.0% |
| Federal Government Employees | 2 | 0.6% |
| Unpaid Family Workers | 0 | 0.0% |
| Total | 334 | 100.0% |
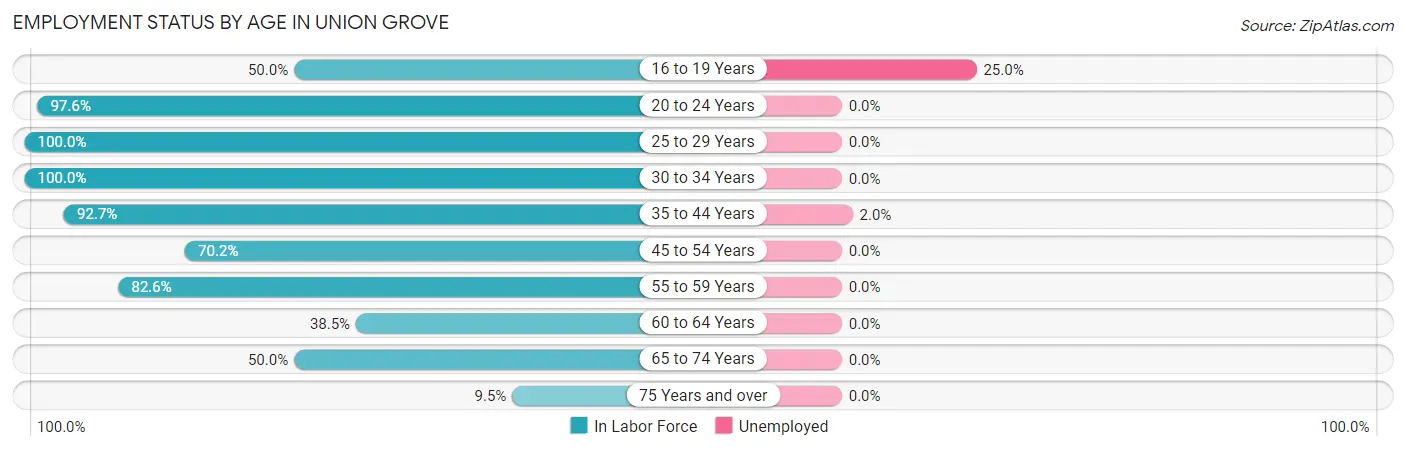
Employment Status by Age in Union Grove
According to the labor force statistics for Union Grove, out of the total population over 16 years of age (569), 80.7% or 459 individuals are in the labor force, with 0.9% or 4 of them unemployed. The age group with the highest labor force participation rate is 25 to 29 years, with 100.0% or 247 individuals in the labor force. Within the labor force, the 16 to 19 years age range has the highest percentage of unemployed individuals, with 25.0% or 3 of them being unemployed.
| Age Bracket | In Labor Force | Unemployed |
| 16 to 19 Years | 12 (50.0%) | 3 (25.0%) |
| 20 to 24 Years | 41 (97.6%) | 0 (0.0%) |
| 25 to 29 Years | 247 (100.0%) | 0 (0.0%) |
| 30 to 34 Years | 35 (100.0%) | 0 (0.0%) |
| 35 to 44 Years | 51 (92.7%) | 1 (2.0%) |
| 45 to 54 Years | 33 (70.2%) | 0 (0.0%) |
| 55 to 59 Years | 19 (82.6%) | 0 (0.0%) |
| 60 to 64 Years | 5 (38.5%) | 0 (0.0%) |
| 65 to 74 Years | 10 (50.0%) | 0 (0.0%) |
| 75 Years and over | 6 (9.5%) | 0 (0.0%) |
| Total | 459 (80.7%) | 4 (0.9%) |
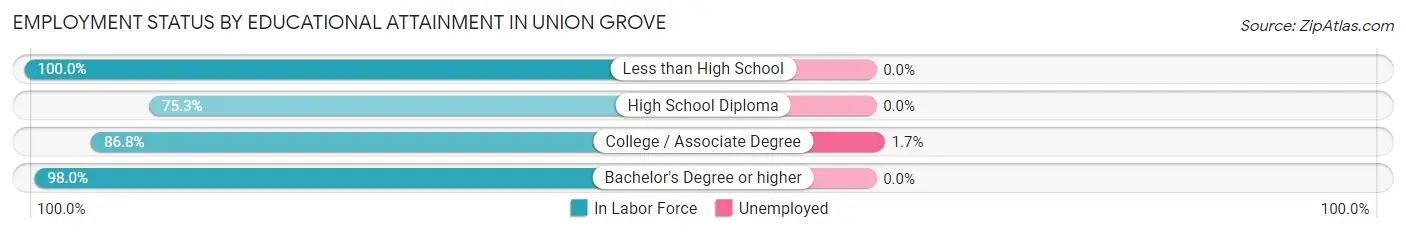
Employment Status by Educational Attainment in Union Grove
According to labor force statistics for Union Grove, 92.9% of individuals (390) out of the total population between 25 and 64 years of age (420) are in the labor force, with 0.3% or 1 of them being unemployed. The group with the highest labor force participation rate are those with the educational attainment of less than high school, with 100.0% or 130 individuals in the labor force. Within the labor force, individuals with college / associate degree education have the highest percentage of unemployment, with 1.7% or 1 of them being unemployed.
| Educational Attainment | In Labor Force | Unemployed |
| Less than High School | 130 (100.0%) | 0 (0.0%) |
| High School Diploma | 55 (75.3%) | 0 (0.0%) |
| College / Associate Degree | 59 (86.8%) | 1 (1.7%) |
| Bachelor's Degree or higher | 146 (98.0%) | 0 (0.0%) |
| Total | 390 (92.9%) | 1 (0.3%) |
Employment Occupations by Sex in Union Grove
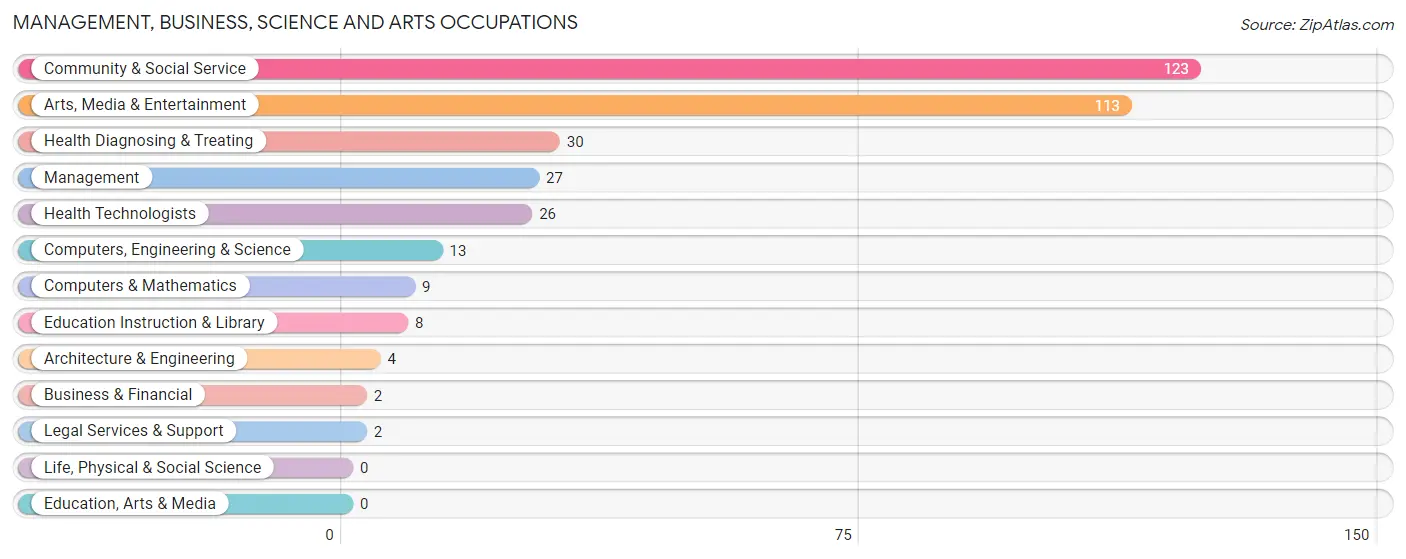
Management, Business, Science and Arts Occupations
The most common Management, Business, Science and Arts occupations in Union Grove are Community & Social Service (123 | 27.0%), Arts, Media & Entertainment (113 | 24.8%), Health Diagnosing & Treating (30 | 6.6%), Management (27 | 5.9%), and Health Technologists (26 | 5.7%).
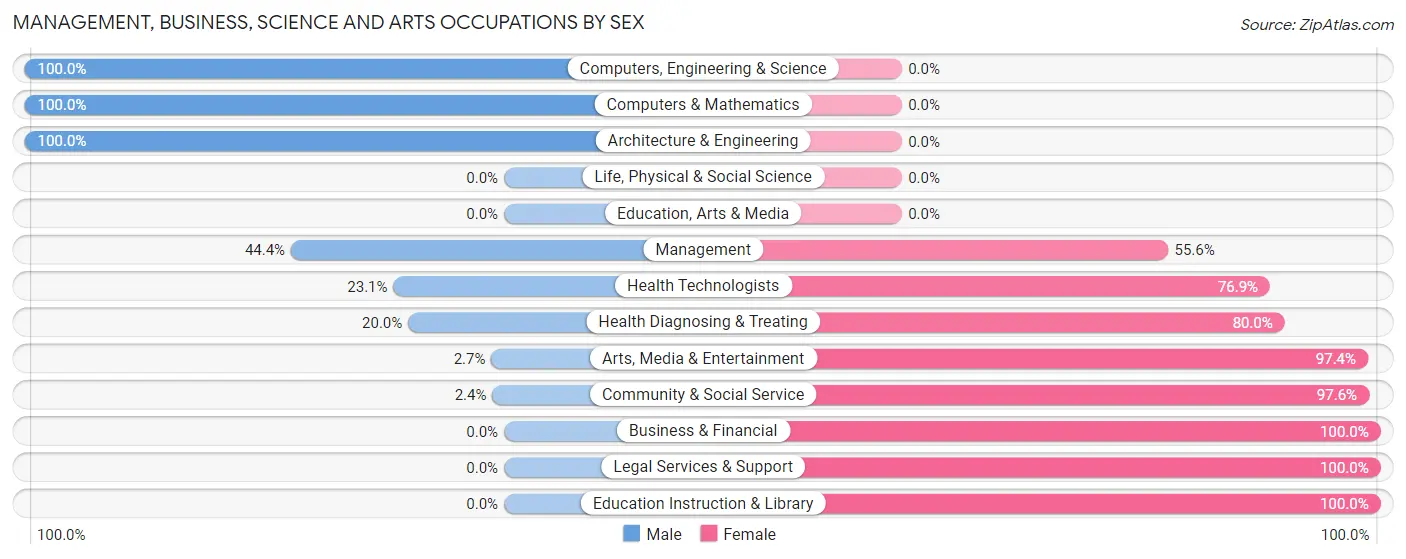
Management, Business, Science and Arts Occupations by Sex
Within the Management, Business, Science and Arts occupations in Union Grove, the most male-oriented occupations are Computers, Engineering & Science (100.0%), Computers & Mathematics (100.0%), and Architecture & Engineering (100.0%), while the most female-oriented occupations are Business & Financial (100.0%), Legal Services & Support (100.0%), and Education Instruction & Library (100.0%).
| Occupation | Male | Female |
| Management | 12 (44.4%) | 15 (55.6%) |
| Business & Financial | 0 (0.0%) | 2 (100.0%) |
| Computers, Engineering & Science | 13 (100.0%) | 0 (0.0%) |
| Computers & Mathematics | 9 (100.0%) | 0 (0.0%) |
| Architecture & Engineering | 4 (100.0%) | 0 (0.0%) |
| Life, Physical & Social Science | 0 (0.0%) | 0 (0.0%) |
| Community & Social Service | 3 (2.4%) | 120 (97.6%) |
| Education, Arts & Media | 0 (0.0%) | 0 (0.0%) |
| Legal Services & Support | 0 (0.0%) | 2 (100.0%) |
| Education Instruction & Library | 0 (0.0%) | 8 (100.0%) |
| Arts, Media & Entertainment | 3 (2.6%) | 110 (97.4%) |
| Health Diagnosing & Treating | 6 (20.0%) | 24 (80.0%) |
| Health Technologists | 6 (23.1%) | 20 (76.9%) |
| Total (Category) | 34 (17.4%) | 161 (82.6%) |
| Total (Overall) | 251 (55.2%) | 204 (44.8%) |
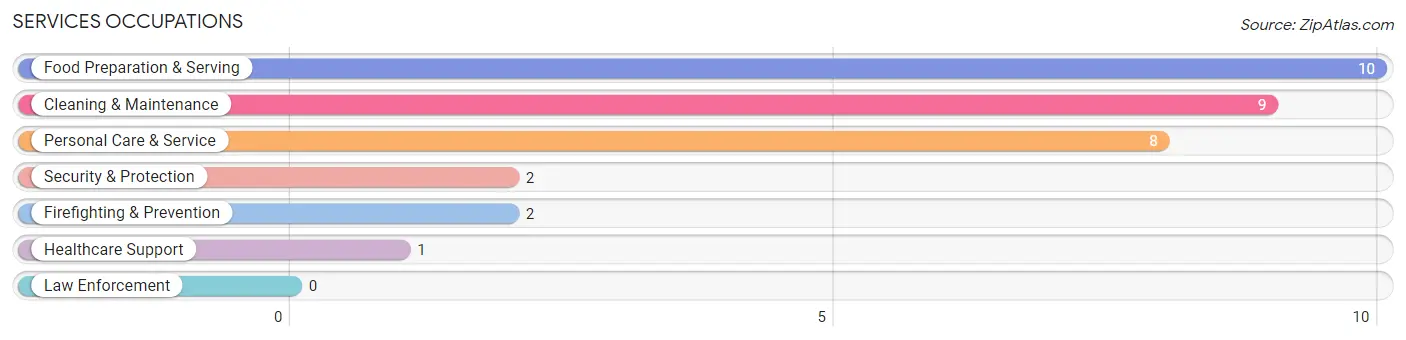
Services Occupations
The most common Services occupations in Union Grove are Food Preparation & Serving (10 | 2.2%), Cleaning & Maintenance (9 | 2.0%), Personal Care & Service (8 | 1.8%), Security & Protection (2 | 0.4%), and Firefighting & Prevention (2 | 0.4%).
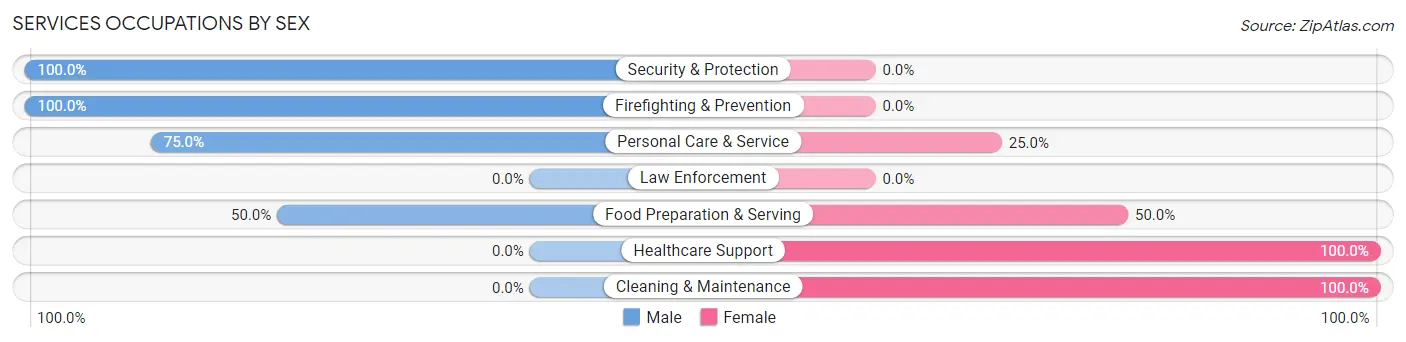
Services Occupations by Sex
Within the Services occupations in Union Grove, the most male-oriented occupations are Security & Protection (100.0%), Firefighting & Prevention (100.0%), and Personal Care & Service (75.0%), while the most female-oriented occupations are Healthcare Support (100.0%), Cleaning & Maintenance (100.0%), and Food Preparation & Serving (50.0%).
| Occupation | Male | Female |
| Healthcare Support | 0 (0.0%) | 1 (100.0%) |
| Security & Protection | 2 (100.0%) | 0 (0.0%) |
| Firefighting & Prevention | 2 (100.0%) | 0 (0.0%) |
| Law Enforcement | 0 (0.0%) | 0 (0.0%) |
| Food Preparation & Serving | 5 (50.0%) | 5 (50.0%) |
| Cleaning & Maintenance | 0 (0.0%) | 9 (100.0%) |
| Personal Care & Service | 6 (75.0%) | 2 (25.0%) |
| Total (Category) | 13 (43.3%) | 17 (56.7%) |
| Total (Overall) | 251 (55.2%) | 204 (44.8%) |
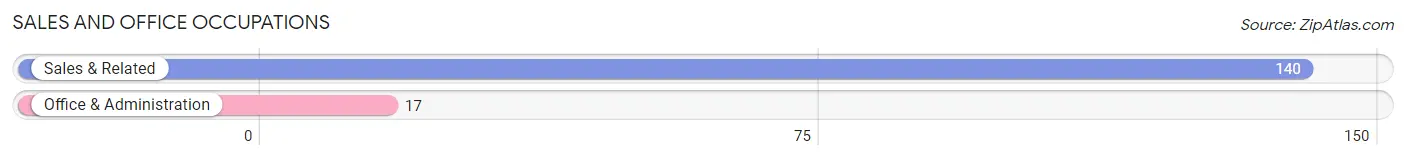
Sales and Office Occupations
The most common Sales and Office occupations in Union Grove are Sales & Related (140 | 30.8%), and Office & Administration (17 | 3.7%).
Sales and Office Occupations by Sex
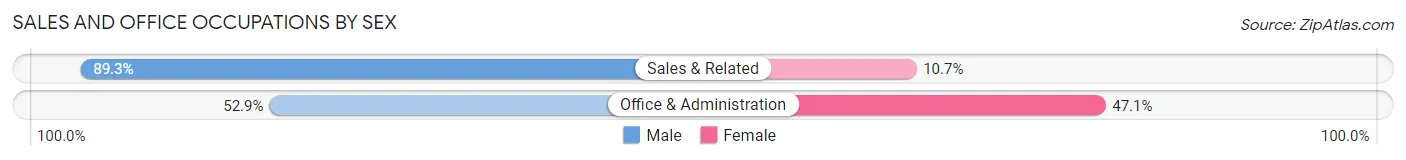
| Occupation | Male | Female |
| Sales & Related | 125 (89.3%) | 15 (10.7%) |
| Office & Administration | 9 (52.9%) | 8 (47.1%) |
| Total (Category) | 134 (85.4%) | 23 (14.6%) |
| Total (Overall) | 251 (55.2%) | 204 (44.8%) |
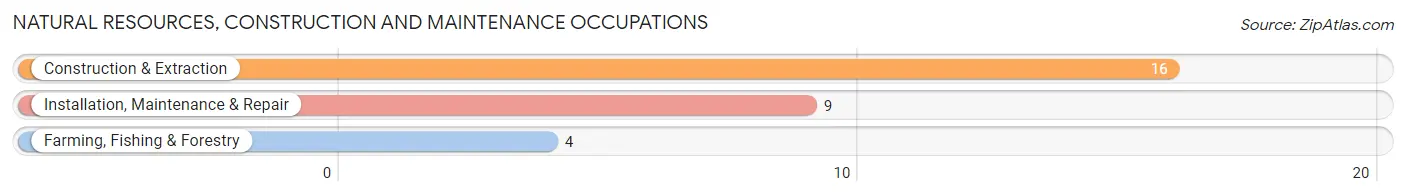
Natural Resources, Construction and Maintenance Occupations
The most common Natural Resources, Construction and Maintenance occupations in Union Grove are Construction & Extraction (16 | 3.5%), Installation, Maintenance & Repair (9 | 2.0%), and Farming, Fishing & Forestry (4 | 0.9%).
Natural Resources, Construction and Maintenance Occupations by Sex
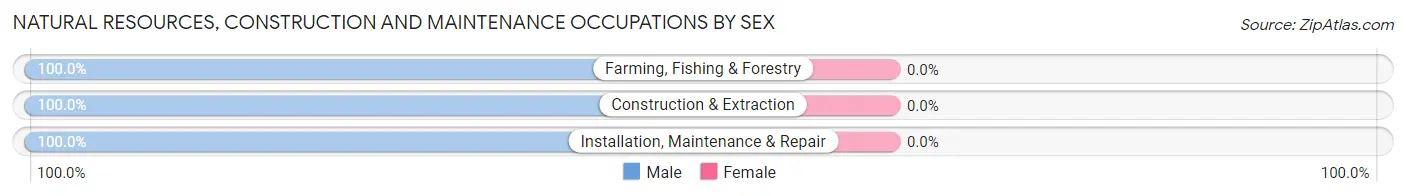
| Occupation | Male | Female |
| Farming, Fishing & Forestry | 4 (100.0%) | 0 (0.0%) |
| Construction & Extraction | 16 (100.0%) | 0 (0.0%) |
| Installation, Maintenance & Repair | 9 (100.0%) | 0 (0.0%) |
| Total (Category) | 29 (100.0%) | 0 (0.0%) |
| Total (Overall) | 251 (55.2%) | 204 (44.8%) |
Production, Transportation and Moving Occupations
The most common Production, Transportation and Moving occupations in Union Grove are Material Moving (25 | 5.5%), Production (13 | 2.9%), and Transportation (6 | 1.3%).
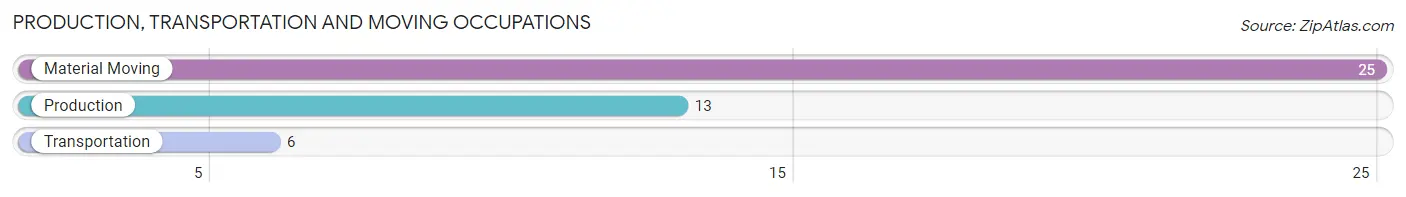
Production, Transportation and Moving Occupations by Sex
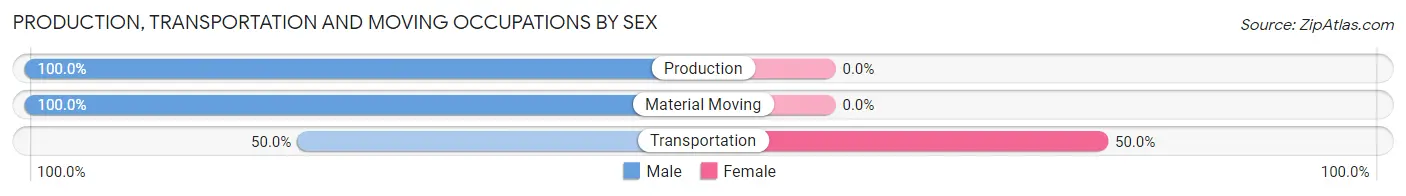
| Occupation | Male | Female |
| Production | 13 (100.0%) | 0 (0.0%) |
| Transportation | 3 (50.0%) | 3 (50.0%) |
| Material Moving | 25 (100.0%) | 0 (0.0%) |
| Total (Category) | 41 (93.2%) | 3 (6.8%) |
| Total (Overall) | 251 (55.2%) | 204 (44.8%) |
Employment Industries by Sex in Union Grove
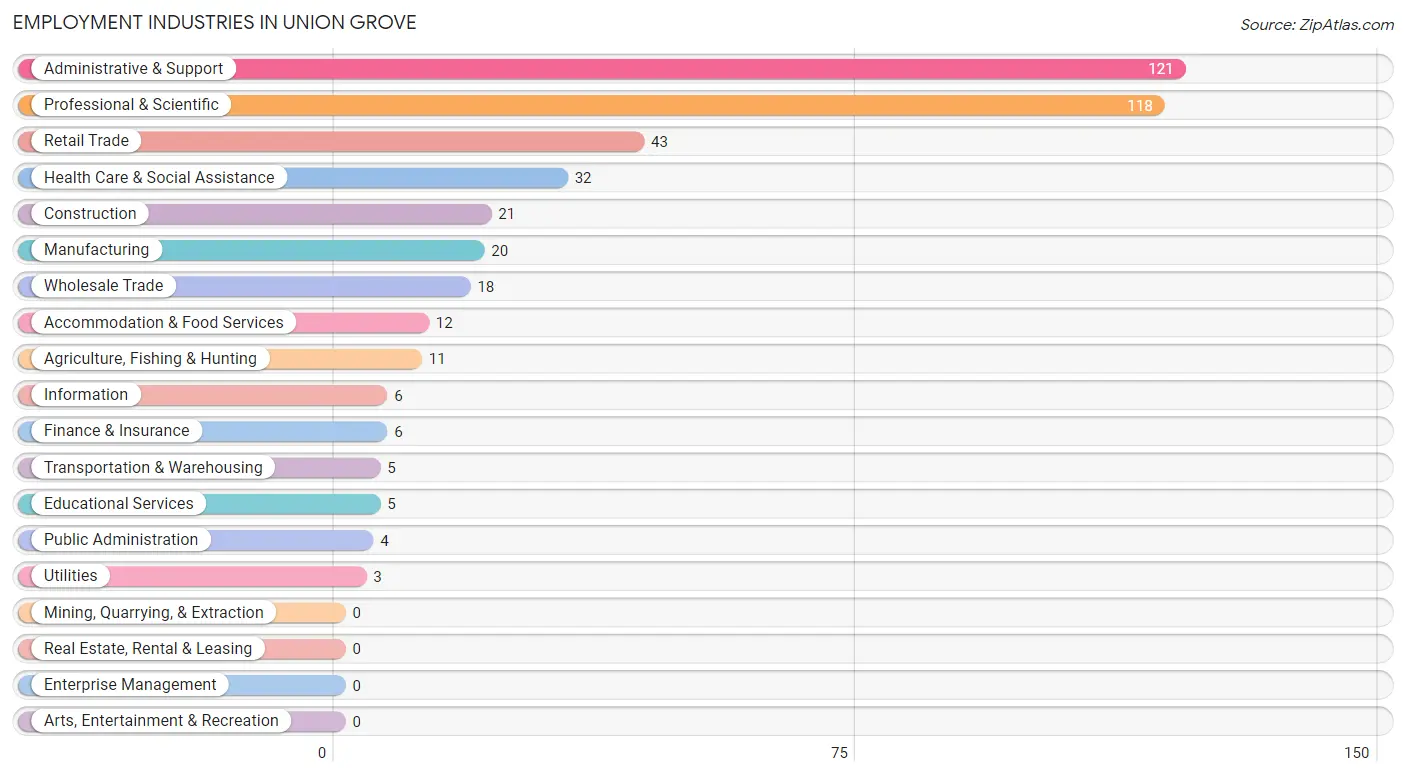
Employment Industries in Union Grove
The major employment industries in Union Grove include Administrative & Support (121 | 26.6%), Professional & Scientific (118 | 25.9%), Retail Trade (43 | 9.5%), Health Care & Social Assistance (32 | 7.0%), and Construction (21 | 4.6%).
Employment Industries by Sex in Union Grove
The Union Grove industries that see more men than women are Agriculture, Fishing & Hunting (100.0%), Construction (100.0%), and Wholesale Trade (100.0%), whereas the industries that tend to have a higher number of women are Educational Services (100.0%), Professional & Scientific (94.9%), and Health Care & Social Assistance (81.2%).
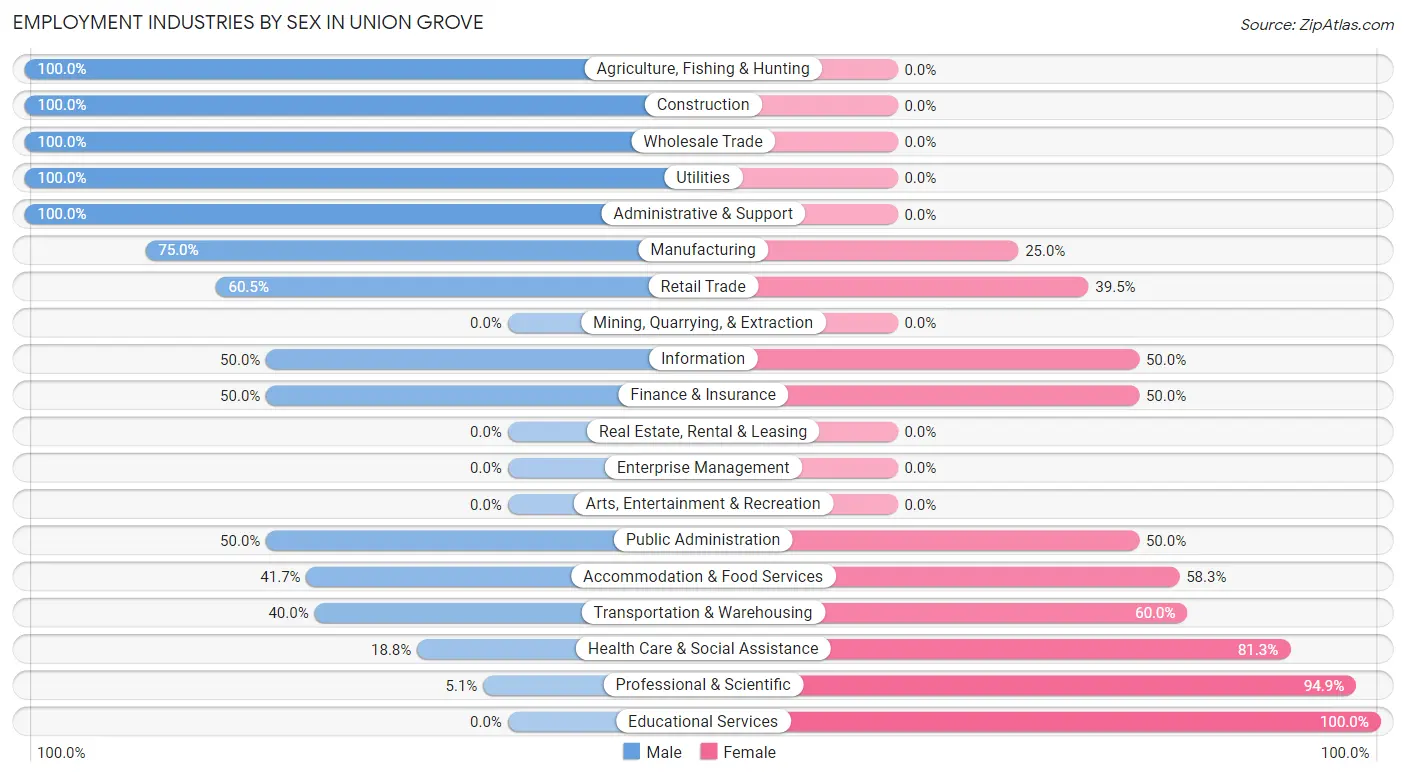
| Industry | Male | Female |
| Agriculture, Fishing & Hunting | 11 (100.0%) | 0 (0.0%) |
| Mining, Quarrying, & Extraction | 0 (0.0%) | 0 (0.0%) |
| Construction | 21 (100.0%) | 0 (0.0%) |
| Manufacturing | 15 (75.0%) | 5 (25.0%) |
| Wholesale Trade | 18 (100.0%) | 0 (0.0%) |
| Retail Trade | 26 (60.5%) | 17 (39.5%) |
| Transportation & Warehousing | 2 (40.0%) | 3 (60.0%) |
| Utilities | 3 (100.0%) | 0 (0.0%) |
| Information | 3 (50.0%) | 3 (50.0%) |
| Finance & Insurance | 3 (50.0%) | 3 (50.0%) |
| Real Estate, Rental & Leasing | 0 (0.0%) | 0 (0.0%) |
| Professional & Scientific | 6 (5.1%) | 112 (94.9%) |
| Enterprise Management | 0 (0.0%) | 0 (0.0%) |
| Administrative & Support | 121 (100.0%) | 0 (0.0%) |
| Educational Services | 0 (0.0%) | 5 (100.0%) |
| Health Care & Social Assistance | 6 (18.8%) | 26 (81.2%) |
| Arts, Entertainment & Recreation | 0 (0.0%) | 0 (0.0%) |
| Accommodation & Food Services | 5 (41.7%) | 7 (58.3%) |
| Public Administration | 2 (50.0%) | 2 (50.0%) |
| Total | 251 (55.2%) | 204 (44.8%) |
Education in Union Grove
School Enrollment in Union Grove
The most common levels of schooling among the 124 students in Union Grove are middle school (45 | 36.3%), elementary school (32 | 25.8%), and high school (21 | 16.9%).
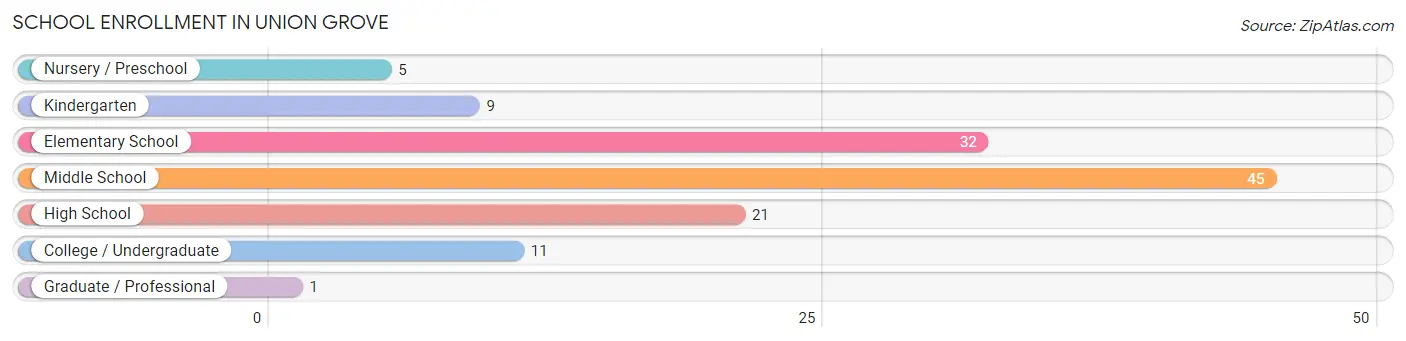
| School Level | # Students | % Students |
| Nursery / Preschool | 5 | 4.0% |
| Kindergarten | 9 | 7.3% |
| Elementary School | 32 | 25.8% |
| Middle School | 45 | 36.3% |
| High School | 21 | 16.9% |
| College / Undergraduate | 11 | 8.9% |
| Graduate / Professional | 1 | 0.8% |
| Total | 124 | 100.0% |
School Enrollment by Age by Funding Source in Union Grove
Out of a total of 124 students who are enrolled in schools in Union Grove, 18 (14.5%) attend a private institution, while the remaining 106 (85.5%) are enrolled in public schools. The age group of 35 years and over has the highest likelihood of being enrolled in private schools, with 1 (100.0% in the age bracket) enrolled. Conversely, the age group of 25 to 34 year olds has the lowest likelihood of being enrolled in a private school, with 5 (100.0% in the age bracket) attending a public institution.
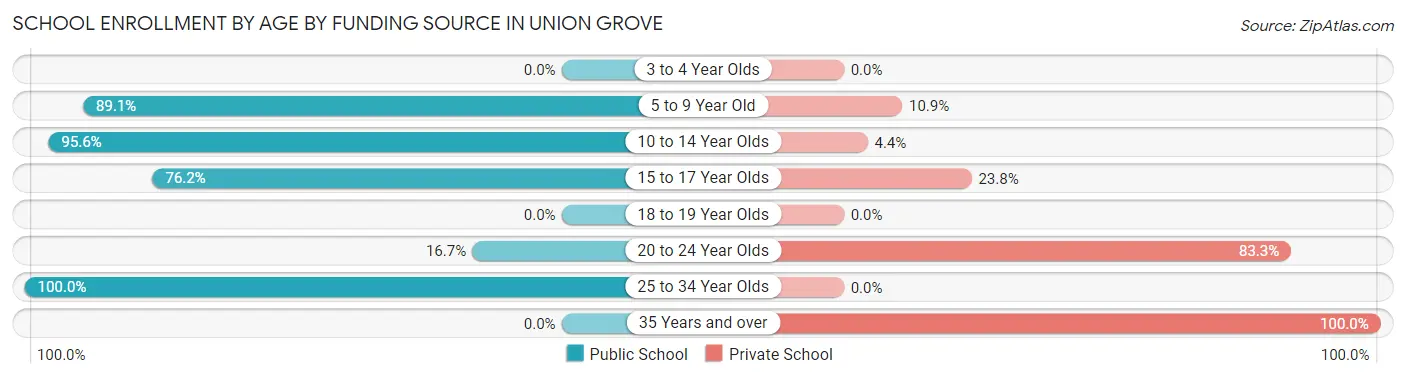
| Age Bracket | Public School | Private School |
| 3 to 4 Year Olds | 0 (0.0%) | 0 (0.0%) |
| 5 to 9 Year Old | 41 (89.1%) | 5 (10.9%) |
| 10 to 14 Year Olds | 43 (95.6%) | 2 (4.4%) |
| 15 to 17 Year Olds | 16 (76.2%) | 5 (23.8%) |
| 18 to 19 Year Olds | 0 (0.0%) | 0 (0.0%) |
| 20 to 24 Year Olds | 1 (16.7%) | 5 (83.3%) |
| 25 to 34 Year Olds | 5 (100.0%) | 0 (0.0%) |
| 35 Years and over | 0 (0.0%) | 1 (100.0%) |
| Total | 106 (85.5%) | 18 (14.5%) |
Educational Attainment by Field of Study in Union Grove
Business (120 | 75.9%), science & technology (13 | 8.2%), bio, nature & agricultural (7 | 4.4%), arts & humanities (5 | 3.2%), and engineering (4 | 2.5%) are the most common fields of study among 158 individuals in Union Grove who have obtained a bachelor's degree or higher.
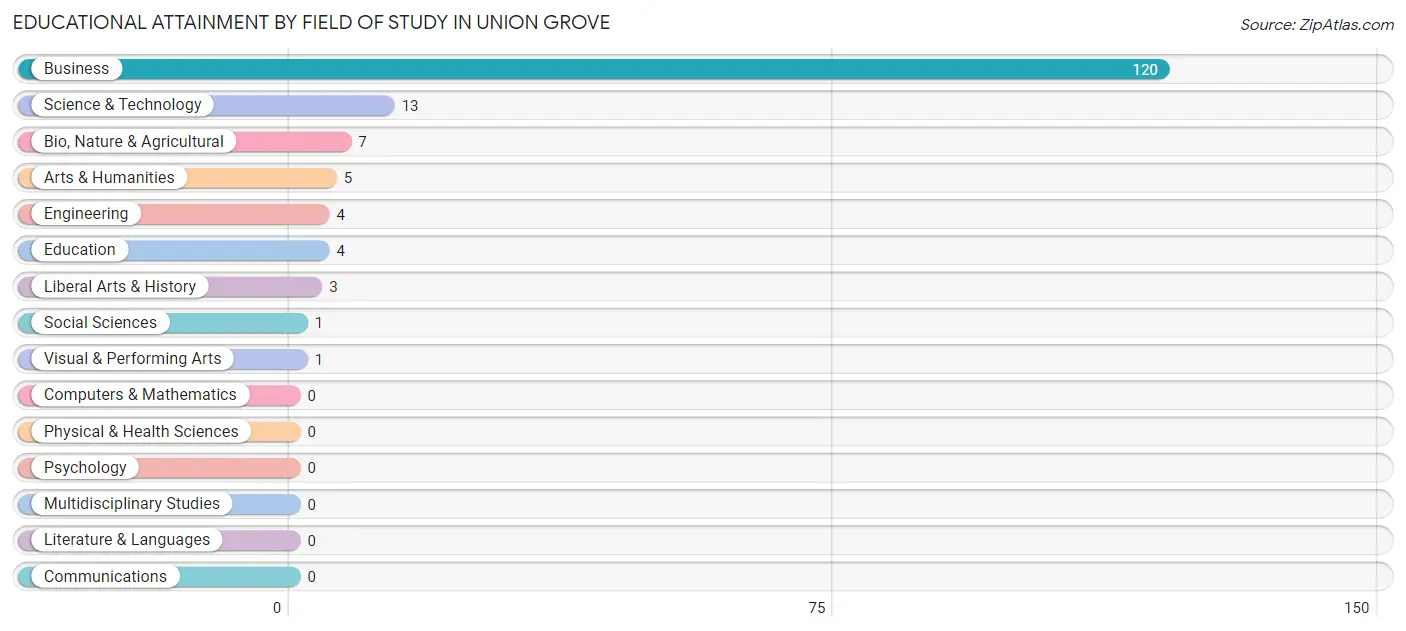
| Field of Study | # Graduates | % Graduates |
| Computers & Mathematics | 0 | 0.0% |
| Bio, Nature & Agricultural | 7 | 4.4% |
| Physical & Health Sciences | 0 | 0.0% |
| Psychology | 0 | 0.0% |
| Social Sciences | 1 | 0.6% |
| Engineering | 4 | 2.5% |
| Multidisciplinary Studies | 0 | 0.0% |
| Science & Technology | 13 | 8.2% |
| Business | 120 | 75.9% |
| Education | 4 | 2.5% |
| Literature & Languages | 0 | 0.0% |
| Liberal Arts & History | 3 | 1.9% |
| Visual & Performing Arts | 1 | 0.6% |
| Communications | 0 | 0.0% |
| Arts & Humanities | 5 | 3.2% |
| Total | 158 | 100.0% |
Transportation & Commute in Union Grove
Vehicle Availability by Sex in Union Grove
The most prevalent vehicle ownership categories in Union Grove are males with 2 vehicles (63, accounting for 48.5%) and females with 2 vehicles (23, making up 30.9%).
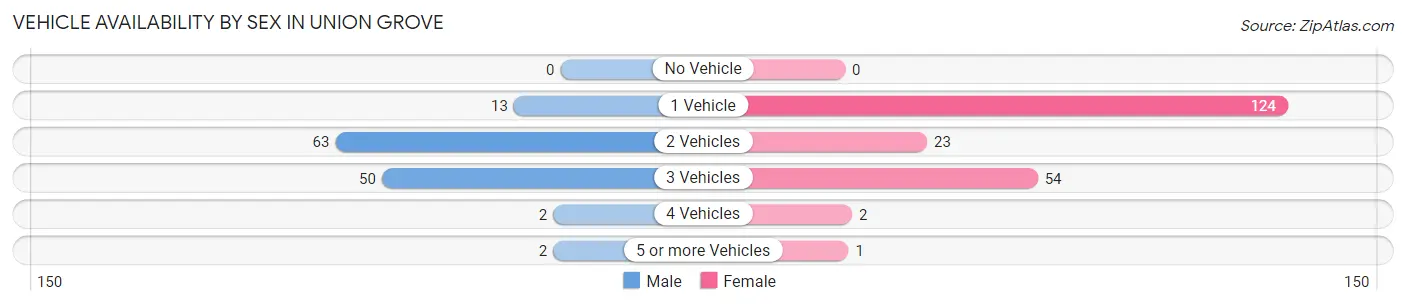
| Vehicles Available | Male | Female |
| No Vehicle | 0 (0.0%) | 0 (0.0%) |
| 1 Vehicle | 13 (10.0%) | 124 (60.8%) |
| 2 Vehicles | 63 (48.5%) | 23 (11.3%) |
| 3 Vehicles | 50 (38.5%) | 54 (26.5%) |
| 4 Vehicles | 2 (1.5%) | 2 (1.0%) |
| 5 or more Vehicles | 2 (1.5%) | 1 (0.5%) |
| Total | 130 (100.0%) | 204 (100.0%) |
Commute Time in Union Grove
The most frequently occuring commute durations in Union Grove are 10 to 14 minutes (120 commuters, 39.9%), 20 to 24 minutes (39 commuters, 13.0%), and 15 to 19 minutes (28 commuters, 9.3%).
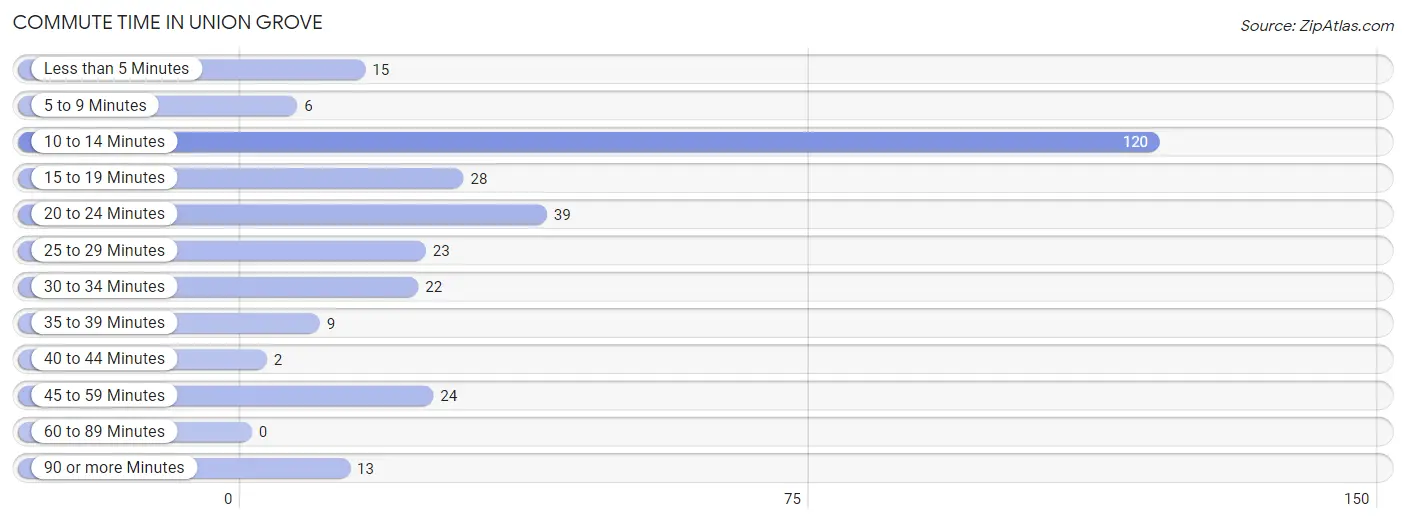
| Commute Time | # Commuters | % Commuters |
| Less than 5 Minutes | 15 | 5.0% |
| 5 to 9 Minutes | 6 | 2.0% |
| 10 to 14 Minutes | 120 | 39.9% |
| 15 to 19 Minutes | 28 | 9.3% |
| 20 to 24 Minutes | 39 | 13.0% |
| 25 to 29 Minutes | 23 | 7.6% |
| 30 to 34 Minutes | 22 | 7.3% |
| 35 to 39 Minutes | 9 | 3.0% |
| 40 to 44 Minutes | 2 | 0.7% |
| 45 to 59 Minutes | 24 | 8.0% |
| 60 to 89 Minutes | 0 | 0.0% |
| 90 or more Minutes | 13 | 4.3% |
Commute Time by Sex in Union Grove
The most common commute times in Union Grove are 25 to 29 minutes (18 commuters, 17.5%) for males and 10 to 14 minutes (113 commuters, 57.1%) for females.
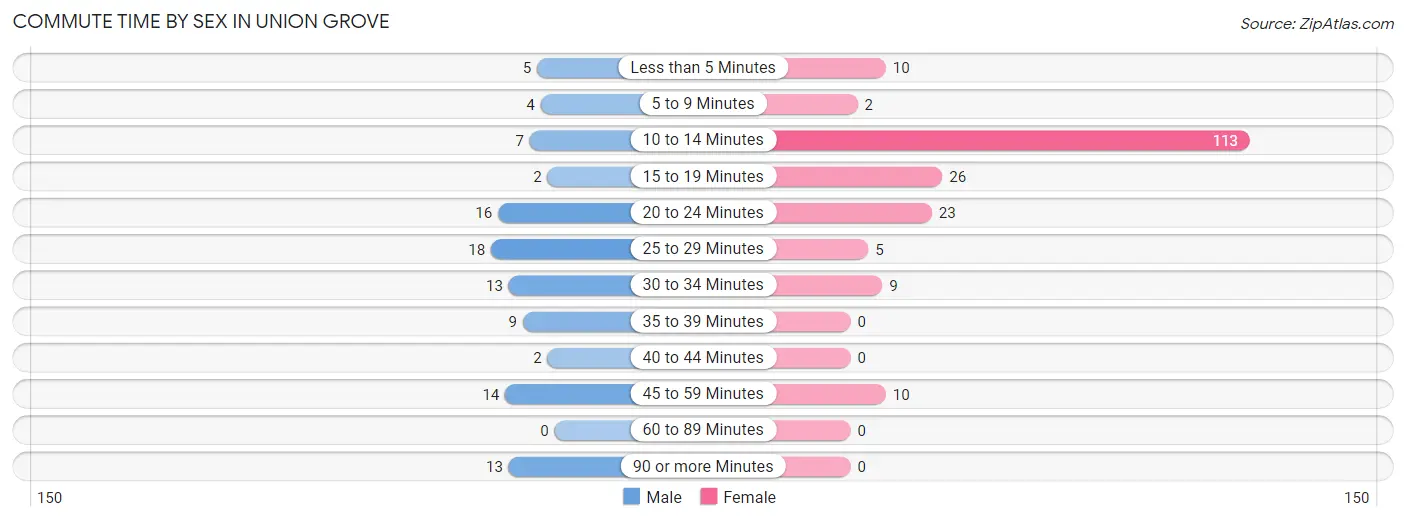
| Commute Time | Male | Female |
| Less than 5 Minutes | 5 (4.9%) | 10 (5.1%) |
| 5 to 9 Minutes | 4 (3.9%) | 2 (1.0%) |
| 10 to 14 Minutes | 7 (6.8%) | 113 (57.1%) |
| 15 to 19 Minutes | 2 (1.9%) | 26 (13.1%) |
| 20 to 24 Minutes | 16 (15.5%) | 23 (11.6%) |
| 25 to 29 Minutes | 18 (17.5%) | 5 (2.5%) |
| 30 to 34 Minutes | 13 (12.6%) | 9 (4.5%) |
| 35 to 39 Minutes | 9 (8.7%) | 0 (0.0%) |
| 40 to 44 Minutes | 2 (1.9%) | 0 (0.0%) |
| 45 to 59 Minutes | 14 (13.6%) | 10 (5.1%) |
| 60 to 89 Minutes | 0 (0.0%) | 0 (0.0%) |
| 90 or more Minutes | 13 (12.6%) | 0 (0.0%) |
Time of Departure to Work by Sex in Union Grove
The most frequent times of departure to work in Union Grove are 5:30 AM to 5:59 AM (17, 16.5%) for males and 5:30 AM to 5:59 AM (116, 58.6%) for females.
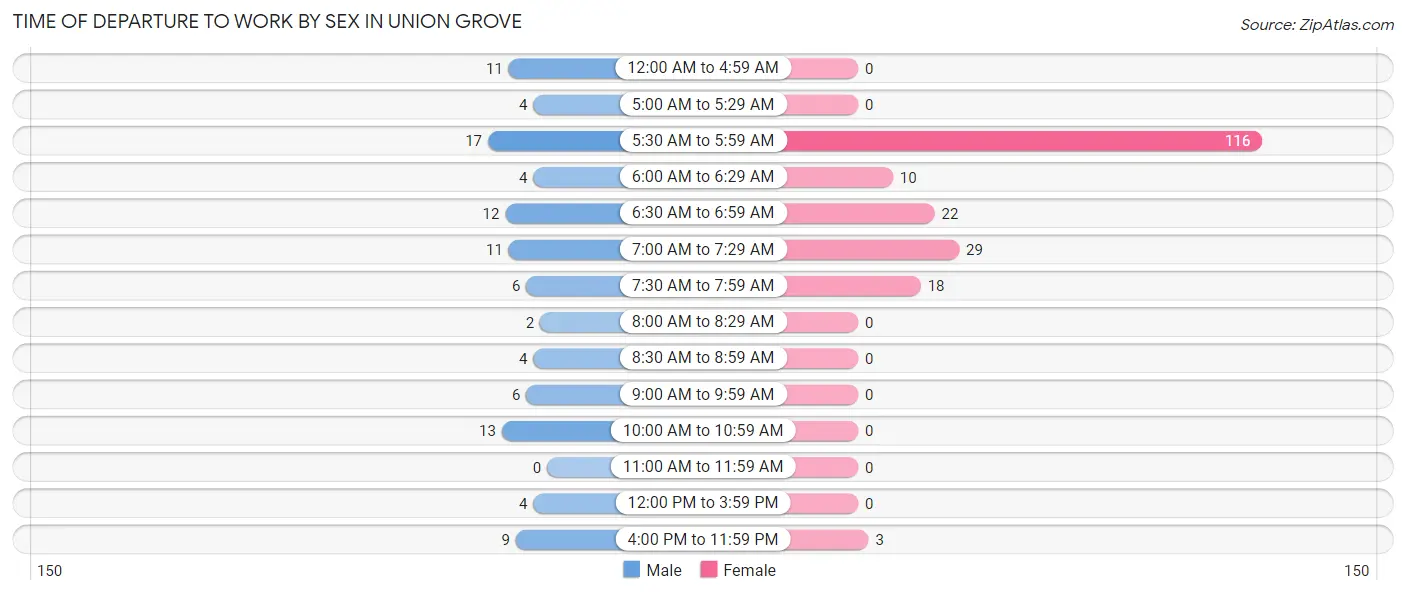
| Time of Departure | Male | Female |
| 12:00 AM to 4:59 AM | 11 (10.7%) | 0 (0.0%) |
| 5:00 AM to 5:29 AM | 4 (3.9%) | 0 (0.0%) |
| 5:30 AM to 5:59 AM | 17 (16.5%) | 116 (58.6%) |
| 6:00 AM to 6:29 AM | 4 (3.9%) | 10 (5.1%) |
| 6:30 AM to 6:59 AM | 12 (11.7%) | 22 (11.1%) |
| 7:00 AM to 7:29 AM | 11 (10.7%) | 29 (14.6%) |
| 7:30 AM to 7:59 AM | 6 (5.8%) | 18 (9.1%) |
| 8:00 AM to 8:29 AM | 2 (1.9%) | 0 (0.0%) |
| 8:30 AM to 8:59 AM | 4 (3.9%) | 0 (0.0%) |
| 9:00 AM to 9:59 AM | 6 (5.8%) | 0 (0.0%) |
| 10:00 AM to 10:59 AM | 13 (12.6%) | 0 (0.0%) |
| 11:00 AM to 11:59 AM | 0 (0.0%) | 0 (0.0%) |
| 12:00 PM to 3:59 PM | 4 (3.9%) | 0 (0.0%) |
| 4:00 PM to 11:59 PM | 9 (8.7%) | 3 (1.5%) |
| Total | 103 (100.0%) | 198 (100.0%) |
Housing Occupancy in Union Grove
Occupancy by Ownership in Union Grove
Of the total 273 dwellings in Union Grove, owner-occupied units account for 243 (89.0%), while renter-occupied units make up 30 (11.0%).
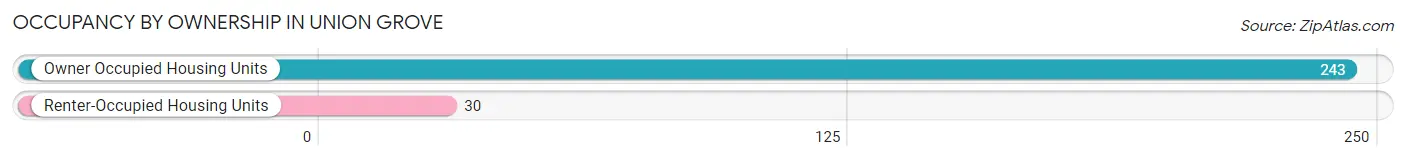
| Occupancy | # Housing Units | % Housing Units |
| Owner Occupied Housing Units | 243 | 89.0% |
| Renter-Occupied Housing Units | 30 | 11.0% |
| Total Occupied Housing Units | 273 | 100.0% |
Occupancy by Household Size in Union Grove
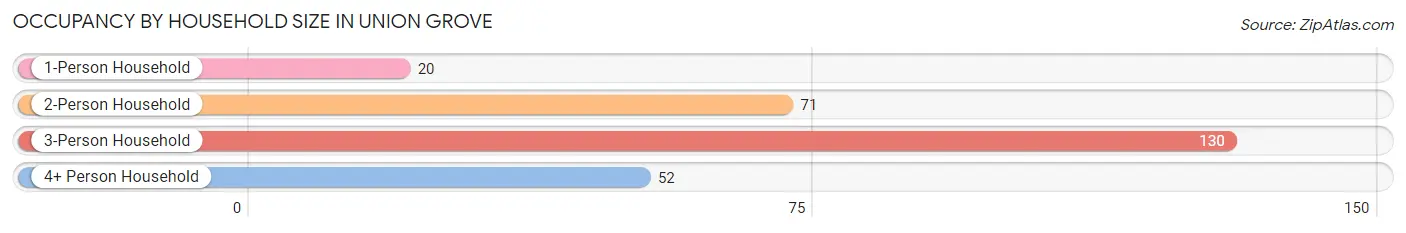
| Household Size | # Housing Units | % Housing Units |
| 1-Person Household | 20 | 7.3% |
| 2-Person Household | 71 | 26.0% |
| 3-Person Household | 130 | 47.6% |
| 4+ Person Household | 52 | 19.1% |
| Total Housing Units | 273 | 100.0% |
Occupancy by Ownership by Household Size in Union Grove
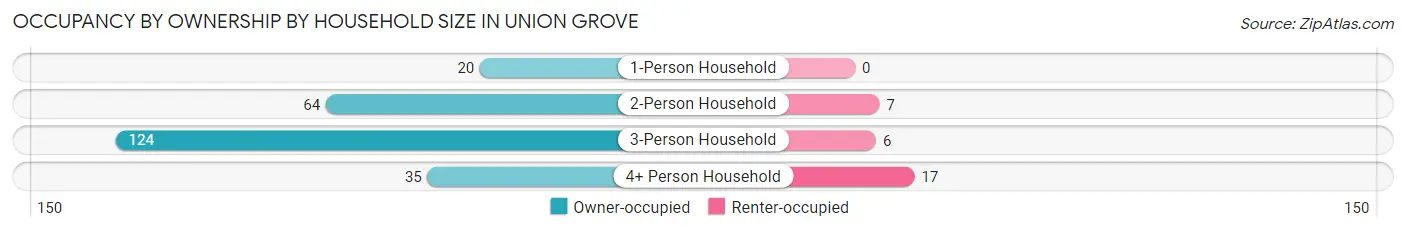
| Household Size | Owner-occupied | Renter-occupied |
| 1-Person Household | 20 (100.0%) | 0 (0.0%) |
| 2-Person Household | 64 (90.1%) | 7 (9.9%) |
| 3-Person Household | 124 (95.4%) | 6 (4.6%) |
| 4+ Person Household | 35 (67.3%) | 17 (32.7%) |
| Total Housing Units | 243 (89.0%) | 30 (11.0%) |
Occupancy by Educational Attainment in Union Grove
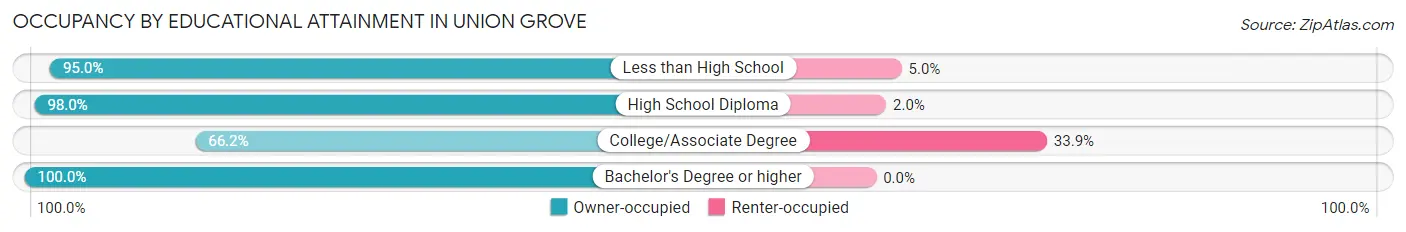
| Household Size | Owner-occupied | Renter-occupied |
| Less than High School | 132 (95.0%) | 7 (5.0%) |
| High School Diploma | 50 (98.0%) | 1 (2.0%) |
| College/Associate Degree | 43 (66.1%) | 22 (33.9%) |
| Bachelor's Degree or higher | 18 (100.0%) | 0 (0.0%) |
Occupancy by Age of Householder in Union Grove
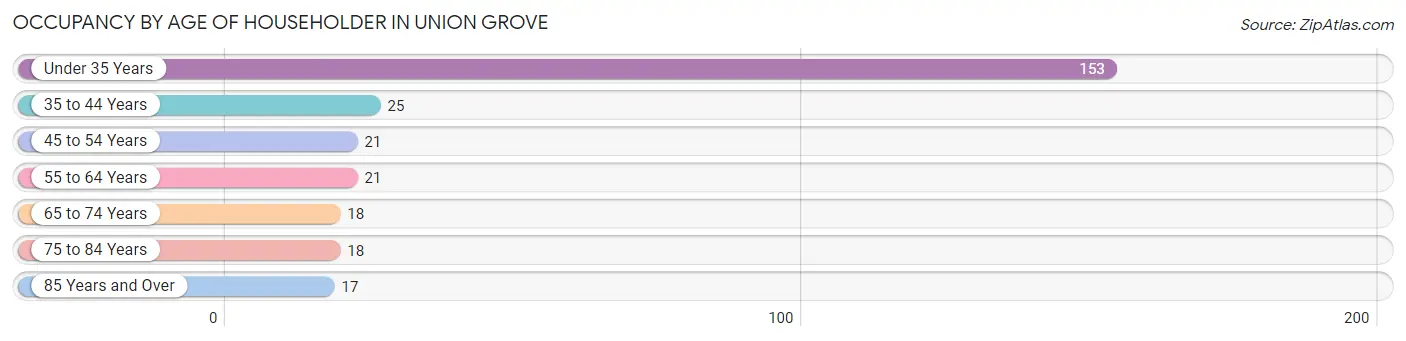
| Age Bracket | # Households | % Households |
| Under 35 Years | 153 | 56.0% |
| 35 to 44 Years | 25 | 9.2% |
| 45 to 54 Years | 21 | 7.7% |
| 55 to 64 Years | 21 | 7.7% |
| 65 to 74 Years | 18 | 6.6% |
| 75 to 84 Years | 18 | 6.6% |
| 85 Years and Over | 17 | 6.2% |
| Total | 273 | 100.0% |
Housing Finances in Union Grove
Median Income by Occupancy in Union Grove
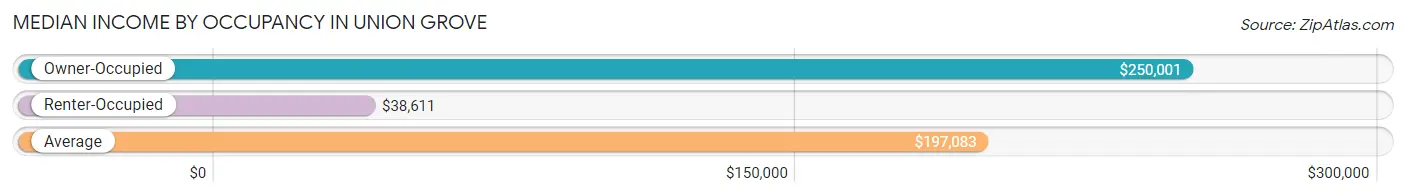
| Occupancy Type | # Households | Median Income |
| Owner-Occupied | 243 (89.0%) | $250,001 |
| Renter-Occupied | 30 (11.0%) | $38,611 |
| Average | 273 (100.0%) | $197,083 |
Occupancy by Householder Income Bracket in Union Grove
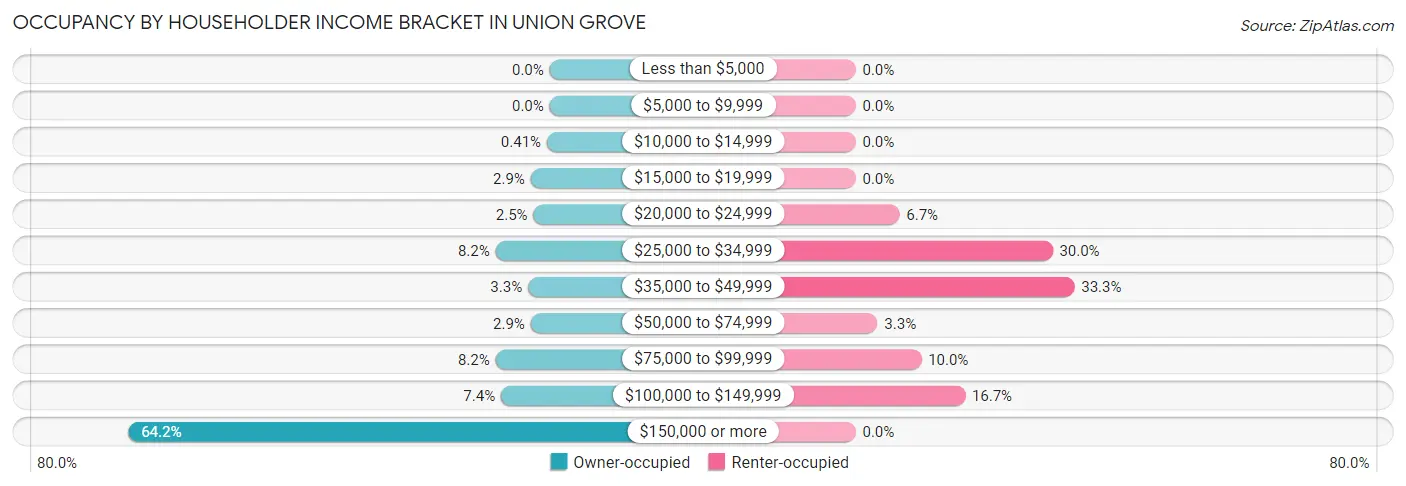
| Income Bracket | Owner-occupied | Renter-occupied |
| Less than $5,000 | 0 (0.0%) | 0 (0.0%) |
| $5,000 to $9,999 | 0 (0.0%) | 0 (0.0%) |
| $10,000 to $14,999 | 1 (0.4%) | 0 (0.0%) |
| $15,000 to $19,999 | 7 (2.9%) | 0 (0.0%) |
| $20,000 to $24,999 | 6 (2.5%) | 2 (6.7%) |
| $25,000 to $34,999 | 20 (8.2%) | 9 (30.0%) |
| $35,000 to $49,999 | 8 (3.3%) | 10 (33.3%) |
| $50,000 to $74,999 | 7 (2.9%) | 1 (3.3%) |
| $75,000 to $99,999 | 20 (8.2%) | 3 (10.0%) |
| $100,000 to $149,999 | 18 (7.4%) | 5 (16.7%) |
| $150,000 or more | 156 (64.2%) | 0 (0.0%) |
| Total | 243 (100.0%) | 30 (100.0%) |
Monthly Housing Cost Tiers in Union Grove
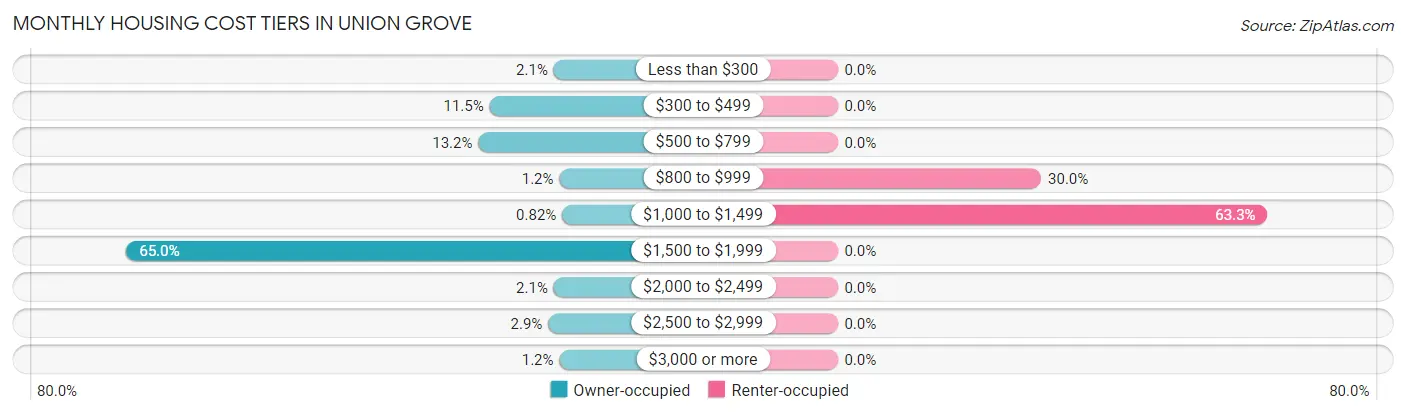
| Monthly Cost | Owner-occupied | Renter-occupied |
| Less than $300 | 5 (2.1%) | 0 (0.0%) |
| $300 to $499 | 28 (11.5%) | 0 (0.0%) |
| $500 to $799 | 32 (13.2%) | 0 (0.0%) |
| $800 to $999 | 3 (1.2%) | 9 (30.0%) |
| $1,000 to $1,499 | 2 (0.8%) | 19 (63.3%) |
| $1,500 to $1,999 | 158 (65.0%) | 0 (0.0%) |
| $2,000 to $2,499 | 5 (2.1%) | 0 (0.0%) |
| $2,500 to $2,999 | 7 (2.9%) | 0 (0.0%) |
| $3,000 or more | 3 (1.2%) | 0 (0.0%) |
| Total | 243 (100.0%) | 30 (100.0%) |
Physical Housing Characteristics in Union Grove
Housing Structures in Union Grove
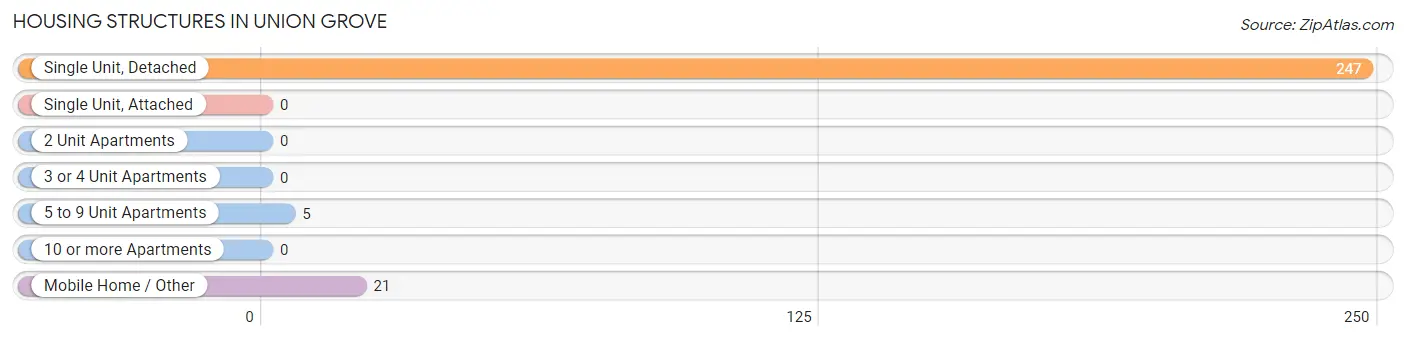
| Structure Type | # Housing Units | % Housing Units |
| Single Unit, Detached | 247 | 90.5% |
| Single Unit, Attached | 0 | 0.0% |
| 2 Unit Apartments | 0 | 0.0% |
| 3 or 4 Unit Apartments | 0 | 0.0% |
| 5 to 9 Unit Apartments | 5 | 1.8% |
| 10 or more Apartments | 0 | 0.0% |
| Mobile Home / Other | 21 | 7.7% |
| Total | 273 | 100.0% |
Housing Structures by Occupancy in Union Grove
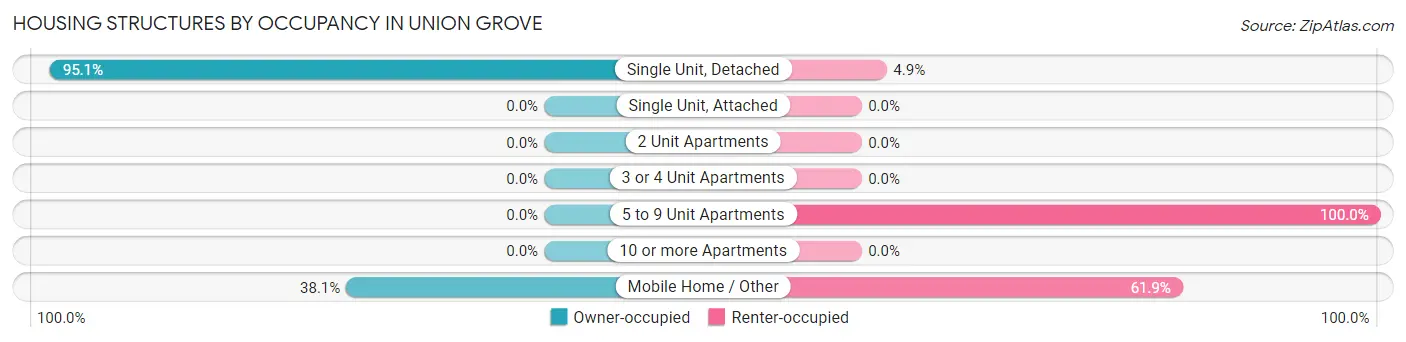
| Structure Type | Owner-occupied | Renter-occupied |
| Single Unit, Detached | 235 (95.1%) | 12 (4.9%) |
| Single Unit, Attached | 0 (0.0%) | 0 (0.0%) |
| 2 Unit Apartments | 0 (0.0%) | 0 (0.0%) |
| 3 or 4 Unit Apartments | 0 (0.0%) | 0 (0.0%) |
| 5 to 9 Unit Apartments | 0 (0.0%) | 5 (100.0%) |
| 10 or more Apartments | 0 (0.0%) | 0 (0.0%) |
| Mobile Home / Other | 8 (38.1%) | 13 (61.9%) |
| Total | 243 (89.0%) | 30 (11.0%) |
Housing Structures by Number of Rooms in Union Grove
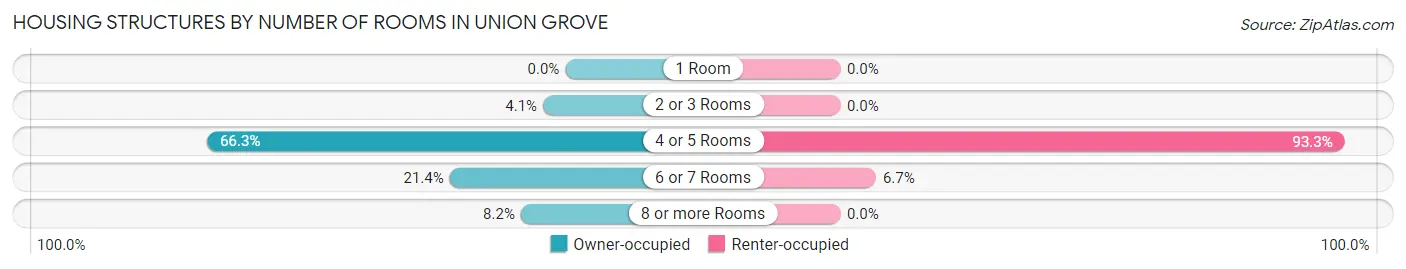
| Number of Rooms | Owner-occupied | Renter-occupied |
| 1 Room | 0 (0.0%) | 0 (0.0%) |
| 2 or 3 Rooms | 10 (4.1%) | 0 (0.0%) |
| 4 or 5 Rooms | 161 (66.3%) | 28 (93.3%) |
| 6 or 7 Rooms | 52 (21.4%) | 2 (6.7%) |
| 8 or more Rooms | 20 (8.2%) | 0 (0.0%) |
| Total | 243 (100.0%) | 30 (100.0%) |
Housing Structure by Heating Type in Union Grove
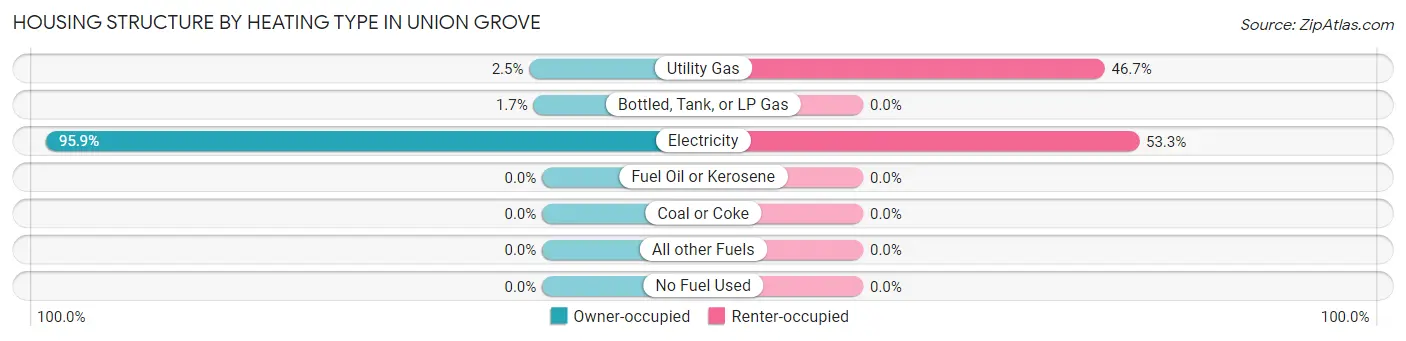
| Heating Type | Owner-occupied | Renter-occupied |
| Utility Gas | 6 (2.5%) | 14 (46.7%) |
| Bottled, Tank, or LP Gas | 4 (1.7%) | 0 (0.0%) |
| Electricity | 233 (95.9%) | 16 (53.3%) |
| Fuel Oil or Kerosene | 0 (0.0%) | 0 (0.0%) |
| Coal or Coke | 0 (0.0%) | 0 (0.0%) |
| All other Fuels | 0 (0.0%) | 0 (0.0%) |
| No Fuel Used | 0 (0.0%) | 0 (0.0%) |
| Total | 243 (100.0%) | 30 (100.0%) |
Household Vehicle Usage in Union Grove
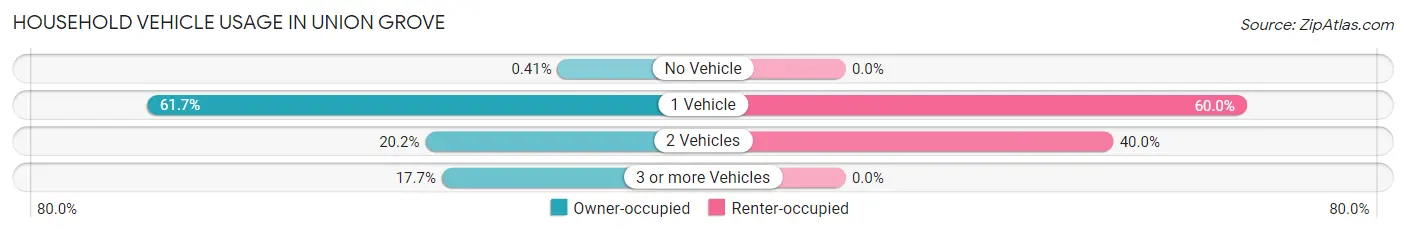
| Vehicles per Household | Owner-occupied | Renter-occupied |
| No Vehicle | 1 (0.4%) | 0 (0.0%) |
| 1 Vehicle | 150 (61.7%) | 18 (60.0%) |
| 2 Vehicles | 49 (20.2%) | 12 (40.0%) |
| 3 or more Vehicles | 43 (17.7%) | 0 (0.0%) |
| Total | 243 (100.0%) | 30 (100.0%) |
Real Estate & Mortgages in Union Grove
Real Estate and Mortgage Overview in Union Grove
| Characteristic | Without Mortgage | With Mortgage |
| Housing Units | 66 | 177 |
| Median Property Value | $175,000 | $223,100 |
| Median Household Income | $43,750 | $150 |
| Monthly Housing Costs | $500 | $3 |
| Real Estate Taxes | $1,646 | $2 |
Property Value by Mortgage Status in Union Grove
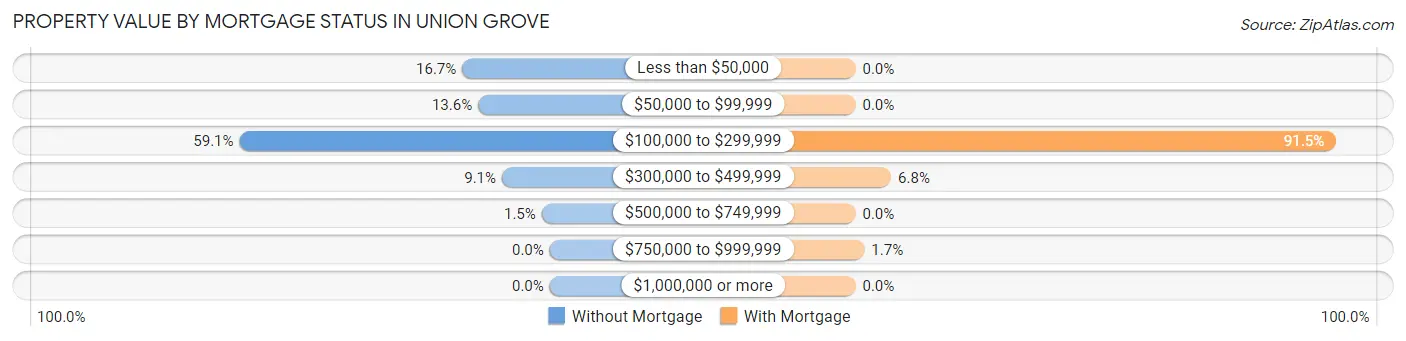
| Property Value | Without Mortgage | With Mortgage |
| Less than $50,000 | 11 (16.7%) | 0 (0.0%) |
| $50,000 to $99,999 | 9 (13.6%) | 0 (0.0%) |
| $100,000 to $299,999 | 39 (59.1%) | 162 (91.5%) |
| $300,000 to $499,999 | 6 (9.1%) | 12 (6.8%) |
| $500,000 to $749,999 | 1 (1.5%) | 0 (0.0%) |
| $750,000 to $999,999 | 0 (0.0%) | 3 (1.7%) |
| $1,000,000 or more | 0 (0.0%) | 0 (0.0%) |
| Total | 66 (100.0%) | 177 (100.0%) |
Household Income by Mortgage Status in Union Grove
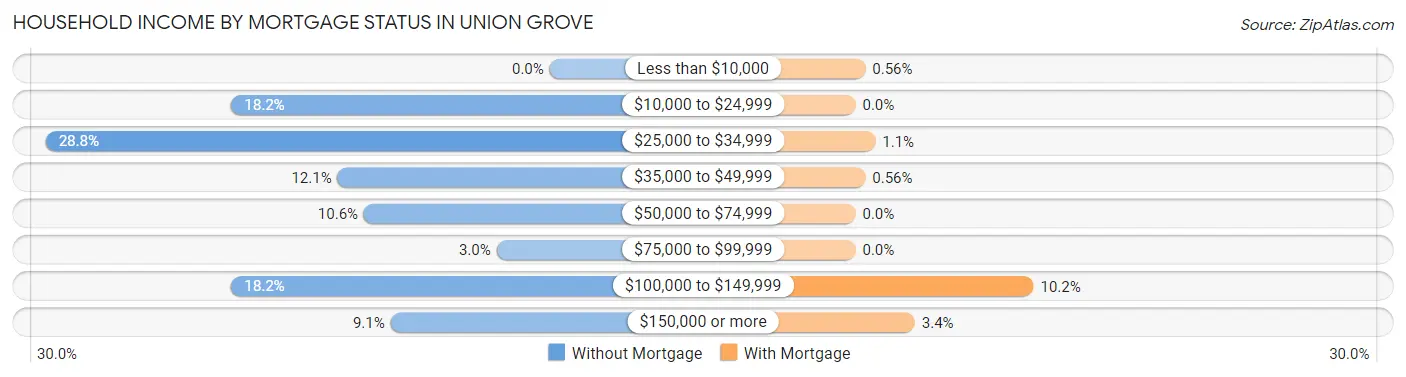
| Household Income | Without Mortgage | With Mortgage |
| Less than $10,000 | 0 (0.0%) | 1 (0.6%) |
| $10,000 to $24,999 | 12 (18.2%) | 0 (0.0%) |
| $25,000 to $34,999 | 19 (28.8%) | 2 (1.1%) |
| $35,000 to $49,999 | 8 (12.1%) | 1 (0.6%) |
| $50,000 to $74,999 | 7 (10.6%) | 0 (0.0%) |
| $75,000 to $99,999 | 2 (3.0%) | 0 (0.0%) |
| $100,000 to $149,999 | 12 (18.2%) | 18 (10.2%) |
| $150,000 or more | 6 (9.1%) | 6 (3.4%) |
| Total | 66 (100.0%) | 177 (100.0%) |
Property Value to Household Income Ratio in Union Grove
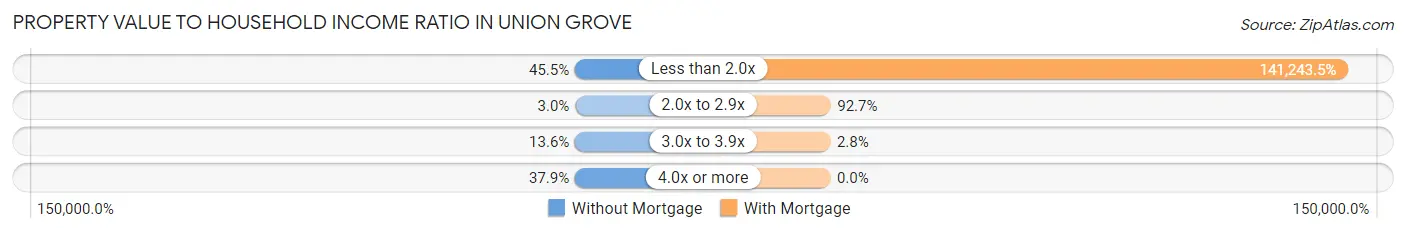
| Value-to-Income Ratio | Without Mortgage | With Mortgage |
| Less than 2.0x | 30 (45.5%) | 250,001 (141,243.5%) |
| 2.0x to 2.9x | 2 (3.0%) | 164 (92.7%) |
| 3.0x to 3.9x | 9 (13.6%) | 5 (2.8%) |
| 4.0x or more | 25 (37.9%) | 0 (0.0%) |
| Total | 66 (100.0%) | 177 (100.0%) |
Real Estate Taxes by Mortgage Status in Union Grove
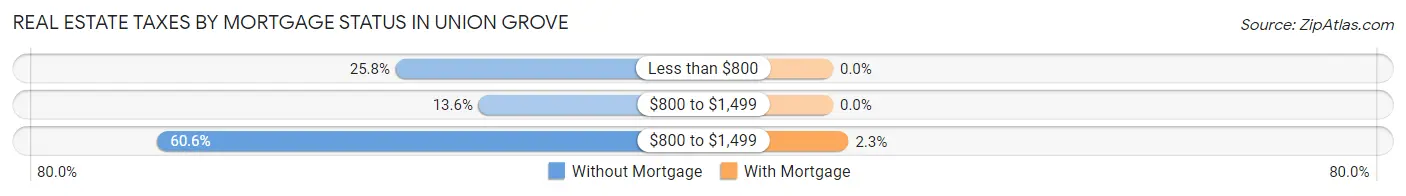
| Property Taxes | Without Mortgage | With Mortgage |
| Less than $800 | 17 (25.8%) | 0 (0.0%) |
| $800 to $1,499 | 9 (13.6%) | 0 (0.0%) |
| $800 to $1,499 | 40 (60.6%) | 4 (2.3%) |
| Total | 66 (100.0%) | 177 (100.0%) |
Health & Disability in Union Grove
Health Insurance Coverage by Age in Union Grove
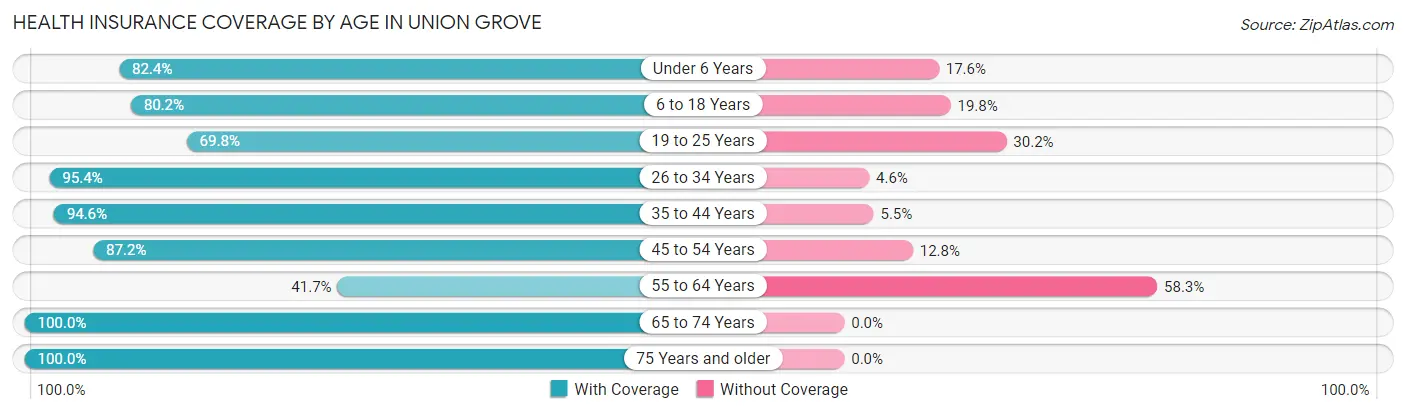
| Age Bracket | With Coverage | Without Coverage |
| Under 6 Years | 159 (82.4%) | 34 (17.6%) |
| 6 to 18 Years | 85 (80.2%) | 21 (19.8%) |
| 19 to 25 Years | 30 (69.8%) | 13 (30.2%) |
| 26 to 34 Years | 268 (95.4%) | 13 (4.6%) |
| 35 to 44 Years | 52 (94.6%) | 3 (5.4%) |
| 45 to 54 Years | 41 (87.2%) | 6 (12.8%) |
| 55 to 64 Years | 15 (41.7%) | 21 (58.3%) |
| 65 to 74 Years | 20 (100.0%) | 0 (0.0%) |
| 75 Years and older | 63 (100.0%) | 0 (0.0%) |
| Total | 733 (86.9%) | 111 (13.2%) |
Health Insurance Coverage by Citizenship Status in Union Grove
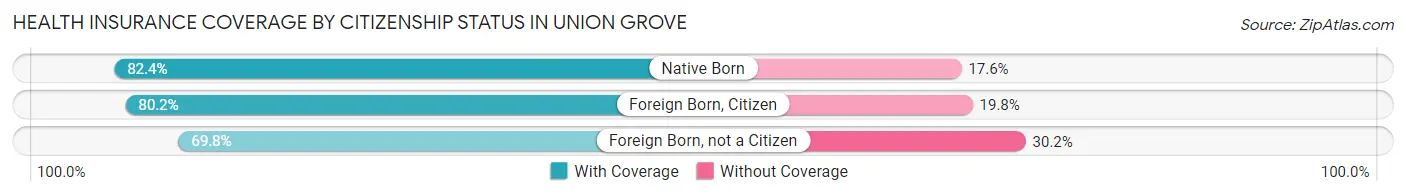
| Citizenship Status | With Coverage | Without Coverage |
| Native Born | 159 (82.4%) | 34 (17.6%) |
| Foreign Born, Citizen | 85 (80.2%) | 21 (19.8%) |
| Foreign Born, not a Citizen | 30 (69.8%) | 13 (30.2%) |
Health Insurance Coverage by Household Income in Union Grove
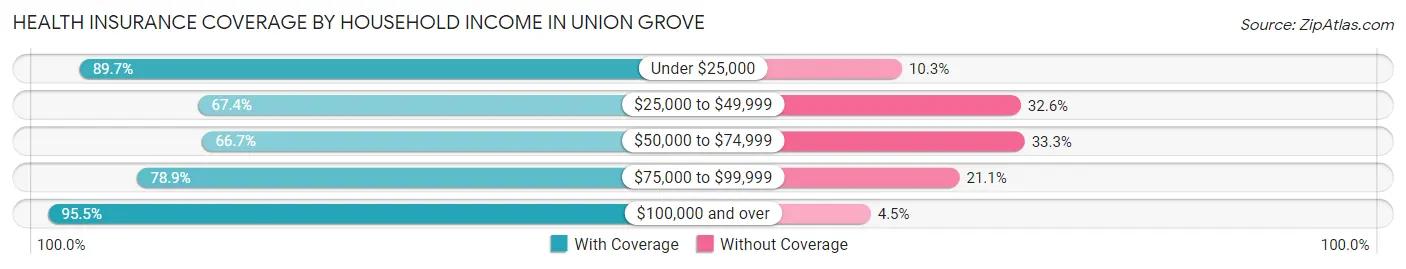
| Household Income | With Coverage | Without Coverage |
| Under $25,000 | 26 (89.7%) | 3 (10.3%) |
| $25,000 to $49,999 | 126 (67.4%) | 61 (32.6%) |
| $50,000 to $74,999 | 16 (66.7%) | 8 (33.3%) |
| $75,000 to $99,999 | 56 (78.9%) | 15 (21.1%) |
| $100,000 and over | 509 (95.5%) | 24 (4.5%) |
Public vs Private Health Insurance Coverage by Age in Union Grove
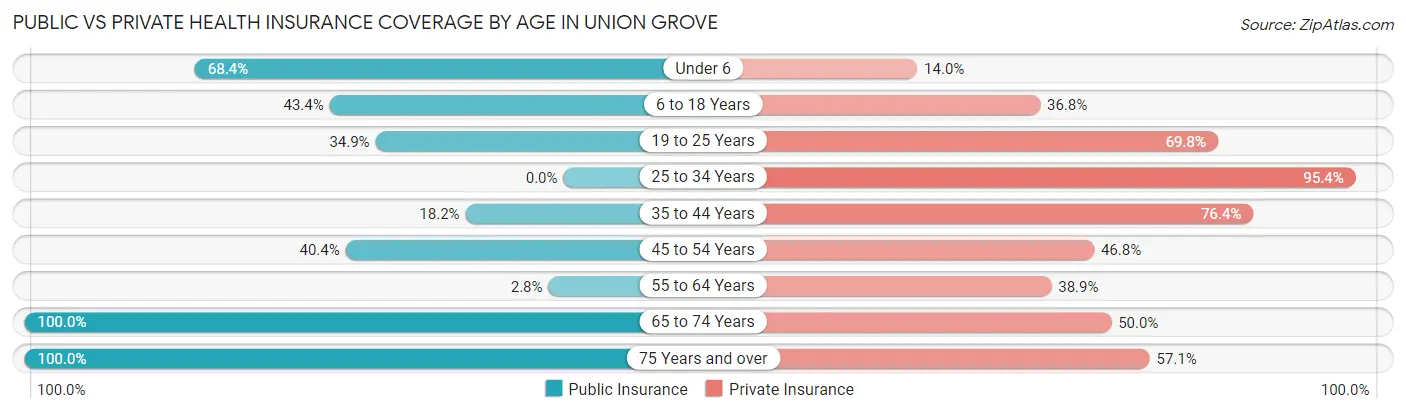
| Age Bracket | Public Insurance | Private Insurance |
| Under 6 | 132 (68.4%) | 27 (14.0%) |
| 6 to 18 Years | 46 (43.4%) | 39 (36.8%) |
| 19 to 25 Years | 15 (34.9%) | 30 (69.8%) |
| 25 to 34 Years | 0 (0.0%) | 268 (95.4%) |
| 35 to 44 Years | 10 (18.2%) | 42 (76.4%) |
| 45 to 54 Years | 19 (40.4%) | 22 (46.8%) |
| 55 to 64 Years | 1 (2.8%) | 14 (38.9%) |
| 65 to 74 Years | 20 (100.0%) | 10 (50.0%) |
| 75 Years and over | 63 (100.0%) | 36 (57.1%) |
| Total | 306 (36.3%) | 488 (57.8%) |
Disability Status by Sex by Age in Union Grove
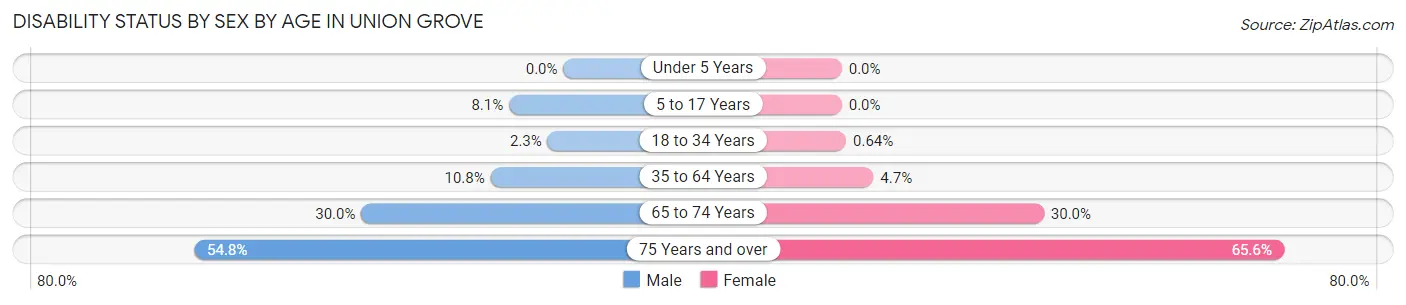
| Age Bracket | Male | Female |
| Under 5 Years | 0 (0.0%) | 0 (0.0%) |
| 5 to 17 Years | 5 (8.1%) | 0 (0.0%) |
| 18 to 34 Years | 4 (2.3%) | 1 (0.6%) |
| 35 to 64 Years | 8 (10.8%) | 3 (4.7%) |
| 65 to 74 Years | 3 (30.0%) | 3 (30.0%) |
| 75 Years and over | 17 (54.8%) | 21 (65.6%) |
Disability Class by Sex by Age in Union Grove
Disability Class: Hearing Difficulty
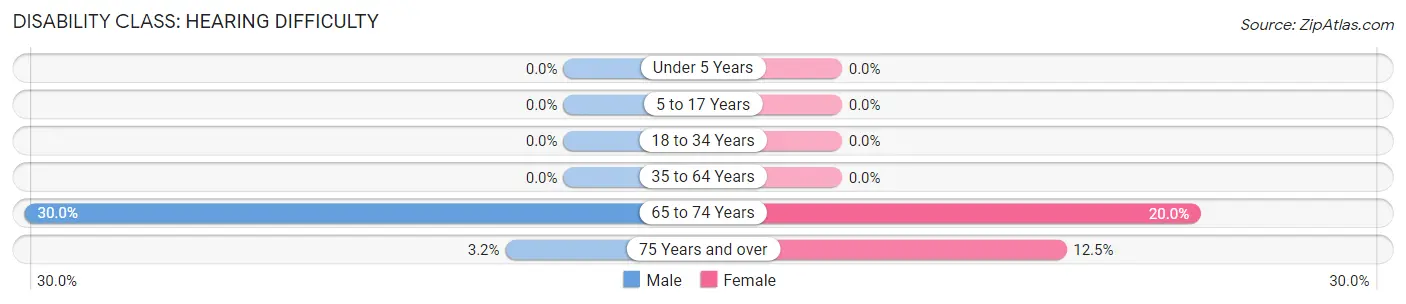
| Age Bracket | Male | Female |
| Under 5 Years | 0 (0.0%) | 0 (0.0%) |
| 5 to 17 Years | 0 (0.0%) | 0 (0.0%) |
| 18 to 34 Years | 0 (0.0%) | 0 (0.0%) |
| 35 to 64 Years | 0 (0.0%) | 0 (0.0%) |
| 65 to 74 Years | 3 (30.0%) | 2 (20.0%) |
| 75 Years and over | 1 (3.2%) | 4 (12.5%) |
Disability Class: Vision Difficulty
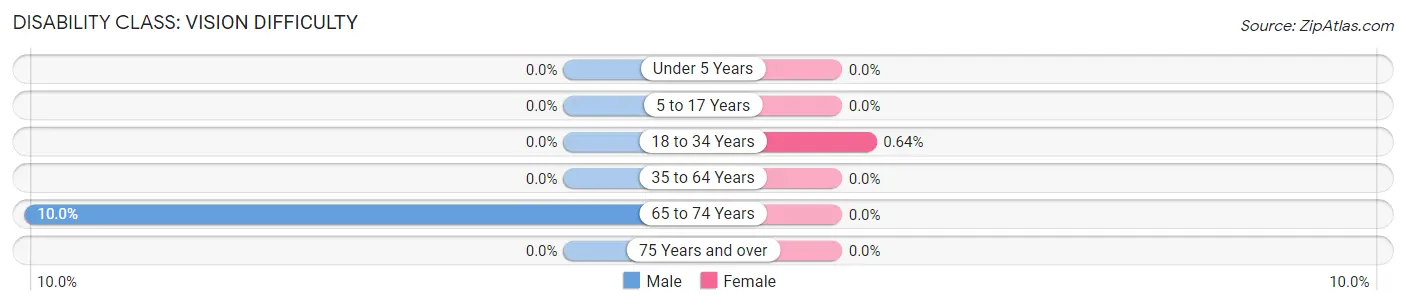
| Age Bracket | Male | Female |
| Under 5 Years | 0 (0.0%) | 0 (0.0%) |
| 5 to 17 Years | 0 (0.0%) | 0 (0.0%) |
| 18 to 34 Years | 0 (0.0%) | 1 (0.6%) |
| 35 to 64 Years | 0 (0.0%) | 0 (0.0%) |
| 65 to 74 Years | 1 (10.0%) | 0 (0.0%) |
| 75 Years and over | 0 (0.0%) | 0 (0.0%) |
Disability Class: Cognitive Difficulty
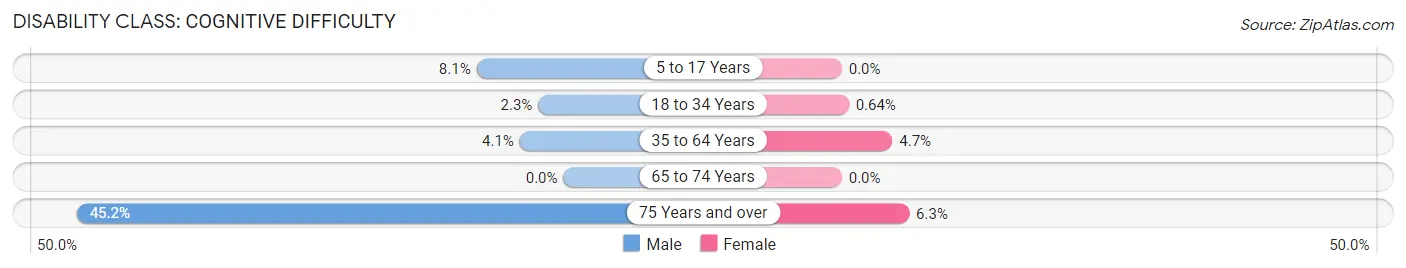
| Age Bracket | Male | Female |
| 5 to 17 Years | 5 (8.1%) | 0 (0.0%) |
| 18 to 34 Years | 4 (2.3%) | 1 (0.6%) |
| 35 to 64 Years | 3 (4.1%) | 3 (4.7%) |
| 65 to 74 Years | 0 (0.0%) | 0 (0.0%) |
| 75 Years and over | 14 (45.2%) | 2 (6.2%) |
Disability Class: Ambulatory Difficulty
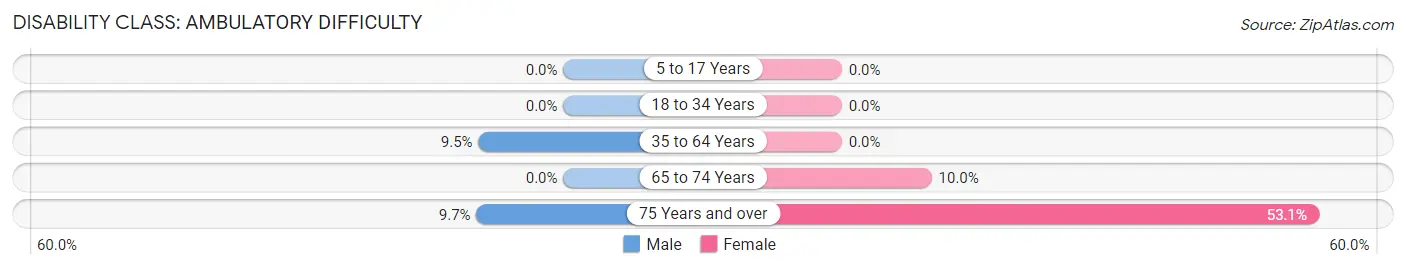
| Age Bracket | Male | Female |
| 5 to 17 Years | 0 (0.0%) | 0 (0.0%) |
| 18 to 34 Years | 0 (0.0%) | 0 (0.0%) |
| 35 to 64 Years | 7 (9.5%) | 0 (0.0%) |
| 65 to 74 Years | 0 (0.0%) | 1 (10.0%) |
| 75 Years and over | 3 (9.7%) | 17 (53.1%) |
Disability Class: Self-Care Difficulty
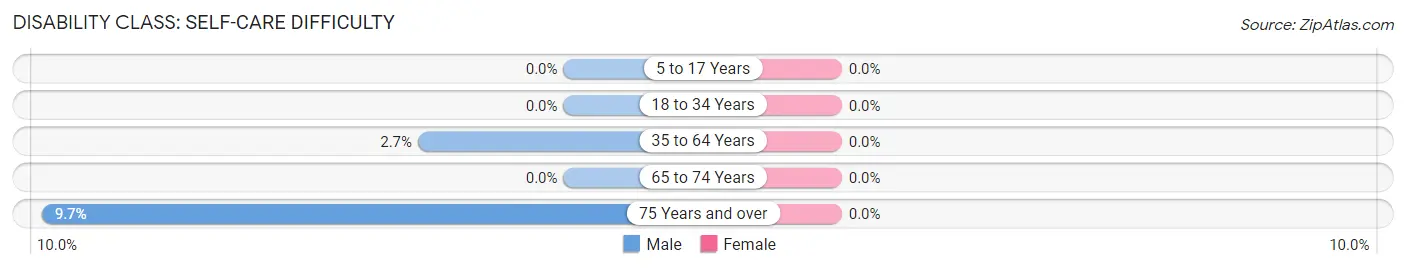
| Age Bracket | Male | Female |
| 5 to 17 Years | 0 (0.0%) | 0 (0.0%) |
| 18 to 34 Years | 0 (0.0%) | 0 (0.0%) |
| 35 to 64 Years | 2 (2.7%) | 0 (0.0%) |
| 65 to 74 Years | 0 (0.0%) | 0 (0.0%) |
| 75 Years and over | 3 (9.7%) | 0 (0.0%) |
Technology Access in Union Grove
Computing Device Access in Union Grove
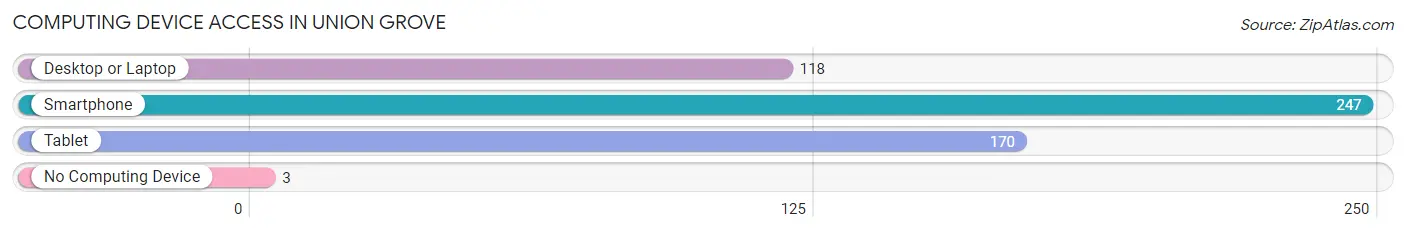
| Device Type | # Households | % Households |
| Desktop or Laptop | 118 | 43.2% |
| Smartphone | 247 | 90.5% |
| Tablet | 170 | 62.3% |
| No Computing Device | 3 | 1.1% |
| Total | 273 | 100.0% |
Internet Access in Union Grove
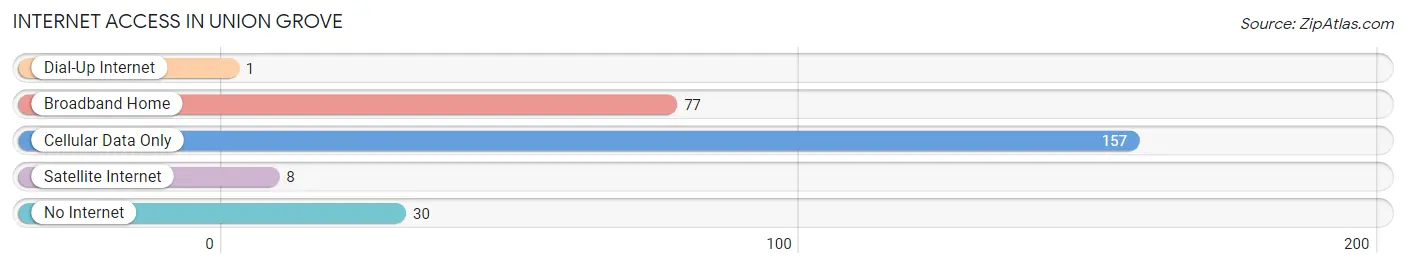
| Internet Type | # Households | % Households |
| Dial-Up Internet | 1 | 0.4% |
| Broadband Home | 77 | 28.2% |
| Cellular Data Only | 157 | 57.5% |
| Satellite Internet | 8 | 2.9% |
| No Internet | 30 | 11.0% |
| Total | 273 | 100.0% |
Union Grove Summary
History
Union Grove, Texas is a small unincorporated community located in Smith County, Texas. It is situated about 10 miles east of Tyler, the county seat. The town was founded in 1873 by a group of settlers from Union Grove, Alabama. The settlers were looking for a place to start a new life and found the area to be ideal for farming and ranching. The town was named after the original Union Grove in Alabama.
The first settlers in Union Grove were mostly farmers and ranchers. They grew cotton, corn, and other crops, and raised cattle and hogs. The town also had a few stores, a post office, and a school. The first school in Union Grove was built in 1876 and was called the Union Grove Academy.
In the early 1900s, Union Grove began to grow and prosper. The town had a population of around 500 people by 1910. The town had several businesses, including a bank, a hotel, a blacksmith shop, and a cotton gin. The town also had a newspaper, the Union Grove Herald, which was published from 1910 to 1915.
In the 1920s, Union Grove experienced a period of growth and prosperity. The town had a population of around 1,000 people by 1930. The town had several businesses, including a movie theater, a drug store, a hardware store, and a grocery store. The town also had a hospital, a library, and a fire department.
In the 1940s, Union Grove experienced a period of decline. The population decreased to around 500 people by 1950. The town had several businesses, but most of them had closed by this time. The town also had a few churches, but most of them had closed as well.
Geography
Union Grove is located in Smith County, Texas, about 10 miles east of Tyler, the county seat. The town is situated in the rolling hills of East Texas, and is surrounded by forests and farmland. The town is located near the Neches River, which provides a source of water for the area.
The climate in Union Grove is humid subtropical, with hot summers and mild winters. The average temperature in the summer is around 90 degrees Fahrenheit, and the average temperature in the winter is around 50 degrees Fahrenheit. The average annual rainfall is around 40 inches.
Economy
The economy of Union Grove is largely based on agriculture. The town is surrounded by farmland, and many of the residents are involved in farming and ranching. The town also has a few small businesses, including a grocery store, a hardware store, and a few restaurants.
The town also has a few manufacturing businesses, including a furniture factory and a plastics factory. The town also has a few service businesses, including a car repair shop and a gas station.
Demographics
As of the 2010 census, the population of Union Grove was 1,093. The racial makeup of the town was 94.3% White, 2.2% African American, 0.3% Native American, 0.7% Asian, 0.1% Pacific Islander, and 2.4% from other races. Hispanic or Latino of any race were 4.2% of the population.
The median household income in Union Grove was $37,500, and the median family income was $41,250. The per capita income in Union Grove was $17,845. About 11.3% of families and 14.2% of the population were below the poverty line, including 18.2% of those under age 18 and 8.3% of those age 65 or over.
Common Questions
What is the Total Population of Union Grove?
Total Population of Union Grove is 844.
What is the Total Male Population of Union Grove?
Total Male Population of Union Grove is 450.
What is the Total Female Population of Union Grove?
Total Female Population of Union Grove is 394.
What is the Ratio of Males per 100 Females in Union Grove?
There are 114.21 Males per 100 Females in Union Grove.
What is the Ratio of Females per 100 Males in Union Grove?
There are 87.56 Females per 100 Males in Union Grove.
What is the Median Population Age in Union Grove?
Median Population Age in Union Grove is 27.7 Years.
What is the Average Family Size in Union Grove
Average Family Size in Union Grove is 3.2 People.
What is the Average Household Size in Union Grove
Average Household Size in Union Grove is 3.1 People.
What is Per Capita Income in Union Grove?
Per Capita income in Union Grove is $68,199.
What is the Median Family Income in Union Grove?
Median Family Income in Union Grove is $250,001.
What is the Median Household income in Union Grove?
Median Household Income in Union Grove is $197,083.
What is Income or Wage Gap in Union Grove?
Income or Wage Gap in Union Grove is 78.1%.
Women in Union Grove earn 21.9 cents for every dollar earned by a man.
What is Inequality or Gini Index in Union Grove?
Inequality or Gini Index in Union Grove is 0.35.
How Large is the Labor Force in Union Grove?
There are 459 People in the Labor Forcein in Union Grove.
What is the Percentage of People in the Labor Force in Union Grove?
80.7% of People are in the Labor Force in Union Grove.
What is the Unemployment Rate in Union Grove?
Unemployment Rate in Union Grove is 0.9%.