Inez, TX
Inez Map
Inez Overview
2,435
TOTAL POPULATION
1,323
MALE POPULATION
1,112
FEMALE POPULATION
118.97
MALES / 100 FEMALES
84.05
FEMALES / 100 MALES
39.0
MEDIAN AGE
3.1
AVG FAMILY SIZE
2.6
AVG HOUSEHOLD SIZE
$41,285
PER CAPITA INCOME
$115,481
AVG FAMILY INCOME
$83,438
AVG HOUSEHOLD INCOME
56.5%
WAGE / INCOME GAP [ % ]
43.5¢/ $1
WAGE / INCOME GAP [ $ ]
0.42
INEQUALITY / GINI INDEX
1,173
LABOR FORCE [ PEOPLE ]
63.6%
PERCENT IN LABOR FORCE
2.1%
UNEMPLOYMENT RATE
Inez Zip Codes
Inez Area Codes
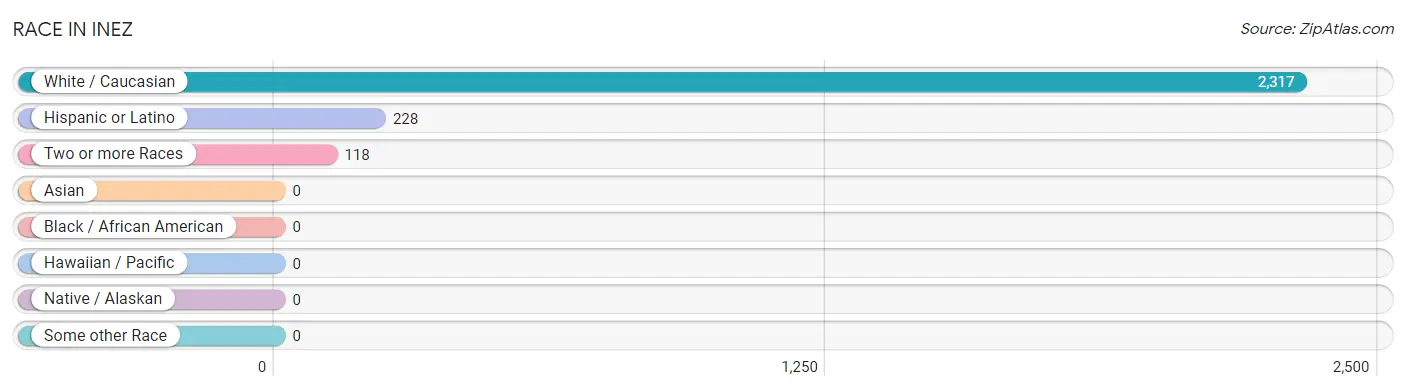
Race in Inez
The most populous races in Inez are White / Caucasian (2,317 | 95.2%), Hispanic or Latino (228 | 9.4%), and Two or more Races (118 | 4.9%).
| Race | # Population | % Population |
| Asian | 0 | 0.0% |
| Black / African American | 0 | 0.0% |
| Hawaiian / Pacific | 0 | 0.0% |
| Hispanic or Latino | 228 | 9.4% |
| Native / Alaskan | 0 | 0.0% |
| White / Caucasian | 2,317 | 95.2% |
| Two or more Races | 118 | 4.9% |
| Some other Race | 0 | 0.0% |
| Total | 2,435 | 100.0% |
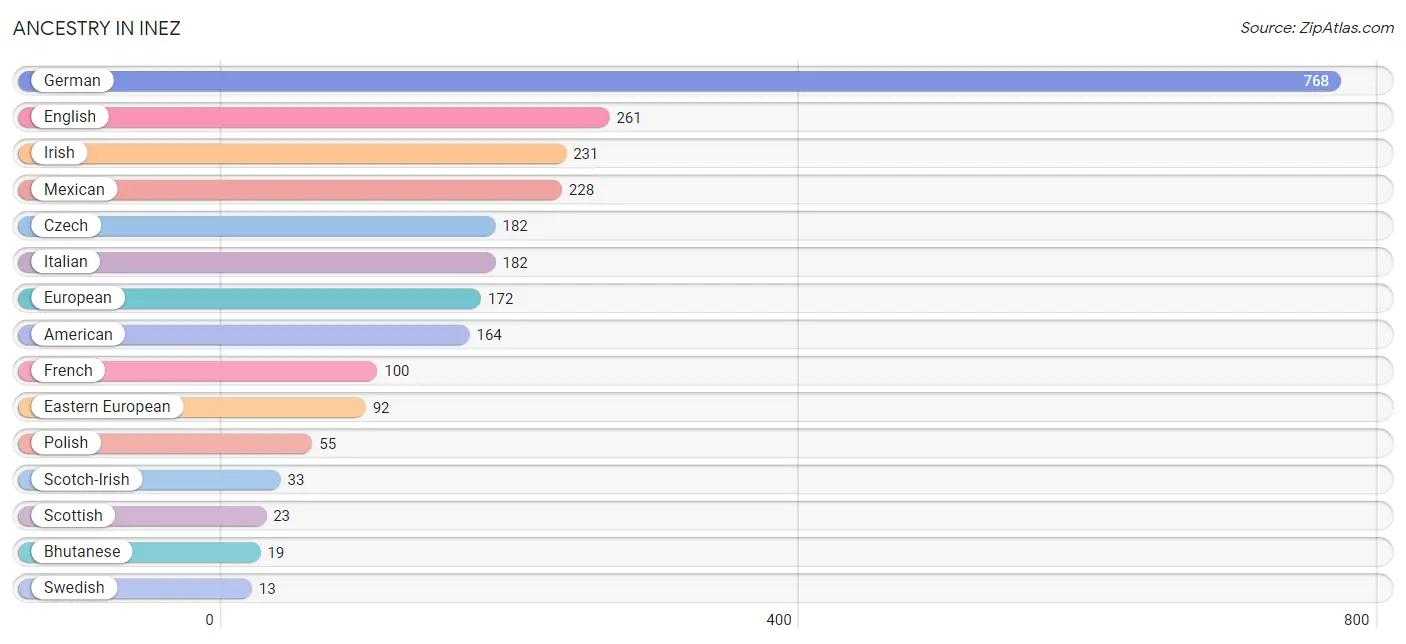
Ancestry in Inez
The most populous ancestries reported in Inez are German (768 | 31.5%), English (261 | 10.7%), Irish (231 | 9.5%), Mexican (228 | 9.4%), and Czech (182 | 7.5%), together accounting for 68.6% of all Inez residents.
| Ancestry | # Population | % Population |
| American | 164 | 6.7% |
| Bhutanese | 19 | 0.8% |
| Czech | 182 | 7.5% |
| Eastern European | 92 | 3.8% |
| English | 261 | 10.7% |
| European | 172 | 7.1% |
| French | 100 | 4.1% |
| German | 768 | 31.5% |
| Irish | 231 | 9.5% |
| Italian | 182 | 7.5% |
| Mexican | 228 | 9.4% |
| Polish | 55 | 2.3% |
| Russian | 2 | 0.1% |
| Scotch-Irish | 33 | 1.4% |
| Scottish | 23 | 0.9% |
| Swedish | 13 | 0.5% | View All 16 Rows |
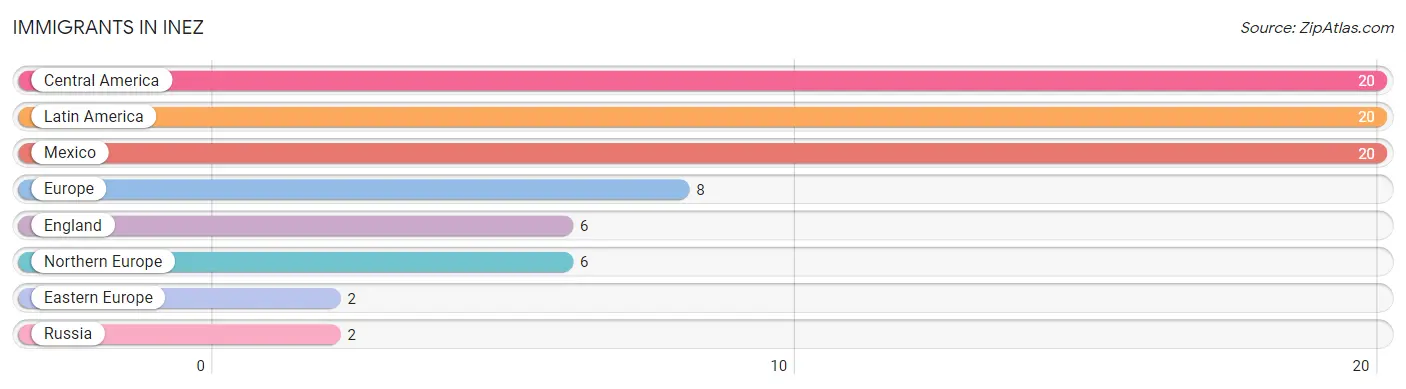
Immigrants in Inez
The most numerous immigrant groups reported in Inez came from Central America (20 | 0.8%), Latin America (20 | 0.8%), Mexico (20 | 0.8%), Europe (8 | 0.3%), and England (6 | 0.3%), together accounting for 3.0% of all Inez residents.
| Immigration Origin | # Population | % Population |
| Central America | 20 | 0.8% |
| Eastern Europe | 2 | 0.1% |
| England | 6 | 0.3% |
| Europe | 8 | 0.3% |
| Latin America | 20 | 0.8% |
| Mexico | 20 | 0.8% |
| Northern Europe | 6 | 0.3% |
| Russia | 2 | 0.1% | View All 8 Rows |
Sex and Age in Inez
Sex and Age in Inez
The most populous age groups in Inez are 5 to 9 Years (165 | 12.5%) for men and 35 to 39 Years (144 | 13.0%) for women.
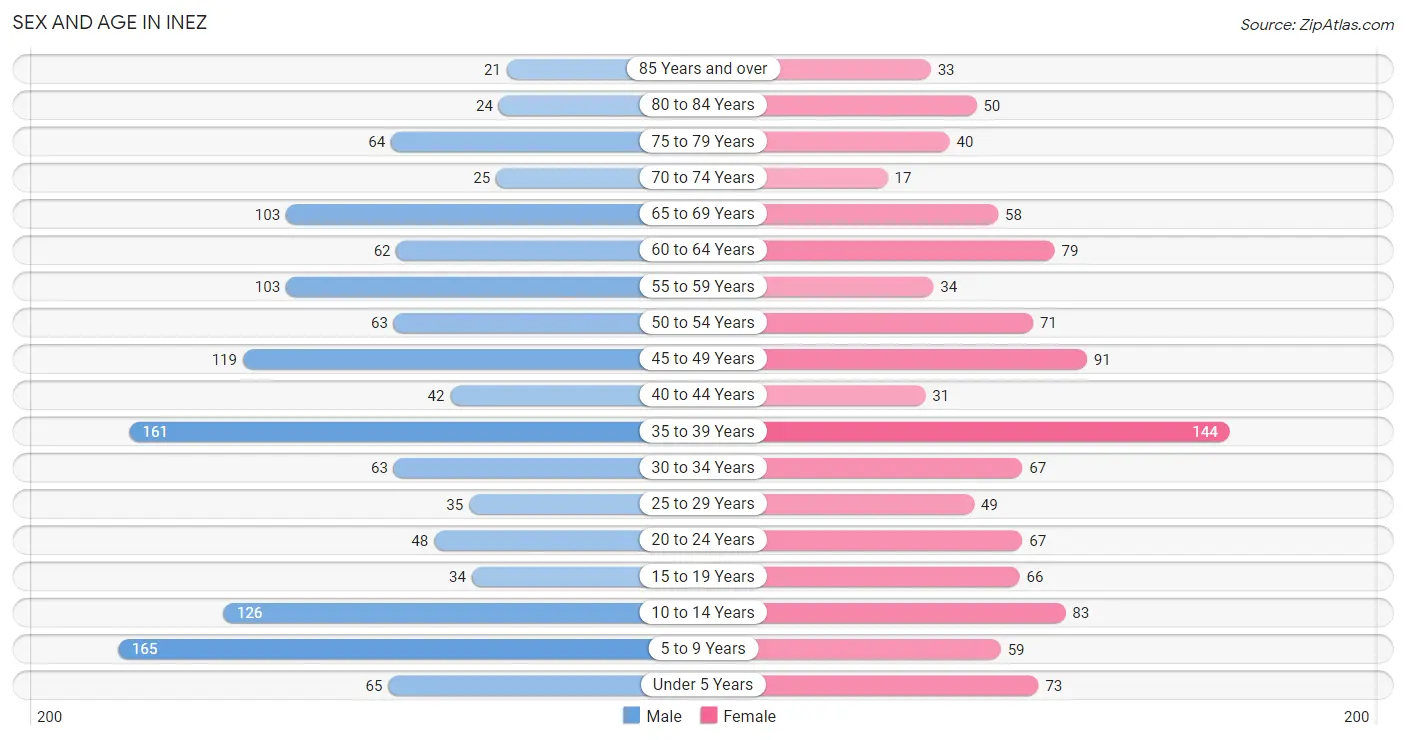
| Age Bracket | Male | Female |
| Under 5 Years | 65 (4.9%) | 73 (6.6%) |
| 5 to 9 Years | 165 (12.5%) | 59 (5.3%) |
| 10 to 14 Years | 126 (9.5%) | 83 (7.5%) |
| 15 to 19 Years | 34 (2.6%) | 66 (5.9%) |
| 20 to 24 Years | 48 (3.6%) | 67 (6.0%) |
| 25 to 29 Years | 35 (2.6%) | 49 (4.4%) |
| 30 to 34 Years | 63 (4.8%) | 67 (6.0%) |
| 35 to 39 Years | 161 (12.2%) | 144 (13.0%) |
| 40 to 44 Years | 42 (3.2%) | 31 (2.8%) |
| 45 to 49 Years | 119 (9.0%) | 91 (8.2%) |
| 50 to 54 Years | 63 (4.8%) | 71 (6.4%) |
| 55 to 59 Years | 103 (7.8%) | 34 (3.1%) |
| 60 to 64 Years | 62 (4.7%) | 79 (7.1%) |
| 65 to 69 Years | 103 (7.8%) | 58 (5.2%) |
| 70 to 74 Years | 25 (1.9%) | 17 (1.5%) |
| 75 to 79 Years | 64 (4.8%) | 40 (3.6%) |
| 80 to 84 Years | 24 (1.8%) | 50 (4.5%) |
| 85 Years and over | 21 (1.6%) | 33 (3.0%) |
| Total | 1,323 (100.0%) | 1,112 (100.0%) |
Families and Households in Inez
Median Family Size in Inez
The median family size in Inez is 3.14 persons per family, with single female/mother families (16 | 2.3%) accounting for the largest median family size of 5.31 persons per family. On the other hand, single male/father families (38 | 5.5%) represent the smallest median family size with 2.76 persons per family.
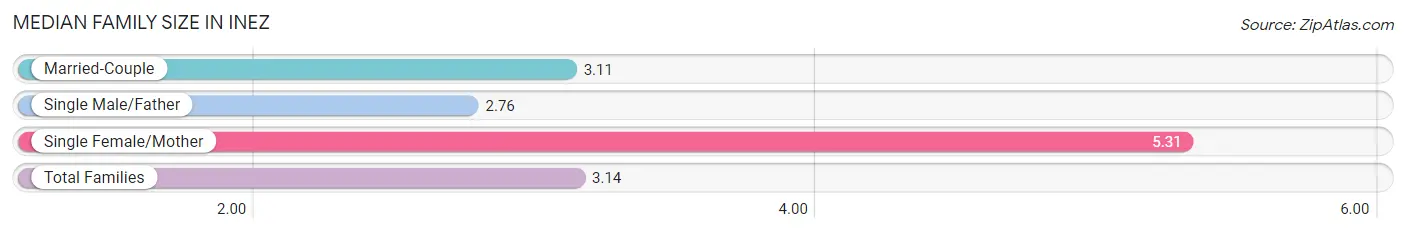
| Family Type | # Families | Family Size |
| Married-Couple | 635 (92.2%) | 3.11 |
| Single Male/Father | 38 (5.5%) | 2.76 |
| Single Female/Mother | 16 (2.3%) | 5.31 |
| Total Families | 689 (100.0%) | 3.14 |
Median Household Size in Inez
The median household size in Inez is 2.61 persons per household, with single female/mother households (16 | 1.7%) accounting for the largest median household size of 6.13 persons per household. non-family households (243 | 26.1%) represent the smallest median household size with 1.05 persons per household.
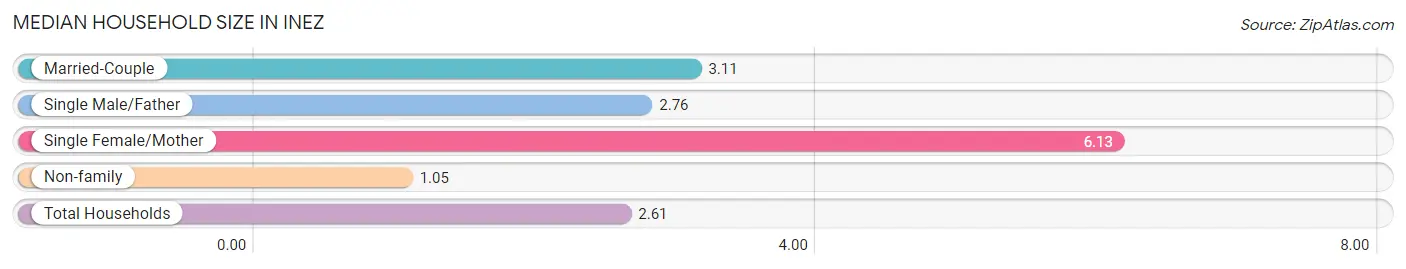
| Household Type | # Households | Household Size |
| Married-Couple | 635 (68.1%) | 3.11 |
| Single Male/Father | 38 (4.1%) | 2.76 |
| Single Female/Mother | 16 (1.7%) | 6.13 |
| Non-family | 243 (26.1%) | 1.05 |
| Total Households | 932 (100.0%) | 2.61 |
Household Size by Marriage Status in Inez
Out of a total of 932 households in Inez, 689 (73.9%) are family households, while 243 (26.1%) are nonfamily households. The most numerous type of family households are 2-person households, comprising 327, and the most common type of nonfamily households are 1-person households, comprising 226.
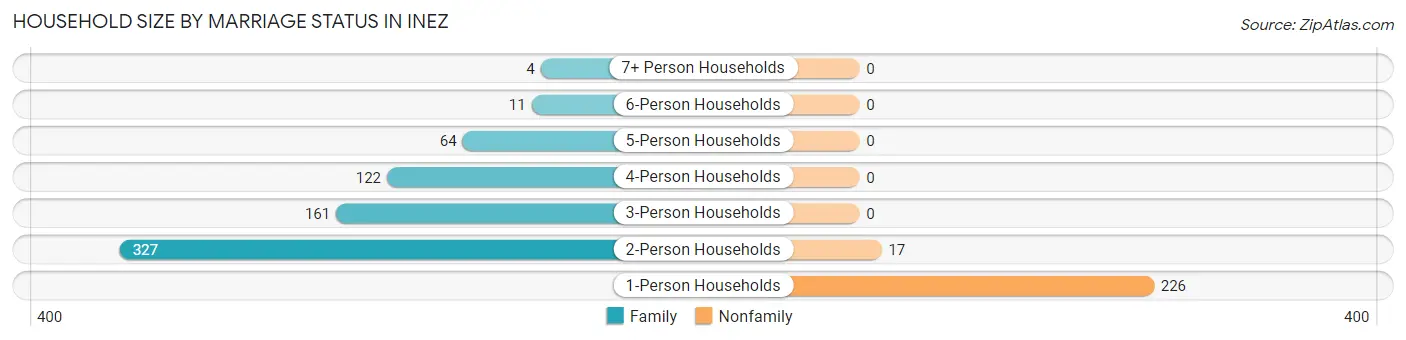
| Household Size | Family Households | Nonfamily Households |
| 1-Person Households | - | 226 (24.2%) |
| 2-Person Households | 327 (35.1%) | 17 (1.8%) |
| 3-Person Households | 161 (17.3%) | 0 (0.0%) |
| 4-Person Households | 122 (13.1%) | 0 (0.0%) |
| 5-Person Households | 64 (6.9%) | 0 (0.0%) |
| 6-Person Households | 11 (1.2%) | 0 (0.0%) |
| 7+ Person Households | 4 (0.4%) | 0 (0.0%) |
| Total | 689 (73.9%) | 243 (26.1%) |
Female Fertility in Inez
Fertility by Age in Inez
Average fertility rate in Inez is 77.0 births per 1,000 women. Women in the age bracket of 35 to 50 years have the highest fertility rate with 115.0 births per 1,000 women. Women in the age bracket of 35 to 50 years acount for 77.5% of all women with births.
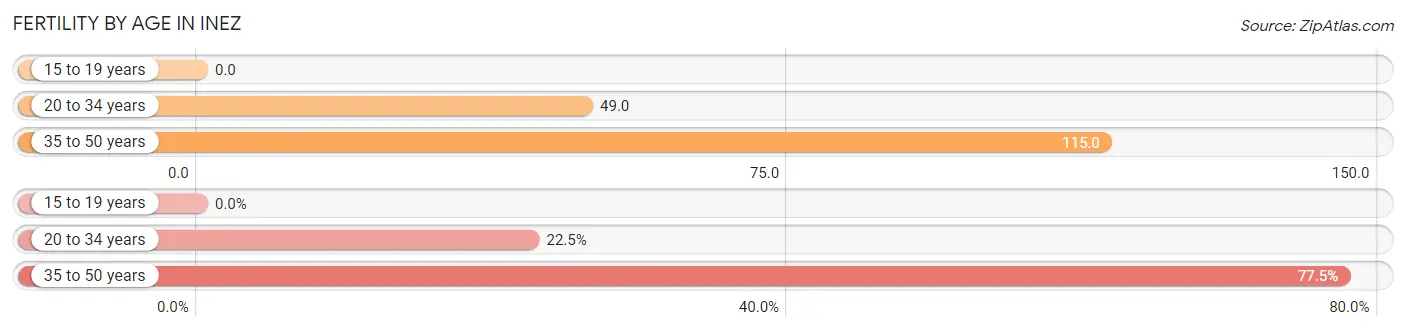
| Age Bracket | Women with Births | Births / 1,000 Women |
| 15 to 19 years | 0 (0.0%) | 0.0 |
| 20 to 34 years | 9 (22.5%) | 49.0 |
| 35 to 50 years | 31 (77.5%) | 115.0 |
| Total | 40 (100.0%) | 77.0 |
Fertility by Age by Marriage Status in Inez
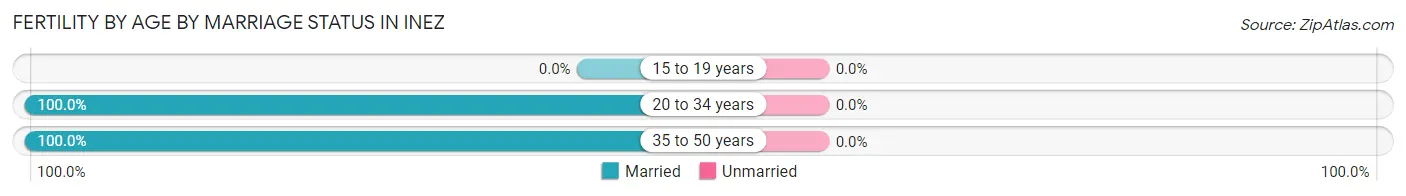
| Age Bracket | Married | Unmarried |
| 15 to 19 years | 0 (0.0%) | 0 (0.0%) |
| 20 to 34 years | 9 (100.0%) | 0 (0.0%) |
| 35 to 50 years | 31 (100.0%) | 0 (0.0%) |
| Total | 40 (100.0%) | 0 (0.0%) |
Fertility by Education in Inez
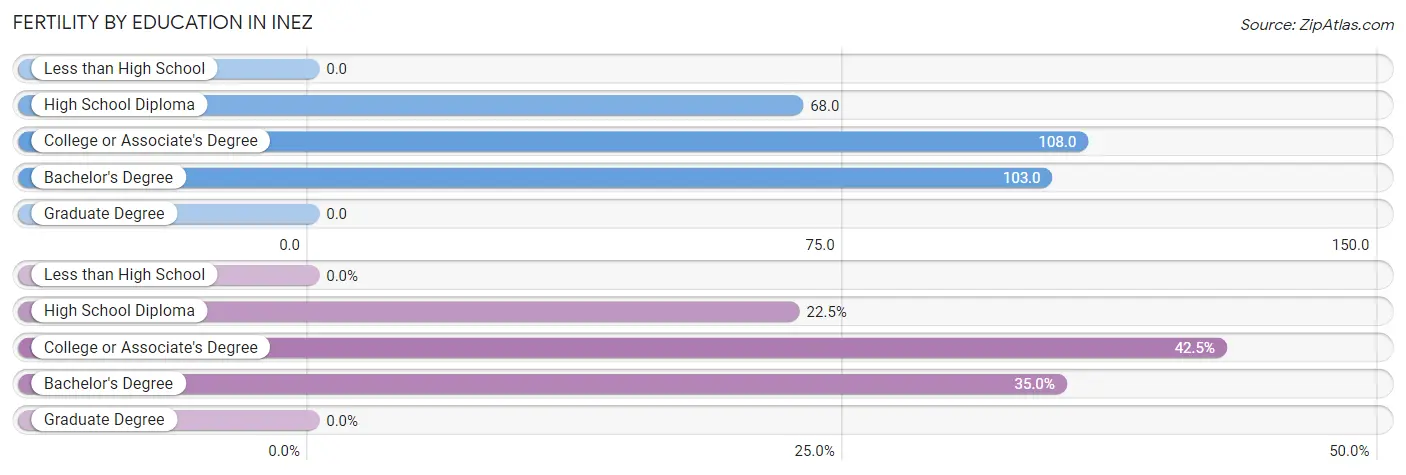
| Educational Attainment | Women with Births | Births / 1,000 Women |
| Less than High School | 0 (0.0%) | 0.0 |
| High School Diploma | 9 (22.5%) | 68.0 |
| College or Associate's Degree | 17 (42.5%) | 108.0 |
| Bachelor's Degree | 14 (35.0%) | 103.0 |
| Graduate Degree | 0 (0.0%) | 0.0 |
| Total | 40 (100.0%) | 77.0 |
Fertility by Education by Marriage Status in Inez
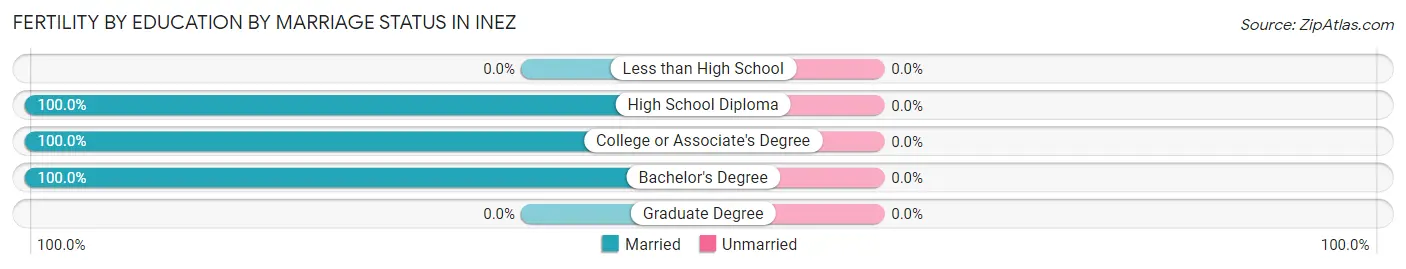
| Educational Attainment | Married | Unmarried |
| Less than High School | 0 (0.0%) | 0 (0.0%) |
| High School Diploma | 9 (100.0%) | 0 (0.0%) |
| College or Associate's Degree | 17 (100.0%) | 0 (0.0%) |
| Bachelor's Degree | 14 (100.0%) | 0 (0.0%) |
| Graduate Degree | 0 (0.0%) | 0 (0.0%) |
| Total | 40 (100.0%) | 0 (0.0%) |
Income in Inez
Income Overview in Inez
Per Capita Income in Inez is $41,285, while median incomes of families and households are $115,481 and $83,438 respectively.
| Characteristic | Number | Measure |
| Per Capita Income | 2,435 | $41,285 |
| Median Family Income | 689 | $115,481 |
| Mean Family Income | 689 | $134,200 |
| Median Household Income | 932 | $83,438 |
| Mean Household Income | 932 | $109,475 |
| Income Deficit | 689 | $0 |
| Wage / Income Gap (%) | 2,435 | 56.48% |
| Wage / Income Gap ($) | 2,435 | 43.52¢ per $1 |
| Gini / Inequality Index | 2,435 | 0.42 |
Earnings by Sex in Inez
Average Earnings in Inez are $47,042, $64,460 for men and $28,051 for women, a difference of 56.5%.
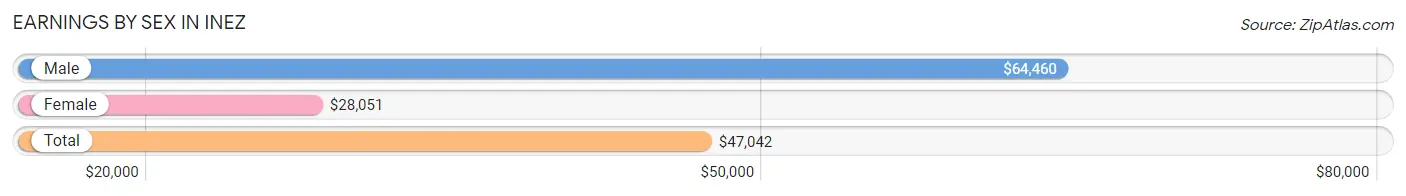
| Sex | Number | Average Earnings |
| Male | 745 (62.1%) | $64,460 |
| Female | 455 (37.9%) | $28,051 |
| Total | 1,200 (100.0%) | $47,042 |
Earnings by Sex by Income Bracket in Inez
The most common earnings brackets in Inez are $100,000+ for men (192 | 25.8%) and $20,000 to $22,499 for women (68 | 14.9%).
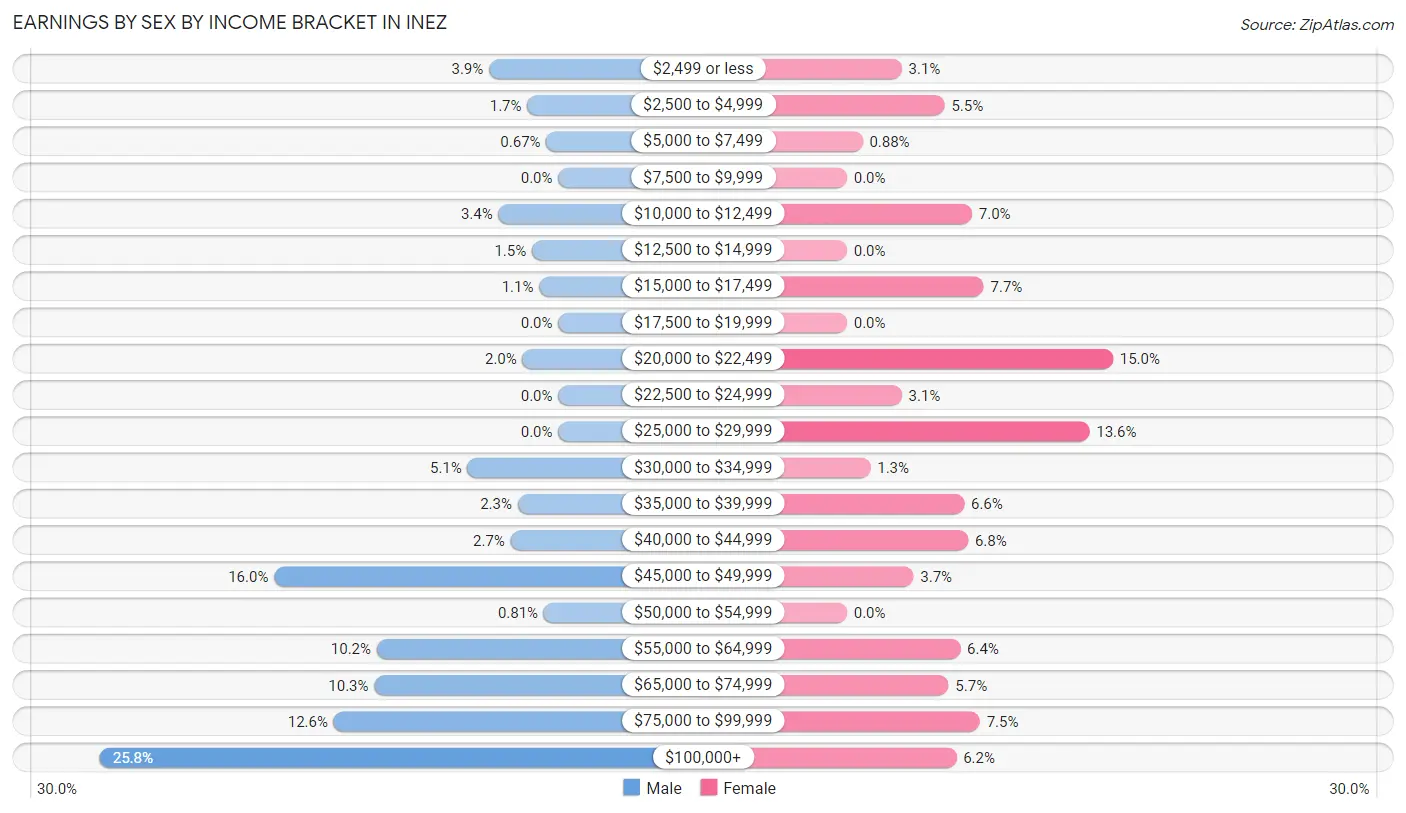
| Income | Male | Female |
| $2,499 or less | 29 (3.9%) | 14 (3.1%) |
| $2,500 to $4,999 | 13 (1.7%) | 25 (5.5%) |
| $5,000 to $7,499 | 5 (0.7%) | 4 (0.9%) |
| $7,500 to $9,999 | 0 (0.0%) | 0 (0.0%) |
| $10,000 to $12,499 | 25 (3.4%) | 32 (7.0%) |
| $12,500 to $14,999 | 11 (1.5%) | 0 (0.0%) |
| $15,000 to $17,499 | 8 (1.1%) | 35 (7.7%) |
| $17,500 to $19,999 | 0 (0.0%) | 0 (0.0%) |
| $20,000 to $22,499 | 15 (2.0%) | 68 (14.9%) |
| $22,500 to $24,999 | 0 (0.0%) | 14 (3.1%) |
| $25,000 to $29,999 | 0 (0.0%) | 62 (13.6%) |
| $30,000 to $34,999 | 38 (5.1%) | 6 (1.3%) |
| $35,000 to $39,999 | 17 (2.3%) | 30 (6.6%) |
| $40,000 to $44,999 | 20 (2.7%) | 31 (6.8%) |
| $45,000 to $49,999 | 119 (16.0%) | 17 (3.7%) |
| $50,000 to $54,999 | 6 (0.8%) | 0 (0.0%) |
| $55,000 to $64,999 | 76 (10.2%) | 29 (6.4%) |
| $65,000 to $74,999 | 77 (10.3%) | 26 (5.7%) |
| $75,000 to $99,999 | 94 (12.6%) | 34 (7.5%) |
| $100,000+ | 192 (25.8%) | 28 (6.1%) |
| Total | 745 (100.0%) | 455 (100.0%) |
Earnings by Sex by Educational Attainment in Inez
Average earnings in Inez are $66,094 for men and $36,771 for women, a difference of 44.4%. Men with an educational attainment of college or associate's degree enjoy the highest average annual earnings of $72,308, while those with high school diploma education earn the least with $46,415. Women with an educational attainment of college or associate's degree earn the most with the average annual earnings of $33,750, while those with college or associate's degree education have the smallest earnings of $33,750.
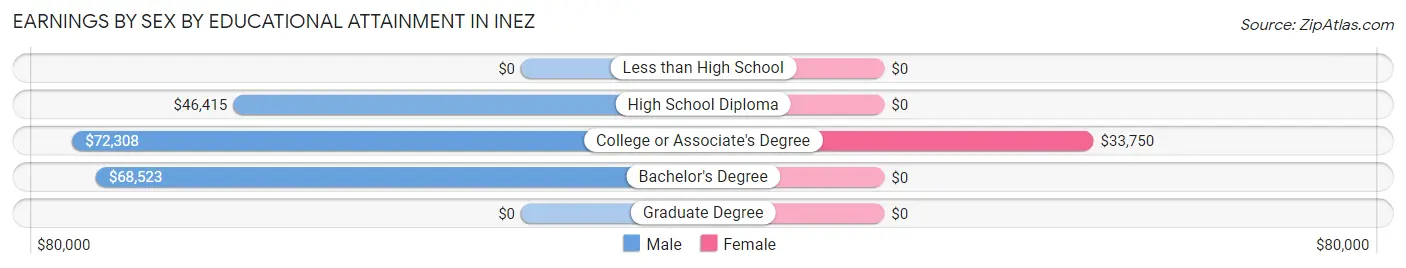
| Educational Attainment | Male Income | Female Income |
| Less than High School | - | - |
| High School Diploma | $46,415 | $0 |
| College or Associate's Degree | $72,308 | $33,750 |
| Bachelor's Degree | $68,523 | $0 |
| Graduate Degree | - | - |
| Total | $66,094 | $36,771 |
Family Income in Inez
Family Income Brackets in Inez
According to the Inez family income data, there are 166 families falling into the $100,000 to $149,999 income range, which is the most common income bracket and makes up 24.1% of all families.
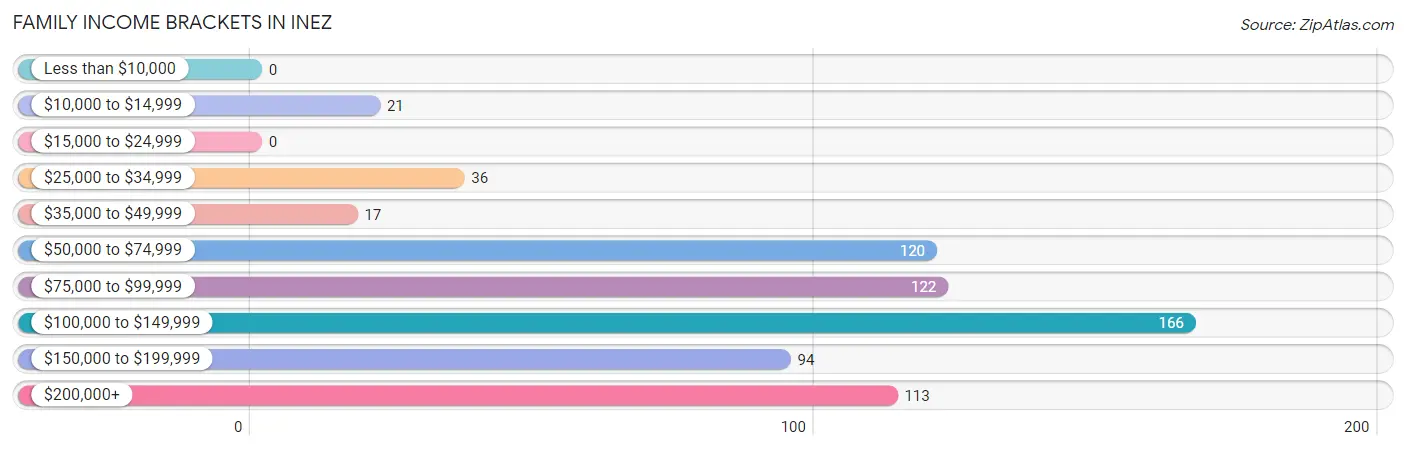
| Income Bracket | # Families | % Families |
| Less than $10,000 | 0 | 0.0% |
| $10,000 to $14,999 | 21 | 3.0% |
| $15,000 to $24,999 | 0 | 0.0% |
| $25,000 to $34,999 | 36 | 5.2% |
| $35,000 to $49,999 | 17 | 2.5% |
| $50,000 to $74,999 | 120 | 17.4% |
| $75,000 to $99,999 | 122 | 17.7% |
| $100,000 to $149,999 | 166 | 24.1% |
| $150,000 to $199,999 | 94 | 13.6% |
| $200,000+ | 113 | 16.4% |
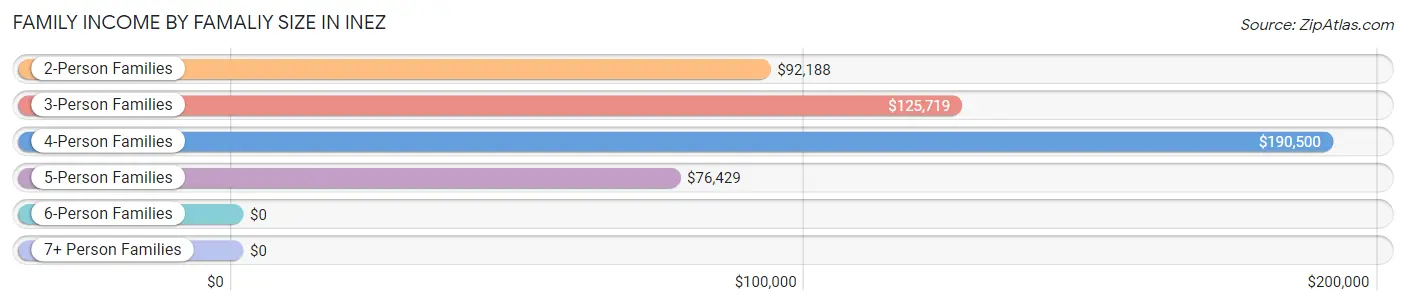
Family Income by Famaliy Size in Inez
4-person families (122 | 17.7%) account for the highest median family income in Inez with $190,500 per family, while 4-person families (122 | 17.7%) have the highest median income of $47,625 per family member.
| Income Bracket | # Families | Median Income |
| 2-Person Families | 327 (47.5%) | $92,188 |
| 3-Person Families | 161 (23.4%) | $125,719 |
| 4-Person Families | 122 (17.7%) | $190,500 |
| 5-Person Families | 70 (10.2%) | $76,429 |
| 6-Person Families | 9 (1.3%) | $0 |
| 7+ Person Families | 0 (0.0%) | $0 |
| Total | 689 (100.0%) | $115,481 |
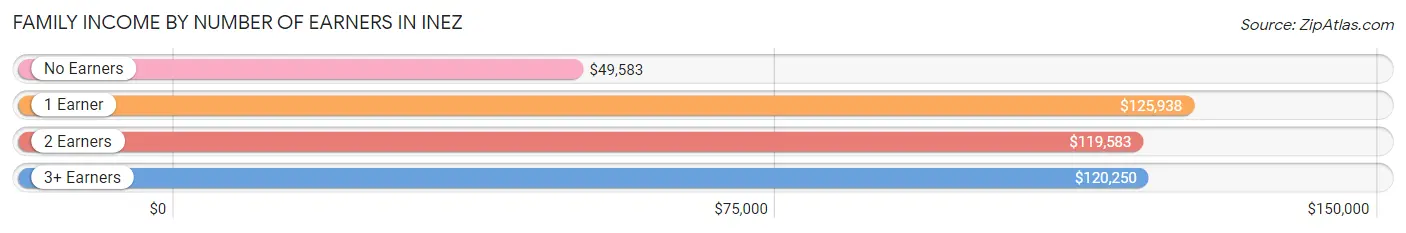
Family Income by Number of Earners in Inez
The median family income in Inez is $115,481, with families comprising 1 earner (242) having the highest median family income of $125,938, while families with no earners (105) have the lowest median family income of $49,583, accounting for 35.1% and 15.2% of families, respectively.
| Number of Earners | # Families | Median Income |
| No Earners | 105 (15.2%) | $49,583 |
| 1 Earner | 242 (35.1%) | $125,938 |
| 2 Earners | 273 (39.6%) | $119,583 |
| 3+ Earners | 69 (10.0%) | $120,250 |
| Total | 689 (100.0%) | $115,481 |
Household Income in Inez
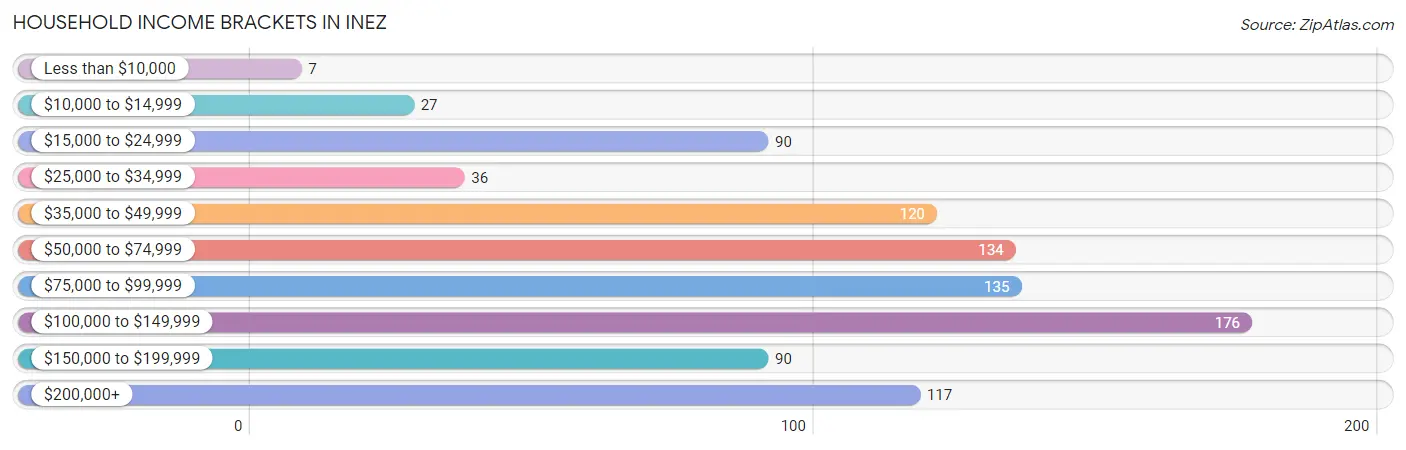
Household Income Brackets in Inez
With 176 households falling in the category, the $100,000 to $149,999 income range is the most frequent in Inez, accounting for 18.9% of all households. In contrast, only 7 households (0.7%) fall into the less than $10,000 income bracket, making it the least populous group.
| Income Bracket | # Households | % Households |
| Less than $10,000 | 7 | 0.8% |
| $10,000 to $14,999 | 27 | 2.9% |
| $15,000 to $24,999 | 90 | 9.7% |
| $25,000 to $34,999 | 36 | 3.9% |
| $35,000 to $49,999 | 120 | 12.9% |
| $50,000 to $74,999 | 134 | 14.4% |
| $75,000 to $99,999 | 135 | 14.5% |
| $100,000 to $149,999 | 176 | 18.9% |
| $150,000 to $199,999 | 90 | 9.7% |
| $200,000+ | 117 | 12.6% |
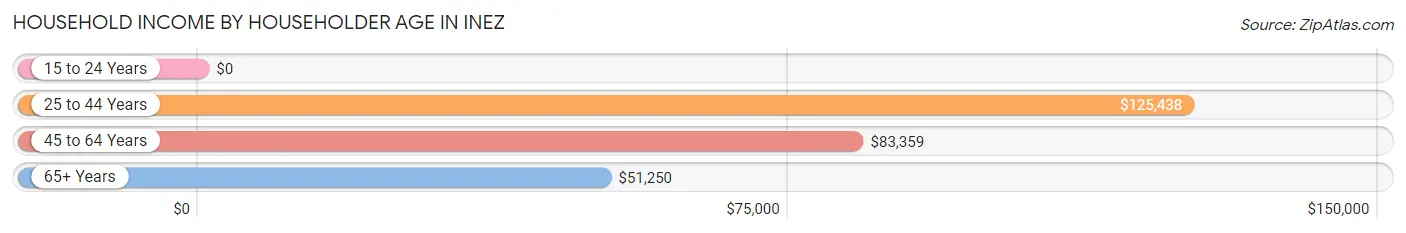
Household Income by Householder Age in Inez
The median household income in Inez is $83,438, with the highest median household income of $125,438 found in the 25 to 44 years age bracket for the primary householder. A total of 318 households (34.1%) fall into this category. Meanwhile, the 15 to 24 years age bracket for the primary householder has the lowest median household income of $0, with 25 households (2.7%) in this group.
| Income Bracket | # Households | Median Income |
| 15 to 24 Years | 25 (2.7%) | $0 |
| 25 to 44 Years | 318 (34.1%) | $125,438 |
| 45 to 64 Years | 281 (30.1%) | $83,359 |
| 65+ Years | 308 (33.1%) | $51,250 |
| Total | 932 (100.0%) | $83,438 |
Poverty in Inez
Income Below Poverty by Sex and Age in Inez
With 5.9% poverty level for males and 1.3% for females among the residents of Inez, 55 to 64 year old males and 25 to 34 year old females are the most vulnerable to poverty, with 57 males (34.5%) and 9 females (7.8%) in their respective age groups living below the poverty level.
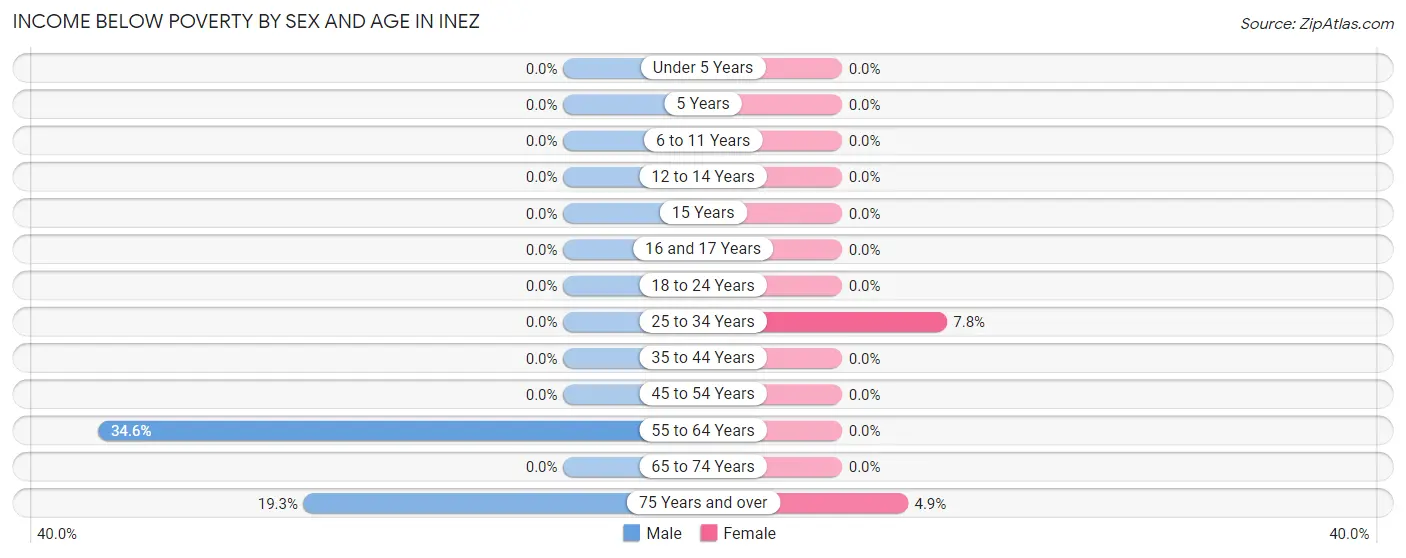
| Age Bracket | Male | Female |
| Under 5 Years | 0 (0.0%) | 0 (0.0%) |
| 5 Years | 0 (0.0%) | 0 (0.0%) |
| 6 to 11 Years | 0 (0.0%) | 0 (0.0%) |
| 12 to 14 Years | 0 (0.0%) | 0 (0.0%) |
| 15 Years | 0 (0.0%) | 0 (0.0%) |
| 16 and 17 Years | 0 (0.0%) | 0 (0.0%) |
| 18 to 24 Years | 0 (0.0%) | 0 (0.0%) |
| 25 to 34 Years | 0 (0.0%) | 9 (7.8%) |
| 35 to 44 Years | 0 (0.0%) | 0 (0.0%) |
| 45 to 54 Years | 0 (0.0%) | 0 (0.0%) |
| 55 to 64 Years | 57 (34.5%) | 0 (0.0%) |
| 65 to 74 Years | 0 (0.0%) | 0 (0.0%) |
| 75 Years and over | 21 (19.3%) | 6 (4.9%) |
| Total | 78 (5.9%) | 15 (1.3%) |
Income Above Poverty by Sex and Age in Inez
According to the poverty statistics in Inez, males aged under 5 years and females aged under 5 years are the age groups that are most secure financially, with 100.0% of males and 100.0% of females in these age groups living above the poverty line.
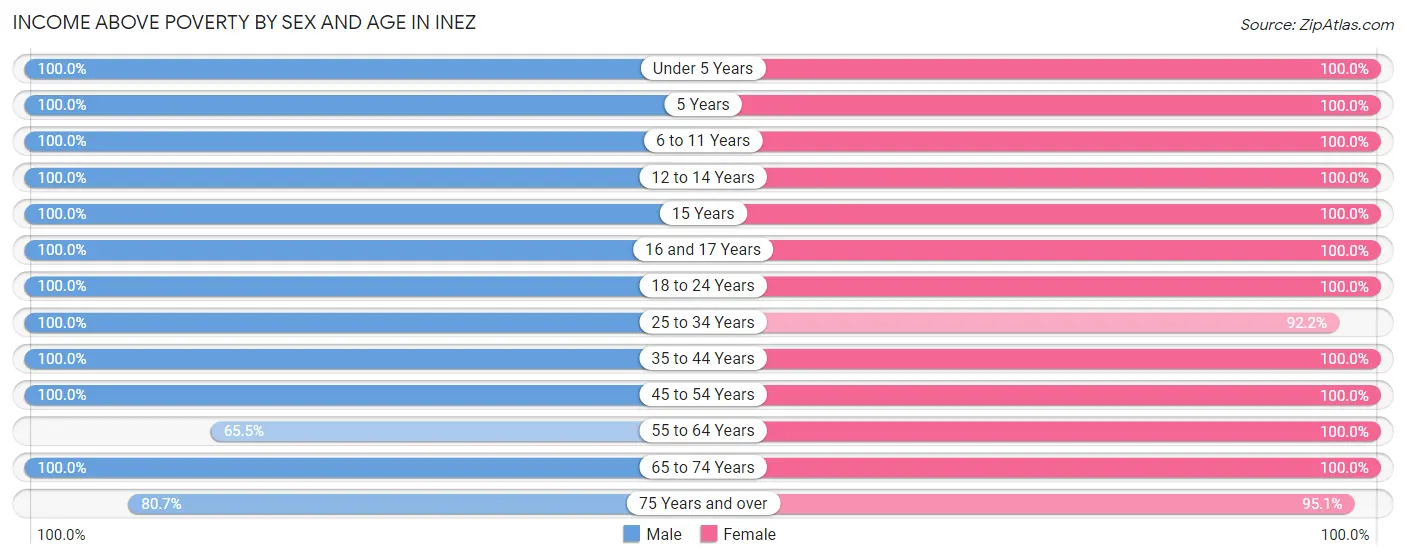
| Age Bracket | Male | Female |
| Under 5 Years | 65 (100.0%) | 73 (100.0%) |
| 5 Years | 16 (100.0%) | 18 (100.0%) |
| 6 to 11 Years | 229 (100.0%) | 56 (100.0%) |
| 12 to 14 Years | 46 (100.0%) | 68 (100.0%) |
| 15 Years | 5 (100.0%) | 14 (100.0%) |
| 16 and 17 Years | 7 (100.0%) | 23 (100.0%) |
| 18 to 24 Years | 70 (100.0%) | 96 (100.0%) |
| 25 to 34 Years | 98 (100.0%) | 107 (92.2%) |
| 35 to 44 Years | 203 (100.0%) | 175 (100.0%) |
| 45 to 54 Years | 182 (100.0%) | 162 (100.0%) |
| 55 to 64 Years | 108 (65.4%) | 113 (100.0%) |
| 65 to 74 Years | 128 (100.0%) | 75 (100.0%) |
| 75 Years and over | 88 (80.7%) | 117 (95.1%) |
| Total | 1,245 (94.1%) | 1,097 (98.7%) |
Income Below Poverty Among Married-Couple Families in Inez
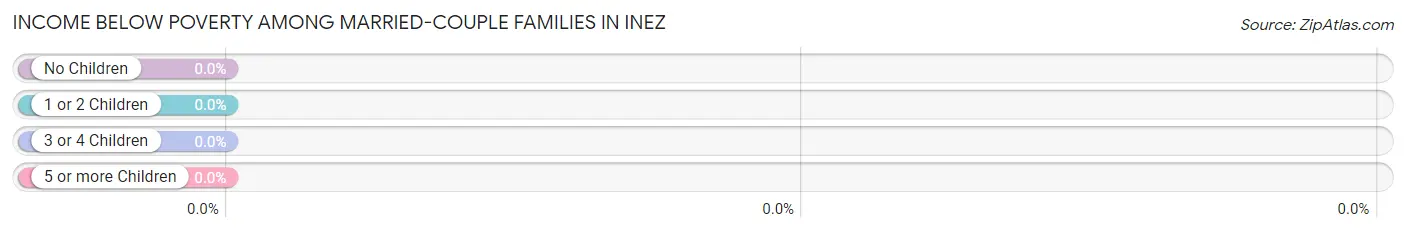
| Children | Above Poverty | Below Poverty |
| No Children | 371 (100.0%) | 0 (0.0%) |
| 1 or 2 Children | 217 (100.0%) | 0 (0.0%) |
| 3 or 4 Children | 47 (100.0%) | 0 (0.0%) |
| 5 or more Children | 0 (0.0%) | 0 (0.0%) |
| Total | 635 (100.0%) | 0 (0.0%) |
Income Below Poverty Among Single-Parent Households in Inez
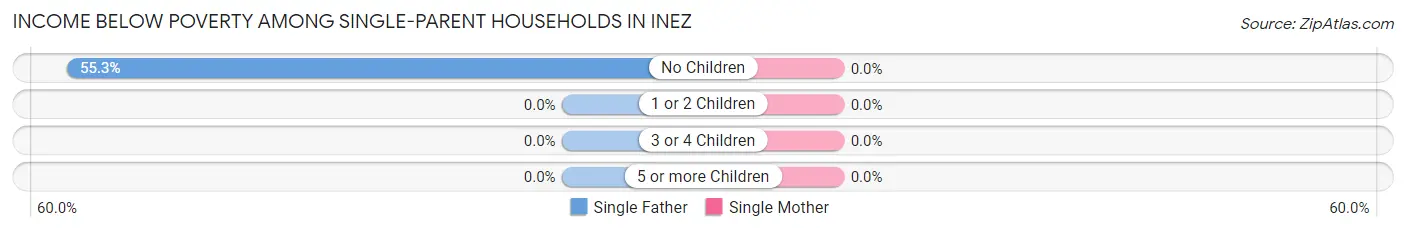
| Children | Single Father | Single Mother |
| No Children | 21 (55.3%) | 0 (0.0%) |
| 1 or 2 Children | 0 (0.0%) | 0 (0.0%) |
| 3 or 4 Children | 0 (0.0%) | 0 (0.0%) |
| 5 or more Children | 0 (0.0%) | 0 (0.0%) |
| Total | 21 (55.3%) | 0 (0.0%) |
Income Below Poverty Among Married-Couple vs Single-Parent Households in Inez
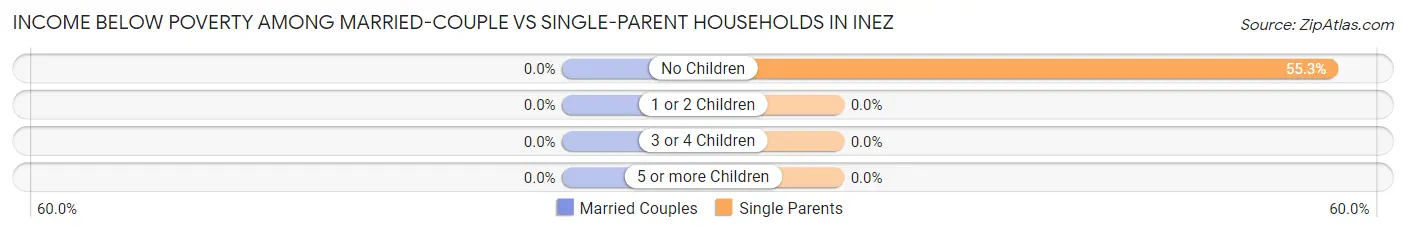
| Children | Married-Couple Families | Single-Parent Households |
| No Children | 0 (0.0%) | 21 (55.3%) |
| 1 or 2 Children | 0 (0.0%) | 0 (0.0%) |
| 3 or 4 Children | 0 (0.0%) | 0 (0.0%) |
| 5 or more Children | 0 (0.0%) | 0 (0.0%) |
| Total | 0 (0.0%) | 21 (38.9%) |
Employment Characteristics in Inez
Employment by Class of Employer in Inez
Among the 1,149 employed individuals in Inez, private company employees (836 | 72.8%), self-employed (not incorporated) (87 | 7.6%), and local government employees (79 | 6.9%) make up the most common classes of employment.
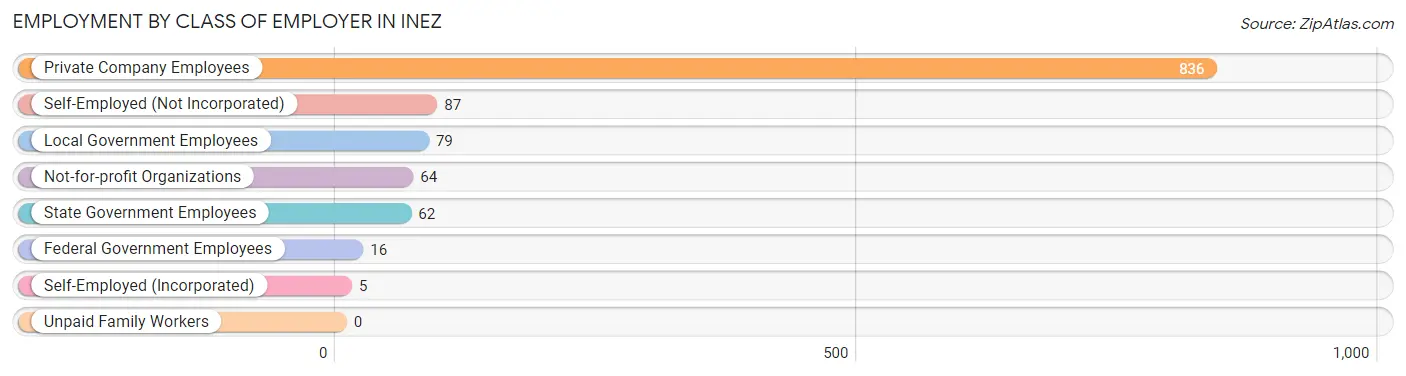
| Employer Class | # Employees | % Employees |
| Private Company Employees | 836 | 72.8% |
| Self-Employed (Incorporated) | 5 | 0.4% |
| Self-Employed (Not Incorporated) | 87 | 7.6% |
| Not-for-profit Organizations | 64 | 5.6% |
| Local Government Employees | 79 | 6.9% |
| State Government Employees | 62 | 5.4% |
| Federal Government Employees | 16 | 1.4% |
| Unpaid Family Workers | 0 | 0.0% |
| Total | 1,149 | 100.0% |
Employment Status by Age in Inez
According to the labor force statistics for Inez, out of the total population over 16 years of age (1,845), 63.6% or 1,173 individuals are in the labor force, with 2.1% or 25 of them unemployed. The age group with the highest labor force participation rate is 20 to 24 years, with 100.0% or 115 individuals in the labor force. Within the labor force, the 55 to 59 years age range has the highest percentage of unemployed individuals, with 21.4% or 25 of them being unemployed.
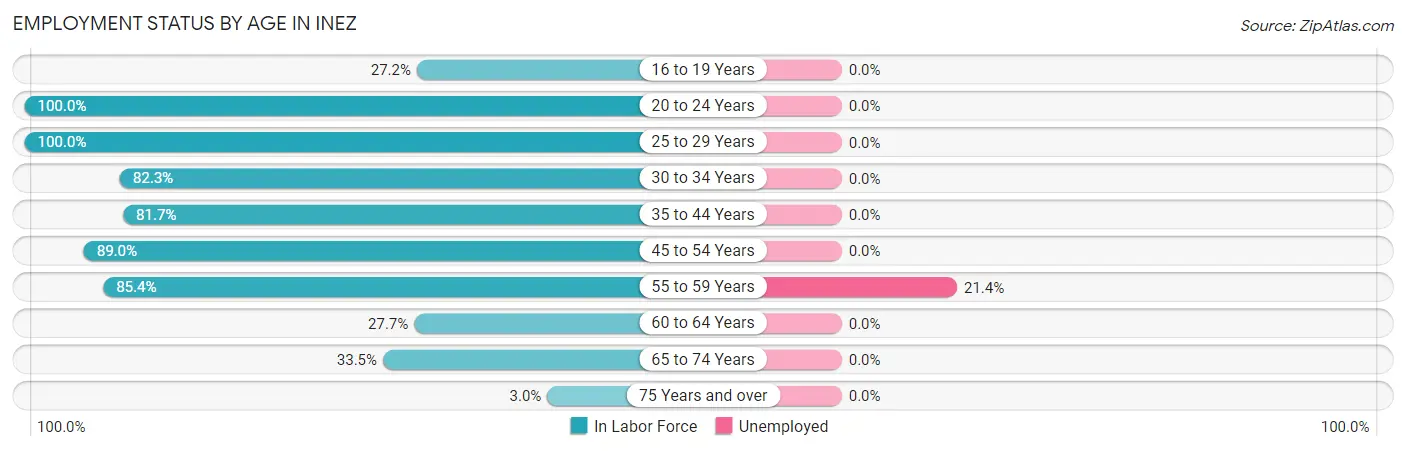
| Age Bracket | In Labor Force | Unemployed |
| 16 to 19 Years | 22 (27.2%) | 0 (0.0%) |
| 20 to 24 Years | 115 (100.0%) | 0 (0.0%) |
| 25 to 29 Years | 84 (100.0%) | 0 (0.0%) |
| 30 to 34 Years | 107 (82.3%) | 0 (0.0%) |
| 35 to 44 Years | 309 (81.7%) | 0 (0.0%) |
| 45 to 54 Years | 306 (89.0%) | 0 (0.0%) |
| 55 to 59 Years | 117 (85.4%) | 25 (21.4%) |
| 60 to 64 Years | 39 (27.7%) | 0 (0.0%) |
| 65 to 74 Years | 68 (33.5%) | 0 (0.0%) |
| 75 Years and over | 7 (3.0%) | 0 (0.0%) |
| Total | 1,173 (63.6%) | 25 (2.1%) |
Employment Status by Educational Attainment in Inez
According to labor force statistics for Inez, 79.2% of individuals (961) out of the total population between 25 and 64 years of age (1,214) are in the labor force, with 2.6% or 25 of them being unemployed. The group with the highest labor force participation rate are those with the educational attainment of less than high school, with 100.0% or 20 individuals in the labor force. Within the labor force, individuals with bachelor's degree or higher education have the highest percentage of unemployment, with 7.3% or 25 of them being unemployed.
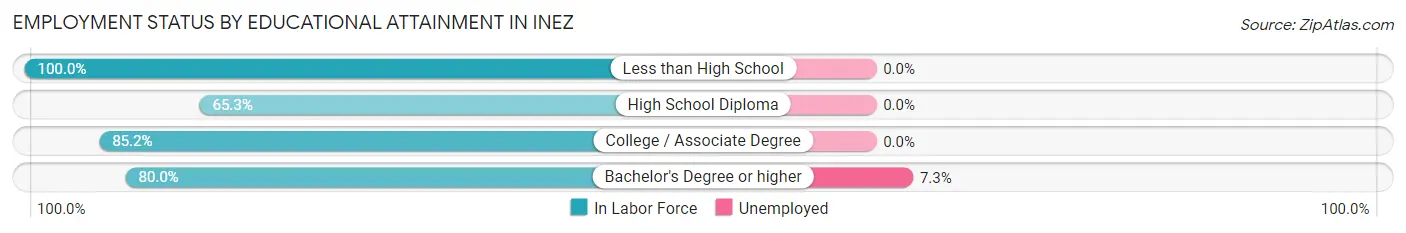
| Educational Attainment | In Labor Force | Unemployed |
| Less than High School | 20 (100.0%) | 0 (0.0%) |
| High School Diploma | 175 (65.3%) | 0 (0.0%) |
| College / Associate Degree | 426 (85.2%) | 0 (0.0%) |
| Bachelor's Degree or higher | 341 (80.0%) | 31 (7.3%) |
| Total | 961 (79.2%) | 32 (2.6%) |
Employment Occupations by Sex in Inez
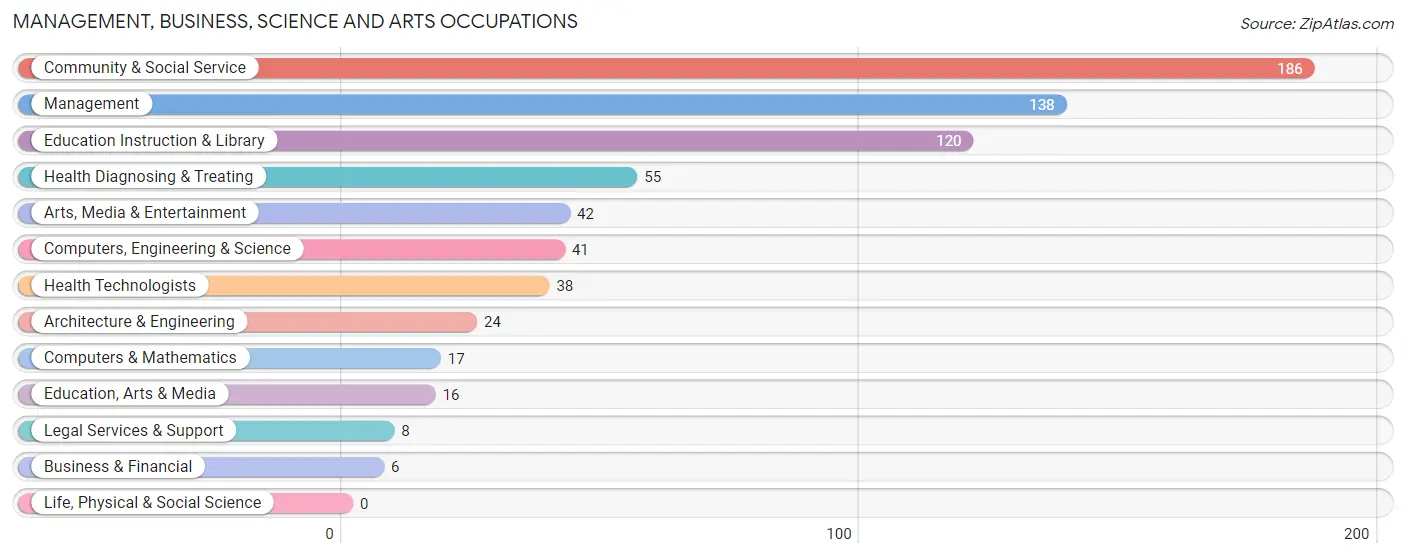
Management, Business, Science and Arts Occupations
The most common Management, Business, Science and Arts occupations in Inez are Community & Social Service (186 | 16.2%), Management (138 | 12.0%), Education Instruction & Library (120 | 10.4%), Health Diagnosing & Treating (55 | 4.8%), and Arts, Media & Entertainment (42 | 3.7%).
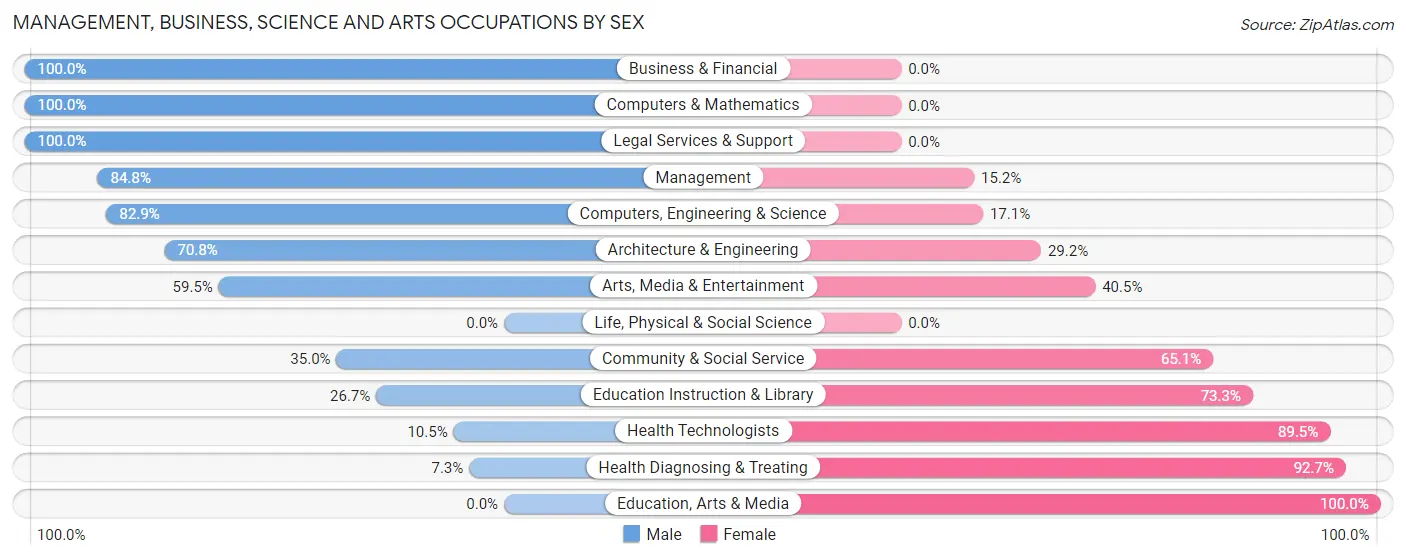
Management, Business, Science and Arts Occupations by Sex
Within the Management, Business, Science and Arts occupations in Inez, the most male-oriented occupations are Business & Financial (100.0%), Computers & Mathematics (100.0%), and Legal Services & Support (100.0%), while the most female-oriented occupations are Education, Arts & Media (100.0%), Health Diagnosing & Treating (92.7%), and Health Technologists (89.5%).
| Occupation | Male | Female |
| Management | 117 (84.8%) | 21 (15.2%) |
| Business & Financial | 6 (100.0%) | 0 (0.0%) |
| Computers, Engineering & Science | 34 (82.9%) | 7 (17.1%) |
| Computers & Mathematics | 17 (100.0%) | 0 (0.0%) |
| Architecture & Engineering | 17 (70.8%) | 7 (29.2%) |
| Life, Physical & Social Science | 0 (0.0%) | 0 (0.0%) |
| Community & Social Service | 65 (34.9%) | 121 (65.0%) |
| Education, Arts & Media | 0 (0.0%) | 16 (100.0%) |
| Legal Services & Support | 8 (100.0%) | 0 (0.0%) |
| Education Instruction & Library | 32 (26.7%) | 88 (73.3%) |
| Arts, Media & Entertainment | 25 (59.5%) | 17 (40.5%) |
| Health Diagnosing & Treating | 4 (7.3%) | 51 (92.7%) |
| Health Technologists | 4 (10.5%) | 34 (89.5%) |
| Total (Category) | 226 (53.0%) | 200 (46.9%) |
| Total (Overall) | 709 (61.7%) | 440 (38.3%) |
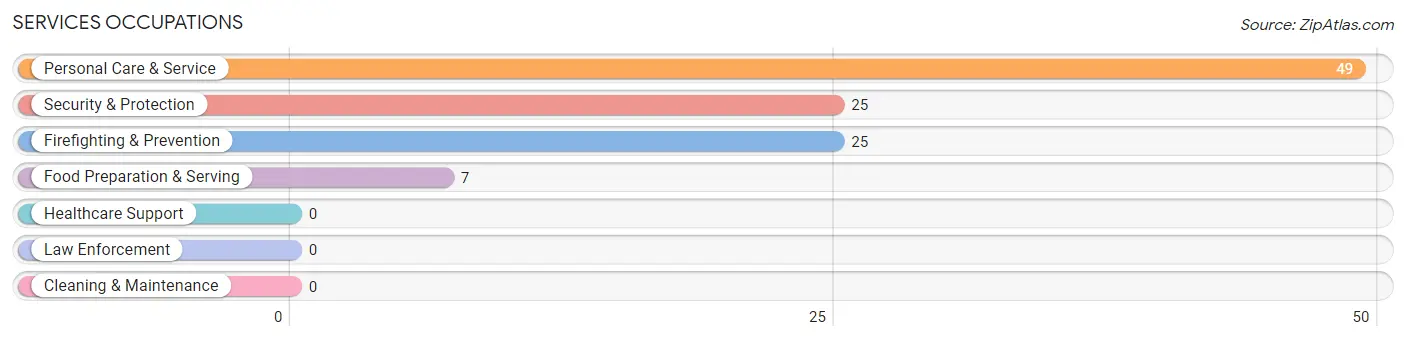
Services Occupations
The most common Services occupations in Inez are Personal Care & Service (49 | 4.3%), Security & Protection (25 | 2.2%), Firefighting & Prevention (25 | 2.2%), and Food Preparation & Serving (7 | 0.6%).
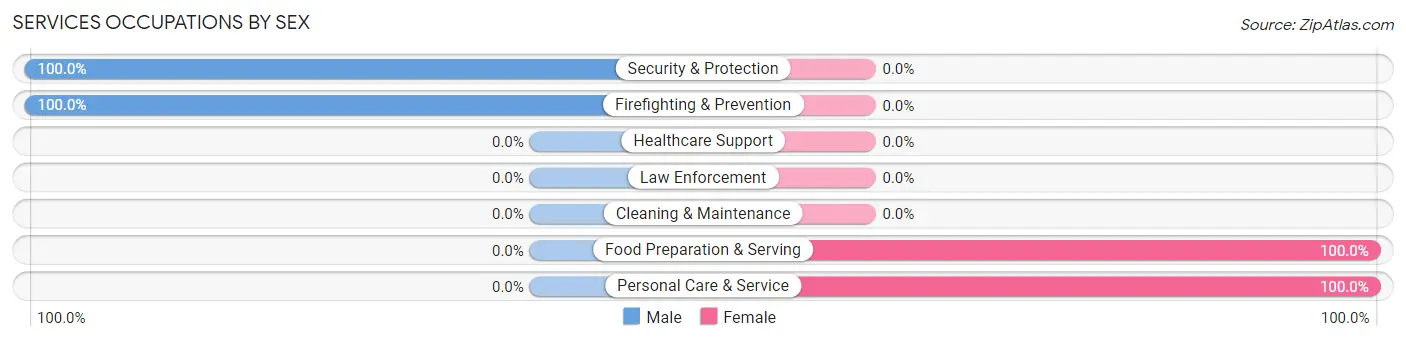
Services Occupations by Sex
Within the Services occupations in Inez, the most male-oriented occupations are Security & Protection (100.0%), and Firefighting & Prevention (100.0%), while the most female-oriented occupations are Food Preparation & Serving (100.0%), and Personal Care & Service (100.0%).
| Occupation | Male | Female |
| Healthcare Support | 0 (0.0%) | 0 (0.0%) |
| Security & Protection | 25 (100.0%) | 0 (0.0%) |
| Firefighting & Prevention | 25 (100.0%) | 0 (0.0%) |
| Law Enforcement | 0 (0.0%) | 0 (0.0%) |
| Food Preparation & Serving | 0 (0.0%) | 7 (100.0%) |
| Cleaning & Maintenance | 0 (0.0%) | 0 (0.0%) |
| Personal Care & Service | 0 (0.0%) | 49 (100.0%) |
| Total (Category) | 25 (30.9%) | 56 (69.1%) |
| Total (Overall) | 709 (61.7%) | 440 (38.3%) |
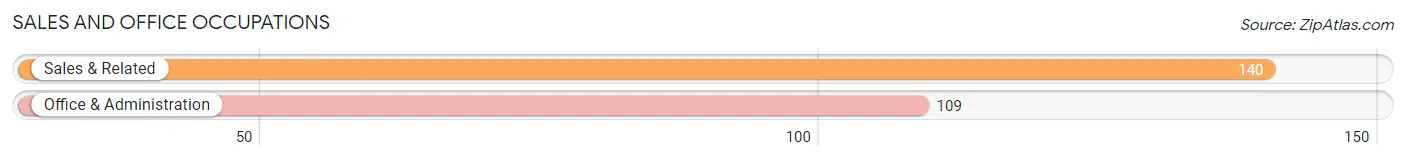
Sales and Office Occupations
The most common Sales and Office occupations in Inez are Sales & Related (140 | 12.2%), and Office & Administration (109 | 9.5%).
Sales and Office Occupations by Sex
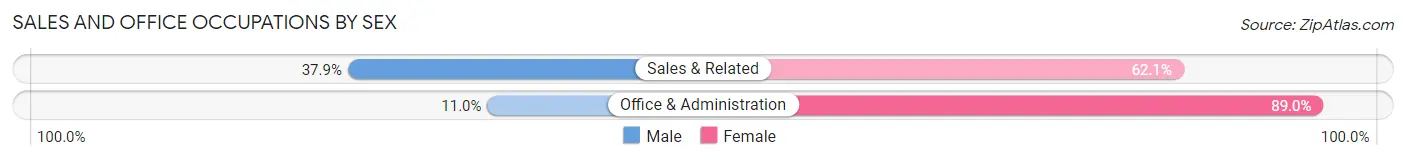
| Occupation | Male | Female |
| Sales & Related | 53 (37.9%) | 87 (62.1%) |
| Office & Administration | 12 (11.0%) | 97 (89.0%) |
| Total (Category) | 65 (26.1%) | 184 (73.9%) |
| Total (Overall) | 709 (61.7%) | 440 (38.3%) |
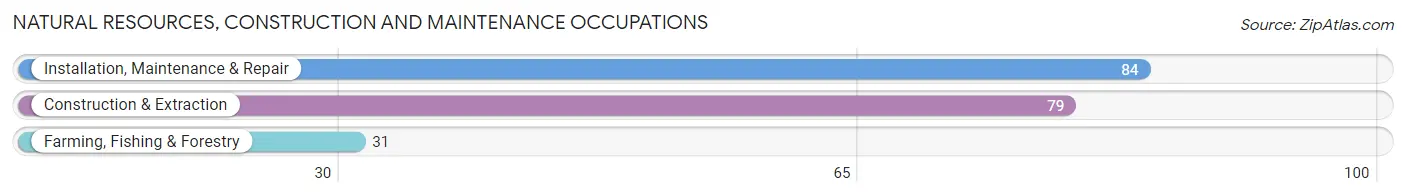
Natural Resources, Construction and Maintenance Occupations
The most common Natural Resources, Construction and Maintenance occupations in Inez are Installation, Maintenance & Repair (84 | 7.3%), Construction & Extraction (79 | 6.9%), and Farming, Fishing & Forestry (31 | 2.7%).
Natural Resources, Construction and Maintenance Occupations by Sex
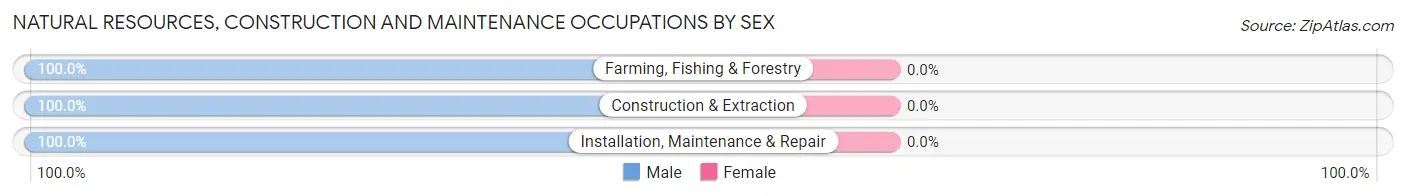
| Occupation | Male | Female |
| Farming, Fishing & Forestry | 31 (100.0%) | 0 (0.0%) |
| Construction & Extraction | 79 (100.0%) | 0 (0.0%) |
| Installation, Maintenance & Repair | 84 (100.0%) | 0 (0.0%) |
| Total (Category) | 194 (100.0%) | 0 (0.0%) |
| Total (Overall) | 709 (61.7%) | 440 (38.3%) |
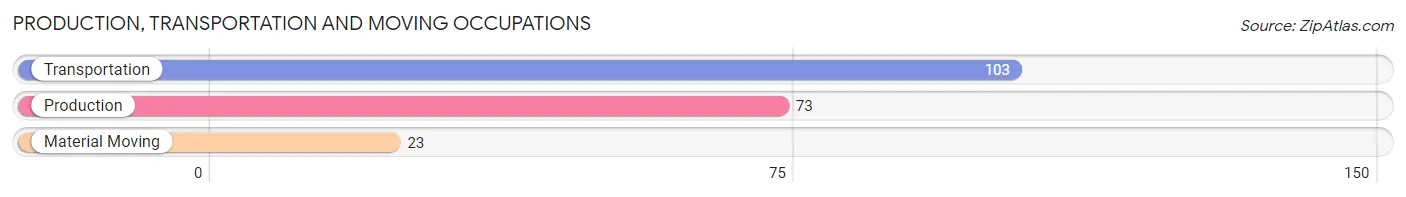
Production, Transportation and Moving Occupations
The most common Production, Transportation and Moving occupations in Inez are Transportation (103 | 9.0%), Production (73 | 6.4%), and Material Moving (23 | 2.0%).
Production, Transportation and Moving Occupations by Sex
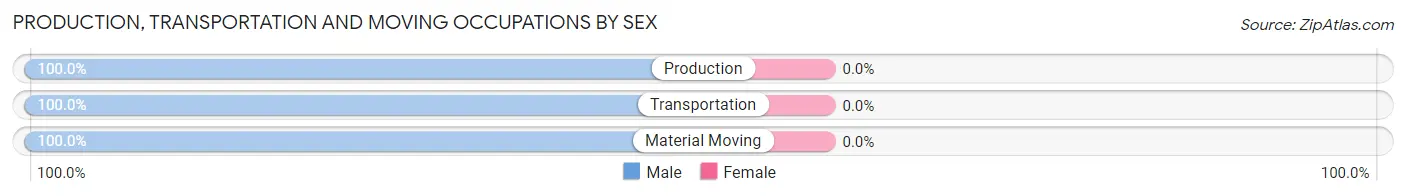
| Occupation | Male | Female |
| Production | 73 (100.0%) | 0 (0.0%) |
| Transportation | 103 (100.0%) | 0 (0.0%) |
| Material Moving | 23 (100.0%) | 0 (0.0%) |
| Total (Category) | 199 (100.0%) | 0 (0.0%) |
| Total (Overall) | 709 (61.7%) | 440 (38.3%) |
Employment Industries by Sex in Inez
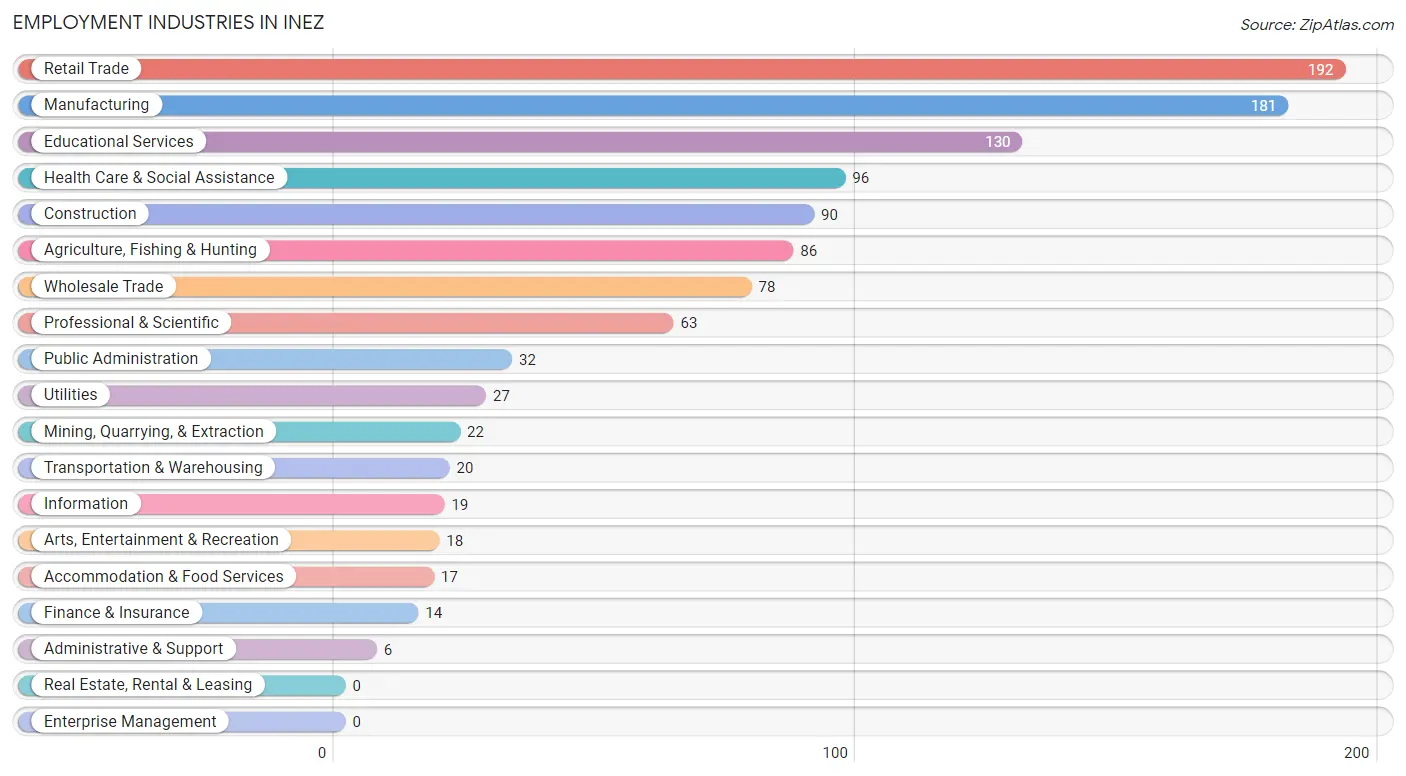
Employment Industries in Inez
The major employment industries in Inez include Retail Trade (192 | 16.7%), Manufacturing (181 | 15.8%), Educational Services (130 | 11.3%), Health Care & Social Assistance (96 | 8.4%), and Construction (90 | 7.8%).
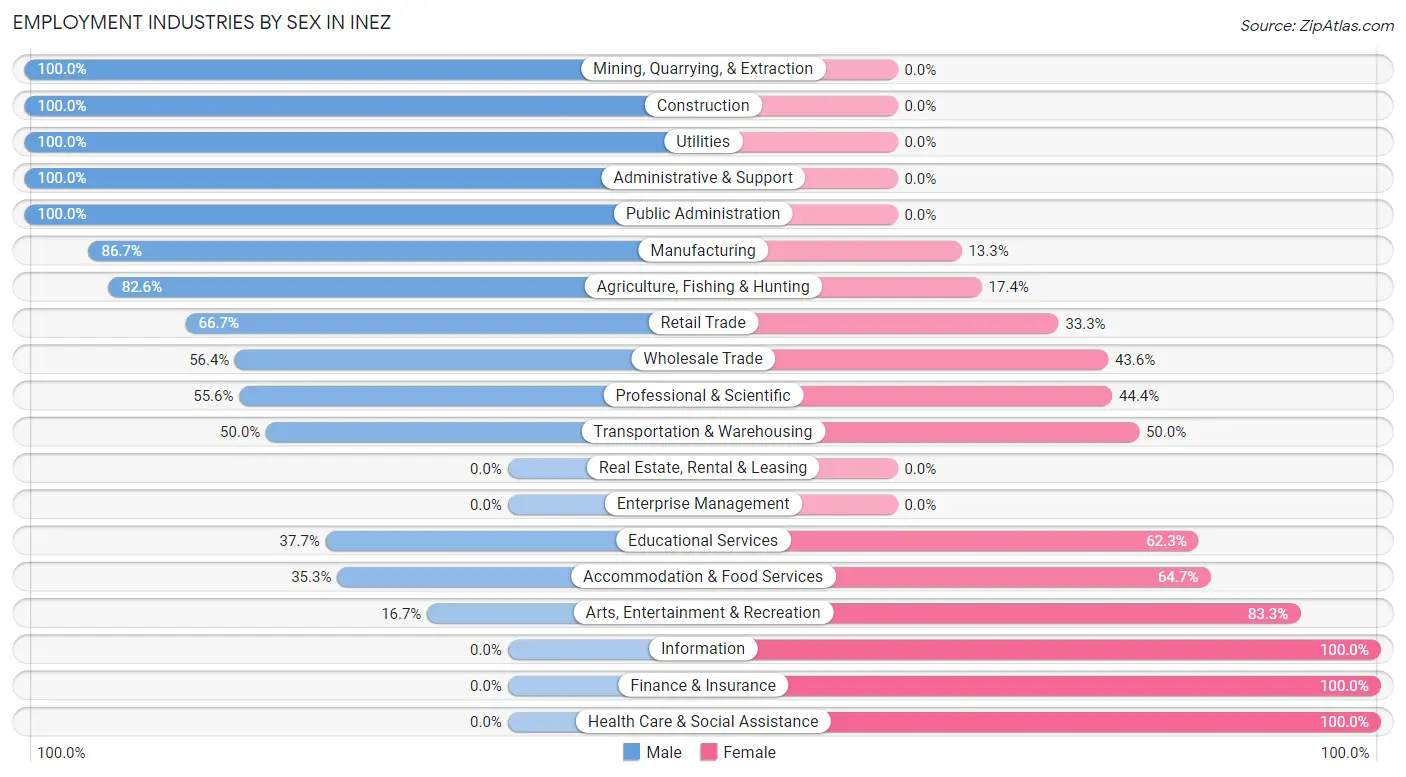
Employment Industries by Sex in Inez
The Inez industries that see more men than women are Mining, Quarrying, & Extraction (100.0%), Construction (100.0%), and Utilities (100.0%), whereas the industries that tend to have a higher number of women are Information (100.0%), Finance & Insurance (100.0%), and Health Care & Social Assistance (100.0%).
| Industry | Male | Female |
| Agriculture, Fishing & Hunting | 71 (82.6%) | 15 (17.4%) |
| Mining, Quarrying, & Extraction | 22 (100.0%) | 0 (0.0%) |
| Construction | 90 (100.0%) | 0 (0.0%) |
| Manufacturing | 157 (86.7%) | 24 (13.3%) |
| Wholesale Trade | 44 (56.4%) | 34 (43.6%) |
| Retail Trade | 128 (66.7%) | 64 (33.3%) |
| Transportation & Warehousing | 10 (50.0%) | 10 (50.0%) |
| Utilities | 27 (100.0%) | 0 (0.0%) |
| Information | 0 (0.0%) | 19 (100.0%) |
| Finance & Insurance | 0 (0.0%) | 14 (100.0%) |
| Real Estate, Rental & Leasing | 0 (0.0%) | 0 (0.0%) |
| Professional & Scientific | 35 (55.6%) | 28 (44.4%) |
| Enterprise Management | 0 (0.0%) | 0 (0.0%) |
| Administrative & Support | 6 (100.0%) | 0 (0.0%) |
| Educational Services | 49 (37.7%) | 81 (62.3%) |
| Health Care & Social Assistance | 0 (0.0%) | 96 (100.0%) |
| Arts, Entertainment & Recreation | 3 (16.7%) | 15 (83.3%) |
| Accommodation & Food Services | 6 (35.3%) | 11 (64.7%) |
| Public Administration | 32 (100.0%) | 0 (0.0%) |
| Total | 709 (61.7%) | 440 (38.3%) |
Education in Inez
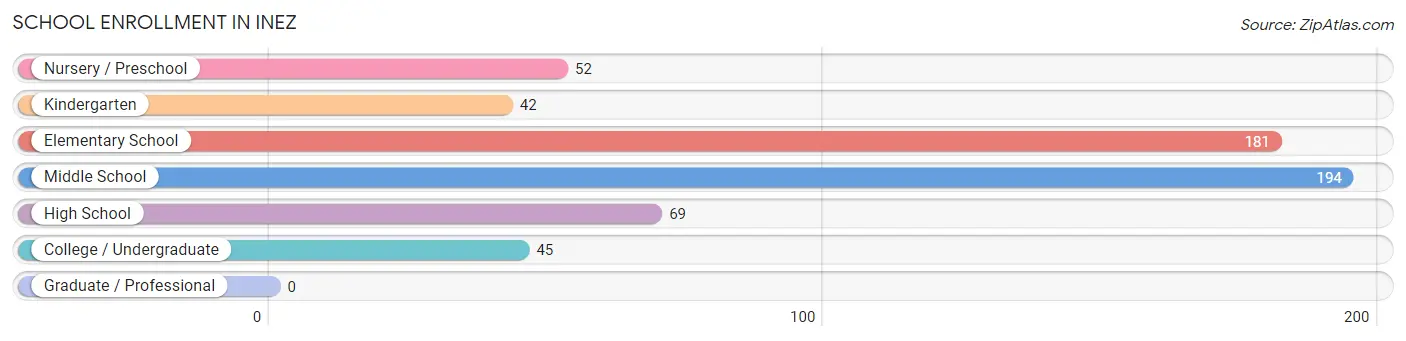
School Enrollment in Inez
The most common levels of schooling among the 583 students in Inez are middle school (194 | 33.3%), elementary school (181 | 31.0%), and high school (69 | 11.8%).
| School Level | # Students | % Students |
| Nursery / Preschool | 52 | 8.9% |
| Kindergarten | 42 | 7.2% |
| Elementary School | 181 | 31.0% |
| Middle School | 194 | 33.3% |
| High School | 69 | 11.8% |
| College / Undergraduate | 45 | 7.7% |
| Graduate / Professional | 0 | 0.0% |
| Total | 583 | 100.0% |
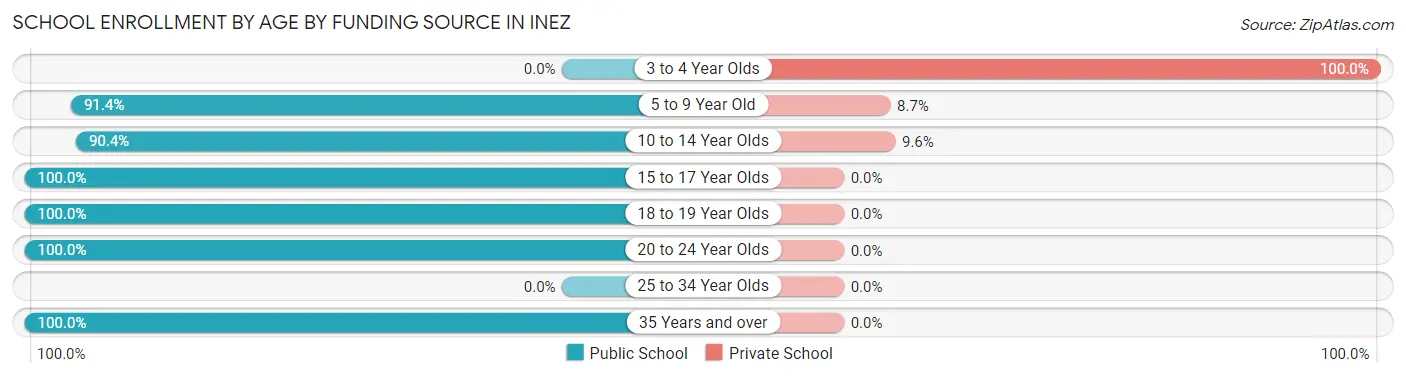
School Enrollment by Age by Funding Source in Inez
Out of a total of 583 students who are enrolled in schools in Inez, 90 (15.4%) attend a private institution, while the remaining 493 (84.6%) are enrolled in public schools. The age group of 3 to 4 year olds has the highest likelihood of being enrolled in private schools, with 52 (100.0% in the age bracket) enrolled. Conversely, the age group of 15 to 17 year olds has the lowest likelihood of being enrolled in a private school, with 49 (100.0% in the age bracket) attending a public institution.
| Age Bracket | Public School | Private School |
| 3 to 4 Year Olds | 0 (0.0%) | 52 (100.0%) |
| 5 to 9 Year Old | 190 (91.3%) | 18 (8.6%) |
| 10 to 14 Year Olds | 189 (90.4%) | 20 (9.6%) |
| 15 to 17 Year Olds | 49 (100.0%) | 0 (0.0%) |
| 18 to 19 Year Olds | 39 (100.0%) | 0 (0.0%) |
| 20 to 24 Year Olds | 15 (100.0%) | 0 (0.0%) |
| 25 to 34 Year Olds | 0 (0.0%) | 0 (0.0%) |
| 35 Years and over | 11 (100.0%) | 0 (0.0%) |
| Total | 493 (84.6%) | 90 (15.4%) |
Educational Attainment by Field of Study in Inez
Business (126 | 22.9%), education (113 | 20.5%), bio, nature & agricultural (73 | 13.3%), engineering (72 | 13.1%), and social sciences (69 | 12.5%) are the most common fields of study among 551 individuals in Inez who have obtained a bachelor's degree or higher.
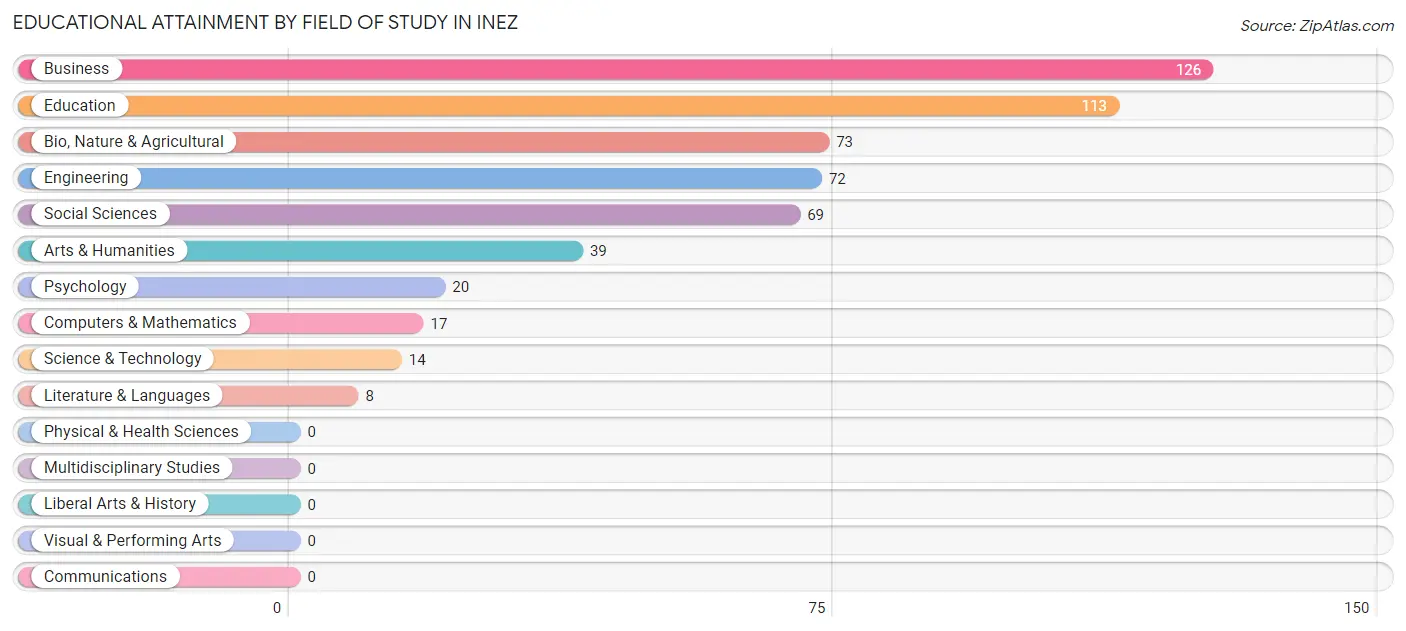
| Field of Study | # Graduates | % Graduates |
| Computers & Mathematics | 17 | 3.1% |
| Bio, Nature & Agricultural | 73 | 13.3% |
| Physical & Health Sciences | 0 | 0.0% |
| Psychology | 20 | 3.6% |
| Social Sciences | 69 | 12.5% |
| Engineering | 72 | 13.1% |
| Multidisciplinary Studies | 0 | 0.0% |
| Science & Technology | 14 | 2.5% |
| Business | 126 | 22.9% |
| Education | 113 | 20.5% |
| Literature & Languages | 8 | 1.5% |
| Liberal Arts & History | 0 | 0.0% |
| Visual & Performing Arts | 0 | 0.0% |
| Communications | 0 | 0.0% |
| Arts & Humanities | 39 | 7.1% |
| Total | 551 | 100.0% |
Transportation & Commute in Inez
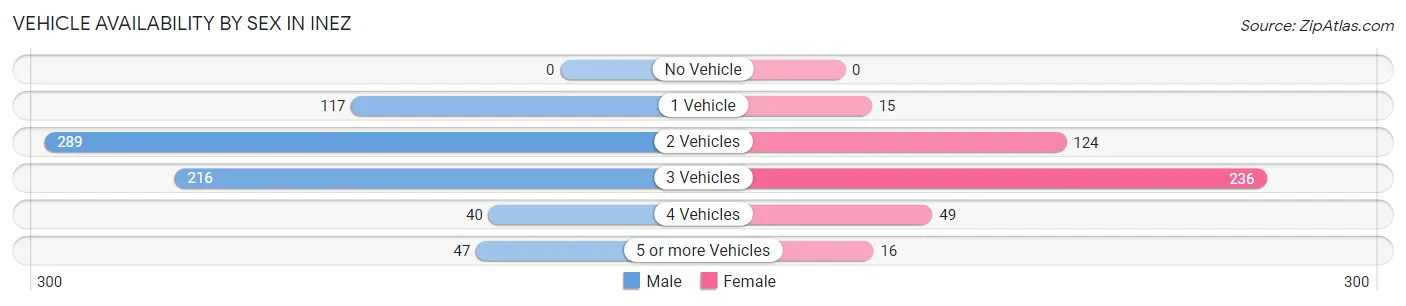
Vehicle Availability by Sex in Inez
The most prevalent vehicle ownership categories in Inez are males with 2 vehicles (289, accounting for 40.8%) and females with 2 vehicles (124, making up 65.7%).
| Vehicles Available | Male | Female |
| No Vehicle | 0 (0.0%) | 0 (0.0%) |
| 1 Vehicle | 117 (16.5%) | 15 (3.4%) |
| 2 Vehicles | 289 (40.8%) | 124 (28.2%) |
| 3 Vehicles | 216 (30.5%) | 236 (53.6%) |
| 4 Vehicles | 40 (5.6%) | 49 (11.1%) |
| 5 or more Vehicles | 47 (6.6%) | 16 (3.6%) |
| Total | 709 (100.0%) | 440 (100.0%) |
Commute Time in Inez
The most frequently occuring commute durations in Inez are 20 to 24 minutes (351 commuters, 31.3%), 25 to 29 minutes (214 commuters, 19.1%), and 15 to 19 minutes (147 commuters, 13.1%).
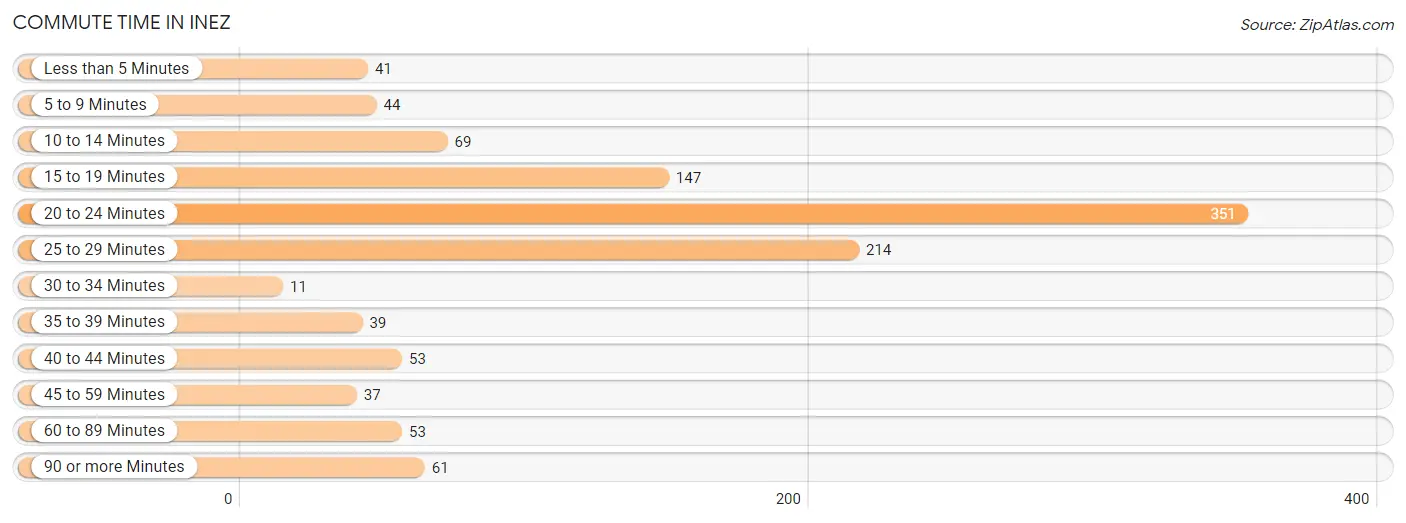
| Commute Time | # Commuters | % Commuters |
| Less than 5 Minutes | 41 | 3.7% |
| 5 to 9 Minutes | 44 | 3.9% |
| 10 to 14 Minutes | 69 | 6.2% |
| 15 to 19 Minutes | 147 | 13.1% |
| 20 to 24 Minutes | 351 | 31.3% |
| 25 to 29 Minutes | 214 | 19.1% |
| 30 to 34 Minutes | 11 | 1.0% |
| 35 to 39 Minutes | 39 | 3.5% |
| 40 to 44 Minutes | 53 | 4.7% |
| 45 to 59 Minutes | 37 | 3.3% |
| 60 to 89 Minutes | 53 | 4.7% |
| 90 or more Minutes | 61 | 5.4% |
Commute Time by Sex in Inez
The most common commute times in Inez are 20 to 24 minutes (177 commuters, 25.9%) for males and 20 to 24 minutes (174 commuters, 39.9%) for females.
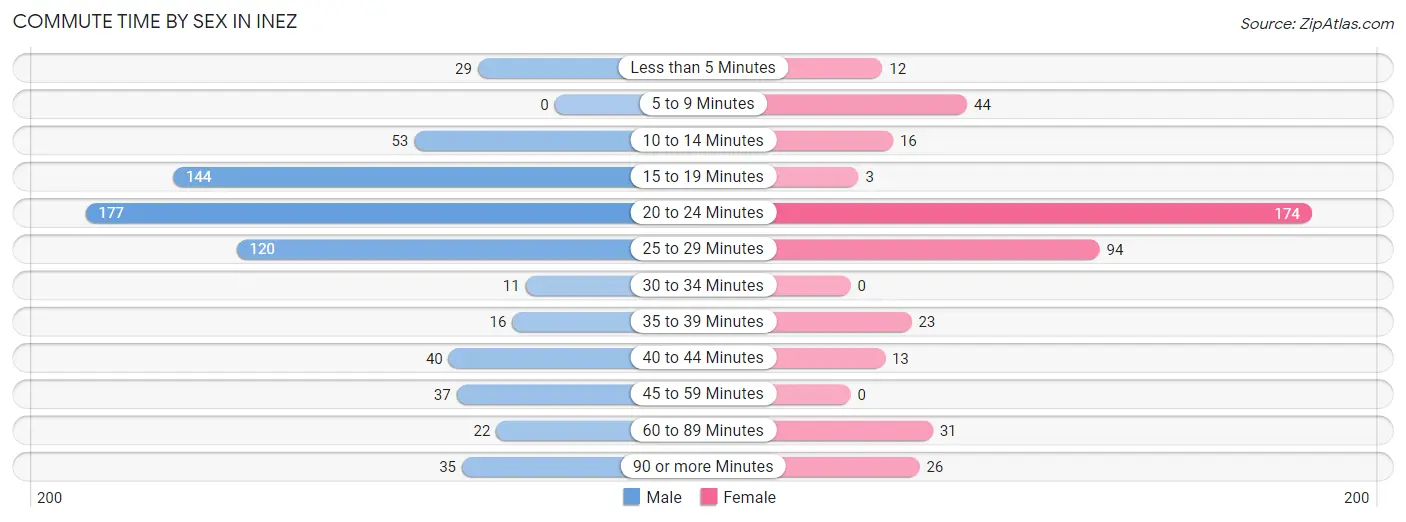
| Commute Time | Male | Female |
| Less than 5 Minutes | 29 (4.2%) | 12 (2.8%) |
| 5 to 9 Minutes | 0 (0.0%) | 44 (10.1%) |
| 10 to 14 Minutes | 53 (7.7%) | 16 (3.7%) |
| 15 to 19 Minutes | 144 (21.0%) | 3 (0.7%) |
| 20 to 24 Minutes | 177 (25.9%) | 174 (39.9%) |
| 25 to 29 Minutes | 120 (17.5%) | 94 (21.6%) |
| 30 to 34 Minutes | 11 (1.6%) | 0 (0.0%) |
| 35 to 39 Minutes | 16 (2.3%) | 23 (5.3%) |
| 40 to 44 Minutes | 40 (5.9%) | 13 (3.0%) |
| 45 to 59 Minutes | 37 (5.4%) | 0 (0.0%) |
| 60 to 89 Minutes | 22 (3.2%) | 31 (7.1%) |
| 90 or more Minutes | 35 (5.1%) | 26 (6.0%) |
Time of Departure to Work by Sex in Inez
The most frequent times of departure to work in Inez are 6:30 AM to 6:59 AM (127, 18.6%) for males and 7:00 AM to 7:29 AM (150, 34.4%) for females.
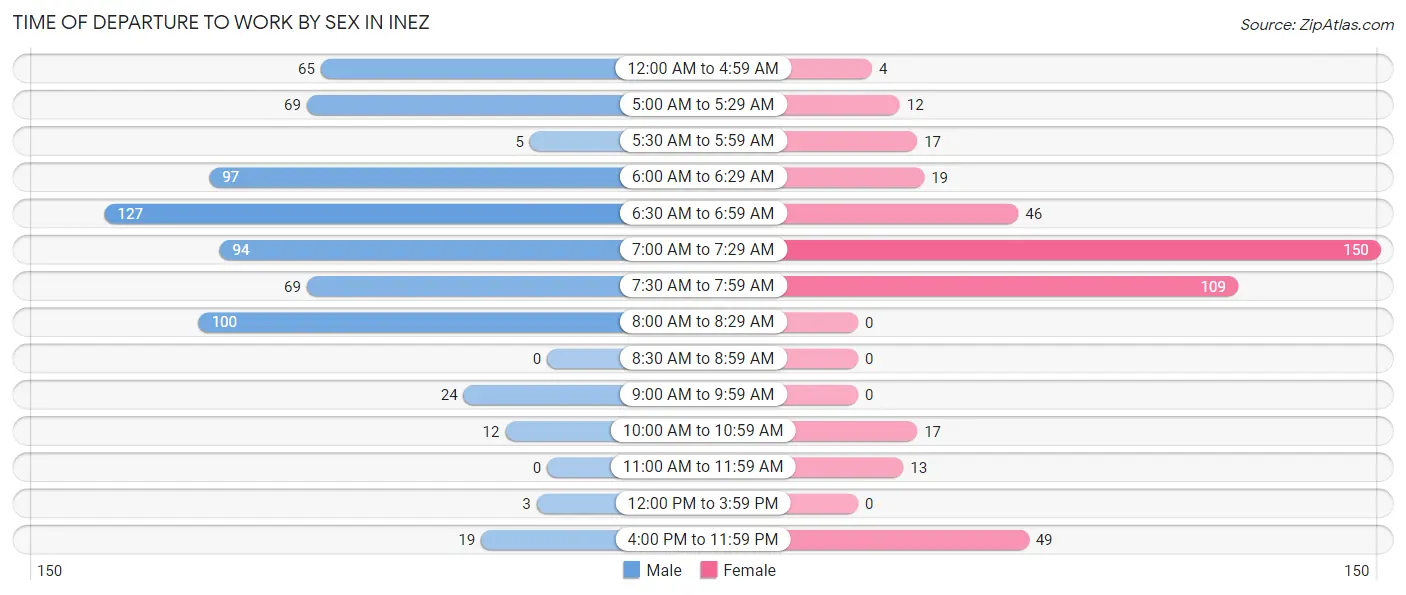
| Time of Departure | Male | Female |
| 12:00 AM to 4:59 AM | 65 (9.5%) | 4 (0.9%) |
| 5:00 AM to 5:29 AM | 69 (10.1%) | 12 (2.8%) |
| 5:30 AM to 5:59 AM | 5 (0.7%) | 17 (3.9%) |
| 6:00 AM to 6:29 AM | 97 (14.2%) | 19 (4.4%) |
| 6:30 AM to 6:59 AM | 127 (18.6%) | 46 (10.5%) |
| 7:00 AM to 7:29 AM | 94 (13.7%) | 150 (34.4%) |
| 7:30 AM to 7:59 AM | 69 (10.1%) | 109 (25.0%) |
| 8:00 AM to 8:29 AM | 100 (14.6%) | 0 (0.0%) |
| 8:30 AM to 8:59 AM | 0 (0.0%) | 0 (0.0%) |
| 9:00 AM to 9:59 AM | 24 (3.5%) | 0 (0.0%) |
| 10:00 AM to 10:59 AM | 12 (1.8%) | 17 (3.9%) |
| 11:00 AM to 11:59 AM | 0 (0.0%) | 13 (3.0%) |
| 12:00 PM to 3:59 PM | 3 (0.4%) | 0 (0.0%) |
| 4:00 PM to 11:59 PM | 19 (2.8%) | 49 (11.2%) |
| Total | 684 (100.0%) | 436 (100.0%) |
Housing Occupancy in Inez
Occupancy by Ownership in Inez
Of the total 932 dwellings in Inez, owner-occupied units account for 792 (85.0%), while renter-occupied units make up 140 (15.0%).
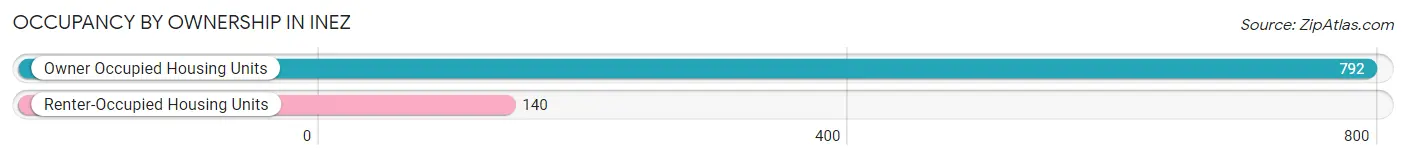
| Occupancy | # Housing Units | % Housing Units |
| Owner Occupied Housing Units | 792 | 85.0% |
| Renter-Occupied Housing Units | 140 | 15.0% |
| Total Occupied Housing Units | 932 | 100.0% |
Occupancy by Household Size in Inez
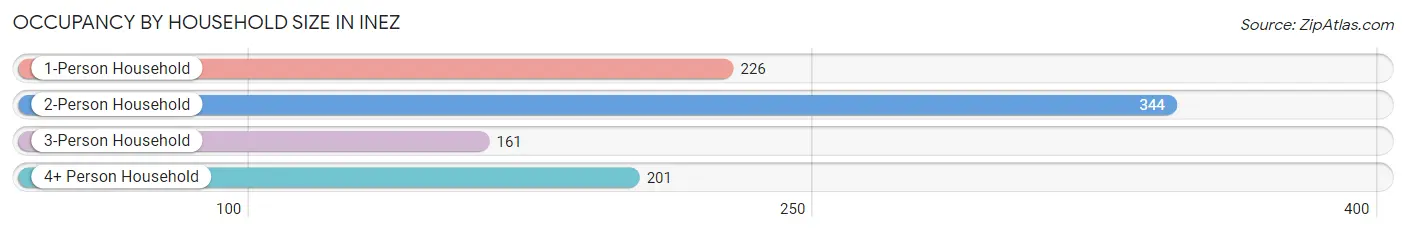
| Household Size | # Housing Units | % Housing Units |
| 1-Person Household | 226 | 24.2% |
| 2-Person Household | 344 | 36.9% |
| 3-Person Household | 161 | 17.3% |
| 4+ Person Household | 201 | 21.6% |
| Total Housing Units | 932 | 100.0% |
Occupancy by Ownership by Household Size in Inez
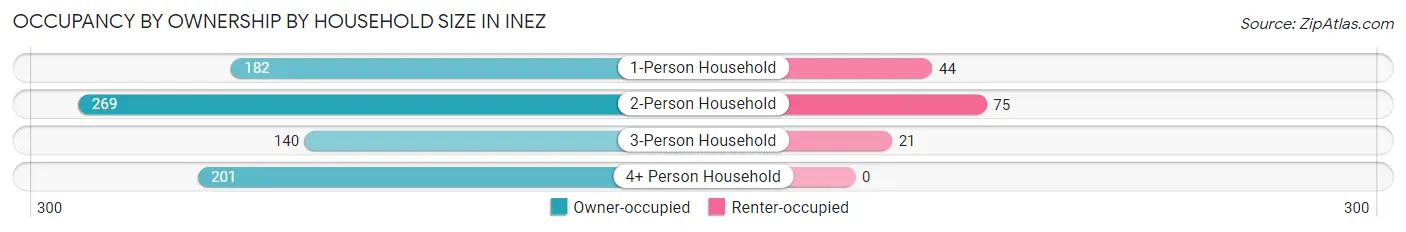
| Household Size | Owner-occupied | Renter-occupied |
| 1-Person Household | 182 (80.5%) | 44 (19.5%) |
| 2-Person Household | 269 (78.2%) | 75 (21.8%) |
| 3-Person Household | 140 (87.0%) | 21 (13.0%) |
| 4+ Person Household | 201 (100.0%) | 0 (0.0%) |
| Total Housing Units | 792 (85.0%) | 140 (15.0%) |
Occupancy by Educational Attainment in Inez
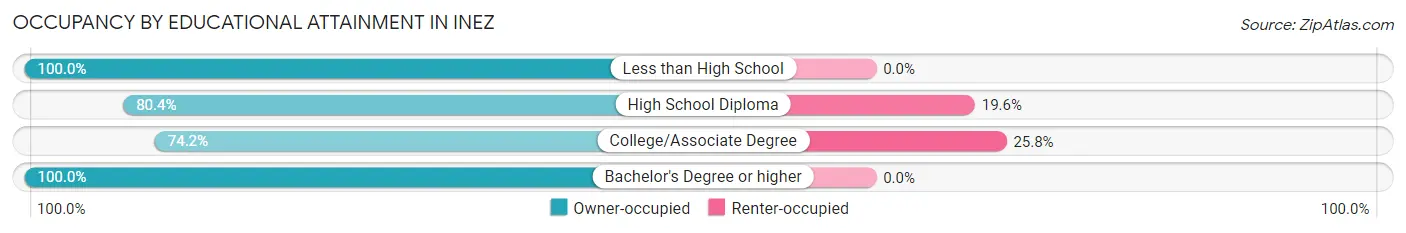
| Household Size | Owner-occupied | Renter-occupied |
| Less than High School | 7 (100.0%) | 0 (0.0%) |
| High School Diploma | 255 (80.4%) | 62 (19.6%) |
| College/Associate Degree | 224 (74.2%) | 78 (25.8%) |
| Bachelor's Degree or higher | 306 (100.0%) | 0 (0.0%) |
Occupancy by Age of Householder in Inez
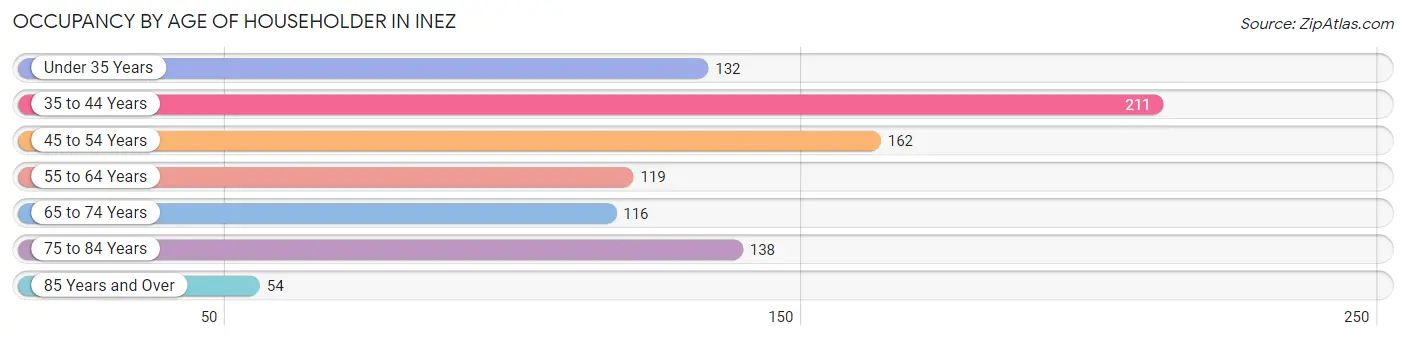
| Age Bracket | # Households | % Households |
| Under 35 Years | 132 | 14.2% |
| 35 to 44 Years | 211 | 22.6% |
| 45 to 54 Years | 162 | 17.4% |
| 55 to 64 Years | 119 | 12.8% |
| 65 to 74 Years | 116 | 12.4% |
| 75 to 84 Years | 138 | 14.8% |
| 85 Years and Over | 54 | 5.8% |
| Total | 932 | 100.0% |
Housing Finances in Inez
Median Income by Occupancy in Inez
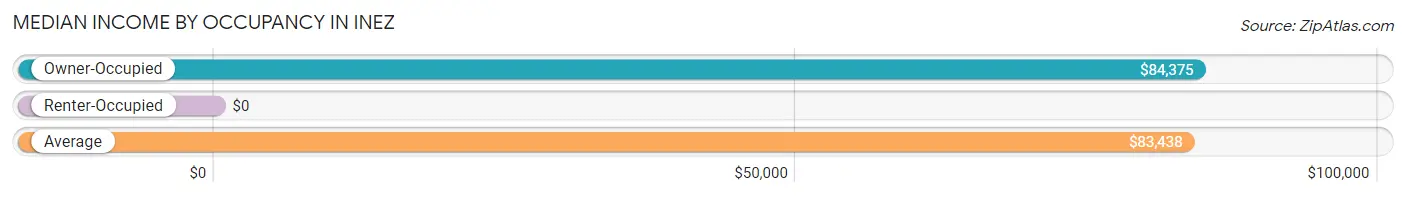
| Occupancy Type | # Households | Median Income |
| Owner-Occupied | 792 (85.0%) | $84,375 |
| Renter-Occupied | 140 (15.0%) | $0 |
| Average | 932 (100.0%) | $83,438 |
Occupancy by Householder Income Bracket in Inez
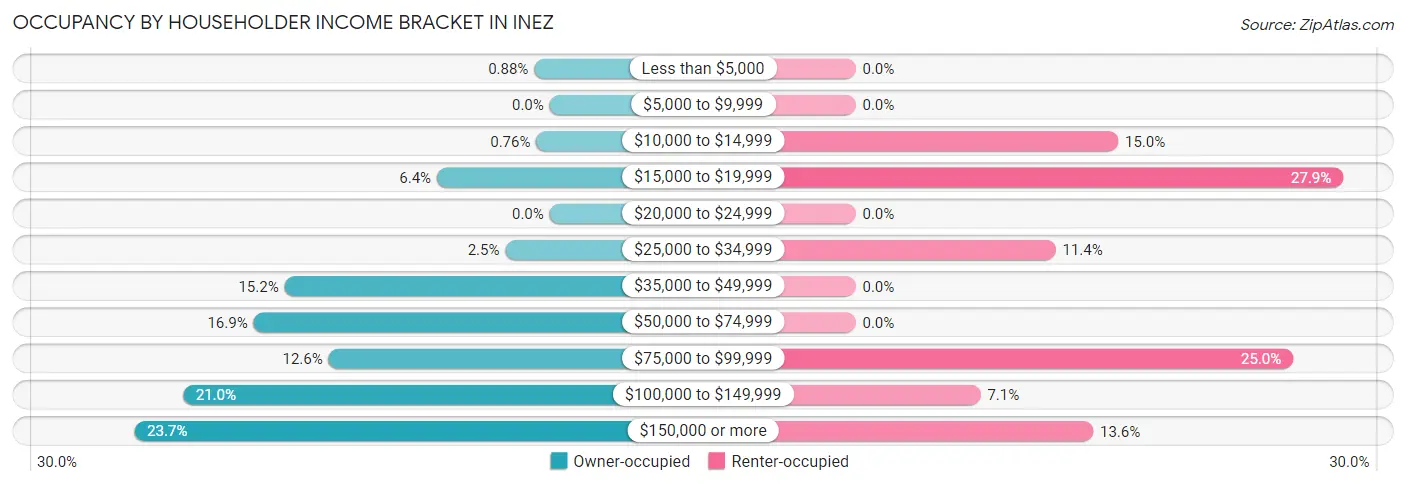
| Income Bracket | Owner-occupied | Renter-occupied |
| Less than $5,000 | 7 (0.9%) | 0 (0.0%) |
| $5,000 to $9,999 | 0 (0.0%) | 0 (0.0%) |
| $10,000 to $14,999 | 6 (0.8%) | 21 (15.0%) |
| $15,000 to $19,999 | 51 (6.4%) | 39 (27.9%) |
| $20,000 to $24,999 | 0 (0.0%) | 0 (0.0%) |
| $25,000 to $34,999 | 20 (2.5%) | 16 (11.4%) |
| $35,000 to $49,999 | 120 (15.1%) | 0 (0.0%) |
| $50,000 to $74,999 | 134 (16.9%) | 0 (0.0%) |
| $75,000 to $99,999 | 100 (12.6%) | 35 (25.0%) |
| $100,000 to $149,999 | 166 (21.0%) | 10 (7.1%) |
| $150,000 or more | 188 (23.7%) | 19 (13.6%) |
| Total | 792 (100.0%) | 140 (100.0%) |
Monthly Housing Cost Tiers in Inez
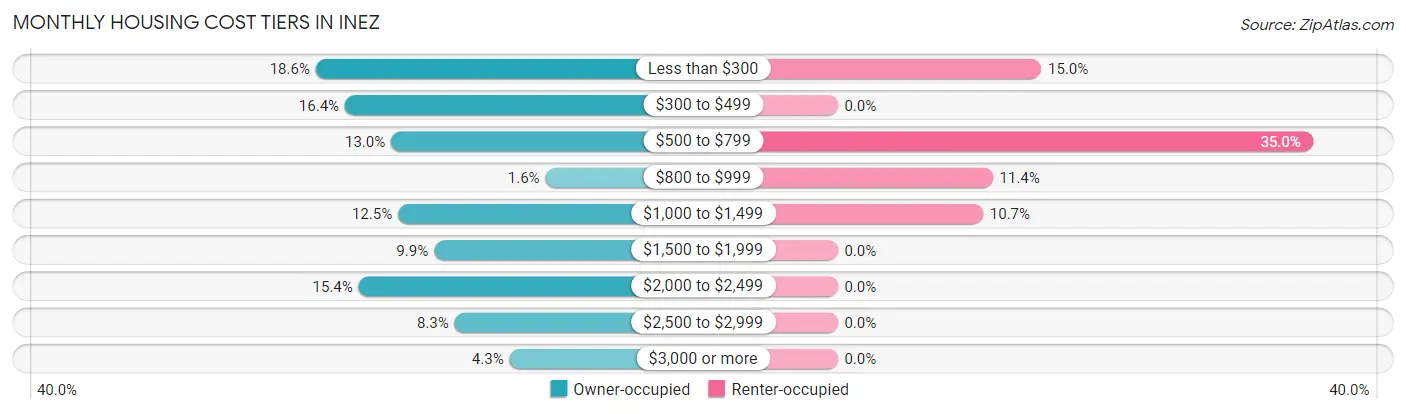
| Monthly Cost | Owner-occupied | Renter-occupied |
| Less than $300 | 147 (18.6%) | 21 (15.0%) |
| $300 to $499 | 130 (16.4%) | 0 (0.0%) |
| $500 to $799 | 103 (13.0%) | 49 (35.0%) |
| $800 to $999 | 13 (1.6%) | 16 (11.4%) |
| $1,000 to $1,499 | 99 (12.5%) | 15 (10.7%) |
| $1,500 to $1,999 | 78 (9.9%) | 0 (0.0%) |
| $2,000 to $2,499 | 122 (15.4%) | 0 (0.0%) |
| $2,500 to $2,999 | 66 (8.3%) | 0 (0.0%) |
| $3,000 or more | 34 (4.3%) | 0 (0.0%) |
| Total | 792 (100.0%) | 140 (100.0%) |
Physical Housing Characteristics in Inez
Housing Structures in Inez
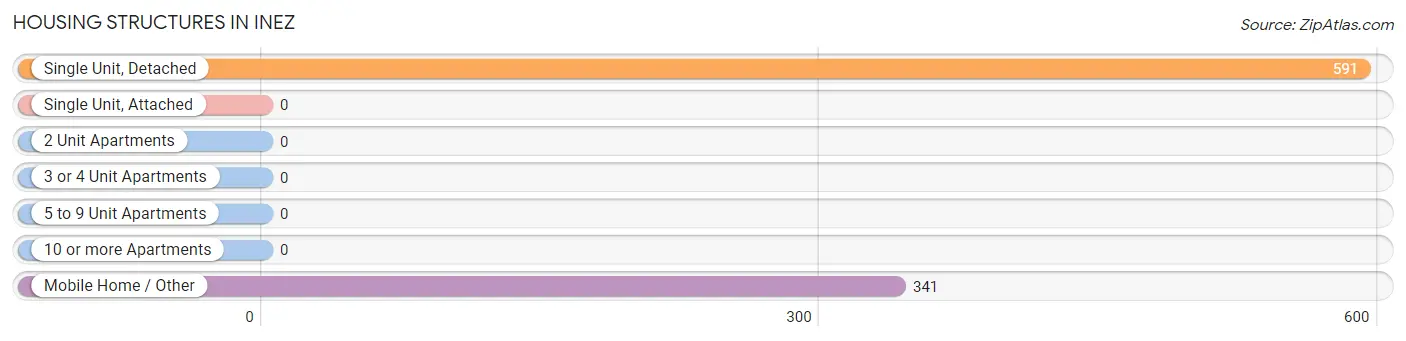
| Structure Type | # Housing Units | % Housing Units |
| Single Unit, Detached | 591 | 63.4% |
| Single Unit, Attached | 0 | 0.0% |
| 2 Unit Apartments | 0 | 0.0% |
| 3 or 4 Unit Apartments | 0 | 0.0% |
| 5 to 9 Unit Apartments | 0 | 0.0% |
| 10 or more Apartments | 0 | 0.0% |
| Mobile Home / Other | 341 | 36.6% |
| Total | 932 | 100.0% |
Housing Structures by Occupancy in Inez
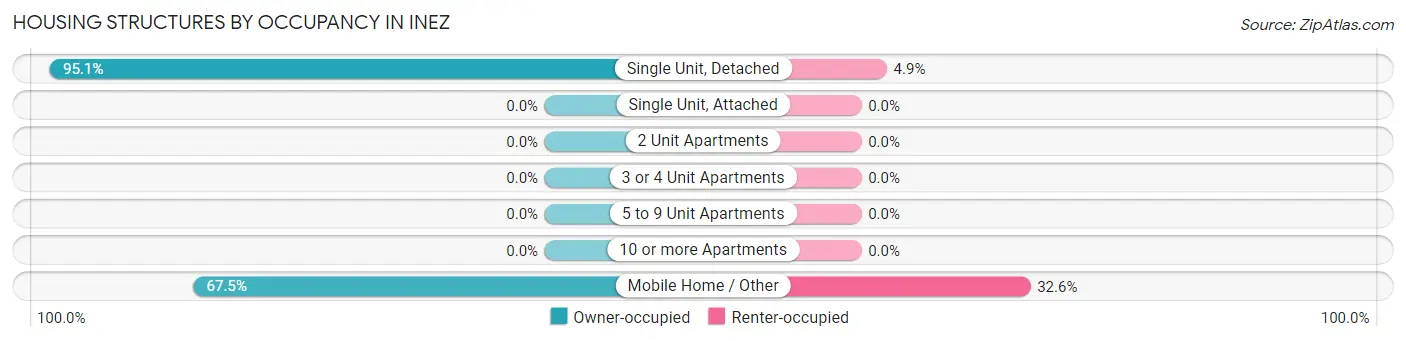
| Structure Type | Owner-occupied | Renter-occupied |
| Single Unit, Detached | 562 (95.1%) | 29 (4.9%) |
| Single Unit, Attached | 0 (0.0%) | 0 (0.0%) |
| 2 Unit Apartments | 0 (0.0%) | 0 (0.0%) |
| 3 or 4 Unit Apartments | 0 (0.0%) | 0 (0.0%) |
| 5 to 9 Unit Apartments | 0 (0.0%) | 0 (0.0%) |
| 10 or more Apartments | 0 (0.0%) | 0 (0.0%) |
| Mobile Home / Other | 230 (67.4%) | 111 (32.6%) |
| Total | 792 (85.0%) | 140 (15.0%) |
Housing Structures by Number of Rooms in Inez
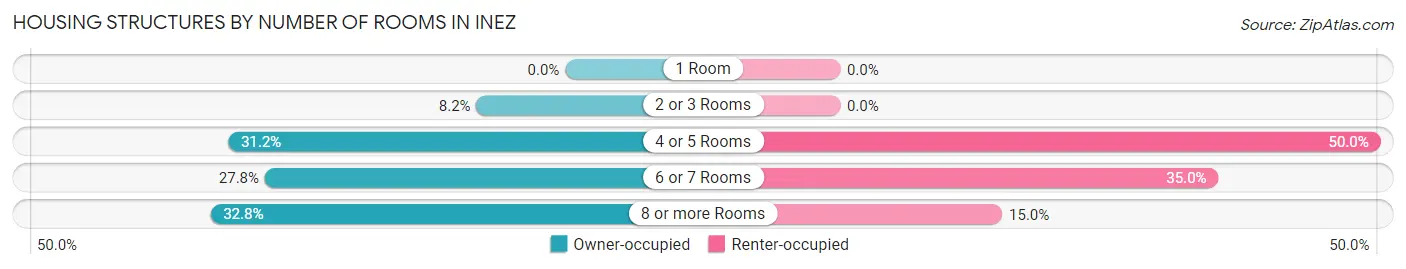
| Number of Rooms | Owner-occupied | Renter-occupied |
| 1 Room | 0 (0.0%) | 0 (0.0%) |
| 2 or 3 Rooms | 65 (8.2%) | 0 (0.0%) |
| 4 or 5 Rooms | 247 (31.2%) | 70 (50.0%) |
| 6 or 7 Rooms | 220 (27.8%) | 49 (35.0%) |
| 8 or more Rooms | 260 (32.8%) | 21 (15.0%) |
| Total | 792 (100.0%) | 140 (100.0%) |
Housing Structure by Heating Type in Inez
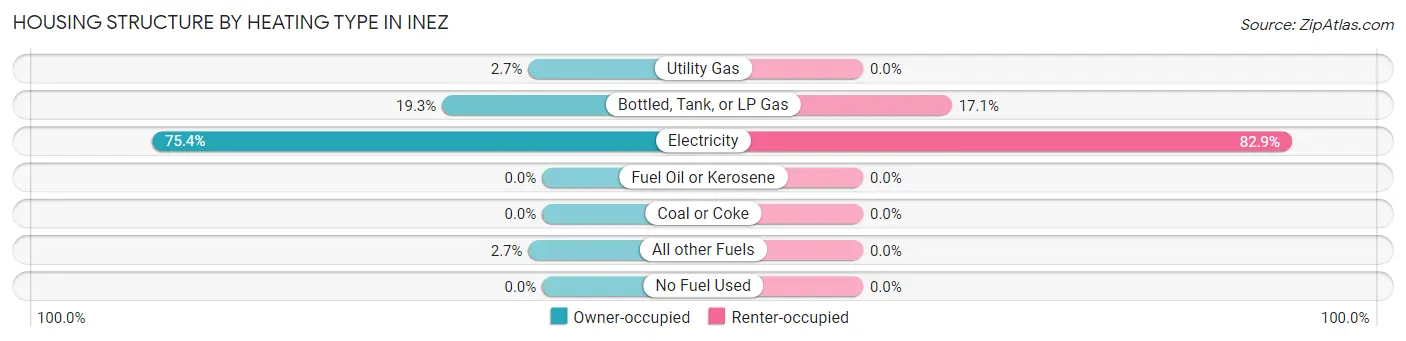
| Heating Type | Owner-occupied | Renter-occupied |
| Utility Gas | 21 (2.6%) | 0 (0.0%) |
| Bottled, Tank, or LP Gas | 153 (19.3%) | 24 (17.1%) |
| Electricity | 597 (75.4%) | 116 (82.9%) |
| Fuel Oil or Kerosene | 0 (0.0%) | 0 (0.0%) |
| Coal or Coke | 0 (0.0%) | 0 (0.0%) |
| All other Fuels | 21 (2.6%) | 0 (0.0%) |
| No Fuel Used | 0 (0.0%) | 0 (0.0%) |
| Total | 792 (100.0%) | 140 (100.0%) |
Household Vehicle Usage in Inez
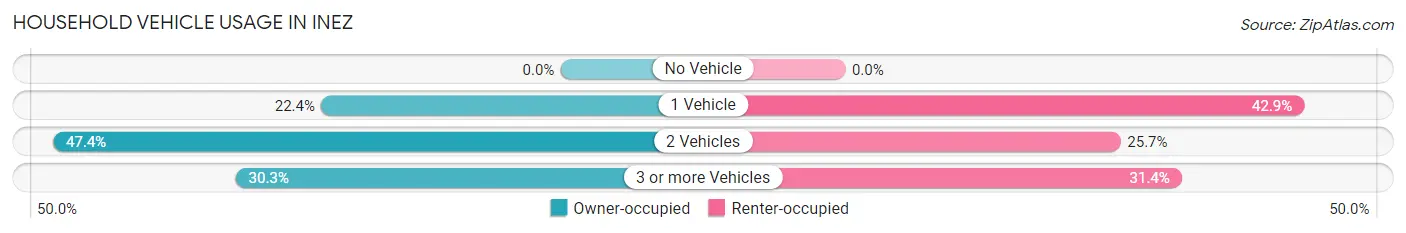
| Vehicles per Household | Owner-occupied | Renter-occupied |
| No Vehicle | 0 (0.0%) | 0 (0.0%) |
| 1 Vehicle | 177 (22.4%) | 60 (42.9%) |
| 2 Vehicles | 375 (47.3%) | 36 (25.7%) |
| 3 or more Vehicles | 240 (30.3%) | 44 (31.4%) |
| Total | 792 (100.0%) | 140 (100.0%) |
Real Estate & Mortgages in Inez
Real Estate and Mortgage Overview in Inez
| Characteristic | Without Mortgage | With Mortgage |
| Housing Units | 523 | 269 |
| Median Property Value | - | - |
| Median Household Income | $68,594 | $120 |
| Monthly Housing Costs | $473 | $34 |
| Real Estate Taxes | $2,054 | $0 |
Property Value by Mortgage Status in Inez
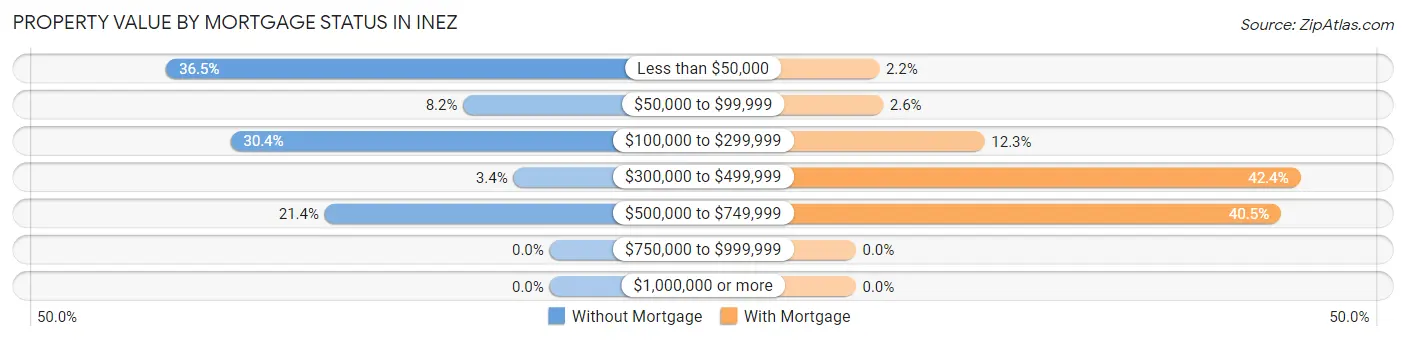
| Property Value | Without Mortgage | With Mortgage |
| Less than $50,000 | 191 (36.5%) | 6 (2.2%) |
| $50,000 to $99,999 | 43 (8.2%) | 7 (2.6%) |
| $100,000 to $299,999 | 159 (30.4%) | 33 (12.3%) |
| $300,000 to $499,999 | 18 (3.4%) | 114 (42.4%) |
| $500,000 to $749,999 | 112 (21.4%) | 109 (40.5%) |
| $750,000 to $999,999 | 0 (0.0%) | 0 (0.0%) |
| $1,000,000 or more | 0 (0.0%) | 0 (0.0%) |
| Total | 523 (100.0%) | 269 (100.0%) |
Household Income by Mortgage Status in Inez
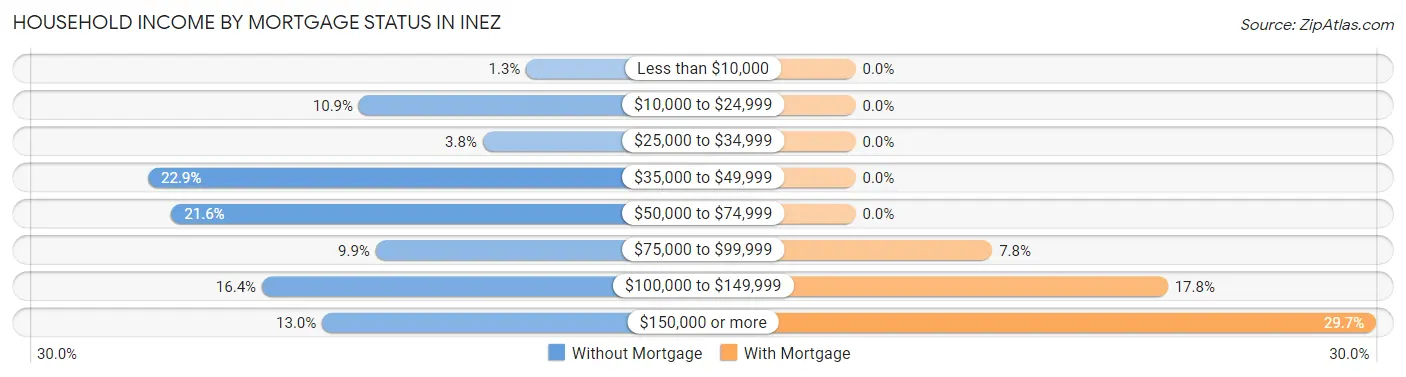
| Household Income | Without Mortgage | With Mortgage |
| Less than $10,000 | 7 (1.3%) | 0 (0.0%) |
| $10,000 to $24,999 | 57 (10.9%) | 0 (0.0%) |
| $25,000 to $34,999 | 20 (3.8%) | 0 (0.0%) |
| $35,000 to $49,999 | 120 (22.9%) | 0 (0.0%) |
| $50,000 to $74,999 | 113 (21.6%) | 0 (0.0%) |
| $75,000 to $99,999 | 52 (9.9%) | 21 (7.8%) |
| $100,000 to $149,999 | 86 (16.4%) | 48 (17.8%) |
| $150,000 or more | 68 (13.0%) | 80 (29.7%) |
| Total | 523 (100.0%) | 269 (100.0%) |
Property Value to Household Income Ratio in Inez
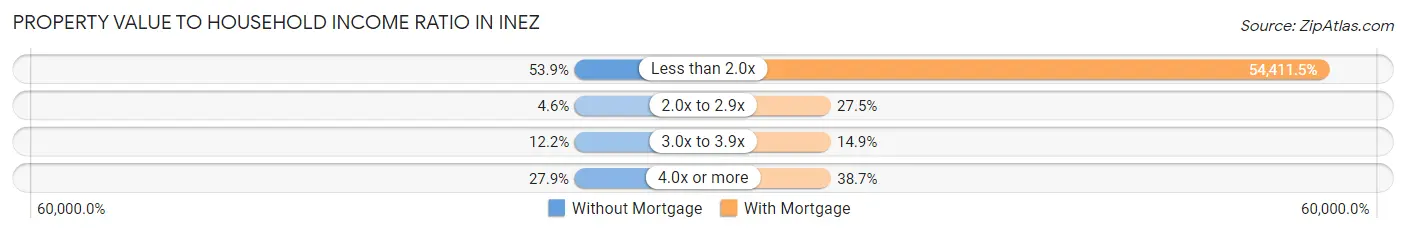
| Value-to-Income Ratio | Without Mortgage | With Mortgage |
| Less than 2.0x | 282 (53.9%) | 146,367 (54,411.5%) |
| 2.0x to 2.9x | 24 (4.6%) | 74 (27.5%) |
| 3.0x to 3.9x | 64 (12.2%) | 40 (14.9%) |
| 4.0x or more | 146 (27.9%) | 104 (38.7%) |
| Total | 523 (100.0%) | 269 (100.0%) |
Real Estate Taxes by Mortgage Status in Inez
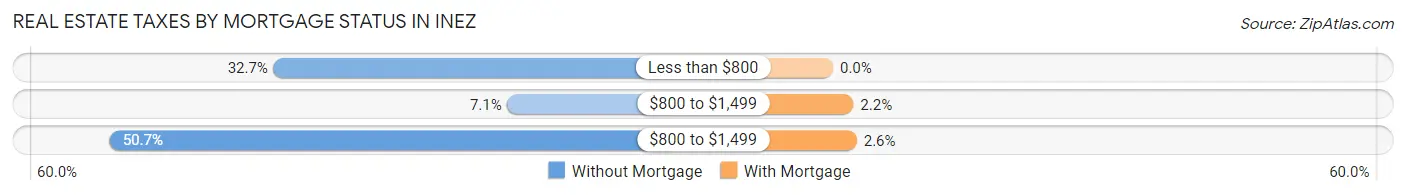
| Property Taxes | Without Mortgage | With Mortgage |
| Less than $800 | 171 (32.7%) | 0 (0.0%) |
| $800 to $1,499 | 37 (7.1%) | 6 (2.2%) |
| $800 to $1,499 | 265 (50.7%) | 7 (2.6%) |
| Total | 523 (100.0%) | 269 (100.0%) |
Health & Disability in Inez
Health Insurance Coverage by Age in Inez
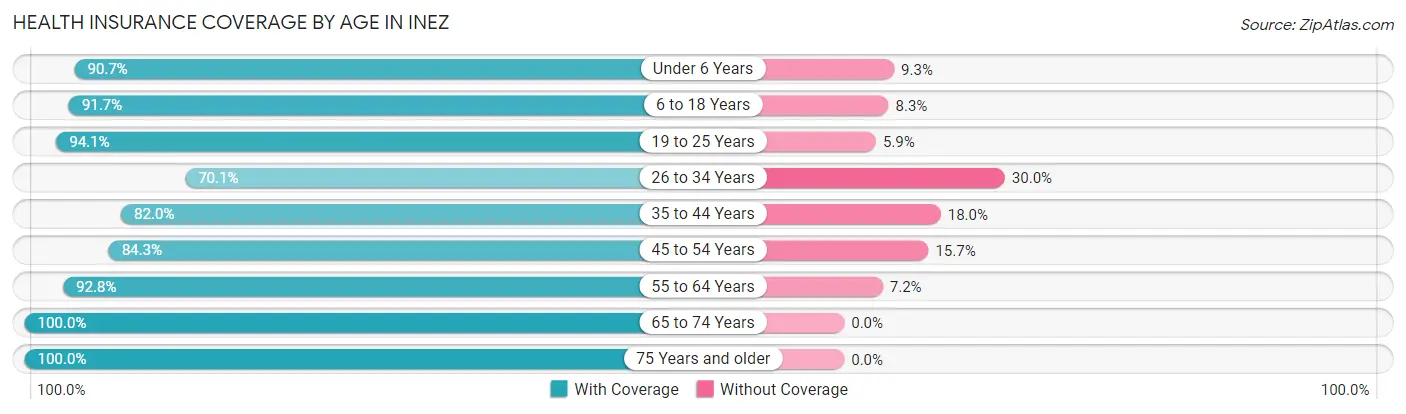
| Age Bracket | With Coverage | Without Coverage |
| Under 6 Years | 156 (90.7%) | 16 (9.3%) |
| 6 to 18 Years | 433 (91.7%) | 39 (8.3%) |
| 19 to 25 Years | 159 (94.1%) | 10 (5.9%) |
| 26 to 34 Years | 131 (70.1%) | 56 (29.9%) |
| 35 to 44 Years | 310 (82.0%) | 68 (18.0%) |
| 45 to 54 Years | 290 (84.3%) | 54 (15.7%) |
| 55 to 64 Years | 258 (92.8%) | 20 (7.2%) |
| 65 to 74 Years | 203 (100.0%) | 0 (0.0%) |
| 75 Years and older | 232 (100.0%) | 0 (0.0%) |
| Total | 2,172 (89.2%) | 263 (10.8%) |
Health Insurance Coverage by Citizenship Status in Inez
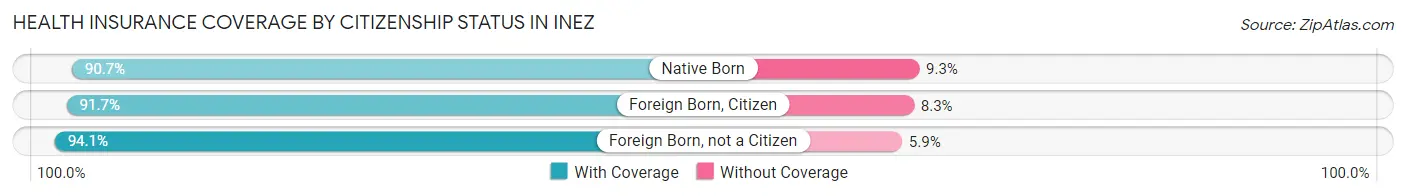
| Citizenship Status | With Coverage | Without Coverage |
| Native Born | 156 (90.7%) | 16 (9.3%) |
| Foreign Born, Citizen | 433 (91.7%) | 39 (8.3%) |
| Foreign Born, not a Citizen | 159 (94.1%) | 10 (5.9%) |
Health Insurance Coverage by Household Income in Inez
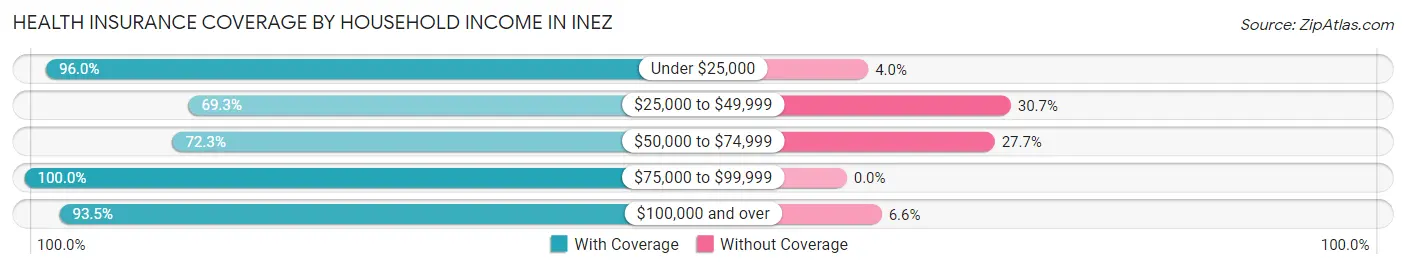
| Household Income | With Coverage | Without Coverage |
| Under $25,000 | 167 (96.0%) | 7 (4.0%) |
| $25,000 to $49,999 | 142 (69.3%) | 63 (30.7%) |
| $50,000 to $74,999 | 287 (72.3%) | 110 (27.7%) |
| $75,000 to $99,999 | 391 (100.0%) | 0 (0.0%) |
| $100,000 and over | 1,185 (93.4%) | 83 (6.6%) |
Public vs Private Health Insurance Coverage by Age in Inez
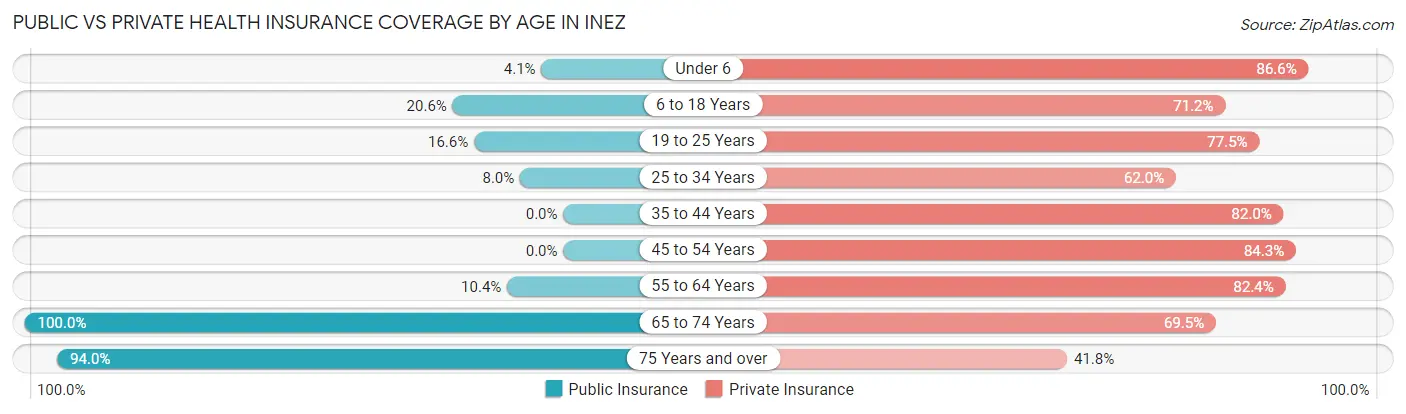
| Age Bracket | Public Insurance | Private Insurance |
| Under 6 | 7 (4.1%) | 149 (86.6%) |
| 6 to 18 Years | 97 (20.5%) | 336 (71.2%) |
| 19 to 25 Years | 28 (16.6%) | 131 (77.5%) |
| 25 to 34 Years | 15 (8.0%) | 116 (62.0%) |
| 35 to 44 Years | 0 (0.0%) | 310 (82.0%) |
| 45 to 54 Years | 0 (0.0%) | 290 (84.3%) |
| 55 to 64 Years | 29 (10.4%) | 229 (82.4%) |
| 65 to 74 Years | 203 (100.0%) | 141 (69.5%) |
| 75 Years and over | 218 (94.0%) | 97 (41.8%) |
| Total | 597 (24.5%) | 1,799 (73.9%) |
Disability Status by Sex by Age in Inez
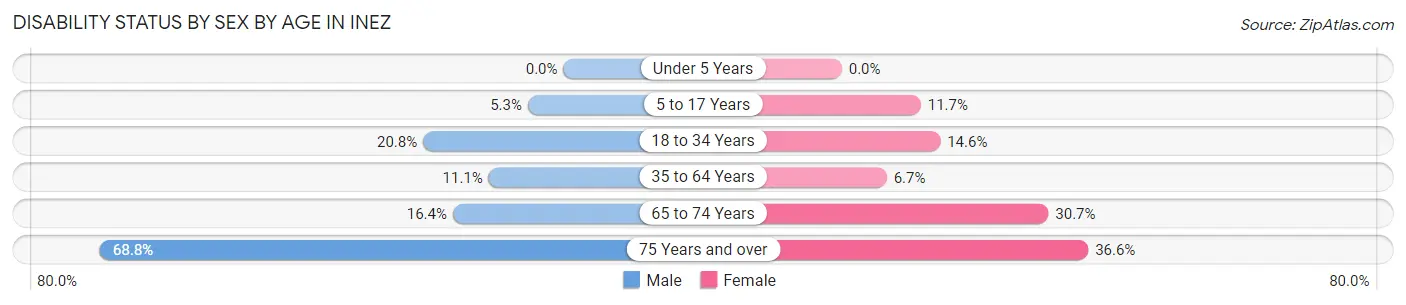
| Age Bracket | Male | Female |
| Under 5 Years | 0 (0.0%) | 0 (0.0%) |
| 5 to 17 Years | 16 (5.3%) | 21 (11.7%) |
| 18 to 34 Years | 35 (20.8%) | 31 (14.6%) |
| 35 to 64 Years | 61 (11.1%) | 30 (6.7%) |
| 65 to 74 Years | 21 (16.4%) | 23 (30.7%) |
| 75 Years and over | 75 (68.8%) | 45 (36.6%) |
Disability Class by Sex by Age in Inez
Disability Class: Hearing Difficulty
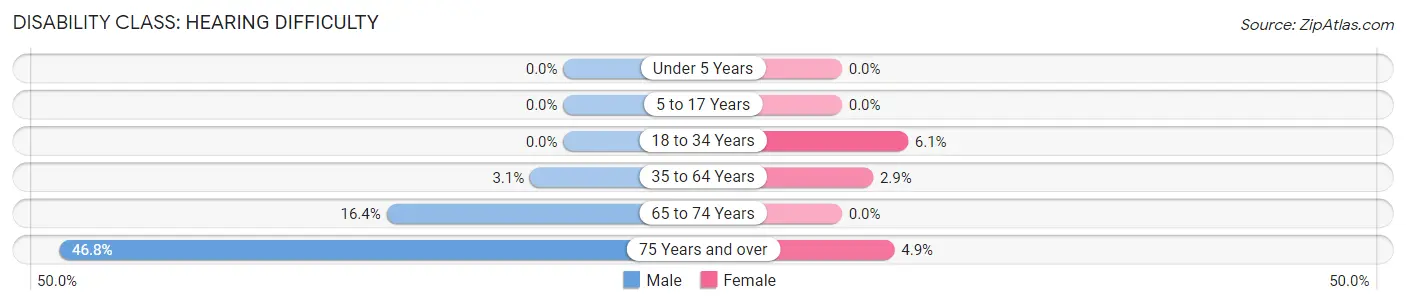
| Age Bracket | Male | Female |
| Under 5 Years | 0 (0.0%) | 0 (0.0%) |
| 5 to 17 Years | 0 (0.0%) | 0 (0.0%) |
| 18 to 34 Years | 0 (0.0%) | 13 (6.1%) |
| 35 to 64 Years | 17 (3.1%) | 13 (2.9%) |
| 65 to 74 Years | 21 (16.4%) | 0 (0.0%) |
| 75 Years and over | 51 (46.8%) | 6 (4.9%) |
Disability Class: Vision Difficulty
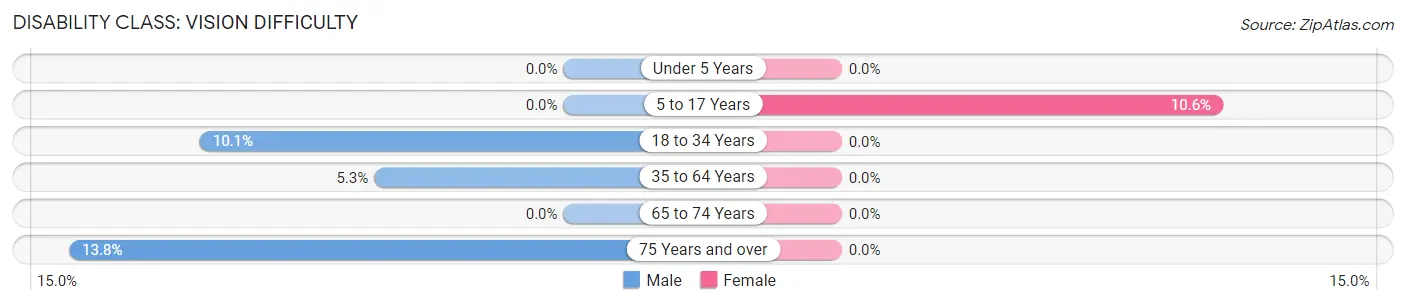
| Age Bracket | Male | Female |
| Under 5 Years | 0 (0.0%) | 0 (0.0%) |
| 5 to 17 Years | 0 (0.0%) | 19 (10.6%) |
| 18 to 34 Years | 17 (10.1%) | 0 (0.0%) |
| 35 to 64 Years | 29 (5.3%) | 0 (0.0%) |
| 65 to 74 Years | 0 (0.0%) | 0 (0.0%) |
| 75 Years and over | 15 (13.8%) | 0 (0.0%) |
Disability Class: Cognitive Difficulty
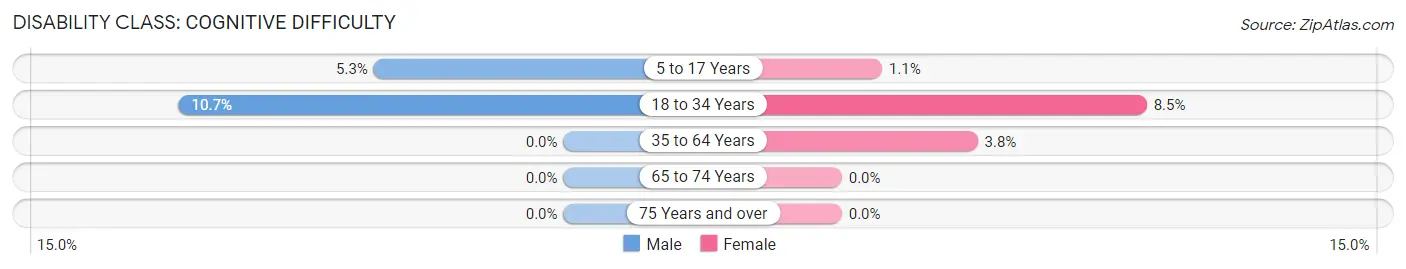
| Age Bracket | Male | Female |
| 5 to 17 Years | 16 (5.3%) | 2 (1.1%) |
| 18 to 34 Years | 18 (10.7%) | 18 (8.5%) |
| 35 to 64 Years | 0 (0.0%) | 17 (3.8%) |
| 65 to 74 Years | 0 (0.0%) | 0 (0.0%) |
| 75 Years and over | 0 (0.0%) | 0 (0.0%) |
Disability Class: Ambulatory Difficulty
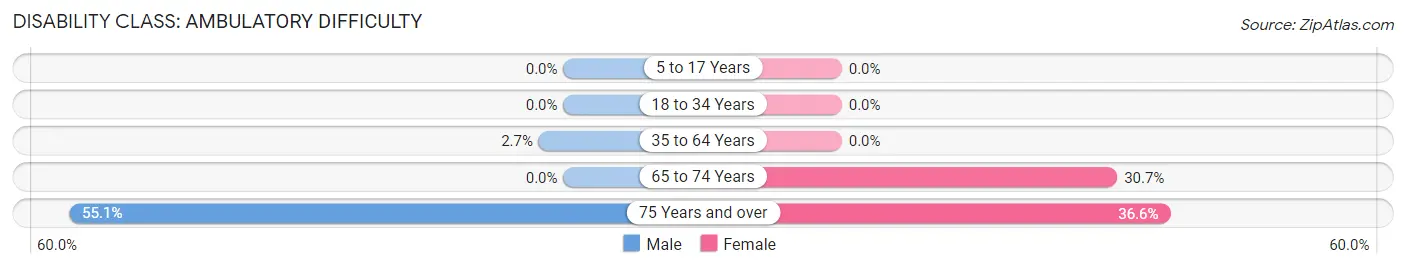
| Age Bracket | Male | Female |
| 5 to 17 Years | 0 (0.0%) | 0 (0.0%) |
| 18 to 34 Years | 0 (0.0%) | 0 (0.0%) |
| 35 to 64 Years | 15 (2.7%) | 0 (0.0%) |
| 65 to 74 Years | 0 (0.0%) | 23 (30.7%) |
| 75 Years and over | 60 (55.0%) | 45 (36.6%) |
Disability Class: Self-Care Difficulty
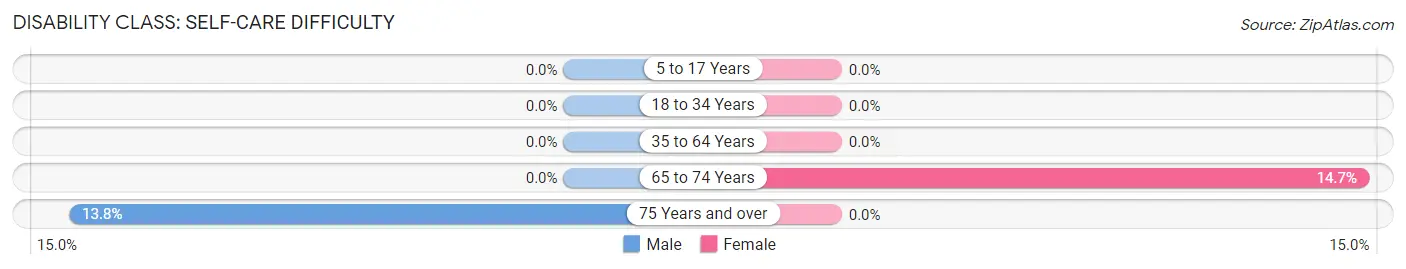
| Age Bracket | Male | Female |
| 5 to 17 Years | 0 (0.0%) | 0 (0.0%) |
| 18 to 34 Years | 0 (0.0%) | 0 (0.0%) |
| 35 to 64 Years | 0 (0.0%) | 0 (0.0%) |
| 65 to 74 Years | 0 (0.0%) | 11 (14.7%) |
| 75 Years and over | 15 (13.8%) | 0 (0.0%) |
Technology Access in Inez
Computing Device Access in Inez
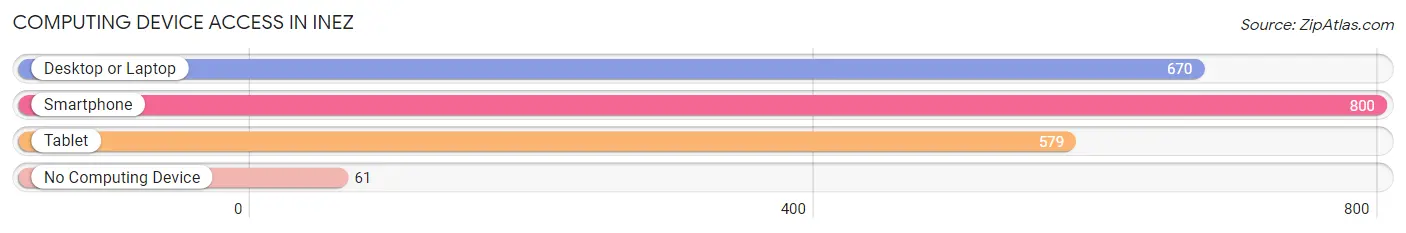
| Device Type | # Households | % Households |
| Desktop or Laptop | 670 | 71.9% |
| Smartphone | 800 | 85.8% |
| Tablet | 579 | 62.1% |
| No Computing Device | 61 | 6.6% |
| Total | 932 | 100.0% |
Internet Access in Inez
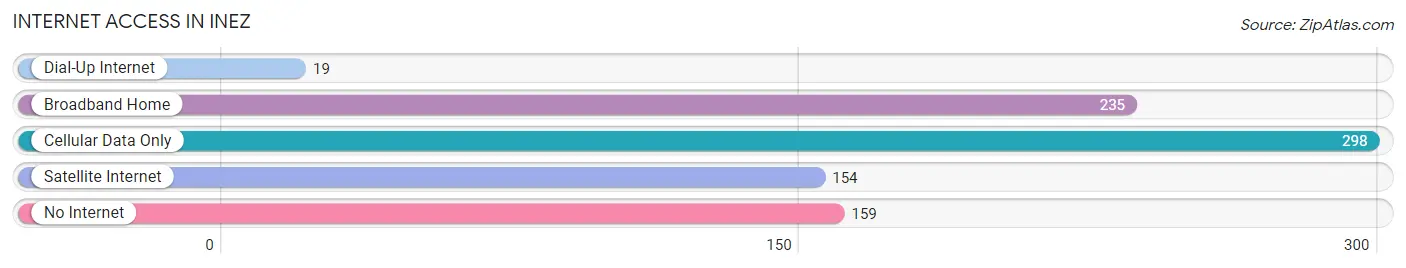
| Internet Type | # Households | % Households |
| Dial-Up Internet | 19 | 2.0% |
| Broadband Home | 235 | 25.2% |
| Cellular Data Only | 298 | 32.0% |
| Satellite Internet | 154 | 16.5% |
| No Internet | 159 | 17.1% |
| Total | 932 | 100.0% |
Inez Summary
Inez is a small town located in Victoria County, Texas. It is situated on the banks of the Guadalupe River, about 25 miles east of Victoria, the county seat. The town was founded in 1883 and named after Inez de la Garza, the daughter of a local rancher. The population of Inez was 1,845 in the 2010 census.
Geography
Inez is located at 28°51'25"N 97°14'17"W (28.856944, -97.238056). It is situated on the banks of the Guadalupe River, about 25 miles east of Victoria, the county seat. The town is located in the Coastal Plains region of Texas, and is surrounded by rolling hills and open fields. The climate is humid subtropical, with hot summers and mild winters.
Economy
Inez is a small, rural town with a population of just over 1,800 people. The economy is largely based on agriculture, with cotton, corn, and sorghum being the main crops. The town also has a few small businesses, including a grocery store, a hardware store, and a few restaurants.
Demographics
As of the 2010 census, the population of Inez was 1,845. The racial makeup of the town was 79.2% White, 0.2% African American, 0.2% Native American, 0.2% Asian, 0.1% Pacific Islander, 18.7% from other races, and 1.2% from two or more races. Hispanic or Latino of any race were 37.2% of the population.
The median income for a household in Inez was $30,938, and the median income for a family was $35,625. Males had a median income of $27,917 versus $20,000 for females. The per capita income for the town was $14,945. About 18.2% of families and 22.2% of the population were below the poverty line, including 28.3% of those under age 18 and 16.7% of those age 65 or over.
Conclusion
Inez is a small, rural town located in Victoria County, Texas. It is situated on the banks of the Guadalupe River, about 25 miles east of Victoria, the county seat. The town was founded in 1883 and named after Inez de la Garza, the daughter of a local rancher. The population of Inez was 1,845 in the 2010 census. The economy is largely based on agriculture, with cotton, corn, and sorghum being the main crops. The racial makeup of the town was 79.2% White, 0.2% African American, 0.2% Native American, 0.2% Asian, 0.1% Pacific Islander, 18.7% from other races, and 1.2% from two or more races. Hispanic or Latino of any race were 37.2% of the population. The median income for a household in Inez was $30,938, and the median income for a family was $35,625. About 18.2% of families and 22.2% of the population were below the poverty line.
Common Questions
What is the Total Population of Inez?
Total Population of Inez is 2,435.
What is the Total Male Population of Inez?
Total Male Population of Inez is 1,323.
What is the Total Female Population of Inez?
Total Female Population of Inez is 1,112.
What is the Ratio of Males per 100 Females in Inez?
There are 118.97 Males per 100 Females in Inez.
What is the Ratio of Females per 100 Males in Inez?
There are 84.05 Females per 100 Males in Inez.
What is the Median Population Age in Inez?
Median Population Age in Inez is 39.0 Years.
What is the Average Family Size in Inez
Average Family Size in Inez is 3.1 People.
What is the Average Household Size in Inez
Average Household Size in Inez is 2.6 People.
What is Per Capita Income in Inez?
Per Capita income in Inez is $41,285.
What is the Median Family Income in Inez?
Median Family Income in Inez is $115,481.
What is the Median Household income in Inez?
Median Household Income in Inez is $83,438.
What is Income or Wage Gap in Inez?
Income or Wage Gap in Inez is 56.5%.
Women in Inez earn 43.5 cents for every dollar earned by a man.
What is Inequality or Gini Index in Inez?
Inequality or Gini Index in Inez is 0.42.
How Large is the Labor Force in Inez?
There are 1,173 People in the Labor Forcein in Inez.
What is the Percentage of People in the Labor Force in Inez?
63.6% of People are in the Labor Force in Inez.
What is the Unemployment Rate in Inez?
Unemployment Rate in Inez is 2.1%.