Cities with the Most Immigrants from Guyana in Florida
RELATED REPORTS & OPTIONS
Guyana
Florida
Compare Cities
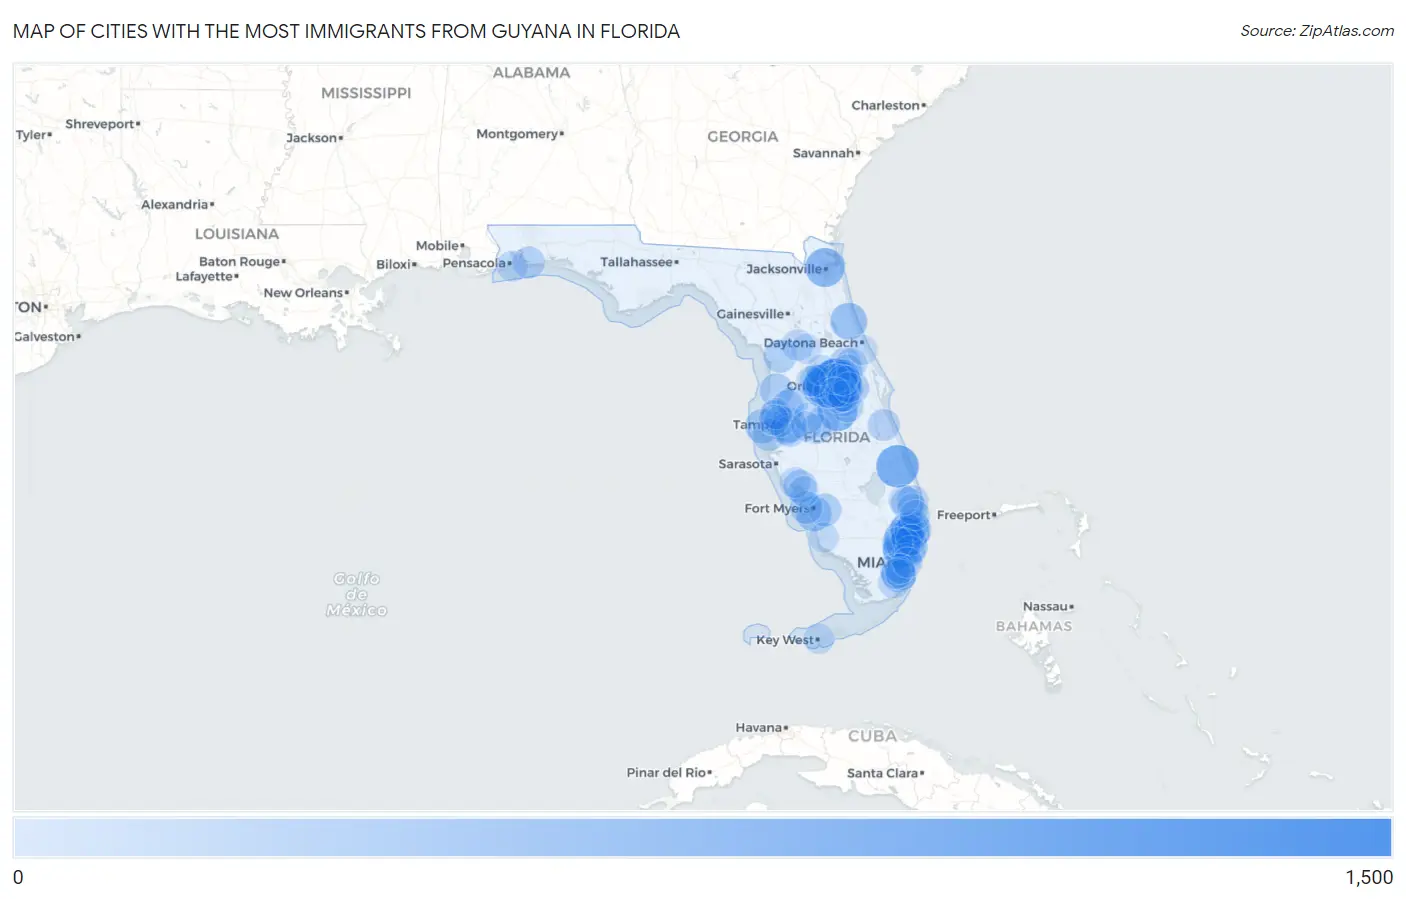
Map of Cities with the Most Immigrants from Guyana in Florida
0
1,500
Cities with the Most Immigrants from Guyana in Florida
| City | Guyana | vs State | vs National | |
| 1. | Pine Hills | 1,358 | 33,556(4.05%)#1 | 287,198(0.47%)#8 |
| 2. | Winter Garden | 1,056 | 33,556(3.15%)#2 | 287,198(0.37%)#11 |
| 3. | Port St Lucie | 869 | 33,556(2.59%)#3 | 287,198(0.30%)#14 |
| 4. | Poinciana | 685 | 33,556(2.04%)#4 | 287,198(0.24%)#19 |
| 5. | Sunrise | 666 | 33,556(1.98%)#5 | 287,198(0.23%)#22 |
| 6. | Clermont | 664 | 33,556(1.98%)#6 | 287,198(0.23%)#23 |
| 7. | Ocoee | 648 | 33,556(1.93%)#7 | 287,198(0.23%)#24 |
| 8. | Jacksonville | 647 | 33,556(1.93%)#8 | 287,198(0.23%)#25 |
| 9. | Pembroke Pines | 526 | 33,556(1.57%)#9 | 287,198(0.18%)#31 |
| 10. | Palm Coast | 502 | 33,556(1.50%)#10 | 287,198(0.17%)#33 |
| 11. | Miramar | 480 | 33,556(1.43%)#11 | 287,198(0.17%)#34 |
| 12. | Orlando | 441 | 33,556(1.31%)#12 | 287,198(0.15%)#37 |
| 13. | Hollywood | 406 | 33,556(1.21%)#13 | 287,198(0.14%)#41 |
| 14. | Villas | 403 | 33,556(1.20%)#14 | 287,198(0.14%)#43 |
| 15. | Tamarac | 386 | 33,556(1.15%)#15 | 287,198(0.13%)#45 |
| 16. | Brandon | 382 | 33,556(1.14%)#16 | 287,198(0.13%)#47 |
| 17. | Deerfield Beach | 374 | 33,556(1.11%)#17 | 287,198(0.13%)#50 |
| 18. | South Miami Heights | 352 | 33,556(1.05%)#18 | 287,198(0.12%)#57 |
| 19. | Pompano Beach | 345 | 33,556(1.03%)#19 | 287,198(0.12%)#59 |
| 20. | Largo | 341 | 33,556(1.02%)#20 | 287,198(0.12%)#60 |
| 21. | Coral Springs | 339 | 33,556(1.01%)#21 | 287,198(0.12%)#61 |
| 22. | Cooper City | 336 | 33,556(1.00%)#22 | 287,198(0.12%)#62 |
| 23. | Margate | 334 | 33,556(1.00%)#23 | 287,198(0.12%)#63 |
| 24. | Apopka | 289 | 33,556(0.86%)#24 | 287,198(0.10%)#71 |
| 25. | North Lauderdale | 270 | 33,556(0.80%)#25 | 287,198(0.09%)#75 |
| 26. | Royal Palm Beach | 269 | 33,556(0.80%)#26 | 287,198(0.09%)#77 |
| 27. | Alafaya | 266 | 33,556(0.79%)#27 | 287,198(0.09%)#78 |
| 28. | Spring Hill | 261 | 33,556(0.78%)#28 | 287,198(0.09%)#81 |
| 29. | Liberty Triangle | 259 | 33,556(0.77%)#29 | 287,198(0.09%)#83 |
| 30. | Port Charlotte | 258 | 33,556(0.77%)#30 | 287,198(0.09%)#84 |
| 31. | Minneola | 257 | 33,556(0.77%)#31 | 287,198(0.09%)#85 |
| 32. | Citrus Springs | 254 | 33,556(0.76%)#32 | 287,198(0.09%)#86 |
| 33. | Lehigh Acres | 245 | 33,556(0.73%)#33 | 287,198(0.09%)#90 |
| 34. | Groveland | 240 | 33,556(0.72%)#34 | 287,198(0.08%)#91 |
| 35. | Cape Coral | 235 | 33,556(0.70%)#35 | 287,198(0.08%)#92 |
| 36. | Oak Ridge | 229 | 33,556(0.68%)#36 | 287,198(0.08%)#98 |
| 37. | Orlovista | 223 | 33,556(0.66%)#37 | 287,198(0.08%)#100 |
| 38. | St Petersburg | 220 | 33,556(0.66%)#38 | 287,198(0.08%)#101 |
| 39. | Buenaventura Lakes | 213 | 33,556(0.63%)#39 | 287,198(0.07%)#105 |
| 40. | Wesley Chapel | 210 | 33,556(0.63%)#40 | 287,198(0.07%)#107 |
| 41. | Lauderhill | 199 | 33,556(0.59%)#41 | 287,198(0.07%)#112 |
| 42. | Debary | 198 | 33,556(0.59%)#42 | 287,198(0.07%)#113 |
| 43. | St Cloud | 194 | 33,556(0.58%)#43 | 287,198(0.07%)#115 |
| 44. | Parkland | 194 | 33,556(0.58%)#44 | 287,198(0.07%)#116 |
| 45. | Palm Bay | 193 | 33,556(0.58%)#45 | 287,198(0.07%)#117 |
| 46. | Navarre | 193 | 33,556(0.58%)#46 | 287,198(0.07%)#118 |
| 47. | West Palm Beach | 189 | 33,556(0.56%)#47 | 287,198(0.07%)#123 |
| 48. | Winter Haven | 183 | 33,556(0.55%)#48 | 287,198(0.06%)#126 |
| 49. | Coconut Creek | 172 | 33,556(0.51%)#49 | 287,198(0.06%)#136 |
| 50. | Citrus Park | 167 | 33,556(0.50%)#50 | 287,198(0.06%)#141 |
| 51. | Progress Village | 167 | 33,556(0.50%)#51 | 287,198(0.06%)#142 |
| 52. | Homestead | 164 | 33,556(0.49%)#52 | 287,198(0.06%)#145 |
| 53. | Pasadena Hills | 164 | 33,556(0.49%)#53 | 287,198(0.06%)#146 |
| 54. | Riverview | 162 | 33,556(0.48%)#54 | 287,198(0.06%)#149 |
| 55. | Boca Raton | 159 | 33,556(0.47%)#55 | 287,198(0.06%)#154 |
| 56. | Deltona | 155 | 33,556(0.46%)#56 | 287,198(0.05%)#158 |
| 57. | Altamonte Springs | 155 | 33,556(0.46%)#57 | 287,198(0.05%)#159 |
| 58. | Hunters Creek | 146 | 33,556(0.44%)#58 | 287,198(0.05%)#169 |
| 59. | Ocala | 143 | 33,556(0.43%)#59 | 287,198(0.05%)#173 |
| 60. | Southchase | 138 | 33,556(0.41%)#60 | 287,198(0.05%)#181 |
| 61. | Tampa | 135 | 33,556(0.40%)#61 | 287,198(0.05%)#183 |
| 62. | Sky Lake | 132 | 33,556(0.39%)#62 | 287,198(0.05%)#190 |
| 63. | Davie | 129 | 33,556(0.38%)#63 | 287,198(0.04%)#194 |
| 64. | Sanford | 129 | 33,556(0.38%)#64 | 287,198(0.04%)#195 |
| 65. | Longwood | 129 | 33,556(0.38%)#65 | 287,198(0.04%)#196 |
| 66. | Horizon West | 125 | 33,556(0.37%)#66 | 287,198(0.04%)#202 |
| 67. | Northdale | 124 | 33,556(0.37%)#67 | 287,198(0.04%)#206 |
| 68. | Gladeview | 117 | 33,556(0.35%)#68 | 287,198(0.04%)#219 |
| 69. | Ives Estates | 116 | 33,556(0.35%)#69 | 287,198(0.04%)#220 |
| 70. | Goldenrod | 115 | 33,556(0.34%)#70 | 287,198(0.04%)#223 |
| 71. | Gulf Breeze | 115 | 33,556(0.34%)#71 | 287,198(0.04%)#224 |
| 72. | North Port | 114 | 33,556(0.34%)#72 | 287,198(0.04%)#227 |
| 73. | Fort Lauderdale | 110 | 33,556(0.33%)#73 | 287,198(0.04%)#237 |
| 74. | The Hammocks | 110 | 33,556(0.33%)#74 | 287,198(0.04%)#238 |
| 75. | Meadow Woods | 108 | 33,556(0.32%)#75 | 287,198(0.04%)#243 |
| 76. | Marion Oaks | 103 | 33,556(0.31%)#76 | 287,198(0.04%)#254 |
| 77. | Palmetto Estates | 103 | 33,556(0.31%)#77 | 287,198(0.04%)#255 |
| 78. | Town N Country | 93 | 33,556(0.28%)#78 | 287,198(0.03%)#273 |
| 79. | Weston | 92 | 33,556(0.27%)#79 | 287,198(0.03%)#277 |
| 80. | Greenacres | 90 | 33,556(0.27%)#80 | 287,198(0.03%)#283 |
| 81. | Bartow | 88 | 33,556(0.26%)#81 | 287,198(0.03%)#286 |
| 82. | Cutler Bay | 86 | 33,556(0.26%)#82 | 287,198(0.03%)#288 |
| 83. | Richmond West | 85 | 33,556(0.25%)#83 | 287,198(0.03%)#292 |
| 84. | Key West | 85 | 33,556(0.25%)#84 | 287,198(0.03%)#293 |
| 85. | Punta Gorda | 84 | 33,556(0.25%)#85 | 287,198(0.03%)#296 |
| 86. | South Apopka | 83 | 33,556(0.25%)#86 | 287,198(0.03%)#297 |
| 87. | Rio Pinar | 82 | 33,556(0.24%)#87 | 287,198(0.03%)#301 |
| 88. | Tavares | 81 | 33,556(0.24%)#88 | 287,198(0.03%)#304 |
| 89. | The Acreage | 76 | 33,556(0.23%)#89 | 287,198(0.03%)#320 |
| 90. | Silver Springs Shores | 74 | 33,556(0.22%)#90 | 287,198(0.03%)#330 |
| 91. | Lakeland | 73 | 33,556(0.22%)#91 | 287,198(0.03%)#336 |
| 92. | Fuller Heights | 73 | 33,556(0.22%)#92 | 287,198(0.03%)#338 |
| 93. | Mascotte | 72 | 33,556(0.21%)#93 | 287,198(0.03%)#346 |
| 94. | Boynton Beach | 71 | 33,556(0.21%)#94 | 287,198(0.02%)#349 |
| 95. | Miami | 70 | 33,556(0.21%)#95 | 287,198(0.02%)#354 |
| 96. | Port Orange | 69 | 33,556(0.21%)#96 | 287,198(0.02%)#363 |
| 97. | Golden Gate | 68 | 33,556(0.20%)#97 | 287,198(0.02%)#368 |
| 98. | Maitland | 67 | 33,556(0.20%)#98 | 287,198(0.02%)#374 |
| 99. | Kendall | 66 | 33,556(0.20%)#99 | 287,198(0.02%)#377 |
| 100. | Doctor Phillips | 65 | 33,556(0.19%)#100 | 287,198(0.02%)#382 |
Common Questions
What are the Top 10 Cities with the Most Immigrants from Guyana in Florida?
Top 10 Cities with the Most Immigrants from Guyana in Florida are:
#1
1,358
#2
1,056
#3
869
#4
685
#5
666
#6
664
#7
648
#8
647
#9
526
#10
502
What city has the Most Immigrants from Guyana in Florida?
Pine Hills has the Most Immigrants from Guyana in Florida with 1,358.
What is the Total Immigrants from Guyana in the State of Florida?
Total Immigrants from Guyana in Florida is 33,556.
What is the Total Immigrants from Guyana in the United States?
Total Immigrants from Guyana in the United States is 287,198.