Cities with the Most Immigrants from Guyana in the United States
RELATED REPORTS & OPTIONS
Guyana
United States
Compare Cities
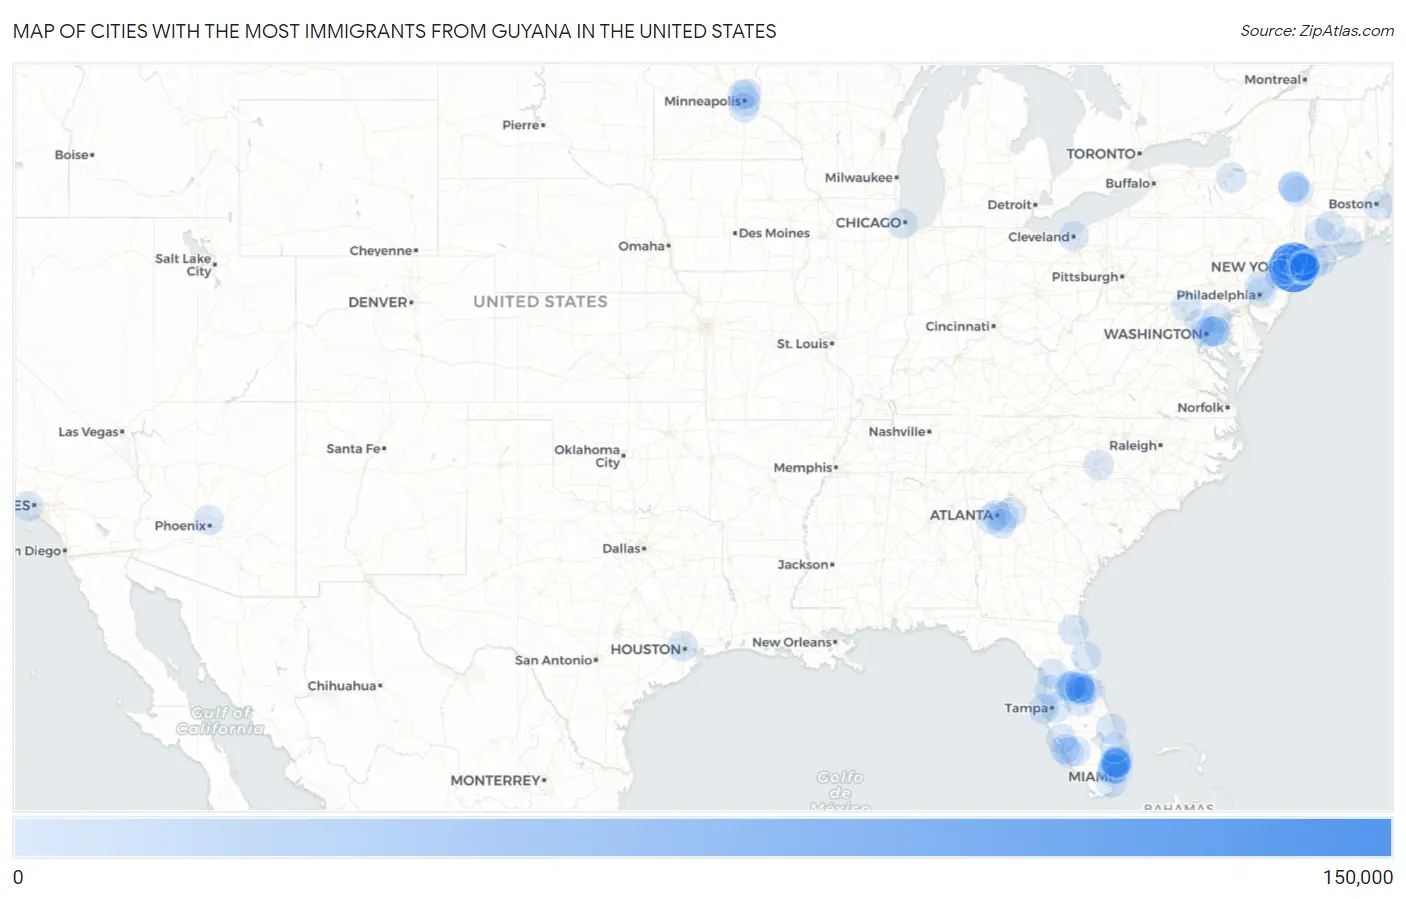
Map of Cities with the Most Immigrants from Guyana in the United States
0
150,000
Cities with the Most Immigrants from Guyana in the United States
| City | Guyana | vs State | vs National | |
| 1. | New York | 143,980 | 172,129(83.65%)#1 | 287,198(50.13%)#1 |
| 2. | Schenectady | 5,928 | 172,129(3.44%)#2 | 287,198(2.06%)#2 |
| 3. | East Orange | 3,225 | 26,173(12.32%)#1 | 287,198(1.12%)#3 |
| 4. | Jersey City | 3,194 | 26,173(12.20%)#2 | 287,198(1.11%)#4 |
| 5. | Newark | 2,898 | 26,173(11.07%)#3 | 287,198(1.01%)#5 |
| 6. | Valley Stream | 2,009 | 172,129(1.17%)#3 | 287,198(0.70%)#6 |
| 7. | Stonecrest | 1,373 | 10,397(13.21%)#1 | 287,198(0.48%)#7 |
| 8. | Pine Hills | 1,358 | 33,556(4.05%)#1 | 287,198(0.47%)#8 |
| 9. | Elmont | 1,271 | 172,129(0.74%)#4 | 287,198(0.44%)#9 |
| 10. | Waterbury | 1,140 | 5,157(22.11%)#1 | 287,198(0.40%)#10 |
| 11. | Winter Garden | 1,056 | 33,556(3.15%)#2 | 287,198(0.37%)#11 |
| 12. | Albany | 940 | 172,129(0.55%)#5 | 287,198(0.33%)#12 |
| 13. | Philadelphia | 889 | 4,519(19.67%)#1 | 287,198(0.31%)#13 |
| 14. | Port St Lucie | 869 | 33,556(2.59%)#3 | 287,198(0.30%)#14 |
| 15. | Hartford | 830 | 5,157(16.09%)#2 | 287,198(0.29%)#15 |
| 16. | New London | 800 | 5,157(15.51%)#3 | 287,198(0.28%)#16 |
| 17. | North Valley Stream | 714 | 172,129(0.41%)#6 | 287,198(0.25%)#17 |
| 18. | Yonkers | 689 | 172,129(0.40%)#7 | 287,198(0.24%)#18 |
| 19. | Poinciana | 685 | 33,556(2.04%)#4 | 287,198(0.24%)#19 |
| 20. | Englewood | 680 | 26,173(2.60%)#4 | 287,198(0.24%)#20 |
| 21. | Coram | 668 | 172,129(0.39%)#8 | 287,198(0.23%)#21 |
| 22. | Sunrise | 666 | 33,556(1.98%)#5 | 287,198(0.23%)#22 |
| 23. | Clermont | 664 | 33,556(1.98%)#6 | 287,198(0.23%)#23 |
| 24. | Ocoee | 648 | 33,556(1.93%)#7 | 287,198(0.23%)#24 |
| 25. | Jacksonville | 647 | 33,556(1.93%)#8 | 287,198(0.23%)#25 |
| 26. | Mount Vernon | 633 | 172,129(0.37%)#9 | 287,198(0.22%)#26 |
| 27. | Boston | 616 | 1,626(37.88%)#1 | 287,198(0.21%)#27 |
| 28. | Loganville | 588 | 10,397(5.66%)#2 | 287,198(0.20%)#28 |
| 29. | Charlotte | 556 | 2,465(22.56%)#1 | 287,198(0.19%)#29 |
| 30. | Washington | 556 | 556(100.00%)#1 | 287,198(0.19%)#30 |
| 31. | Pembroke Pines | 526 | 33,556(1.57%)#9 | 287,198(0.18%)#31 |
| 32. | Chicago | 508 | 1,178(43.12%)#1 | 287,198(0.18%)#32 |
| 33. | Palm Coast | 502 | 33,556(1.50%)#10 | 287,198(0.17%)#33 |
| 34. | Miramar | 480 | 33,556(1.43%)#11 | 287,198(0.17%)#34 |
| 35. | Baltimore | 465 | 8,109(5.73%)#1 | 287,198(0.16%)#35 |
| 36. | Brentwood | 453 | 172,129(0.26%)#10 | 287,198(0.16%)#36 |
| 37. | Orlando | 441 | 33,556(1.31%)#12 | 287,198(0.15%)#37 |
| 38. | Minneapolis | 433 | 3,436(12.60%)#1 | 287,198(0.15%)#38 |
| 39. | Brooklyn Park | 412 | 3,436(11.99%)#2 | 287,198(0.14%)#39 |
| 40. | South Fulton | 409 | 10,397(3.93%)#3 | 287,198(0.14%)#40 |
| 41. | Hollywood | 406 | 33,556(1.21%)#13 | 287,198(0.14%)#41 |
| 42. | Plainfield | 403 | 26,173(1.54%)#5 | 287,198(0.14%)#42 |
| 43. | Villas | 403 | 33,556(1.20%)#14 | 287,198(0.14%)#43 |
| 44. | Paterson | 391 | 26,173(1.49%)#6 | 287,198(0.14%)#44 |
| 45. | Tamarac | 386 | 33,556(1.15%)#15 | 287,198(0.13%)#45 |
| 46. | Franklin Square | 385 | 172,129(0.22%)#11 | 287,198(0.13%)#46 |
| 47. | Brandon | 382 | 33,556(1.14%)#16 | 287,198(0.13%)#47 |
| 48. | Bowie | 381 | 8,109(4.70%)#2 | 287,198(0.13%)#48 |
| 49. | Baldwin | 380 | 172,129(0.22%)#12 | 287,198(0.13%)#49 |
| 50. | Deerfield Beach | 374 | 33,556(1.11%)#17 | 287,198(0.13%)#50 |
| 51. | Uniondale | 372 | 172,129(0.22%)#13 | 287,198(0.13%)#51 |
| 52. | Hempstead | 363 | 172,129(0.21%)#14 | 287,198(0.13%)#52 |
| 53. | Atlanta | 354 | 10,397(3.40%)#4 | 287,198(0.12%)#53 |
| 54. | Horsham | 354 | 4,519(7.83%)#2 | 287,198(0.12%)#54 |
| 55. | Freeport | 353 | 172,129(0.21%)#15 | 287,198(0.12%)#55 |
| 56. | Houston | 352 | 2,928(12.02%)#1 | 287,198(0.12%)#56 |
| 57. | South Miami Heights | 352 | 33,556(1.05%)#18 | 287,198(0.12%)#57 |
| 58. | Linden | 349 | 26,173(1.33%)#7 | 287,198(0.12%)#58 |
| 59. | Pompano Beach | 345 | 33,556(1.03%)#19 | 287,198(0.12%)#59 |
| 60. | Largo | 341 | 33,556(1.02%)#20 | 287,198(0.12%)#60 |
| 61. | Coral Springs | 339 | 33,556(1.01%)#21 | 287,198(0.12%)#61 |
| 62. | Cooper City | 336 | 33,556(1.00%)#22 | 287,198(0.12%)#62 |
| 63. | Margate | 334 | 33,556(1.00%)#23 | 287,198(0.12%)#63 |
| 64. | East Meadow | 333 | 172,129(0.19%)#16 | 287,198(0.12%)#64 |
| 65. | Salisbury | 312 | 172,129(0.18%)#17 | 287,198(0.11%)#65 |
| 66. | Phoenix | 304 | 737(41.25%)#1 | 287,198(0.11%)#66 |
| 67. | Elizabeth | 300 | 26,173(1.15%)#8 | 287,198(0.10%)#67 |
| 68. | North Plainfield Borough | 298 | 26,173(1.14%)#9 | 287,198(0.10%)#68 |
| 69. | Rotterdam | 293 | 172,129(0.17%)#18 | 287,198(0.10%)#69 |
| 70. | Cleveland | 292 | 1,151(25.37%)#1 | 287,198(0.10%)#70 |
| 71. | Apopka | 289 | 33,556(0.86%)#24 | 287,198(0.10%)#71 |
| 72. | Los Angeles | 281 | 4,158(6.76%)#1 | 287,198(0.10%)#72 |
| 73. | Germantown | 280 | 8,109(3.45%)#3 | 287,198(0.10%)#73 |
| 74. | Lakeview | 273 | 172,129(0.16%)#19 | 287,198(0.10%)#74 |
| 75. | North Lauderdale | 270 | 33,556(0.80%)#25 | 287,198(0.09%)#75 |
| 76. | Hagerstown | 269 | 8,109(3.32%)#4 | 287,198(0.09%)#76 |
| 77. | Royal Palm Beach | 269 | 33,556(0.80%)#26 | 287,198(0.09%)#77 |
| 78. | Alafaya | 266 | 33,556(0.79%)#27 | 287,198(0.09%)#78 |
| 79. | Blaine | 264 | 3,436(7.68%)#3 | 287,198(0.09%)#79 |
| 80. | Hackensack | 264 | 26,173(1.01%)#10 | 287,198(0.09%)#80 |
| 81. | Spring Hill | 261 | 33,556(0.78%)#28 | 287,198(0.09%)#81 |
| 82. | East Riverdale | 261 | 8,109(3.22%)#5 | 287,198(0.09%)#82 |
| 83. | Liberty Triangle | 259 | 33,556(0.77%)#29 | 287,198(0.09%)#83 |
| 84. | Port Charlotte | 258 | 33,556(0.77%)#30 | 287,198(0.09%)#84 |
| 85. | Minneola | 257 | 33,556(0.77%)#31 | 287,198(0.09%)#85 |
| 86. | Citrus Springs | 254 | 33,556(0.76%)#32 | 287,198(0.09%)#86 |
| 87. | New Brunswick | 249 | 26,173(0.95%)#11 | 287,198(0.09%)#87 |
| 88. | Fairwood | 249 | 8,109(3.07%)#6 | 287,198(0.09%)#88 |
| 89. | Bloomington | 248 | 3,436(7.22%)#4 | 287,198(0.09%)#89 |
| 90. | Lehigh Acres | 245 | 33,556(0.73%)#33 | 287,198(0.09%)#90 |
| 91. | Groveland | 240 | 33,556(0.72%)#34 | 287,198(0.08%)#91 |
| 92. | Cape Coral | 235 | 33,556(0.70%)#35 | 287,198(0.08%)#92 |
| 93. | Syracuse | 234 | 172,129(0.14%)#20 | 287,198(0.08%)#93 |
| 94. | Glen Cove | 234 | 172,129(0.14%)#21 | 287,198(0.08%)#94 |
| 95. | Roselle Borough | 234 | 26,173(0.89%)#12 | 287,198(0.08%)#95 |
| 96. | South Plainfield Borough | 232 | 26,173(0.89%)#13 | 287,198(0.08%)#96 |
| 97. | Roosevelt | 231 | 172,129(0.13%)#22 | 287,198(0.08%)#97 |
| 98. | Oak Ridge | 229 | 33,556(0.68%)#36 | 287,198(0.08%)#98 |
| 99. | Stockbridge | 226 | 10,397(2.17%)#5 | 287,198(0.08%)#99 |
| 100. | Orlovista | 223 | 33,556(0.66%)#37 | 287,198(0.08%)#100 |
Common Questions
What are the Top 10 Cities with the Most Immigrants from Guyana in the United States?
Top 10 Cities with the Most Immigrants from Guyana in the United States are:
#1
143,980
#2
5,928
#3
3,225
#4
3,194
#5
2,898
#6
2,009
#7
1,373
#8
1,358
#9
1,271
#10
1,140
What city has the Most Immigrants from Guyana in the United States?
New York has the Most Immigrants from Guyana in the United States with 143,980.
What is the Total Immigrants from Guyana in the United States?
Total Immigrants from Guyana in the United States is 287,198.