Olean, NY
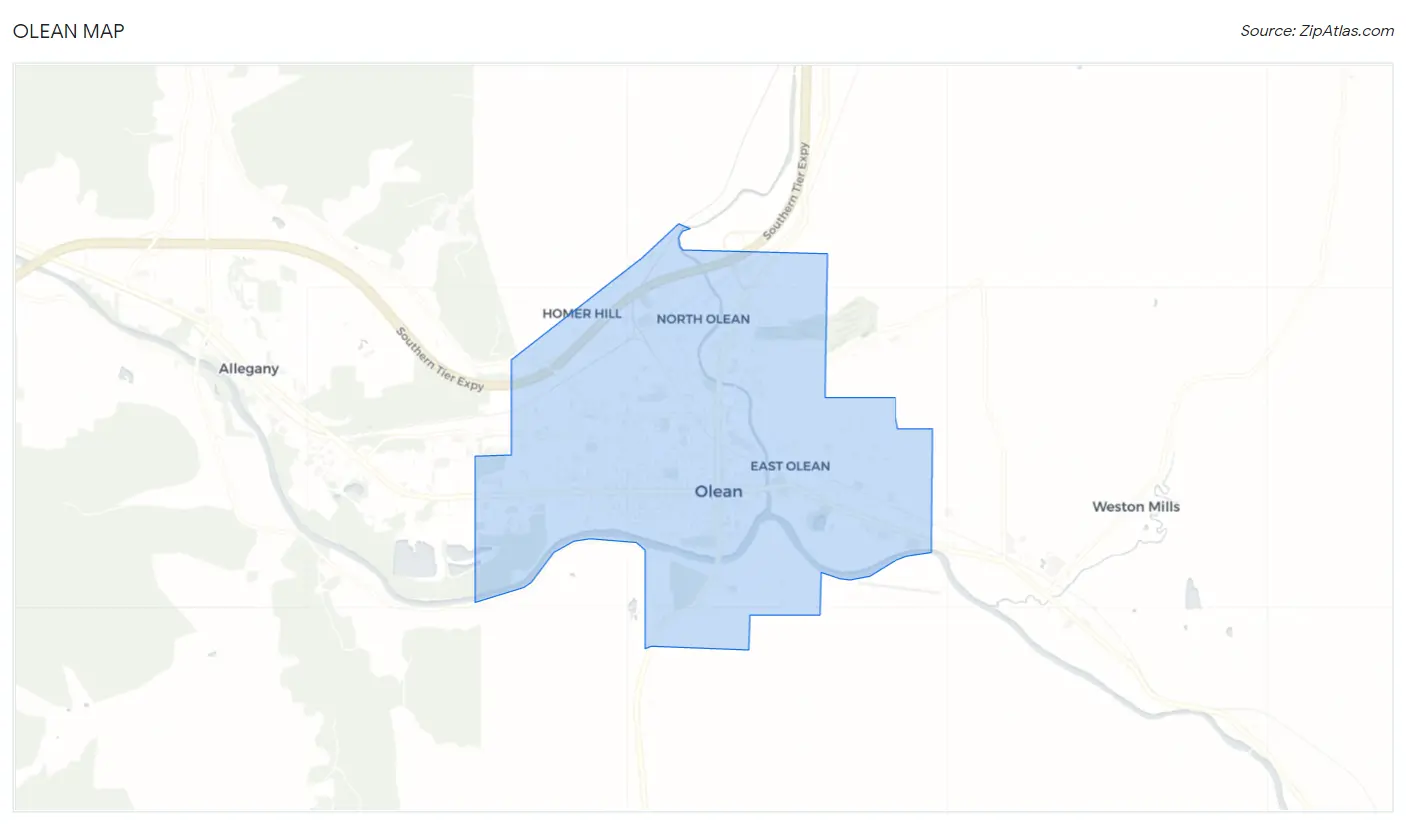
Olean Map
Olean Overview
13,890
TOTAL POPULATION
6,766
MALE POPULATION
7,124
FEMALE POPULATION
94.97
MALES / 100 FEMALES
105.29
FEMALES / 100 MALES
38.9
MEDIAN AGE
3.0
AVG FAMILY SIZE
2.2
AVG HOUSEHOLD SIZE
$28,551
PER CAPITA INCOME
$58,387
AVG FAMILY INCOME
$45,078
AVG HOUSEHOLD INCOME
28.8%
WAGE / INCOME GAP [ % ]
71.2¢/ $1
WAGE / INCOME GAP [ $ ]
$11,185
FAMILY INCOME DEFICIT
0.46
INEQUALITY / GINI INDEX
6,524
LABOR FORCE [ PEOPLE ]
59.8%
PERCENT IN LABOR FORCE
6.6%
UNEMPLOYMENT RATE
Olean Zip Codes
Race in Olean
The most populous races in Olean are White / Caucasian (12,334 | 88.8%), Two or more Races (691 | 5.0%), and Black / African American (395 | 2.8%).
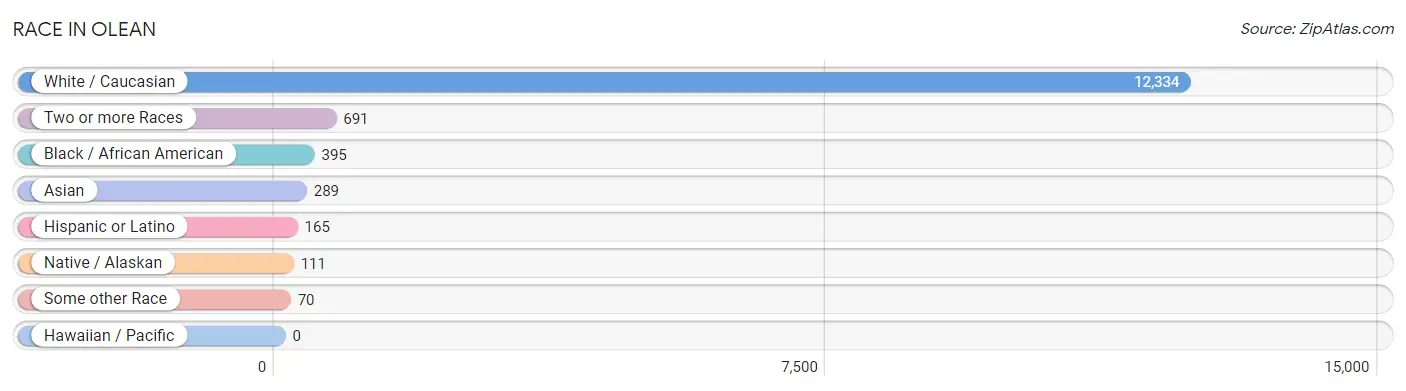
| Race | # Population | % Population |
| Asian | 289 | 2.1% |
| Black / African American | 395 | 2.8% |
| Hawaiian / Pacific | 0 | 0.0% |
| Hispanic or Latino | 165 | 1.2% |
| Native / Alaskan | 111 | 0.8% |
| White / Caucasian | 12,334 | 88.8% |
| Two or more Races | 691 | 5.0% |
| Some other Race | 70 | 0.5% |
| Total | 13,890 | 100.0% |
Ancestry in Olean
The most populous ancestries reported in Olean are Irish (3,241 | 23.3%), German (2,641 | 19.0%), English (1,470 | 10.6%), Italian (1,465 | 10.5%), and Polish (1,356 | 9.8%), together accounting for 73.2% of all Olean residents.
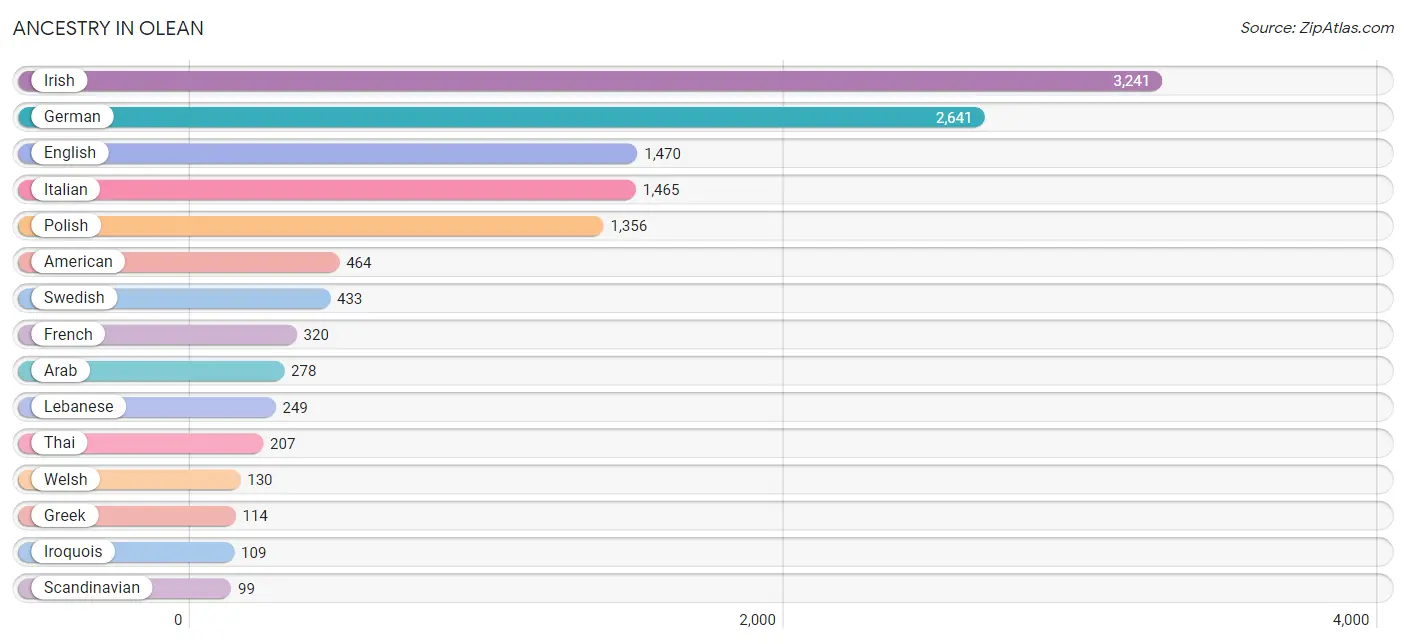
| Ancestry | # Population | % Population |
| Alsatian | 9 | 0.1% |
| American | 464 | 3.3% |
| Arab | 278 | 2.0% |
| Armenian | 13 | 0.1% |
| Austrian | 17 | 0.1% |
| Belgian | 26 | 0.2% |
| Bhutanese | 44 | 0.3% |
| Blackfeet | 31 | 0.2% |
| British | 62 | 0.4% |
| Canadian | 43 | 0.3% |
| Cherokee | 26 | 0.2% |
| Croatian | 7 | 0.1% |
| Czech | 27 | 0.2% |
| Danish | 39 | 0.3% |
| Dominican | 11 | 0.1% |
| Dutch | 71 | 0.5% |
| Eastern European | 57 | 0.4% |
| English | 1,470 | 10.6% |
| European | 42 | 0.3% |
| Finnish | 8 | 0.1% |
| French | 320 | 2.3% |
| French Canadian | 67 | 0.5% |
| German | 2,641 | 19.0% |
| Greek | 114 | 0.8% |
| Haitian | 14 | 0.1% |
| Hungarian | 26 | 0.2% |
| Indian (Asian) | 10 | 0.1% |
| Iranian | 11 | 0.1% |
| Iraqi | 24 | 0.2% |
| Irish | 3,241 | 23.3% |
| Iroquois | 109 | 0.8% |
| Italian | 1,465 | 10.5% |
| Jamaican | 9 | 0.1% |
| Lebanese | 249 | 1.8% |
| Mexican | 28 | 0.2% |
| Northern European | 12 | 0.1% |
| Norwegian | 15 | 0.1% |
| Pakistani | 11 | 0.1% |
| Pennsylvania German | 67 | 0.5% |
| Polish | 1,356 | 9.8% |
| Puerto Rican | 85 | 0.6% |
| Scandinavian | 99 | 0.7% |
| Scotch-Irish | 64 | 0.5% |
| Scottish | 90 | 0.6% |
| Slavic | 31 | 0.2% |
| Slovak | 16 | 0.1% |
| Swedish | 433 | 3.1% |
| Thai | 207 | 1.5% |
| Ukrainian | 23 | 0.2% |
| Welsh | 130 | 0.9% | View All 50 Rows |
Immigrants in Olean
The most numerous immigrant groups reported in Olean came from Asia (210 | 1.5%), South Central Asia (122 | 0.9%), Latin America (107 | 0.8%), Guyana (75 | 0.5%), and South America (75 | 0.5%), together accounting for 4.2% of all Olean residents.
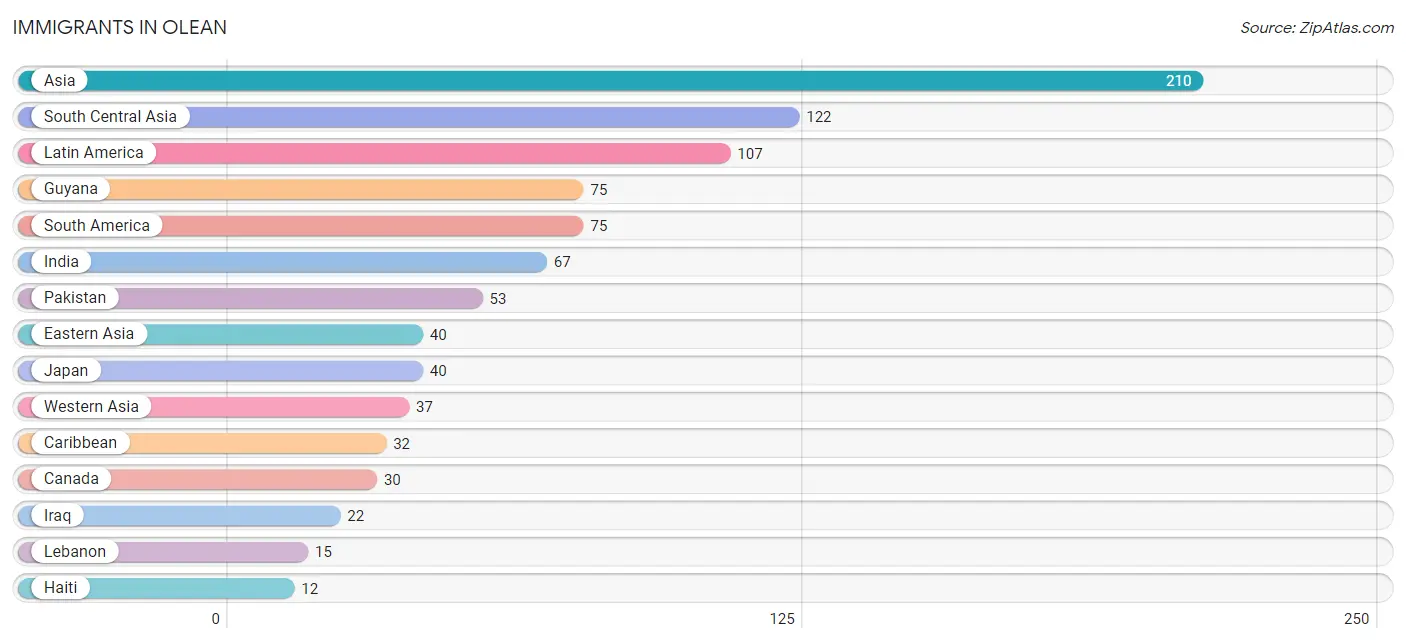
| Immigration Origin | # Population | % Population |
| Asia | 210 | 1.5% |
| Canada | 30 | 0.2% |
| Caribbean | 32 | 0.2% |
| Dominican Republic | 11 | 0.1% |
| Eastern Asia | 40 | 0.3% |
| Guyana | 75 | 0.5% |
| Haiti | 12 | 0.1% |
| India | 67 | 0.5% |
| Iraq | 22 | 0.2% |
| Jamaica | 9 | 0.1% |
| Japan | 40 | 0.3% |
| Latin America | 107 | 0.8% |
| Lebanon | 15 | 0.1% |
| Pakistan | 53 | 0.4% |
| South America | 75 | 0.5% |
| South Central Asia | 122 | 0.9% |
| South Eastern Asia | 11 | 0.1% |
| Sri Lanka | 2 | 0.0% |
| Thailand | 11 | 0.1% |
| Western Asia | 37 | 0.3% | View All 20 Rows |
Sex and Age in Olean
Sex and Age in Olean
The most populous age groups in Olean are 5 to 9 Years (587 | 8.7%) for men and 60 to 64 Years (577 | 8.1%) for women.
| Age Bracket | Male | Female |
| Under 5 Years | 381 (5.6%) | 465 (6.5%) |
| 5 to 9 Years | 587 (8.7%) | 393 (5.5%) |
| 10 to 14 Years | 433 (6.4%) | 495 (7.0%) |
| 15 to 19 Years | 517 (7.6%) | 279 (3.9%) |
| 20 to 24 Years | 346 (5.1%) | 487 (6.8%) |
| 25 to 29 Years | 356 (5.3%) | 402 (5.6%) |
| 30 to 34 Years | 504 (7.4%) | 570 (8.0%) |
| 35 to 39 Years | 576 (8.5%) | 348 (4.9%) |
| 40 to 44 Years | 475 (7.0%) | 481 (6.8%) |
| 45 to 49 Years | 373 (5.5%) | 261 (3.7%) |
| 50 to 54 Years | 493 (7.3%) | 450 (6.3%) |
| 55 to 59 Years | 330 (4.9%) | 378 (5.3%) |
| 60 to 64 Years | 464 (6.9%) | 577 (8.1%) |
| 65 to 69 Years | 318 (4.7%) | 543 (7.6%) |
| 70 to 74 Years | 359 (5.3%) | 339 (4.8%) |
| 75 to 79 Years | 104 (1.5%) | 249 (3.5%) |
| 80 to 84 Years | 76 (1.1%) | 193 (2.7%) |
| 85 Years and over | 74 (1.1%) | 214 (3.0%) |
| Total | 6,766 (100.0%) | 7,124 (100.0%) |
Families and Households in Olean
Median Family Size in Olean
The median family size in Olean is 2.95 persons per family, with married-couple families (1,993 | 59.5%) accounting for the largest median family size of 3.06 persons per family. On the other hand, single male/father families (416 | 12.4%) represent the smallest median family size with 2.59 persons per family.
| Family Type | # Families | Family Size |
| Married-Couple | 1,993 (59.5%) | 3.06 |
| Single Male/Father | 416 (12.4%) | 2.59 |
| Single Female/Mother | 942 (28.1%) | 2.85 |
| Total Families | 3,351 (100.0%) | 2.95 |
Median Household Size in Olean
The median household size in Olean is 2.21 persons per household, with single male/father households (416 | 6.8%) accounting for the largest median household size of 3.16 persons per household. non-family households (2,791 | 45.4%) represent the smallest median household size with 1.18 persons per household.
| Household Type | # Households | Household Size |
| Married-Couple | 1,993 (32.5%) | 3.06 |
| Single Male/Father | 416 (6.8%) | 3.16 |
| Single Female/Mother | 942 (15.3%) | 3.01 |
| Non-family | 2,791 (45.4%) | 1.18 |
| Total Households | 6,142 (100.0%) | 2.21 |
Household Size by Marriage Status in Olean
Out of a total of 6,142 households in Olean, 3,351 (54.6%) are family households, while 2,791 (45.4%) are nonfamily households. The most numerous type of family households are 2-person households, comprising 1,382, and the most common type of nonfamily households are 1-person households, comprising 2,543.
| Household Size | Family Households | Nonfamily Households |
| 1-Person Households | - | 2,543 (41.4%) |
| 2-Person Households | 1,382 (22.5%) | 155 (2.5%) |
| 3-Person Households | 727 (11.8%) | 55 (0.9%) |
| 4-Person Households | 742 (12.1%) | 10 (0.2%) |
| 5-Person Households | 333 (5.4%) | 10 (0.2%) |
| 6-Person Households | 158 (2.6%) | 0 (0.0%) |
| 7+ Person Households | 9 (0.2%) | 18 (0.3%) |
| Total | 3,351 (54.6%) | 2,791 (45.4%) |
Female Fertility in Olean
Fertility by Age in Olean
Average fertility rate in Olean is 27.0 births per 1,000 women. Women in the age bracket of 20 to 34 years have the highest fertility rate with 39.0 births per 1,000 women. Women in the age bracket of 20 to 34 years acount for 72.2% of all women with births.
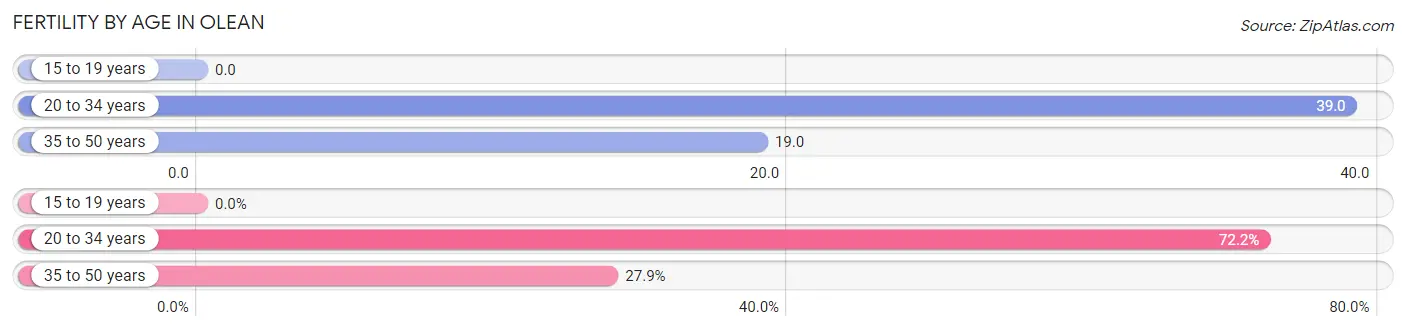
| Age Bracket | Women with Births | Births / 1,000 Women |
| 15 to 19 years | 0 (0.0%) | 0.0 |
| 20 to 34 years | 57 (72.2%) | 39.0 |
| 35 to 50 years | 22 (27.9%) | 19.0 |
| Total | 79 (100.0%) | 27.0 |
Fertility by Age by Marriage Status in Olean
89.9% of women with births (79) in Olean are married. The highest percentage of unmarried women with births falls into 20 to 34 years age bracket with 14.0% of them unmarried at the time of birth, while the lowest percentage of unmarried women with births belong to 35 to 50 years age bracket with 0.0% of them unmarried.
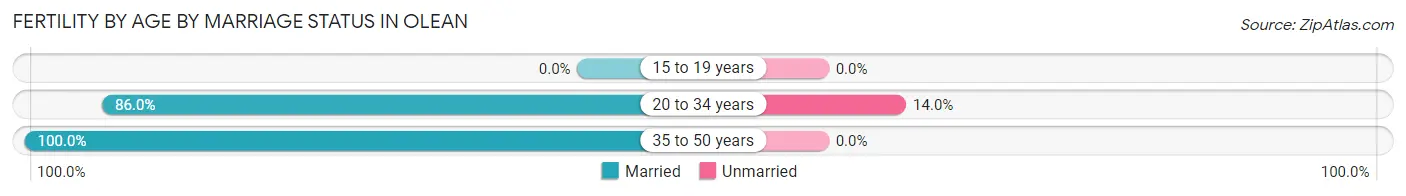
| Age Bracket | Married | Unmarried |
| 15 to 19 years | 0 (0.0%) | 0 (0.0%) |
| 20 to 34 years | 49 (86.0%) | 8 (14.0%) |
| 35 to 50 years | 22 (100.0%) | 0 (0.0%) |
| Total | 71 (89.9%) | 8 (10.1%) |
Fertility by Education in Olean
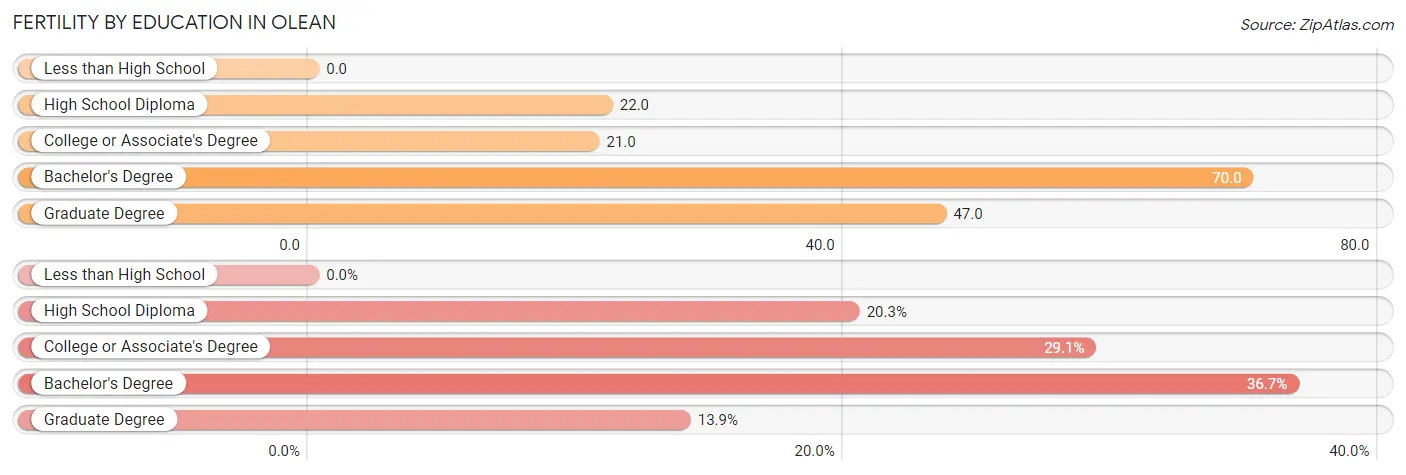
| Educational Attainment | Women with Births | Births / 1,000 Women |
| Less than High School | 0 (0.0%) | 0.0 |
| High School Diploma | 16 (20.3%) | 22.0 |
| College or Associate's Degree | 23 (29.1%) | 21.0 |
| Bachelor's Degree | 29 (36.7%) | 70.0 |
| Graduate Degree | 11 (13.9%) | 47.0 |
| Total | 79 (100.0%) | 27.0 |
Fertility by Education by Marriage Status in Olean
10.1% of women with births in Olean are unmarried. Women with the educational attainment of high school diploma are most likely to be married with 100.0% of them married at childbirth, while women with the educational attainment of bachelor's degree are least likely to be married with 27.6% of them unmarried at childbirth.
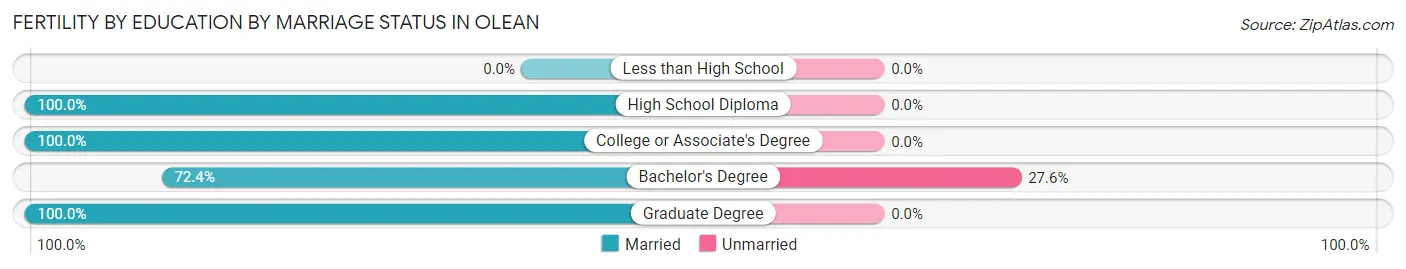
| Educational Attainment | Married | Unmarried |
| Less than High School | 0 (0.0%) | 0 (0.0%) |
| High School Diploma | 16 (100.0%) | 0 (0.0%) |
| College or Associate's Degree | 23 (100.0%) | 0 (0.0%) |
| Bachelor's Degree | 21 (72.4%) | 8 (27.6%) |
| Graduate Degree | 11 (100.0%) | 0 (0.0%) |
| Total | 71 (89.9%) | 8 (10.1%) |
Income in Olean
Income Overview in Olean
Per Capita Income in Olean is $28,551, while median incomes of families and households are $58,387 and $45,078 respectively.
| Characteristic | Number | Measure |
| Per Capita Income | 13,890 | $28,551 |
| Median Family Income | 3,351 | $58,387 |
| Mean Family Income | 3,351 | $68,541 |
| Median Household Income | 6,142 | $45,078 |
| Mean Household Income | 6,142 | $63,600 |
| Income Deficit | 3,351 | $11,185 |
| Wage / Income Gap (%) | 13,890 | 28.82% |
| Wage / Income Gap ($) | 13,890 | 71.18¢ per $1 |
| Gini / Inequality Index | 13,890 | 0.46 |
Earnings by Sex in Olean
Average Earnings in Olean are $32,525, $40,463 for men and $28,803 for women, a difference of 28.8%.
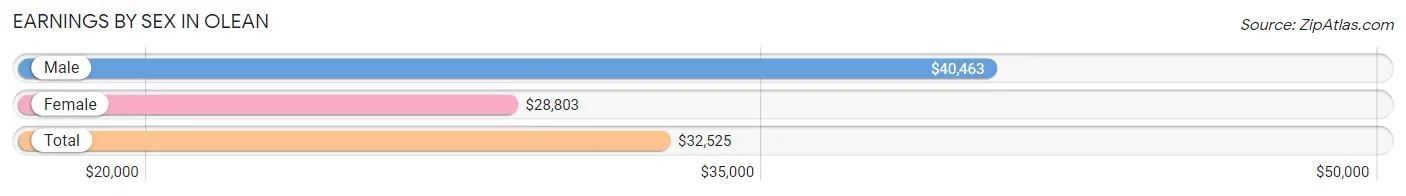
| Sex | Number | Average Earnings |
| Male | 3,138 (47.6%) | $40,463 |
| Female | 3,454 (52.4%) | $28,803 |
| Total | 6,592 (100.0%) | $32,525 |
Earnings by Sex by Income Bracket in Olean
The most common earnings brackets in Olean are $75,000 to $99,999 for men (349 | 11.1%) and $25,000 to $29,999 for women (367 | 10.6%).
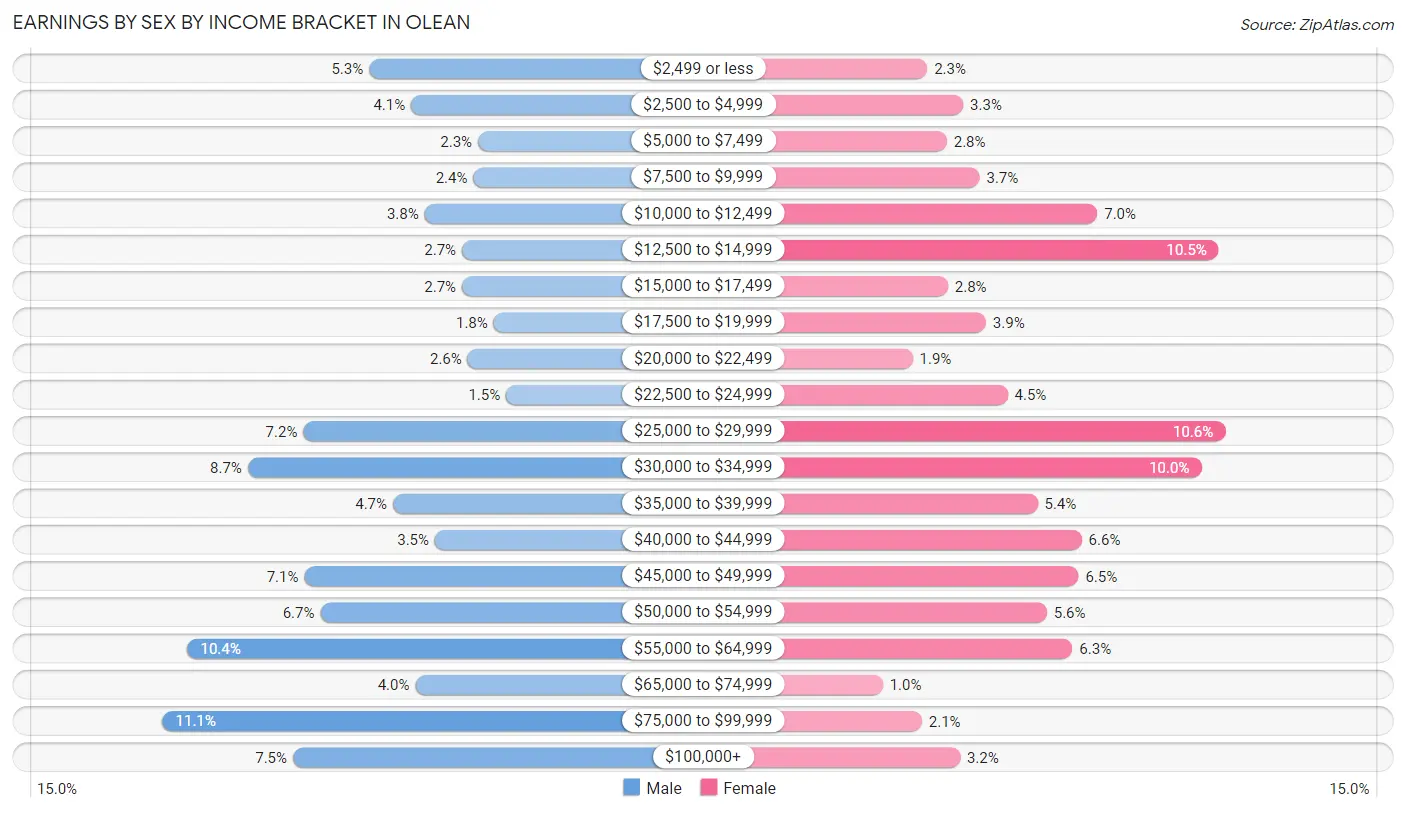
| Income | Male | Female |
| $2,499 or less | 167 (5.3%) | 78 (2.3%) |
| $2,500 to $4,999 | 130 (4.1%) | 113 (3.3%) |
| $5,000 to $7,499 | 71 (2.3%) | 97 (2.8%) |
| $7,500 to $9,999 | 75 (2.4%) | 129 (3.7%) |
| $10,000 to $12,499 | 118 (3.8%) | 243 (7.0%) |
| $12,500 to $14,999 | 85 (2.7%) | 361 (10.4%) |
| $15,000 to $17,499 | 85 (2.7%) | 98 (2.8%) |
| $17,500 to $19,999 | 57 (1.8%) | 135 (3.9%) |
| $20,000 to $22,499 | 80 (2.5%) | 64 (1.8%) |
| $22,500 to $24,999 | 46 (1.5%) | 156 (4.5%) |
| $25,000 to $29,999 | 225 (7.2%) | 367 (10.6%) |
| $30,000 to $34,999 | 274 (8.7%) | 344 (10.0%) |
| $35,000 to $39,999 | 146 (4.6%) | 185 (5.4%) |
| $40,000 to $44,999 | 109 (3.5%) | 228 (6.6%) |
| $45,000 to $49,999 | 224 (7.1%) | 225 (6.5%) |
| $50,000 to $54,999 | 210 (6.7%) | 194 (5.6%) |
| $55,000 to $64,999 | 327 (10.4%) | 219 (6.3%) |
| $65,000 to $74,999 | 126 (4.0%) | 35 (1.0%) |
| $75,000 to $99,999 | 349 (11.1%) | 73 (2.1%) |
| $100,000+ | 234 (7.5%) | 110 (3.2%) |
| Total | 3,138 (100.0%) | 3,454 (100.0%) |
Earnings by Sex by Educational Attainment in Olean
Average earnings in Olean are $46,553 for men and $30,280 for women, a difference of 35.0%. Men with an educational attainment of bachelor's degree enjoy the highest average annual earnings of $62,961, while those with high school diploma education earn the least with $33,506. Women with an educational attainment of bachelor's degree earn the most with the average annual earnings of $48,898, while those with high school diploma education have the smallest earnings of $25,951.
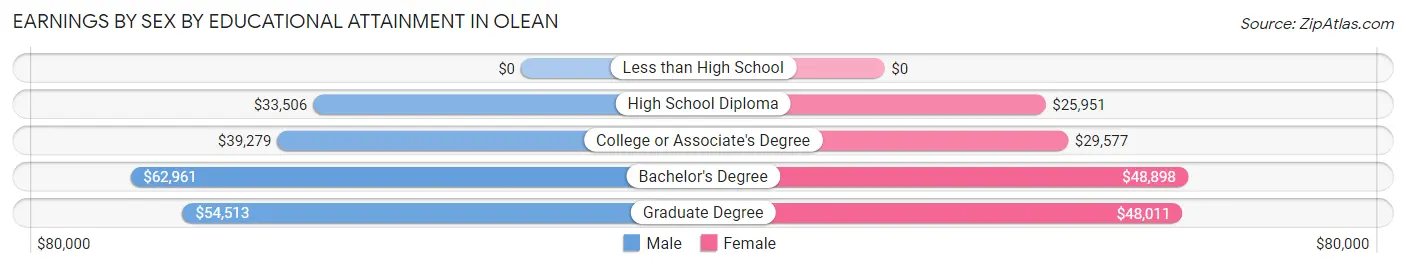
| Educational Attainment | Male Income | Female Income |
| Less than High School | - | - |
| High School Diploma | $33,506 | $25,951 |
| College or Associate's Degree | $39,279 | $29,577 |
| Bachelor's Degree | $62,961 | $48,898 |
| Graduate Degree | $54,513 | $48,011 |
| Total | $46,553 | $30,280 |
Family Income in Olean
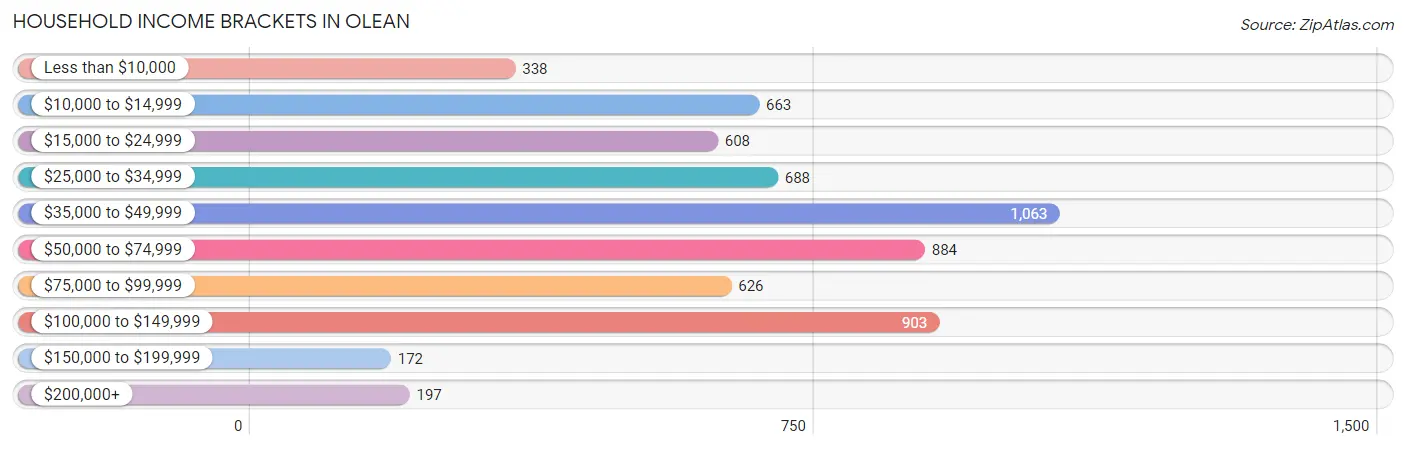
Family Income Brackets in Olean
According to the Olean family income data, there are 640 families falling into the $100,000 to $149,999 income range, which is the most common income bracket and makes up 19.1% of all families. Conversely, the $200,000+ income bracket is the least frequent group with only 94 families (2.8%) belonging to this category.
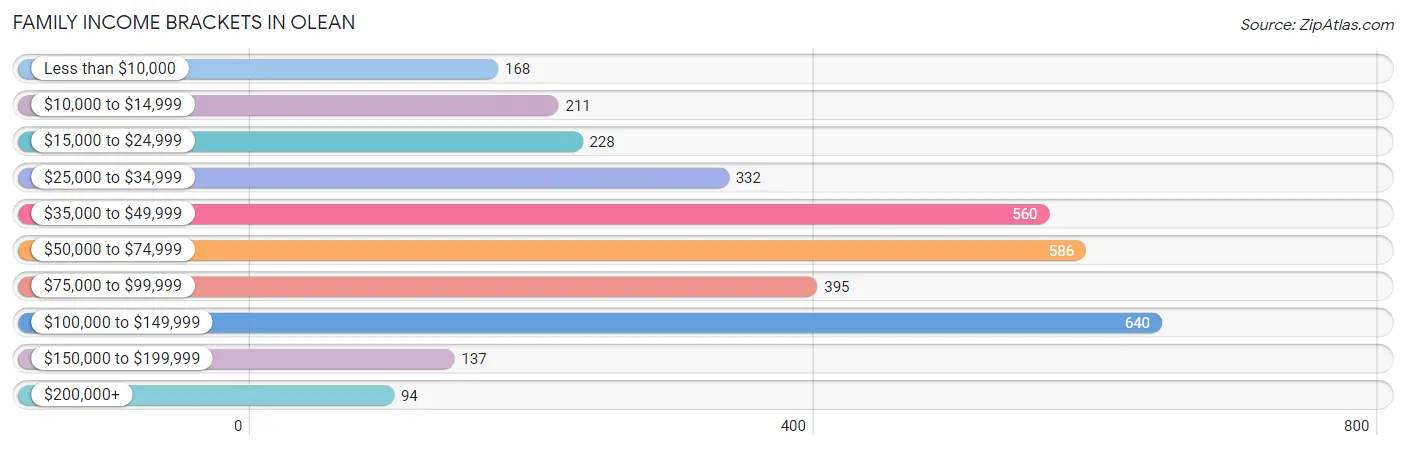
| Income Bracket | # Families | % Families |
| Less than $10,000 | 168 | 5.0% |
| $10,000 to $14,999 | 211 | 6.3% |
| $15,000 to $24,999 | 228 | 6.8% |
| $25,000 to $34,999 | 332 | 9.9% |
| $35,000 to $49,999 | 560 | 16.7% |
| $50,000 to $74,999 | 586 | 17.5% |
| $75,000 to $99,999 | 395 | 11.8% |
| $100,000 to $149,999 | 640 | 19.1% |
| $150,000 to $199,999 | 137 | 4.1% |
| $200,000+ | 94 | 2.8% |
Family Income by Famaliy Size in Olean
4-person families (600 | 17.9%) account for the highest median family income in Olean with $81,458 per family, while 2-person families (1,500 | 44.8%) have the highest median income of $26,486 per family member.
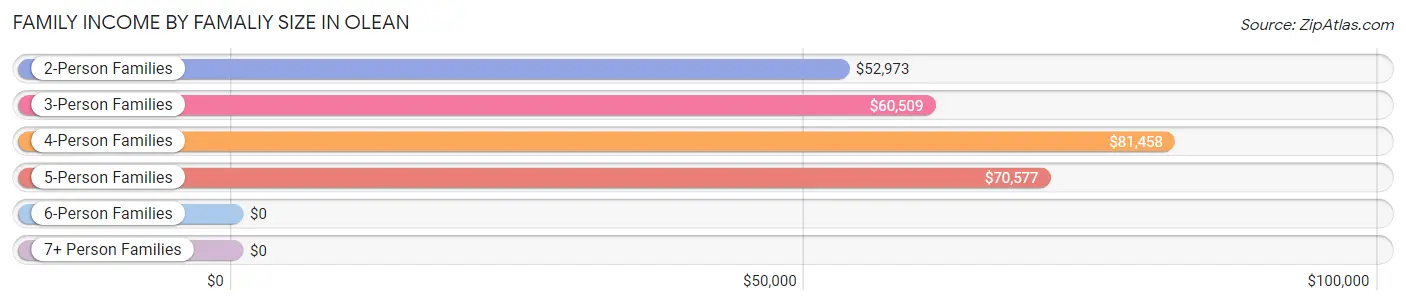
| Income Bracket | # Families | Median Income |
| 2-Person Families | 1,500 (44.8%) | $52,973 |
| 3-Person Families | 779 (23.3%) | $60,509 |
| 4-Person Families | 600 (17.9%) | $81,458 |
| 5-Person Families | 354 (10.6%) | $70,577 |
| 6-Person Families | 109 (3.3%) | $0 |
| 7+ Person Families | 9 (0.3%) | $0 |
| Total | 3,351 (100.0%) | $58,387 |
Family Income by Number of Earners in Olean
The median family income in Olean is $58,387, with families comprising 3+ earners (310) having the highest median family income of $104,375, while families with no earners (708) have the lowest median family income of $32,750, accounting for 9.2% and 21.1% of families, respectively.
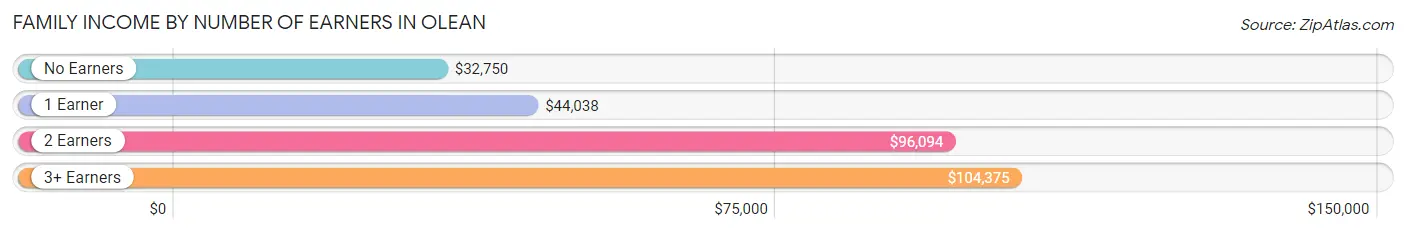
| Number of Earners | # Families | Median Income |
| No Earners | 708 (21.1%) | $32,750 |
| 1 Earner | 1,348 (40.2%) | $44,038 |
| 2 Earners | 985 (29.4%) | $96,094 |
| 3+ Earners | 310 (9.2%) | $104,375 |
| Total | 3,351 (100.0%) | $58,387 |
Household Income in Olean
Household Income Brackets in Olean
With 1,063 households falling in the category, the $35,000 to $49,999 income range is the most frequent in Olean, accounting for 17.3% of all households. In contrast, only 172 households (2.8%) fall into the $150,000 to $199,999 income bracket, making it the least populous group.
| Income Bracket | # Households | % Households |
| Less than $10,000 | 338 | 5.5% |
| $10,000 to $14,999 | 663 | 10.8% |
| $15,000 to $24,999 | 608 | 9.9% |
| $25,000 to $34,999 | 688 | 11.2% |
| $35,000 to $49,999 | 1,063 | 17.3% |
| $50,000 to $74,999 | 884 | 14.4% |
| $75,000 to $99,999 | 626 | 10.2% |
| $100,000 to $149,999 | 903 | 14.7% |
| $150,000 to $199,999 | 172 | 2.8% |
| $200,000+ | 197 | 3.2% |
Household Income by Householder Age in Olean
The median household income in Olean is $45,078, with the highest median household income of $55,960 found in the 45 to 64 years age bracket for the primary householder. A total of 2,273 households (37.0%) fall into this category. Meanwhile, the 15 to 24 years age bracket for the primary householder has the lowest median household income of $30,093, with 340 households (5.5%) in this group.
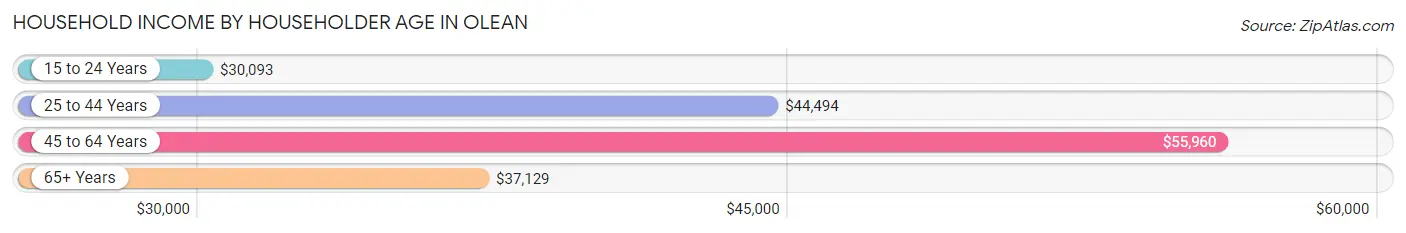
| Income Bracket | # Households | Median Income |
| 15 to 24 Years | 340 (5.5%) | $30,093 |
| 25 to 44 Years | 1,942 (31.6%) | $44,494 |
| 45 to 64 Years | 2,273 (37.0%) | $55,960 |
| 65+ Years | 1,587 (25.8%) | $37,129 |
| Total | 6,142 (100.0%) | $45,078 |
Poverty in Olean
Income Below Poverty by Sex and Age in Olean
With 25.3% poverty level for males and 22.5% for females among the residents of Olean, 5 year old males and 6 to 11 year old females are the most vulnerable to poverty, with 86 males (62.8%) and 154 females (36.6%) in their respective age groups living below the poverty level.
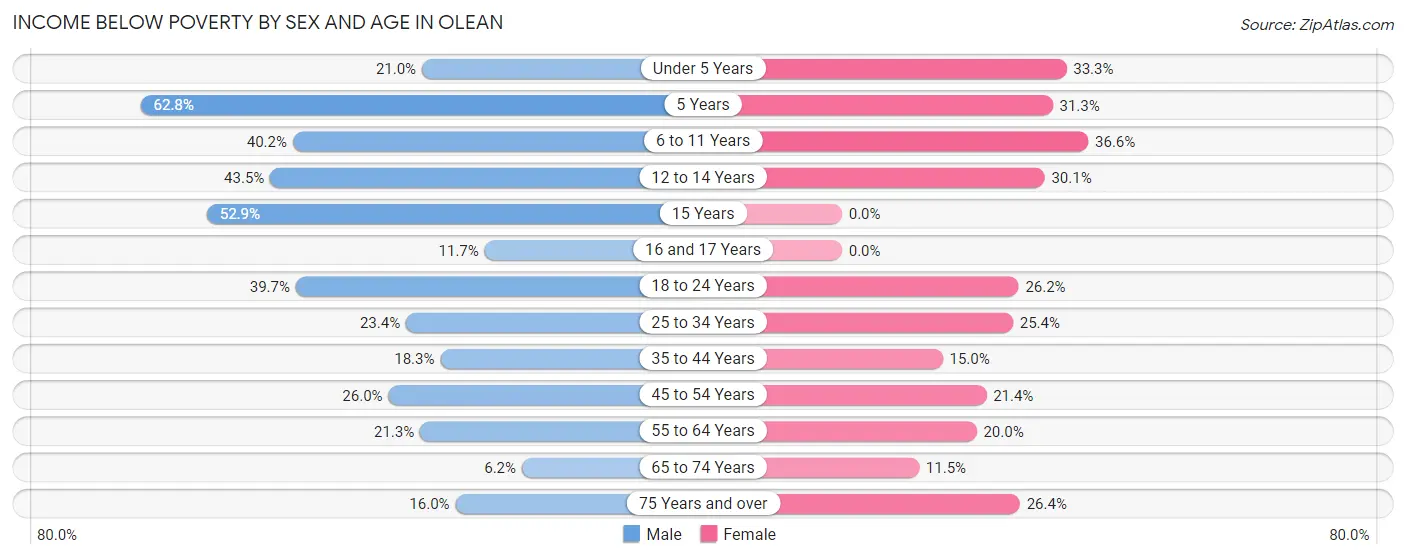
| Age Bracket | Male | Female |
| Under 5 Years | 80 (21.0%) | 155 (33.3%) |
| 5 Years | 86 (62.8%) | 46 (31.3%) |
| 6 to 11 Years | 239 (40.2%) | 154 (36.6%) |
| 12 to 14 Years | 118 (43.5%) | 93 (30.1%) |
| 15 Years | 99 (52.9%) | 0 (0.0%) |
| 16 and 17 Years | 27 (11.7%) | 0 (0.0%) |
| 18 to 24 Years | 176 (39.7%) | 165 (26.2%) |
| 25 to 34 Years | 201 (23.4%) | 246 (25.4%) |
| 35 to 44 Years | 192 (18.3%) | 124 (15.0%) |
| 45 to 54 Years | 225 (26.0%) | 149 (21.4%) |
| 55 to 64 Years | 169 (21.3%) | 191 (20.0%) |
| 65 to 74 Years | 39 (6.2%) | 101 (11.5%) |
| 75 Years and over | 38 (16.0%) | 153 (26.4%) |
| Total | 1,689 (25.3%) | 1,577 (22.5%) |
Income Above Poverty by Sex and Age in Olean
According to the poverty statistics in Olean, males aged 65 to 74 years and females aged 15 years are the age groups that are most secure financially, with 93.8% of males and 100.0% of females in these age groups living above the poverty line.
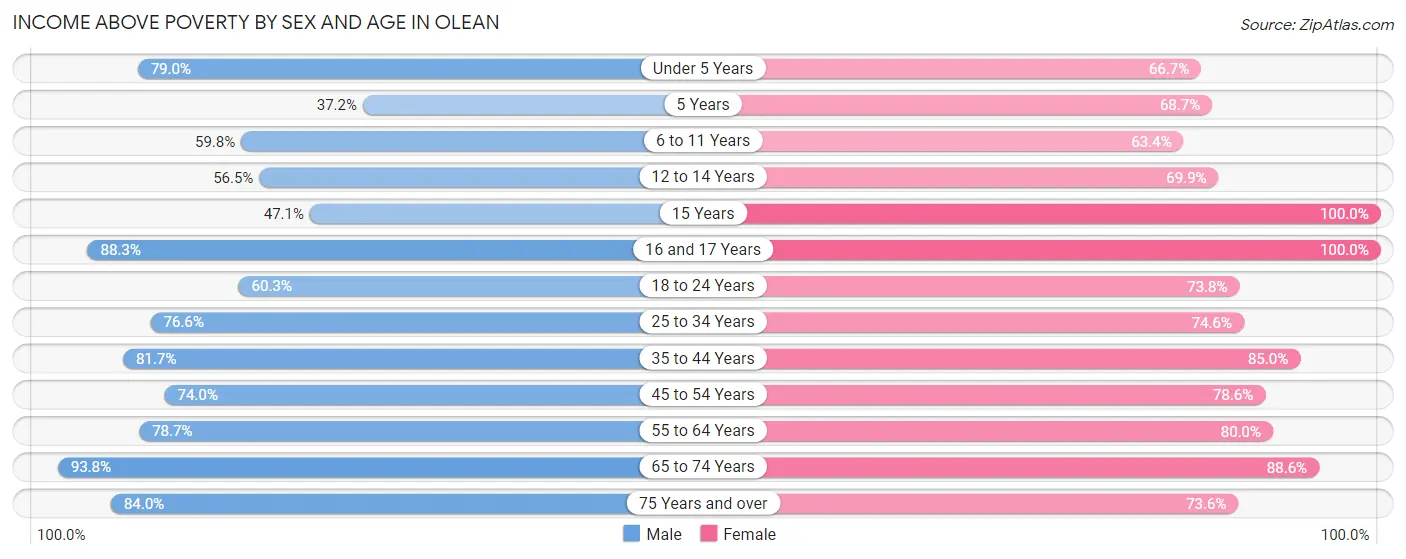
| Age Bracket | Male | Female |
| Under 5 Years | 301 (79.0%) | 310 (66.7%) |
| 5 Years | 51 (37.2%) | 101 (68.7%) |
| 6 to 11 Years | 356 (59.8%) | 267 (63.4%) |
| 12 to 14 Years | 153 (56.5%) | 216 (69.9%) |
| 15 Years | 88 (47.1%) | 38 (100.0%) |
| 16 and 17 Years | 204 (88.3%) | 95 (100.0%) |
| 18 to 24 Years | 267 (60.3%) | 464 (73.8%) |
| 25 to 34 Years | 659 (76.6%) | 723 (74.6%) |
| 35 to 44 Years | 859 (81.7%) | 705 (85.0%) |
| 45 to 54 Years | 641 (74.0%) | 546 (78.6%) |
| 55 to 64 Years | 625 (78.7%) | 764 (80.0%) |
| 65 to 74 Years | 594 (93.8%) | 781 (88.5%) |
| 75 Years and over | 199 (84.0%) | 426 (73.6%) |
| Total | 4,997 (74.7%) | 5,436 (77.5%) |
Income Below Poverty Among Married-Couple Families in Olean
The poverty statistics for married-couple families in Olean show that 8.4% or 168 of the total 1,993 families live below the poverty line. Families with 5 or more children have the highest poverty rate of 100.0%, comprising of 9 families. On the other hand, families with 1 or 2 children have the lowest poverty rate of 2.1%, which includes 16 families.
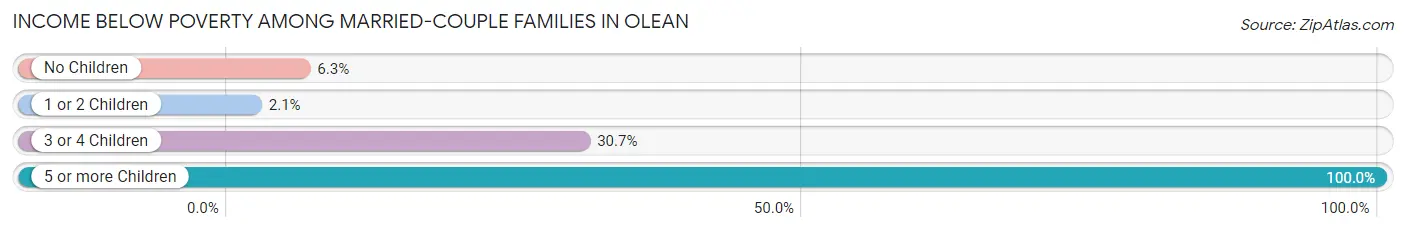
| Children | Above Poverty | Below Poverty |
| No Children | 878 (93.7%) | 59 (6.3%) |
| 1 or 2 Children | 757 (97.9%) | 16 (2.1%) |
| 3 or 4 Children | 190 (69.3%) | 84 (30.7%) |
| 5 or more Children | 0 (0.0%) | 9 (100.0%) |
| Total | 1,825 (91.6%) | 168 (8.4%) |
Income Below Poverty Among Single-Parent Households in Olean
According to the poverty data in Olean, 43.5% or 181 single-father households and 34.9% or 329 single-mother households are living below the poverty line. Among single-father households, those with 1 or 2 children have the highest poverty rate, with 132 households (47.1%) experiencing poverty. Likewise, among single-mother households, those with 3 or 4 children have the highest poverty rate, with 145 households (87.4%) falling below the poverty line.
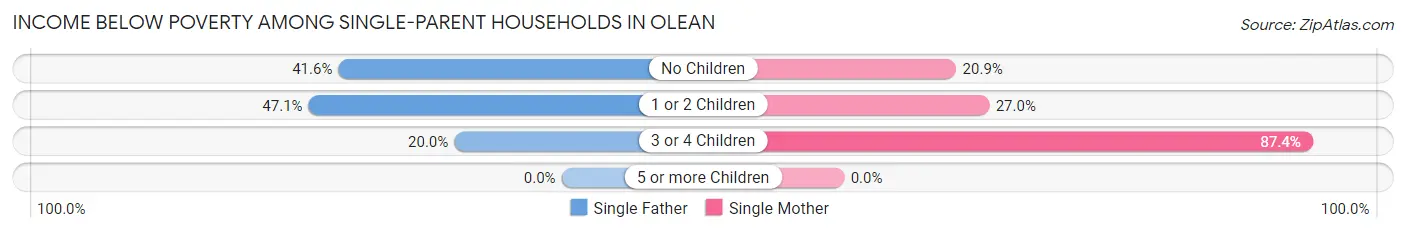
| Children | Single Father | Single Mother |
| No Children | 42 (41.6%) | 87 (20.9%) |
| 1 or 2 Children | 132 (47.1%) | 97 (27.0%) |
| 3 or 4 Children | 7 (20.0%) | 145 (87.4%) |
| 5 or more Children | 0 (0.0%) | 0 (0.0%) |
| Total | 181 (43.5%) | 329 (34.9%) |
Income Below Poverty Among Married-Couple vs Single-Parent Households in Olean
The poverty data for Olean shows that 168 of the married-couple family households (8.4%) and 510 of the single-parent households (37.6%) are living below the poverty level. Within the married-couple family households, those with 5 or more children have the highest poverty rate, with 9 households (100.0%) falling below the poverty line. Among the single-parent households, those with 3 or 4 children have the highest poverty rate, with 152 household (75.6%) living below poverty.
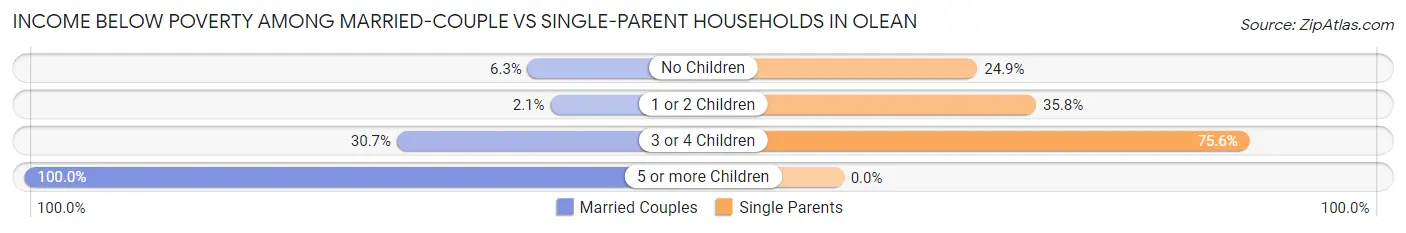
| Children | Married-Couple Families | Single-Parent Households |
| No Children | 59 (6.3%) | 129 (24.9%) |
| 1 or 2 Children | 16 (2.1%) | 229 (35.8%) |
| 3 or 4 Children | 84 (30.7%) | 152 (75.6%) |
| 5 or more Children | 9 (100.0%) | 0 (0.0%) |
| Total | 168 (8.4%) | 510 (37.6%) |
Employment Characteristics in Olean
Employment by Class of Employer in Olean
Among the 6,022 employed individuals in Olean, private company employees (3,673 | 61.0%), not-for-profit organizations (884 | 14.7%), and local government employees (726 | 12.1%) make up the most common classes of employment.
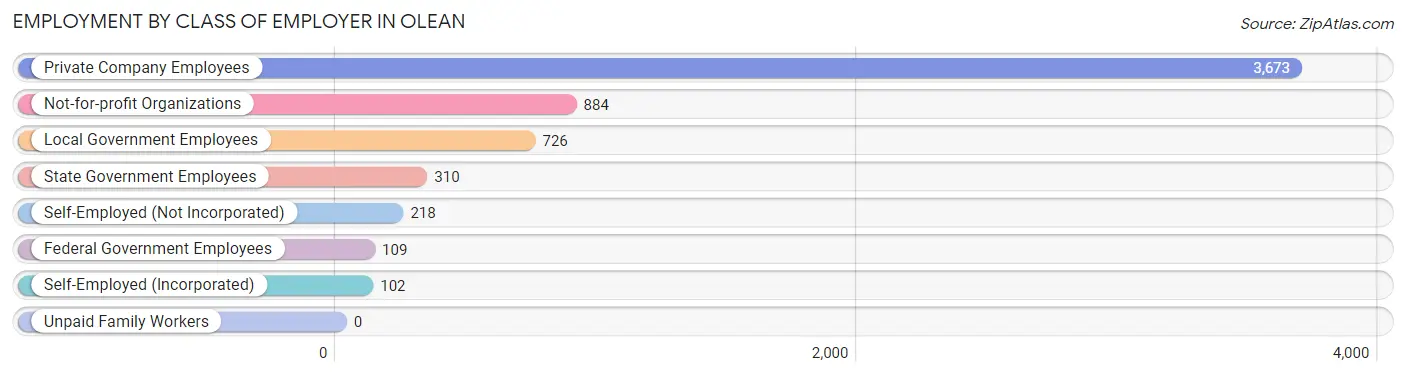
| Employer Class | # Employees | % Employees |
| Private Company Employees | 3,673 | 61.0% |
| Self-Employed (Incorporated) | 102 | 1.7% |
| Self-Employed (Not Incorporated) | 218 | 3.6% |
| Not-for-profit Organizations | 884 | 14.7% |
| Local Government Employees | 726 | 12.1% |
| State Government Employees | 310 | 5.1% |
| Federal Government Employees | 109 | 1.8% |
| Unpaid Family Workers | 0 | 0.0% |
| Total | 6,022 | 100.0% |
Employment Status by Age in Olean
According to the labor force statistics for Olean, out of the total population over 16 years of age (10,910), 59.8% or 6,524 individuals are in the labor force, with 6.6% or 431 of them unemployed. The age group with the highest labor force participation rate is 35 to 44 years, with 82.6% or 1,553 individuals in the labor force. Within the labor force, the 20 to 24 years age range has the highest percentage of unemployed individuals, with 17.1% or 98 of them being unemployed.
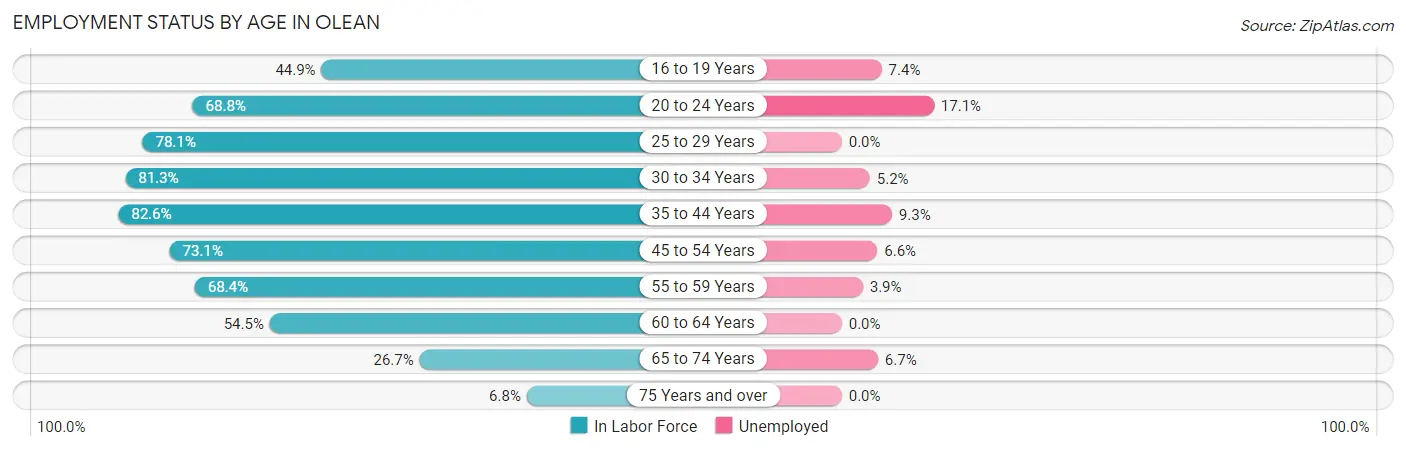
| Age Bracket | In Labor Force | Unemployed |
| 16 to 19 Years | 256 (44.9%) | 19 (7.4%) |
| 20 to 24 Years | 573 (68.8%) | 98 (17.1%) |
| 25 to 29 Years | 592 (78.1%) | 0 (0.0%) |
| 30 to 34 Years | 873 (81.3%) | 45 (5.2%) |
| 35 to 44 Years | 1,553 (82.6%) | 144 (9.3%) |
| 45 to 54 Years | 1,153 (73.1%) | 76 (6.6%) |
| 55 to 59 Years | 484 (68.4%) | 19 (3.9%) |
| 60 to 64 Years | 567 (54.5%) | 0 (0.0%) |
| 65 to 74 Years | 416 (26.7%) | 28 (6.7%) |
| 75 Years and over | 62 (6.8%) | 0 (0.0%) |
| Total | 6,524 (59.8%) | 431 (6.6%) |
Employment Status by Educational Attainment in Olean
According to labor force statistics for Olean, 74.2% of individuals (5,222) out of the total population between 25 and 64 years of age (7,038) are in the labor force, with 5.5% or 287 of them being unemployed. The group with the highest labor force participation rate are those with the educational attainment of bachelor's degree or higher, with 86.3% or 1,647 individuals in the labor force. Within the labor force, individuals with less than high school education have the highest percentage of unemployment, with 26.8% or 117 of them being unemployed.
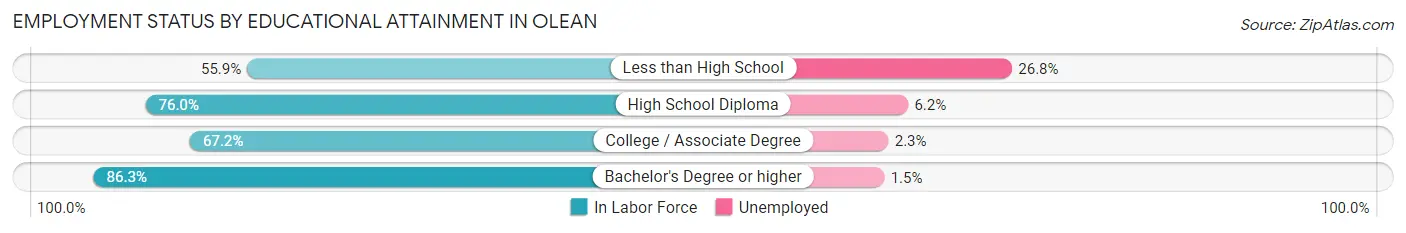
| Educational Attainment | In Labor Force | Unemployed |
| Less than High School | 436 (55.9%) | 209 (26.8%) |
| High School Diploma | 1,853 (76.0%) | 151 (6.2%) |
| College / Associate Degree | 1,285 (67.2%) | 44 (2.3%) |
| Bachelor's Degree or higher | 1,647 (86.3%) | 29 (1.5%) |
| Total | 5,222 (74.2%) | 387 (5.5%) |
Employment Occupations by Sex in Olean
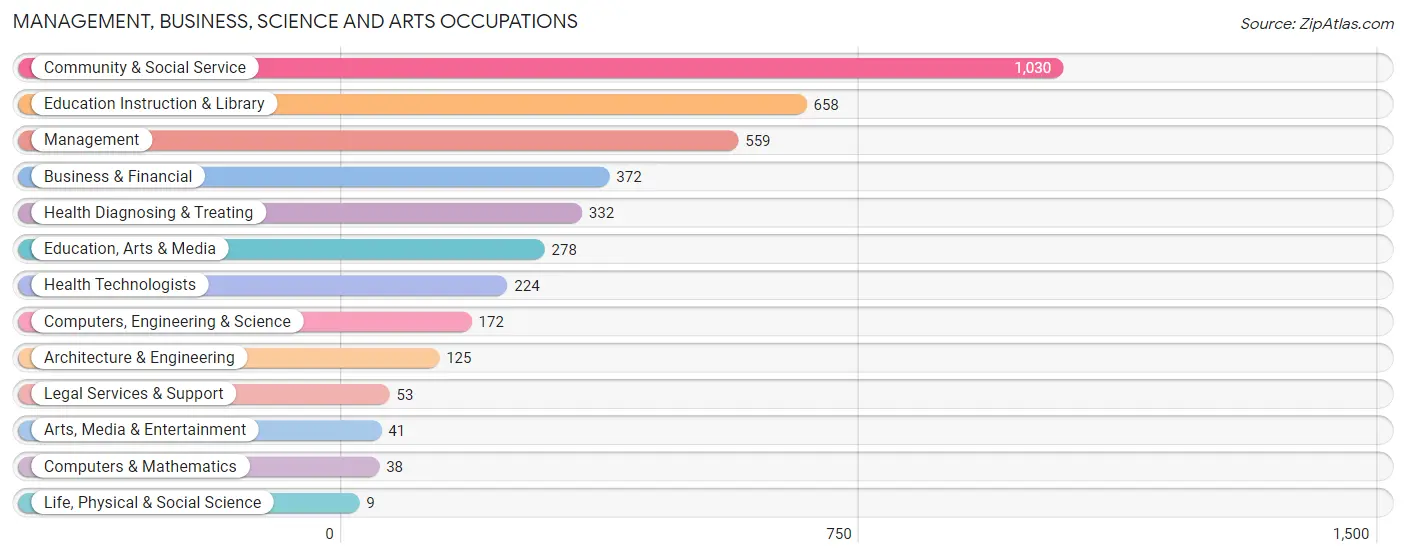
Management, Business, Science and Arts Occupations
The most common Management, Business, Science and Arts occupations in Olean are Community & Social Service (1,030 | 16.9%), Education Instruction & Library (658 | 10.8%), Management (559 | 9.2%), Business & Financial (372 | 6.1%), and Health Diagnosing & Treating (332 | 5.4%).
Management, Business, Science and Arts Occupations by Sex
Within the Management, Business, Science and Arts occupations in Olean, the most male-oriented occupations are Computers & Mathematics (100.0%), Architecture & Engineering (100.0%), and Computers, Engineering & Science (94.8%), while the most female-oriented occupations are Life, Physical & Social Science (100.0%), Health Diagnosing & Treating (78.3%), and Education, Arts & Media (76.3%).
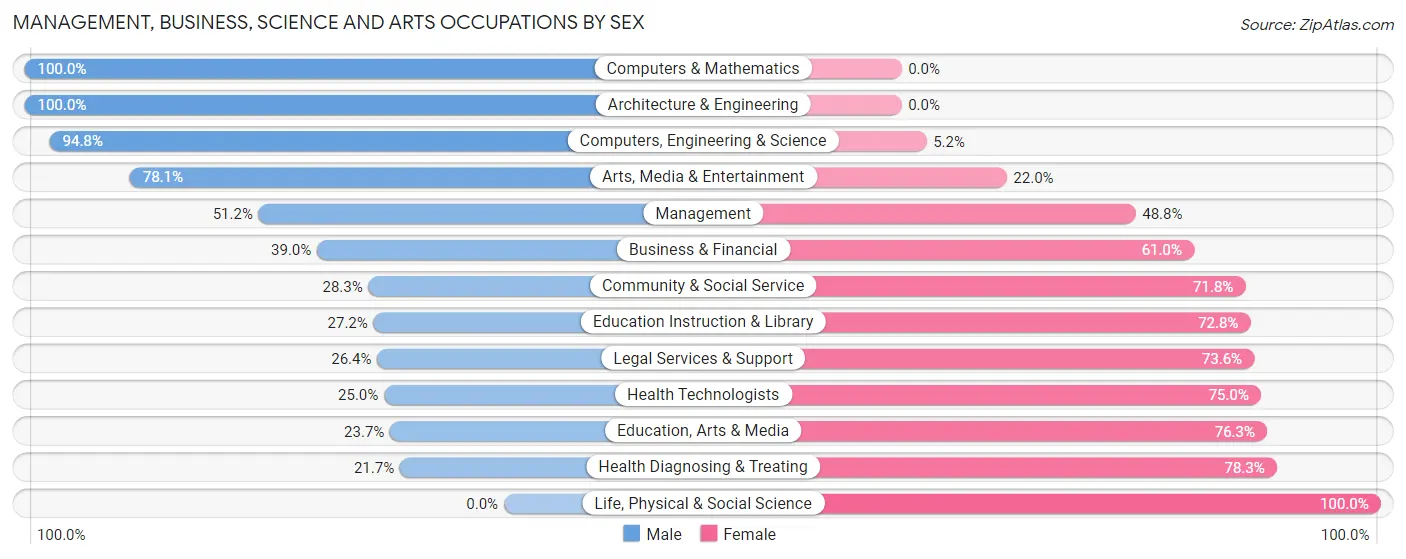
| Occupation | Male | Female |
| Management | 286 (51.2%) | 273 (48.8%) |
| Business & Financial | 145 (39.0%) | 227 (61.0%) |
| Computers, Engineering & Science | 163 (94.8%) | 9 (5.2%) |
| Computers & Mathematics | 38 (100.0%) | 0 (0.0%) |
| Architecture & Engineering | 125 (100.0%) | 0 (0.0%) |
| Life, Physical & Social Science | 0 (0.0%) | 9 (100.0%) |
| Community & Social Service | 291 (28.2%) | 739 (71.8%) |
| Education, Arts & Media | 66 (23.7%) | 212 (76.3%) |
| Legal Services & Support | 14 (26.4%) | 39 (73.6%) |
| Education Instruction & Library | 179 (27.2%) | 479 (72.8%) |
| Arts, Media & Entertainment | 32 (78.0%) | 9 (22.0%) |
| Health Diagnosing & Treating | 72 (21.7%) | 260 (78.3%) |
| Health Technologists | 56 (25.0%) | 168 (75.0%) |
| Total (Category) | 957 (38.8%) | 1,508 (61.2%) |
| Total (Overall) | 2,906 (47.6%) | 3,193 (52.3%) |
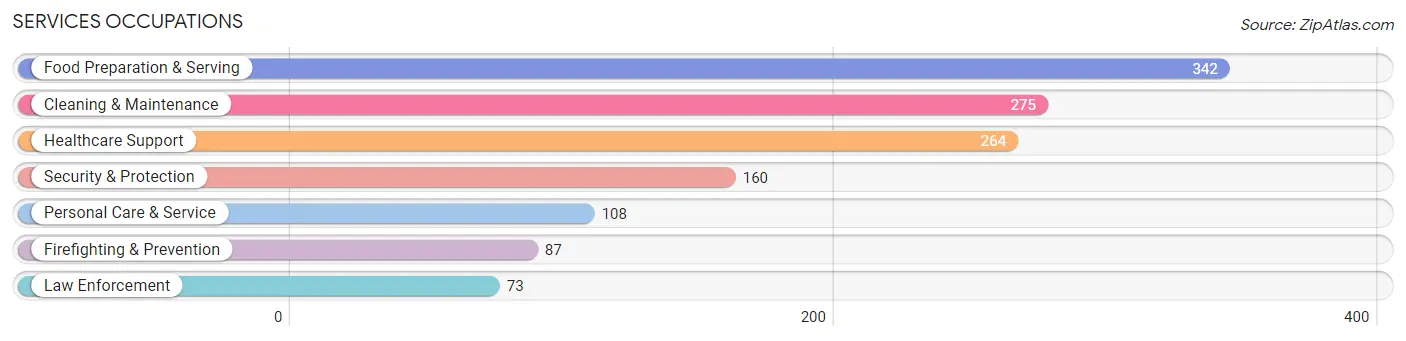
Services Occupations
The most common Services occupations in Olean are Food Preparation & Serving (342 | 5.6%), Cleaning & Maintenance (275 | 4.5%), Healthcare Support (264 | 4.3%), Security & Protection (160 | 2.6%), and Personal Care & Service (108 | 1.8%).
Services Occupations by Sex
Within the Services occupations in Olean, the most male-oriented occupations are Firefighting & Prevention (95.4%), Security & Protection (86.9%), and Law Enforcement (76.7%), while the most female-oriented occupations are Healthcare Support (81.4%), Food Preparation & Serving (65.2%), and Personal Care & Service (43.5%).
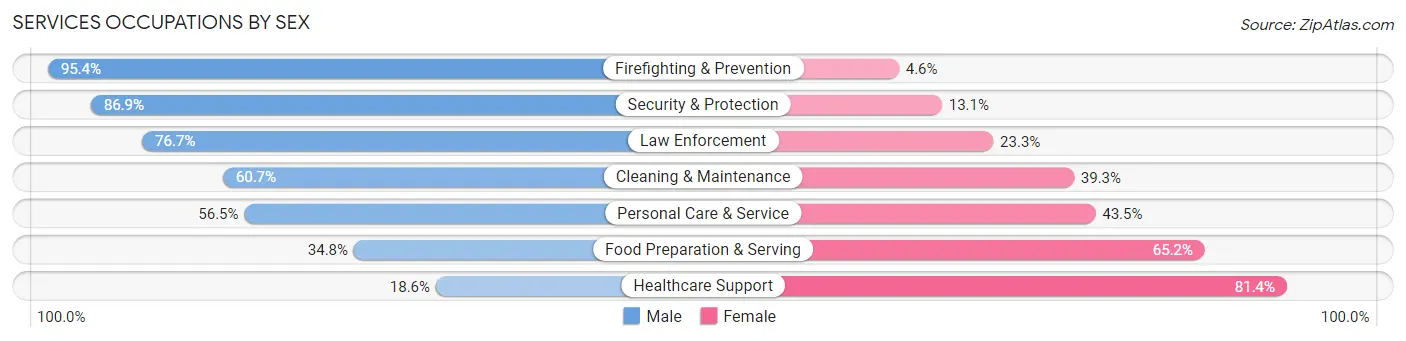
| Occupation | Male | Female |
| Healthcare Support | 49 (18.6%) | 215 (81.4%) |
| Security & Protection | 139 (86.9%) | 21 (13.1%) |
| Firefighting & Prevention | 83 (95.4%) | 4 (4.6%) |
| Law Enforcement | 56 (76.7%) | 17 (23.3%) |
| Food Preparation & Serving | 119 (34.8%) | 223 (65.2%) |
| Cleaning & Maintenance | 167 (60.7%) | 108 (39.3%) |
| Personal Care & Service | 61 (56.5%) | 47 (43.5%) |
| Total (Category) | 535 (46.6%) | 614 (53.4%) |
| Total (Overall) | 2,906 (47.6%) | 3,193 (52.3%) |
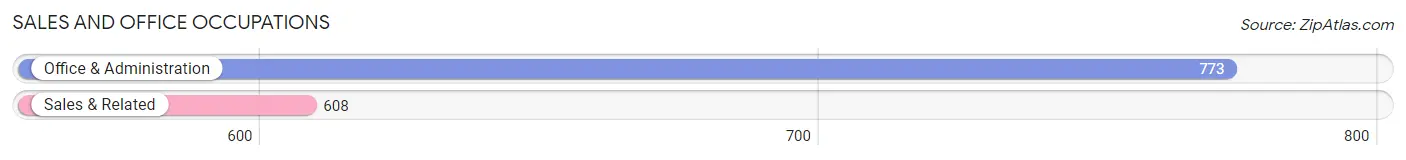
Sales and Office Occupations
The most common Sales and Office occupations in Olean are Office & Administration (773 | 12.7%), and Sales & Related (608 | 10.0%).
Sales and Office Occupations by Sex
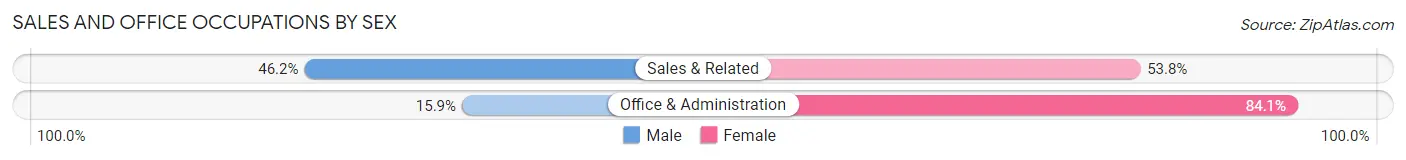
| Occupation | Male | Female |
| Sales & Related | 281 (46.2%) | 327 (53.8%) |
| Office & Administration | 123 (15.9%) | 650 (84.1%) |
| Total (Category) | 404 (29.2%) | 977 (70.8%) |
| Total (Overall) | 2,906 (47.6%) | 3,193 (52.3%) |
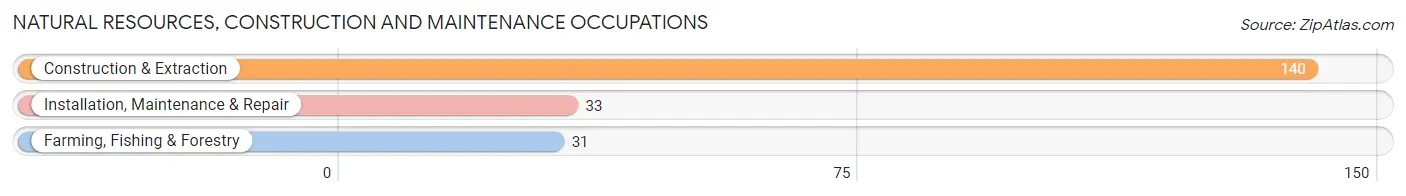
Natural Resources, Construction and Maintenance Occupations
The most common Natural Resources, Construction and Maintenance occupations in Olean are Construction & Extraction (140 | 2.3%), Installation, Maintenance & Repair (33 | 0.5%), and Farming, Fishing & Forestry (31 | 0.5%).
Natural Resources, Construction and Maintenance Occupations by Sex
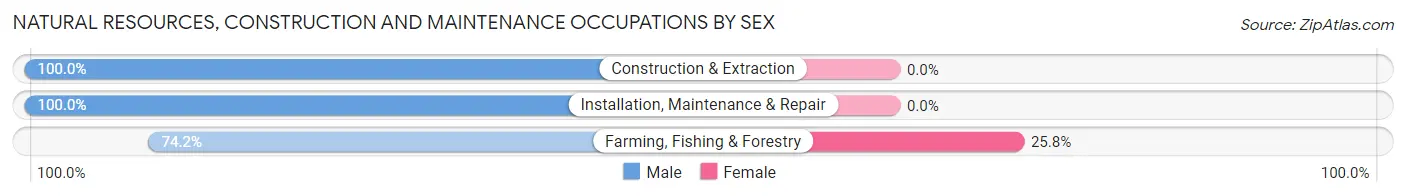
| Occupation | Male | Female |
| Farming, Fishing & Forestry | 23 (74.2%) | 8 (25.8%) |
| Construction & Extraction | 140 (100.0%) | 0 (0.0%) |
| Installation, Maintenance & Repair | 33 (100.0%) | 0 (0.0%) |
| Total (Category) | 196 (96.1%) | 8 (3.9%) |
| Total (Overall) | 2,906 (47.6%) | 3,193 (52.3%) |
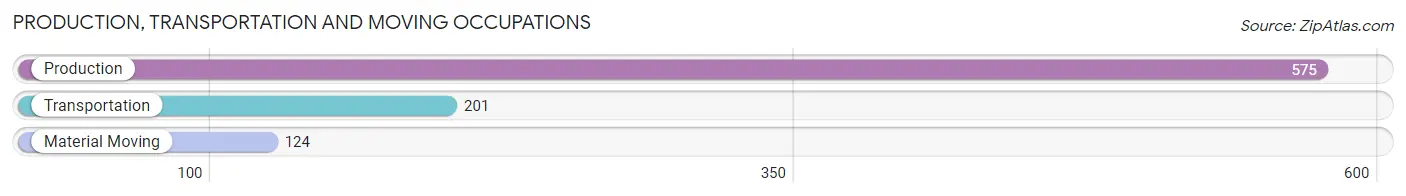
Production, Transportation and Moving Occupations
The most common Production, Transportation and Moving occupations in Olean are Production (575 | 9.4%), Transportation (201 | 3.3%), and Material Moving (124 | 2.0%).
Production, Transportation and Moving Occupations by Sex
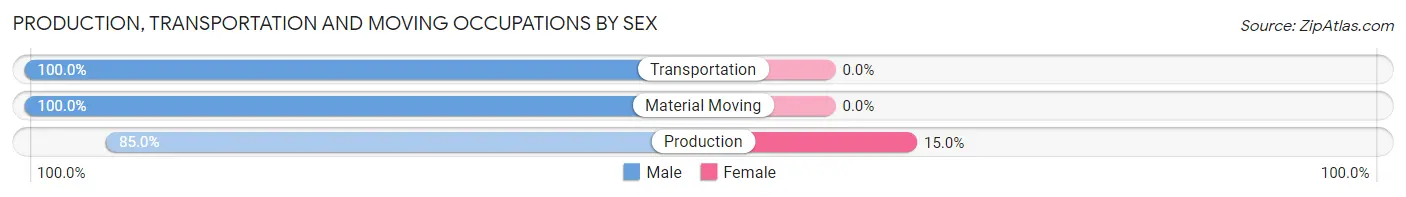
| Occupation | Male | Female |
| Production | 489 (85.0%) | 86 (15.0%) |
| Transportation | 201 (100.0%) | 0 (0.0%) |
| Material Moving | 124 (100.0%) | 0 (0.0%) |
| Total (Category) | 814 (90.4%) | 86 (9.6%) |
| Total (Overall) | 2,906 (47.6%) | 3,193 (52.3%) |
Employment Industries by Sex in Olean
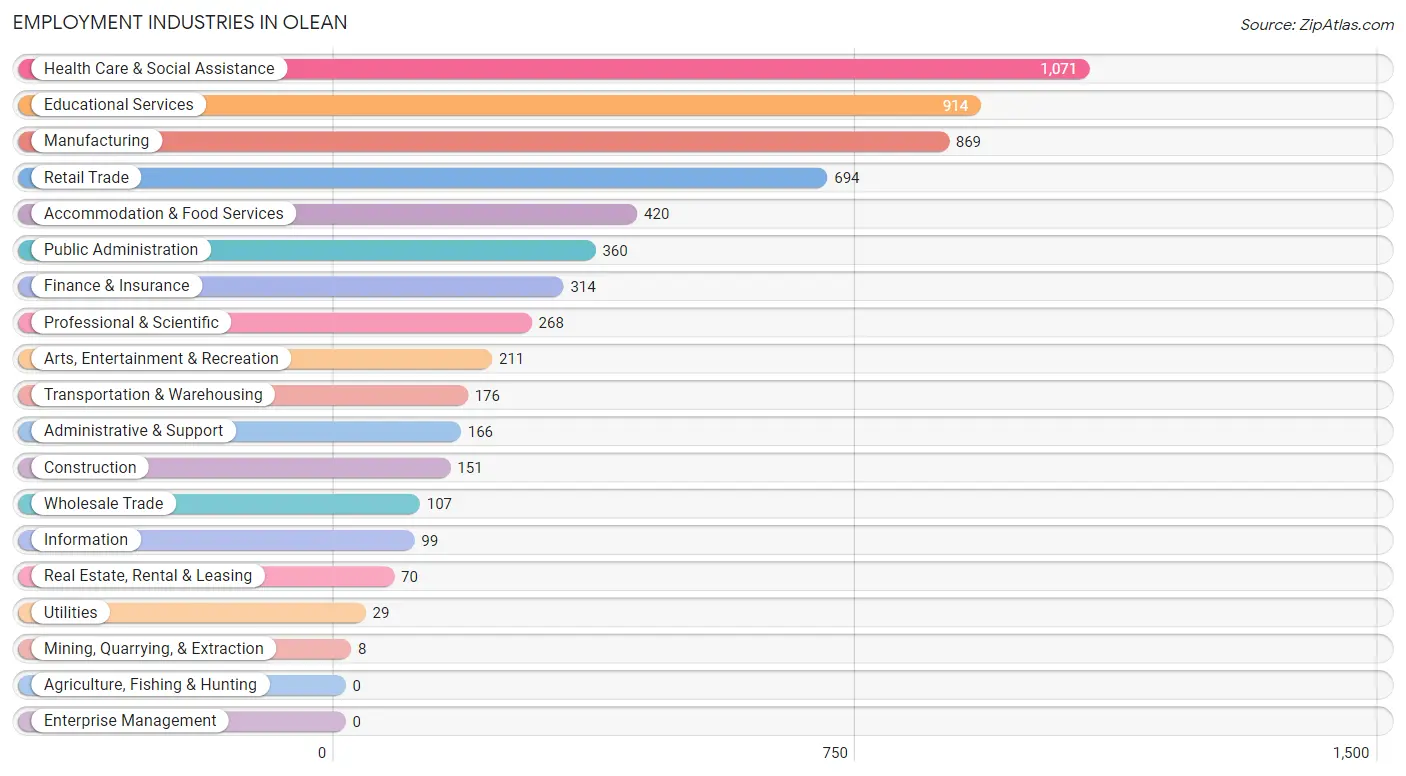
Employment Industries in Olean
The major employment industries in Olean include Health Care & Social Assistance (1,071 | 17.6%), Educational Services (914 | 15.0%), Manufacturing (869 | 14.2%), Retail Trade (694 | 11.4%), and Accommodation & Food Services (420 | 6.9%).
Employment Industries by Sex in Olean
The Olean industries that see more men than women are Mining, Quarrying, & Extraction (100.0%), Construction (100.0%), and Utilities (100.0%), whereas the industries that tend to have a higher number of women are Health Care & Social Assistance (83.7%), Accommodation & Food Services (77.1%), and Educational Services (62.9%).
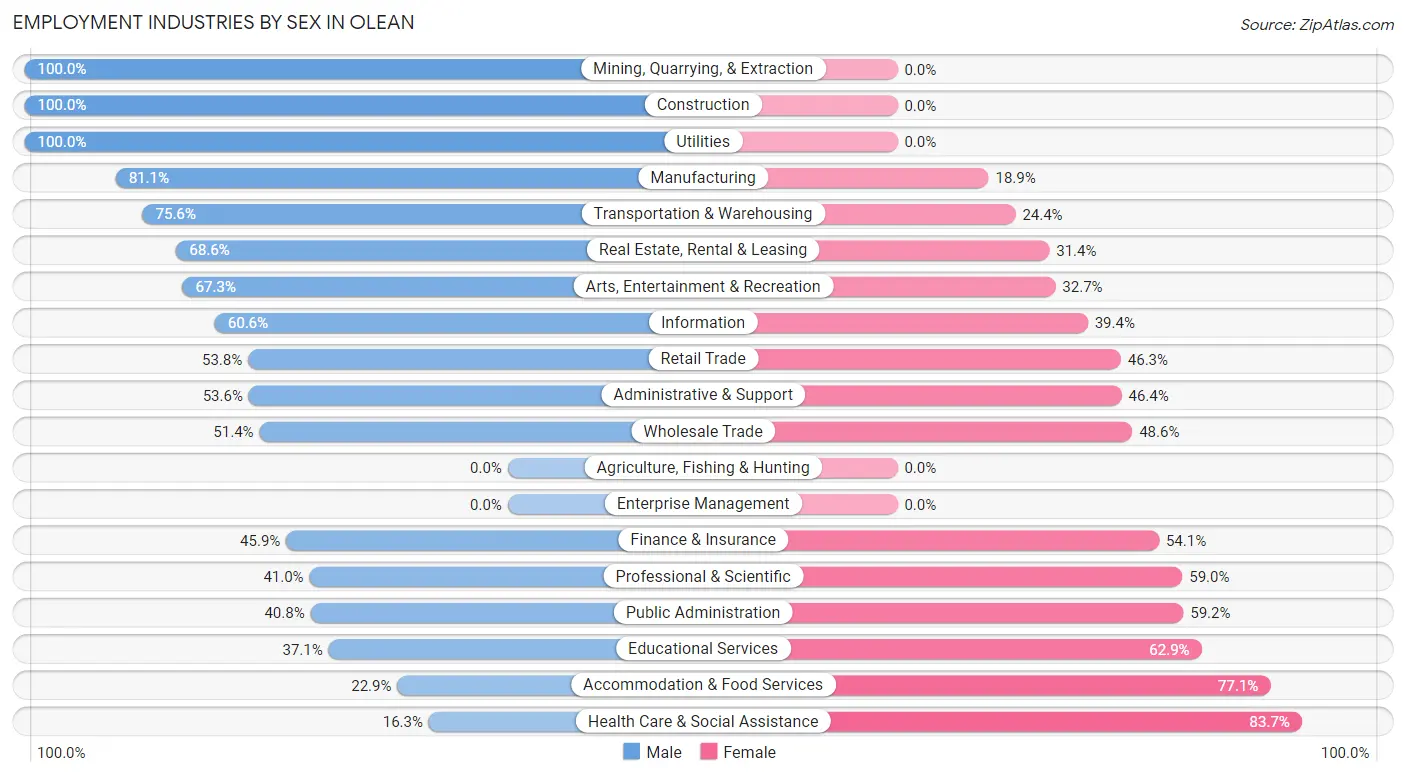
| Industry | Male | Female |
| Agriculture, Fishing & Hunting | 0 (0.0%) | 0 (0.0%) |
| Mining, Quarrying, & Extraction | 8 (100.0%) | 0 (0.0%) |
| Construction | 151 (100.0%) | 0 (0.0%) |
| Manufacturing | 705 (81.1%) | 164 (18.9%) |
| Wholesale Trade | 55 (51.4%) | 52 (48.6%) |
| Retail Trade | 373 (53.7%) | 321 (46.3%) |
| Transportation & Warehousing | 133 (75.6%) | 43 (24.4%) |
| Utilities | 29 (100.0%) | 0 (0.0%) |
| Information | 60 (60.6%) | 39 (39.4%) |
| Finance & Insurance | 144 (45.9%) | 170 (54.1%) |
| Real Estate, Rental & Leasing | 48 (68.6%) | 22 (31.4%) |
| Professional & Scientific | 110 (41.0%) | 158 (59.0%) |
| Enterprise Management | 0 (0.0%) | 0 (0.0%) |
| Administrative & Support | 89 (53.6%) | 77 (46.4%) |
| Educational Services | 339 (37.1%) | 575 (62.9%) |
| Health Care & Social Assistance | 175 (16.3%) | 896 (83.7%) |
| Arts, Entertainment & Recreation | 142 (67.3%) | 69 (32.7%) |
| Accommodation & Food Services | 96 (22.9%) | 324 (77.1%) |
| Public Administration | 147 (40.8%) | 213 (59.2%) |
| Total | 2,906 (47.6%) | 3,193 (52.3%) |
Education in Olean
School Enrollment in Olean
The most common levels of schooling among the 3,320 students in Olean are middle school (769 | 23.2%), high school (754 | 22.7%), and elementary school (748 | 22.5%).
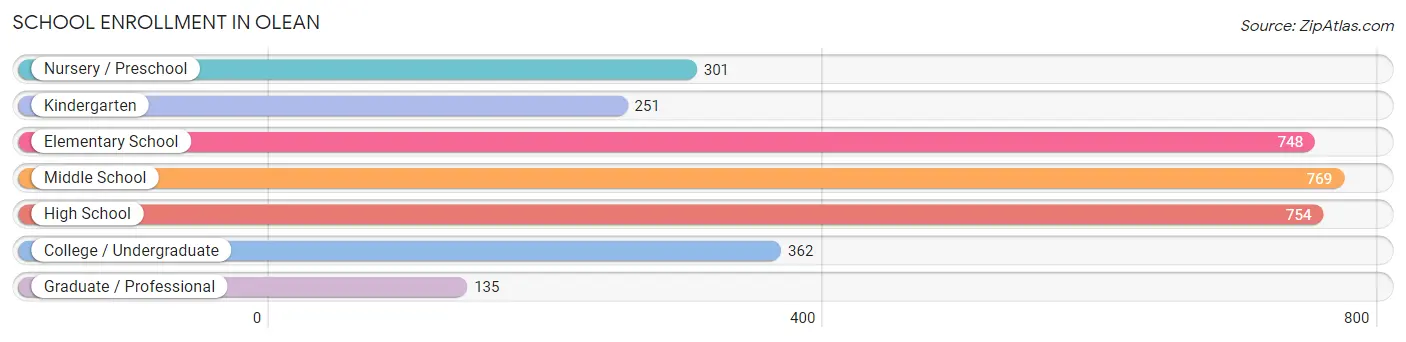
| School Level | # Students | % Students |
| Nursery / Preschool | 301 | 9.1% |
| Kindergarten | 251 | 7.6% |
| Elementary School | 748 | 22.5% |
| Middle School | 769 | 23.2% |
| High School | 754 | 22.7% |
| College / Undergraduate | 362 | 10.9% |
| Graduate / Professional | 135 | 4.1% |
| Total | 3,320 | 100.0% |
School Enrollment by Age by Funding Source in Olean
Out of a total of 3,320 students who are enrolled in schools in Olean, 309 (9.3%) attend a private institution, while the remaining 3,011 (90.7%) are enrolled in public schools. The age group of 20 to 24 year olds has the highest likelihood of being enrolled in private schools, with 63 (35.0% in the age bracket) enrolled. Conversely, the age group of 15 to 17 year olds has the lowest likelihood of being enrolled in a private school, with 503 (99.0% in the age bracket) attending a public institution.
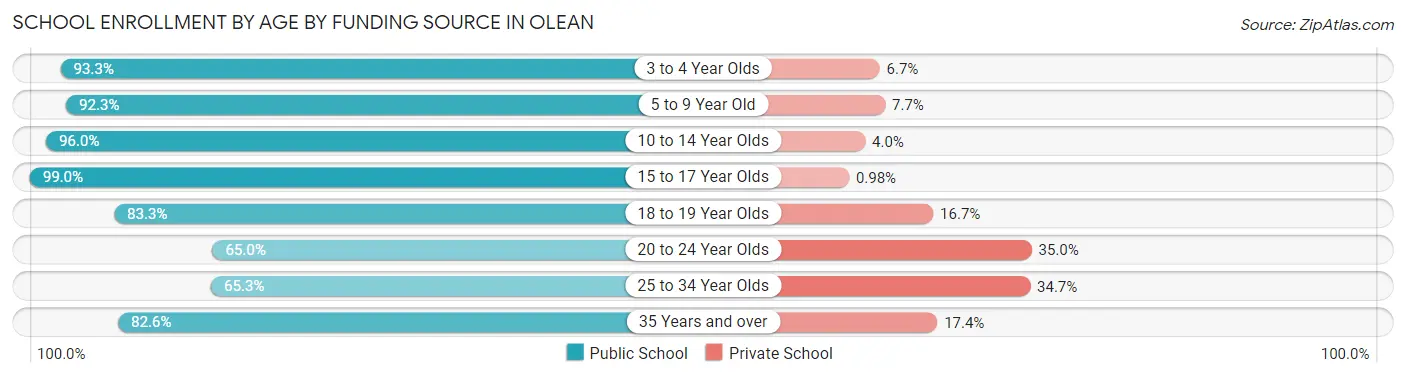
| Age Bracket | Public School | Private School |
| 3 to 4 Year Olds | 237 (93.3%) | 17 (6.7%) |
| 5 to 9 Year Old | 897 (92.3%) | 75 (7.7%) |
| 10 to 14 Year Olds | 891 (96.0%) | 37 (4.0%) |
| 15 to 17 Year Olds | 503 (99.0%) | 5 (1.0%) |
| 18 to 19 Year Olds | 130 (83.3%) | 26 (16.7%) |
| 20 to 24 Year Olds | 117 (65.0%) | 63 (35.0%) |
| 25 to 34 Year Olds | 109 (65.3%) | 58 (34.7%) |
| 35 Years and over | 128 (82.6%) | 27 (17.4%) |
| Total | 3,011 (90.7%) | 309 (9.3%) |
Educational Attainment by Field of Study in Olean
Education (382 | 13.9%), business (344 | 12.5%), science & technology (297 | 10.8%), social sciences (274 | 10.0%), and liberal arts & history (215 | 7.8%) are the most common fields of study among 2,745 individuals in Olean who have obtained a bachelor's degree or higher.
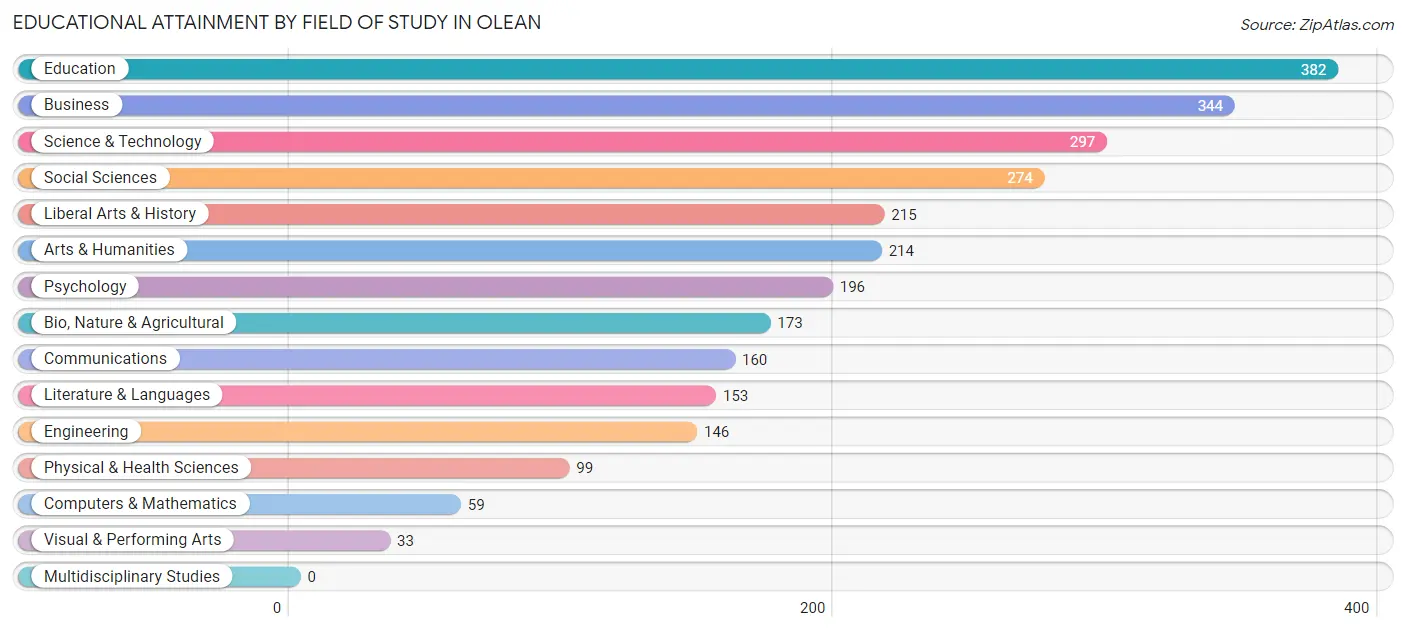
| Field of Study | # Graduates | % Graduates |
| Computers & Mathematics | 59 | 2.1% |
| Bio, Nature & Agricultural | 173 | 6.3% |
| Physical & Health Sciences | 99 | 3.6% |
| Psychology | 196 | 7.1% |
| Social Sciences | 274 | 10.0% |
| Engineering | 146 | 5.3% |
| Multidisciplinary Studies | 0 | 0.0% |
| Science & Technology | 297 | 10.8% |
| Business | 344 | 12.5% |
| Education | 382 | 13.9% |
| Literature & Languages | 153 | 5.6% |
| Liberal Arts & History | 215 | 7.8% |
| Visual & Performing Arts | 33 | 1.2% |
| Communications | 160 | 5.8% |
| Arts & Humanities | 214 | 7.8% |
| Total | 2,745 | 100.0% |
Transportation & Commute in Olean
Vehicle Availability by Sex in Olean
The most prevalent vehicle ownership categories in Olean are males with 2 vehicles (1,284, accounting for 44.8%) and females with 2 vehicles (1,016, making up 40.8%).
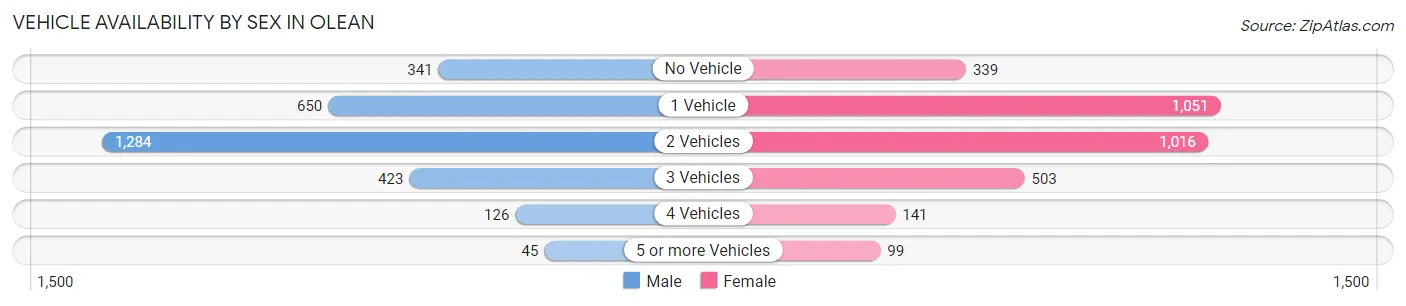
| Vehicles Available | Male | Female |
| No Vehicle | 341 (11.9%) | 339 (10.8%) |
| 1 Vehicle | 650 (22.7%) | 1,051 (33.4%) |
| 2 Vehicles | 1,284 (44.8%) | 1,016 (32.3%) |
| 3 Vehicles | 423 (14.7%) | 503 (16.0%) |
| 4 Vehicles | 126 (4.4%) | 141 (4.5%) |
| 5 or more Vehicles | 45 (1.6%) | 99 (3.1%) |
| Total | 2,869 (100.0%) | 3,149 (100.0%) |
Commute Time in Olean
The most frequently occuring commute durations in Olean are 5 to 9 minutes (1,907 commuters, 33.9%), 10 to 14 minutes (1,265 commuters, 22.5%), and less than 5 minutes (640 commuters, 11.4%).
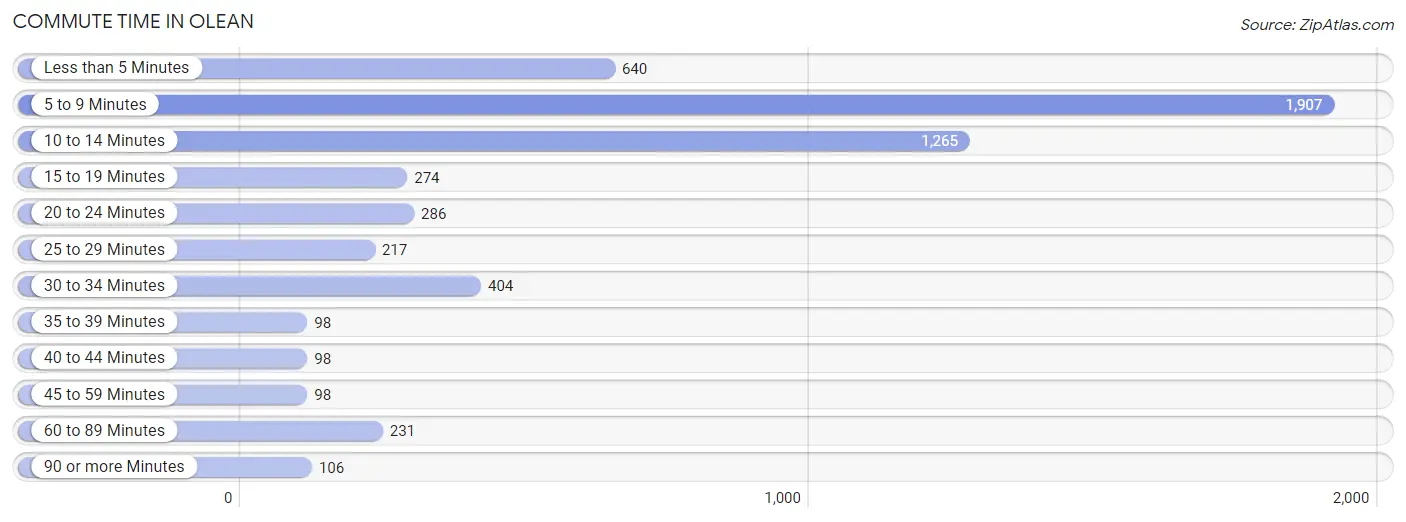
| Commute Time | # Commuters | % Commuters |
| Less than 5 Minutes | 640 | 11.4% |
| 5 to 9 Minutes | 1,907 | 33.9% |
| 10 to 14 Minutes | 1,265 | 22.5% |
| 15 to 19 Minutes | 274 | 4.9% |
| 20 to 24 Minutes | 286 | 5.1% |
| 25 to 29 Minutes | 217 | 3.9% |
| 30 to 34 Minutes | 404 | 7.2% |
| 35 to 39 Minutes | 98 | 1.7% |
| 40 to 44 Minutes | 98 | 1.7% |
| 45 to 59 Minutes | 98 | 1.7% |
| 60 to 89 Minutes | 231 | 4.1% |
| 90 or more Minutes | 106 | 1.9% |
Commute Time by Sex in Olean
The most common commute times in Olean are 5 to 9 minutes (934 commuters, 34.1%) for males and 5 to 9 minutes (973 commuters, 33.7%) for females.
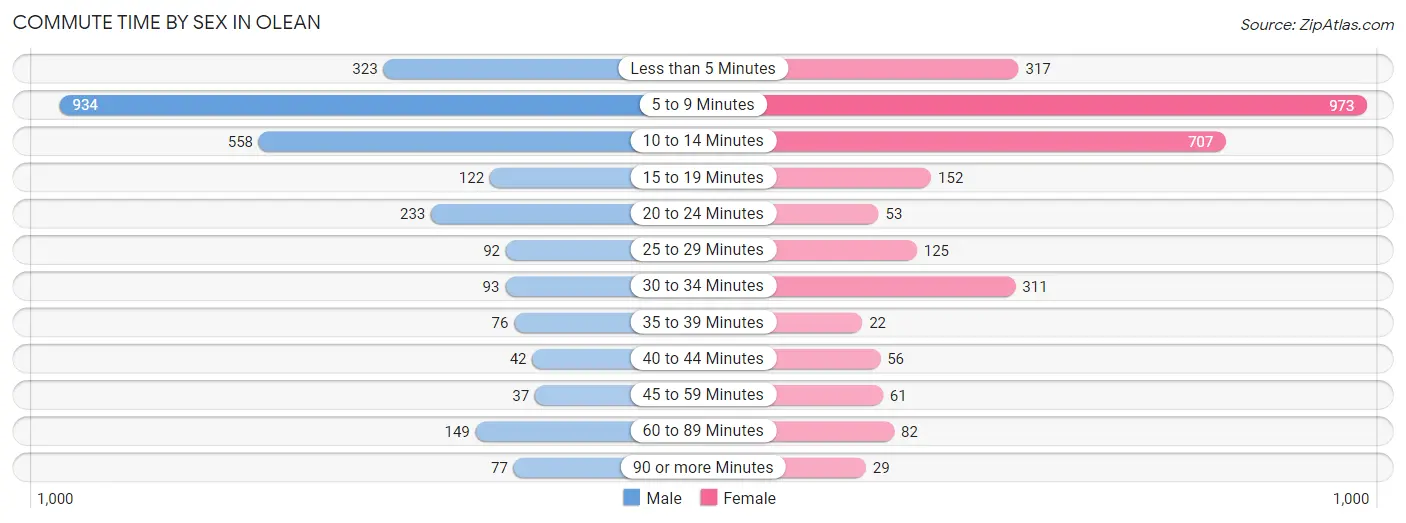
| Commute Time | Male | Female |
| Less than 5 Minutes | 323 (11.8%) | 317 (11.0%) |
| 5 to 9 Minutes | 934 (34.1%) | 973 (33.7%) |
| 10 to 14 Minutes | 558 (20.4%) | 707 (24.5%) |
| 15 to 19 Minutes | 122 (4.5%) | 152 (5.3%) |
| 20 to 24 Minutes | 233 (8.5%) | 53 (1.8%) |
| 25 to 29 Minutes | 92 (3.4%) | 125 (4.3%) |
| 30 to 34 Minutes | 93 (3.4%) | 311 (10.8%) |
| 35 to 39 Minutes | 76 (2.8%) | 22 (0.8%) |
| 40 to 44 Minutes | 42 (1.5%) | 56 (1.9%) |
| 45 to 59 Minutes | 37 (1.3%) | 61 (2.1%) |
| 60 to 89 Minutes | 149 (5.4%) | 82 (2.8%) |
| 90 or more Minutes | 77 (2.8%) | 29 (1.0%) |
Time of Departure to Work by Sex in Olean
The most frequent times of departure to work in Olean are 7:00 AM to 7:29 AM (365, 13.3%) for males and 7:30 AM to 7:59 AM (574, 19.9%) for females.
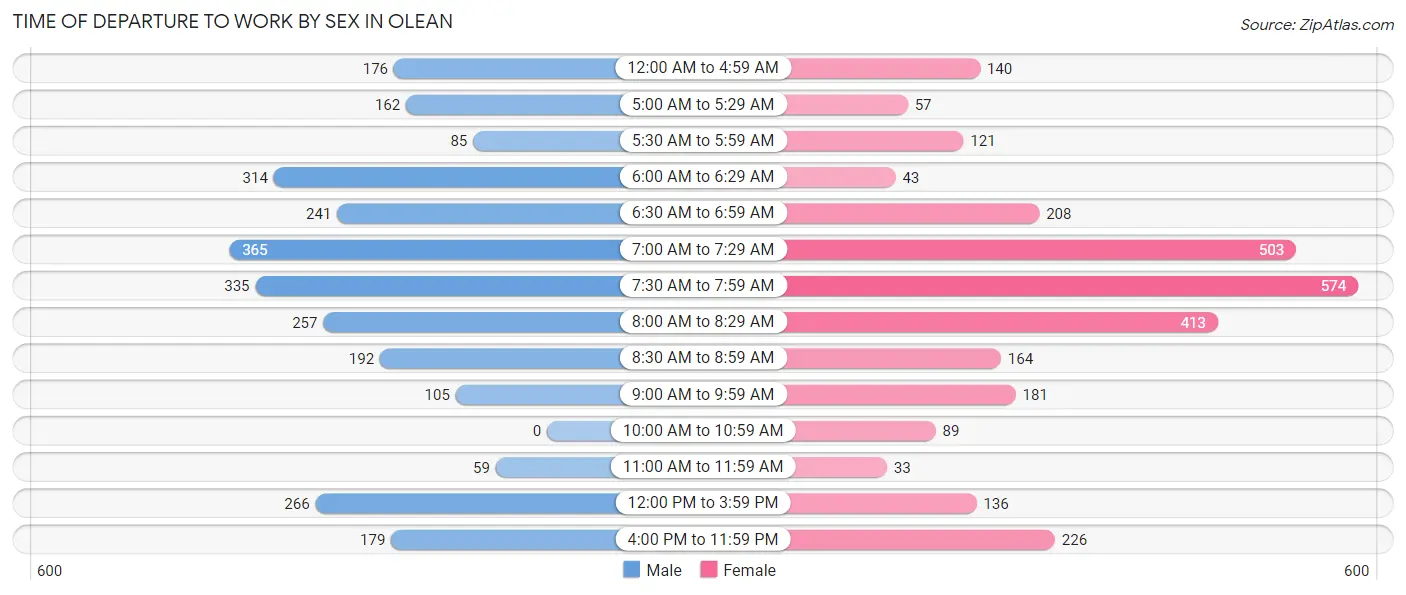
| Time of Departure | Male | Female |
| 12:00 AM to 4:59 AM | 176 (6.4%) | 140 (4.9%) |
| 5:00 AM to 5:29 AM | 162 (5.9%) | 57 (2.0%) |
| 5:30 AM to 5:59 AM | 85 (3.1%) | 121 (4.2%) |
| 6:00 AM to 6:29 AM | 314 (11.5%) | 43 (1.5%) |
| 6:30 AM to 6:59 AM | 241 (8.8%) | 208 (7.2%) |
| 7:00 AM to 7:29 AM | 365 (13.3%) | 503 (17.4%) |
| 7:30 AM to 7:59 AM | 335 (12.2%) | 574 (19.9%) |
| 8:00 AM to 8:29 AM | 257 (9.4%) | 413 (14.3%) |
| 8:30 AM to 8:59 AM | 192 (7.0%) | 164 (5.7%) |
| 9:00 AM to 9:59 AM | 105 (3.8%) | 181 (6.3%) |
| 10:00 AM to 10:59 AM | 0 (0.0%) | 89 (3.1%) |
| 11:00 AM to 11:59 AM | 59 (2.2%) | 33 (1.1%) |
| 12:00 PM to 3:59 PM | 266 (9.7%) | 136 (4.7%) |
| 4:00 PM to 11:59 PM | 179 (6.5%) | 226 (7.8%) |
| Total | 2,736 (100.0%) | 2,888 (100.0%) |
Housing Occupancy in Olean
Occupancy by Ownership in Olean
Of the total 6,142 dwellings in Olean, owner-occupied units account for 3,317 (54.0%), while renter-occupied units make up 2,825 (46.0%).
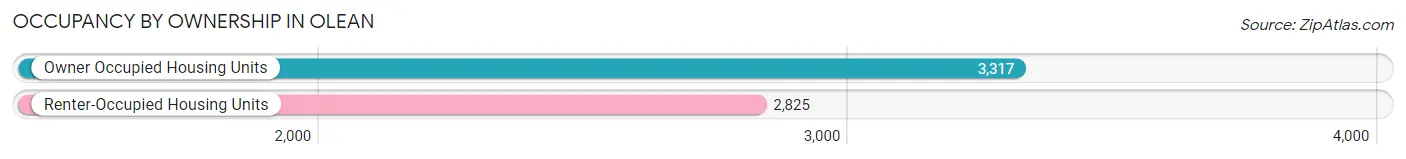
| Occupancy | # Housing Units | % Housing Units |
| Owner Occupied Housing Units | 3,317 | 54.0% |
| Renter-Occupied Housing Units | 2,825 | 46.0% |
| Total Occupied Housing Units | 6,142 | 100.0% |
Occupancy by Household Size in Olean
| Household Size | # Housing Units | % Housing Units |
| 1-Person Household | 2,543 | 41.4% |
| 2-Person Household | 1,537 | 25.0% |
| 3-Person Household | 782 | 12.7% |
| 4+ Person Household | 1,280 | 20.8% |
| Total Housing Units | 6,142 | 100.0% |
Occupancy by Ownership by Household Size in Olean
| Household Size | Owner-occupied | Renter-occupied |
| 1-Person Household | 1,174 (46.2%) | 1,369 (53.8%) |
| 2-Person Household | 990 (64.4%) | 547 (35.6%) |
| 3-Person Household | 413 (52.8%) | 369 (47.2%) |
| 4+ Person Household | 740 (57.8%) | 540 (42.2%) |
| Total Housing Units | 3,317 (54.0%) | 2,825 (46.0%) |
Occupancy by Educational Attainment in Olean
| Household Size | Owner-occupied | Renter-occupied |
| Less than High School | 89 (15.5%) | 485 (84.5%) |
| High School Diploma | 991 (44.8%) | 1,219 (55.2%) |
| College/Associate Degree | 920 (54.9%) | 757 (45.1%) |
| Bachelor's Degree or higher | 1,317 (78.3%) | 364 (21.6%) |
Occupancy by Age of Householder in Olean
| Age Bracket | # Households | % Households |
| Under 35 Years | 1,229 | 20.0% |
| 35 to 44 Years | 1,053 | 17.1% |
| 45 to 54 Years | 1,107 | 18.0% |
| 55 to 64 Years | 1,166 | 19.0% |
| 65 to 74 Years | 971 | 15.8% |
| 75 to 84 Years | 457 | 7.4% |
| 85 Years and Over | 159 | 2.6% |
| Total | 6,142 | 100.0% |
Housing Finances in Olean
Median Income by Occupancy in Olean
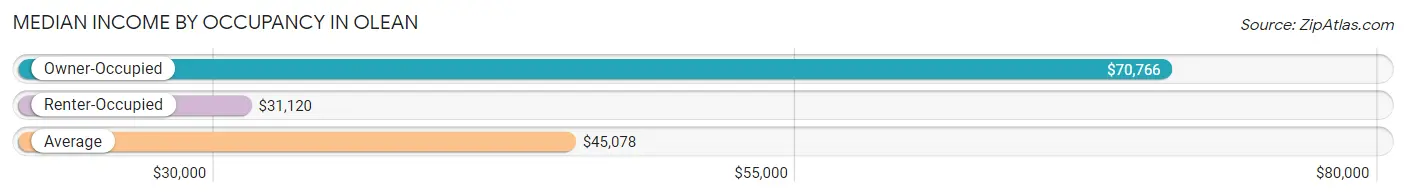
| Occupancy Type | # Households | Median Income |
| Owner-Occupied | 3,317 (54.0%) | $70,766 |
| Renter-Occupied | 2,825 (46.0%) | $31,120 |
| Average | 6,142 (100.0%) | $45,078 |
Occupancy by Householder Income Bracket in Olean
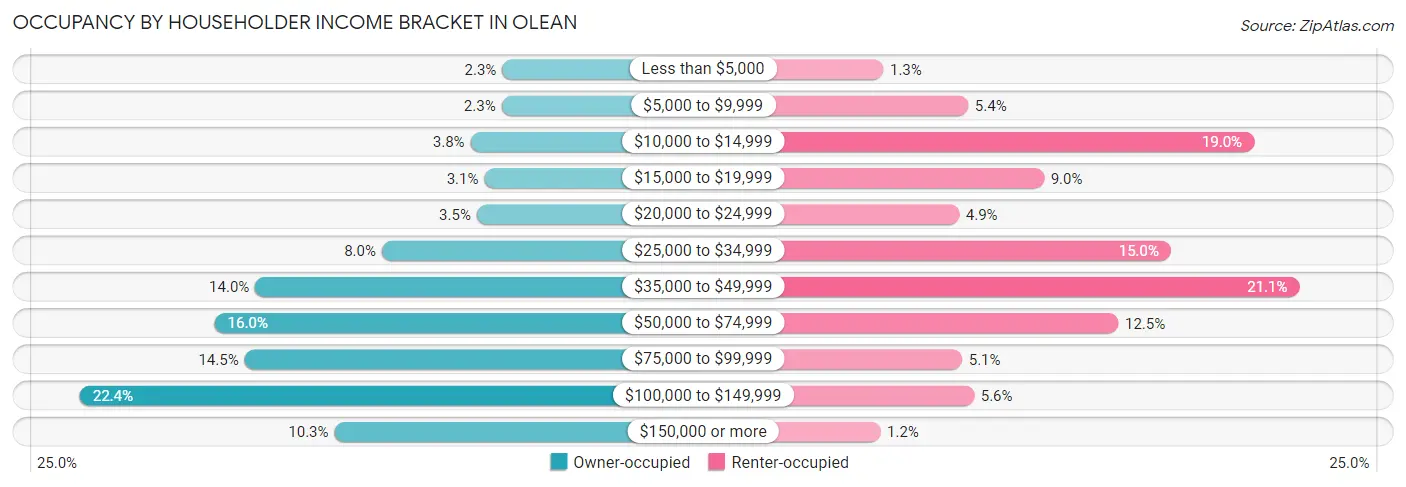
| Income Bracket | Owner-occupied | Renter-occupied |
| Less than $5,000 | 75 (2.3%) | 37 (1.3%) |
| $5,000 to $9,999 | 76 (2.3%) | 151 (5.3%) |
| $10,000 to $14,999 | 125 (3.8%) | 536 (19.0%) |
| $15,000 to $19,999 | 103 (3.1%) | 253 (9.0%) |
| $20,000 to $24,999 | 115 (3.5%) | 139 (4.9%) |
| $25,000 to $34,999 | 265 (8.0%) | 424 (15.0%) |
| $35,000 to $49,999 | 465 (14.0%) | 597 (21.1%) |
| $50,000 to $74,999 | 529 (16.0%) | 353 (12.5%) |
| $75,000 to $99,999 | 482 (14.5%) | 143 (5.1%) |
| $100,000 to $149,999 | 742 (22.4%) | 159 (5.6%) |
| $150,000 or more | 340 (10.2%) | 33 (1.2%) |
| Total | 3,317 (100.0%) | 2,825 (100.0%) |
Monthly Housing Cost Tiers in Olean
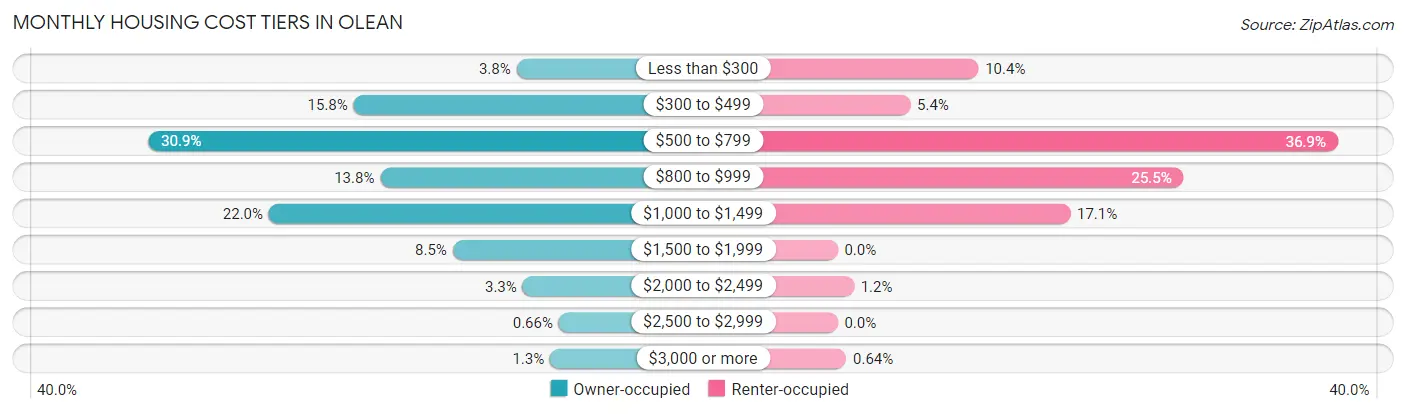
| Monthly Cost | Owner-occupied | Renter-occupied |
| Less than $300 | 125 (3.8%) | 293 (10.4%) |
| $300 to $499 | 523 (15.8%) | 151 (5.3%) |
| $500 to $799 | 1,025 (30.9%) | 1,041 (36.8%) |
| $800 to $999 | 458 (13.8%) | 720 (25.5%) |
| $1,000 to $1,499 | 730 (22.0%) | 484 (17.1%) |
| $1,500 to $1,999 | 281 (8.5%) | 0 (0.0%) |
| $2,000 to $2,499 | 110 (3.3%) | 34 (1.2%) |
| $2,500 to $2,999 | 22 (0.7%) | 0 (0.0%) |
| $3,000 or more | 43 (1.3%) | 18 (0.6%) |
| Total | 3,317 (100.0%) | 2,825 (100.0%) |
Physical Housing Characteristics in Olean
Housing Structures in Olean
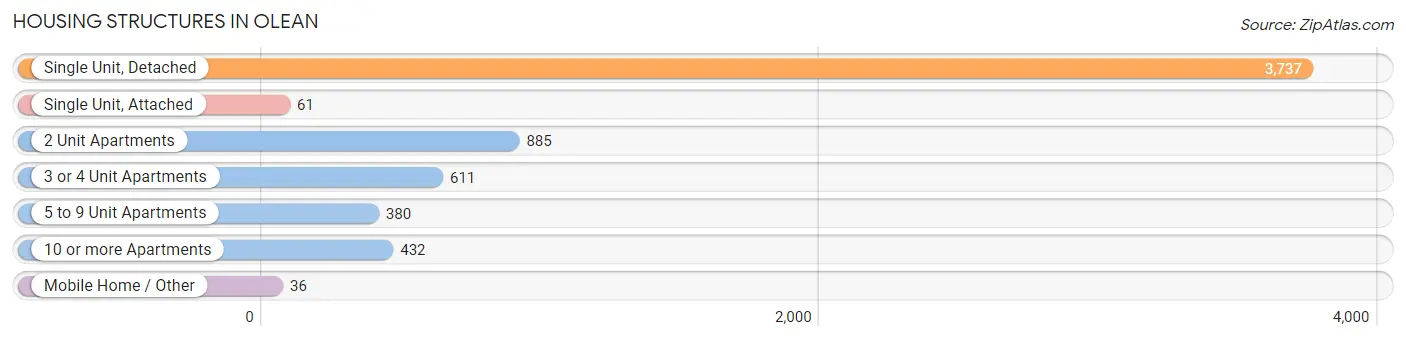
| Structure Type | # Housing Units | % Housing Units |
| Single Unit, Detached | 3,737 | 60.8% |
| Single Unit, Attached | 61 | 1.0% |
| 2 Unit Apartments | 885 | 14.4% |
| 3 or 4 Unit Apartments | 611 | 10.0% |
| 5 to 9 Unit Apartments | 380 | 6.2% |
| 10 or more Apartments | 432 | 7.0% |
| Mobile Home / Other | 36 | 0.6% |
| Total | 6,142 | 100.0% |
Housing Structures by Occupancy in Olean
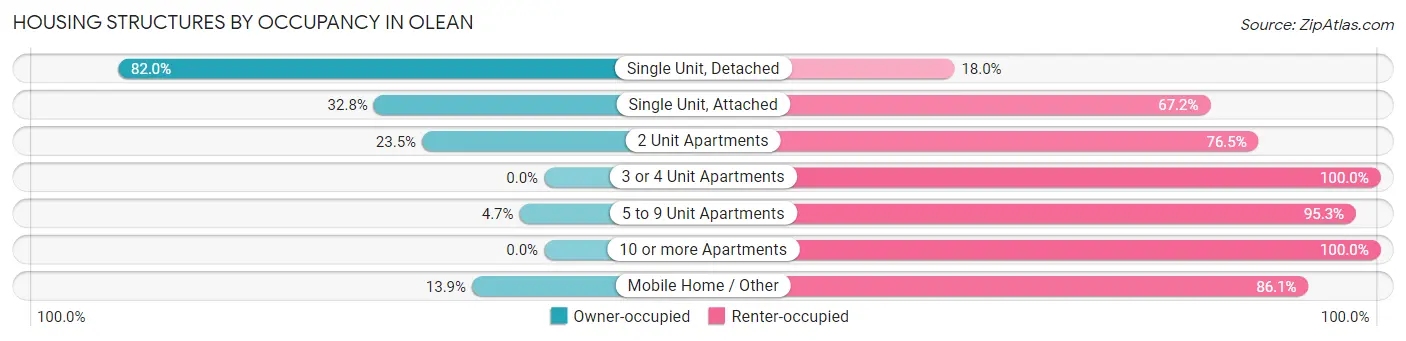
| Structure Type | Owner-occupied | Renter-occupied |
| Single Unit, Detached | 3,066 (82.0%) | 671 (18.0%) |
| Single Unit, Attached | 20 (32.8%) | 41 (67.2%) |
| 2 Unit Apartments | 208 (23.5%) | 677 (76.5%) |
| 3 or 4 Unit Apartments | 0 (0.0%) | 611 (100.0%) |
| 5 to 9 Unit Apartments | 18 (4.7%) | 362 (95.3%) |
| 10 or more Apartments | 0 (0.0%) | 432 (100.0%) |
| Mobile Home / Other | 5 (13.9%) | 31 (86.1%) |
| Total | 3,317 (54.0%) | 2,825 (46.0%) |
Housing Structures by Number of Rooms in Olean
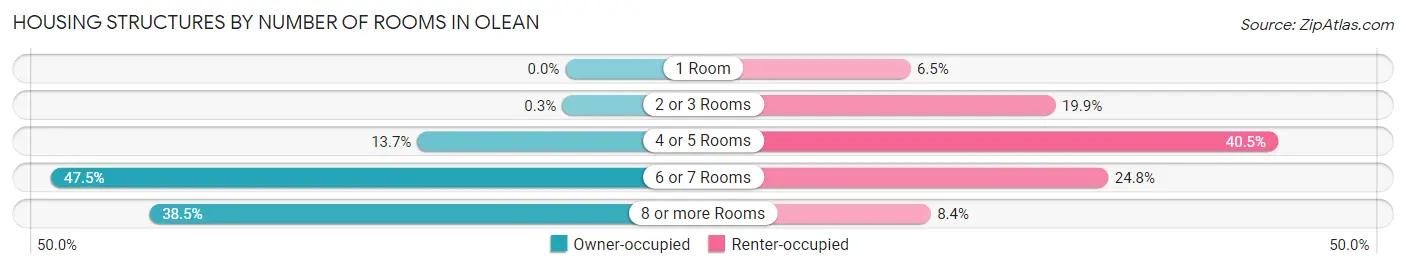
| Number of Rooms | Owner-occupied | Renter-occupied |
| 1 Room | 0 (0.0%) | 183 (6.5%) |
| 2 or 3 Rooms | 10 (0.3%) | 562 (19.9%) |
| 4 or 5 Rooms | 454 (13.7%) | 1,144 (40.5%) |
| 6 or 7 Rooms | 1,577 (47.5%) | 700 (24.8%) |
| 8 or more Rooms | 1,276 (38.5%) | 236 (8.4%) |
| Total | 3,317 (100.0%) | 2,825 (100.0%) |
Housing Structure by Heating Type in Olean
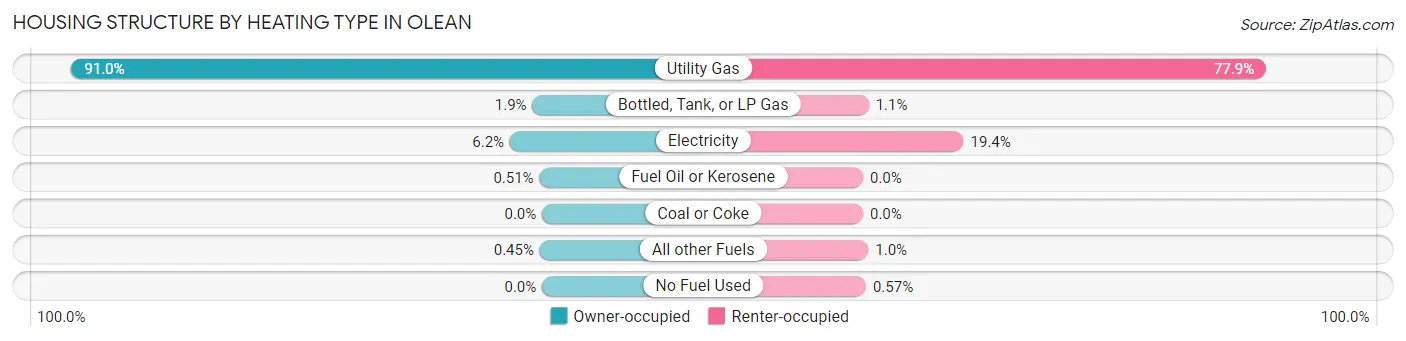
| Heating Type | Owner-occupied | Renter-occupied |
| Utility Gas | 3,017 (91.0%) | 2,200 (77.9%) |
| Bottled, Tank, or LP Gas | 62 (1.9%) | 31 (1.1%) |
| Electricity | 206 (6.2%) | 549 (19.4%) |
| Fuel Oil or Kerosene | 17 (0.5%) | 0 (0.0%) |
| Coal or Coke | 0 (0.0%) | 0 (0.0%) |
| All other Fuels | 15 (0.4%) | 29 (1.0%) |
| No Fuel Used | 0 (0.0%) | 16 (0.6%) |
| Total | 3,317 (100.0%) | 2,825 (100.0%) |
Household Vehicle Usage in Olean
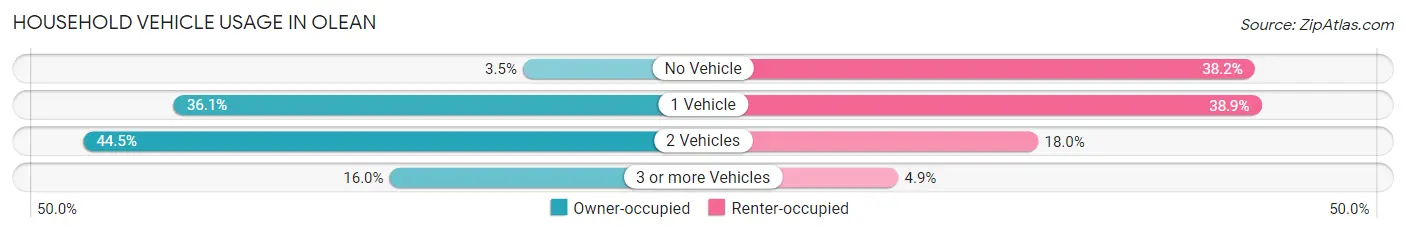
| Vehicles per Household | Owner-occupied | Renter-occupied |
| No Vehicle | 116 (3.5%) | 1,080 (38.2%) |
| 1 Vehicle | 1,196 (36.1%) | 1,098 (38.9%) |
| 2 Vehicles | 1,476 (44.5%) | 508 (18.0%) |
| 3 or more Vehicles | 529 (16.0%) | 139 (4.9%) |
| Total | 3,317 (100.0%) | 2,825 (100.0%) |
Real Estate & Mortgages in Olean
Real Estate and Mortgage Overview in Olean
| Characteristic | Without Mortgage | With Mortgage |
| Housing Units | 1,650 | 1,667 |
| Median Property Value | $81,800 | $93,800 |
| Median Household Income | $59,107 | $249 |
| Monthly Housing Costs | $582 | $43 |
| Real Estate Taxes | $2,913 | $27 |
Property Value by Mortgage Status in Olean
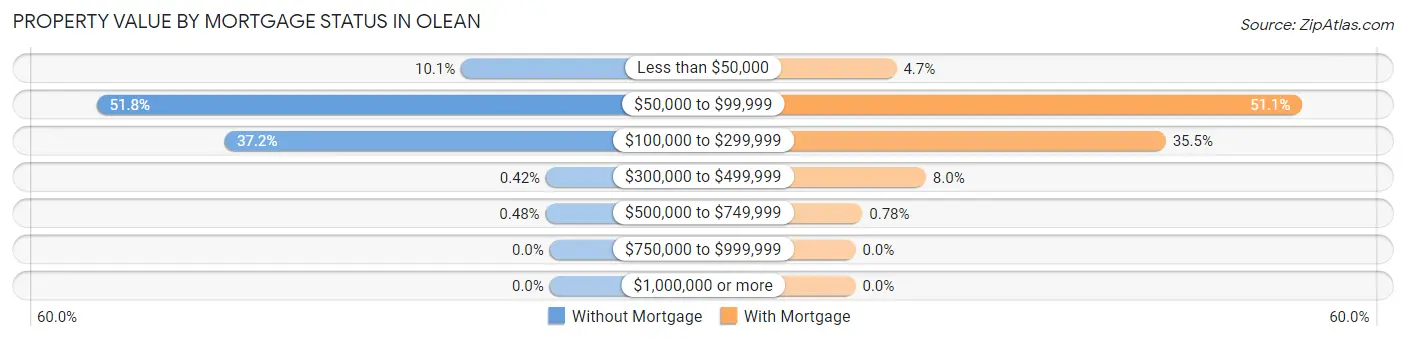
| Property Value | Without Mortgage | With Mortgage |
| Less than $50,000 | 167 (10.1%) | 78 (4.7%) |
| $50,000 to $99,999 | 854 (51.8%) | 851 (51.0%) |
| $100,000 to $299,999 | 614 (37.2%) | 591 (35.4%) |
| $300,000 to $499,999 | 7 (0.4%) | 134 (8.0%) |
| $500,000 to $749,999 | 8 (0.5%) | 13 (0.8%) |
| $750,000 to $999,999 | 0 (0.0%) | 0 (0.0%) |
| $1,000,000 or more | 0 (0.0%) | 0 (0.0%) |
| Total | 1,650 (100.0%) | 1,667 (100.0%) |
Household Income by Mortgage Status in Olean
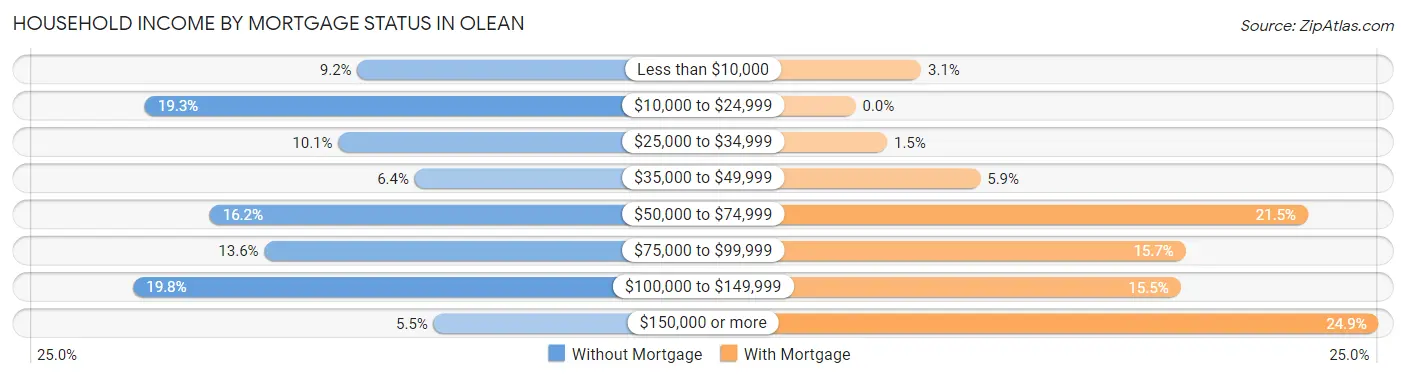
| Household Income | Without Mortgage | With Mortgage |
| Less than $10,000 | 151 (9.1%) | 52 (3.1%) |
| $10,000 to $24,999 | 318 (19.3%) | 0 (0.0%) |
| $25,000 to $34,999 | 166 (10.1%) | 25 (1.5%) |
| $35,000 to $49,999 | 106 (6.4%) | 99 (5.9%) |
| $50,000 to $74,999 | 267 (16.2%) | 359 (21.5%) |
| $75,000 to $99,999 | 224 (13.6%) | 262 (15.7%) |
| $100,000 to $149,999 | 327 (19.8%) | 258 (15.5%) |
| $150,000 or more | 91 (5.5%) | 415 (24.9%) |
| Total | 1,650 (100.0%) | 1,667 (100.0%) |
Property Value to Household Income Ratio in Olean
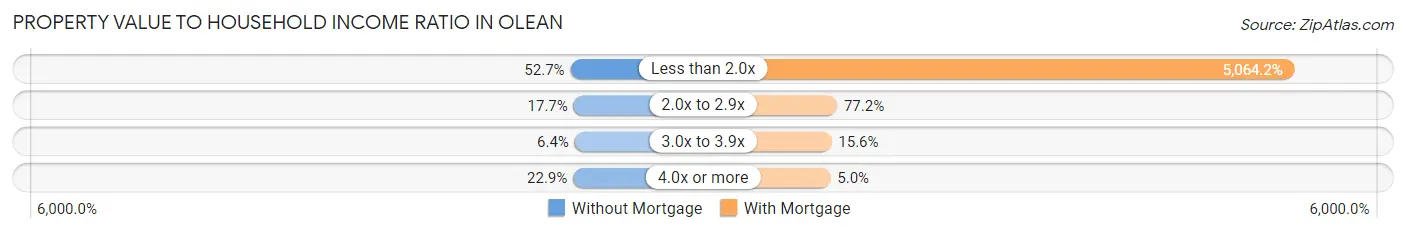
| Value-to-Income Ratio | Without Mortgage | With Mortgage |
| Less than 2.0x | 869 (52.7%) | 84,420 (5,064.2%) |
| 2.0x to 2.9x | 292 (17.7%) | 1,287 (77.2%) |
| 3.0x to 3.9x | 105 (6.4%) | 260 (15.6%) |
| 4.0x or more | 377 (22.9%) | 83 (5.0%) |
| Total | 1,650 (100.0%) | 1,667 (100.0%) |
Real Estate Taxes by Mortgage Status in Olean
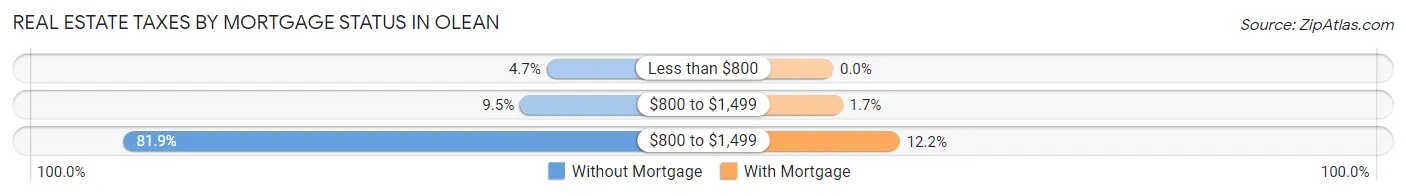
| Property Taxes | Without Mortgage | With Mortgage |
| Less than $800 | 77 (4.7%) | 0 (0.0%) |
| $800 to $1,499 | 157 (9.5%) | 29 (1.7%) |
| $800 to $1,499 | 1,352 (81.9%) | 203 (12.2%) |
| Total | 1,650 (100.0%) | 1,667 (100.0%) |
Health & Disability in Olean
Health Insurance Coverage by Age in Olean
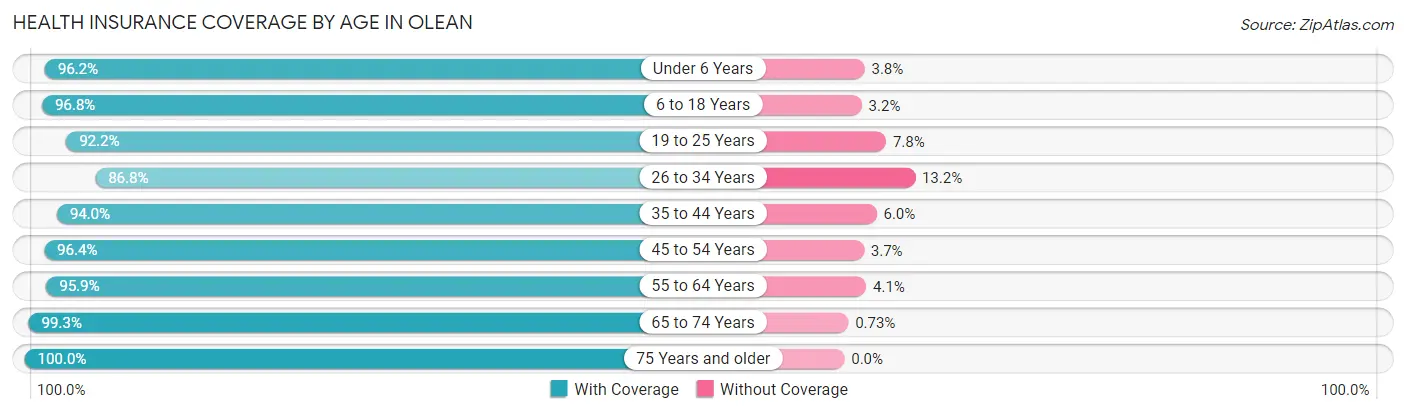
| Age Bracket | With Coverage | Without Coverage |
| Under 6 Years | 1,095 (96.2%) | 43 (3.8%) |
| 6 to 18 Years | 2,213 (96.8%) | 74 (3.2%) |
| 19 to 25 Years | 1,032 (92.2%) | 87 (7.8%) |
| 26 to 34 Years | 1,443 (86.8%) | 219 (13.2%) |
| 35 to 44 Years | 1,767 (94.0%) | 113 (6.0%) |
| 45 to 54 Years | 1,504 (96.4%) | 57 (3.6%) |
| 55 to 64 Years | 1,678 (95.9%) | 71 (4.1%) |
| 65 to 74 Years | 1,504 (99.3%) | 11 (0.7%) |
| 75 Years and older | 816 (100.0%) | 0 (0.0%) |
| Total | 13,052 (95.1%) | 675 (4.9%) |
Health Insurance Coverage by Citizenship Status in Olean
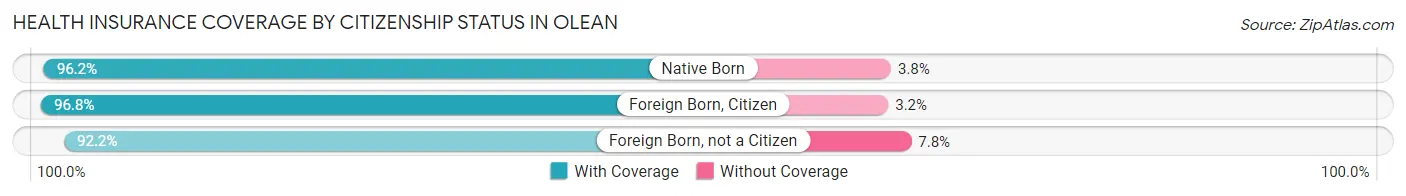
| Citizenship Status | With Coverage | Without Coverage |
| Native Born | 1,095 (96.2%) | 43 (3.8%) |
| Foreign Born, Citizen | 2,213 (96.8%) | 74 (3.2%) |
| Foreign Born, not a Citizen | 1,032 (92.2%) | 87 (7.8%) |
Health Insurance Coverage by Household Income in Olean
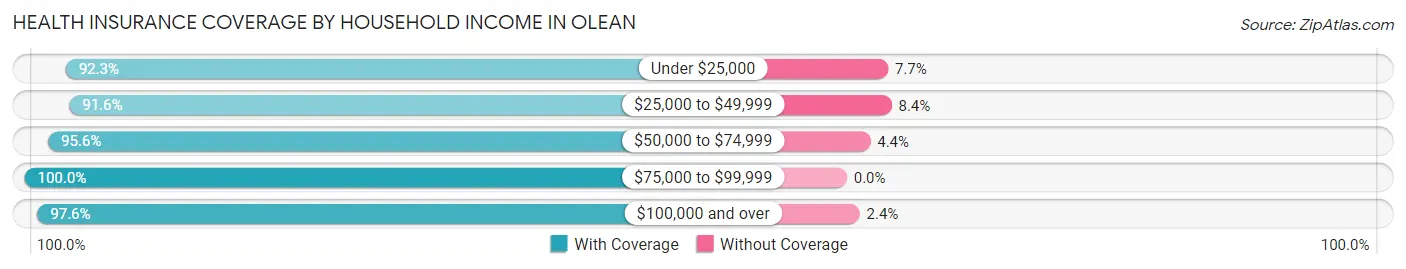
| Household Income | With Coverage | Without Coverage |
| Under $25,000 | 2,369 (92.3%) | 198 (7.7%) |
| $25,000 to $49,999 | 3,301 (91.6%) | 302 (8.4%) |
| $50,000 to $74,999 | 1,847 (95.6%) | 85 (4.4%) |
| $75,000 to $99,999 | 1,717 (100.0%) | 0 (0.0%) |
| $100,000 and over | 3,655 (97.6%) | 90 (2.4%) |
Public vs Private Health Insurance Coverage by Age in Olean
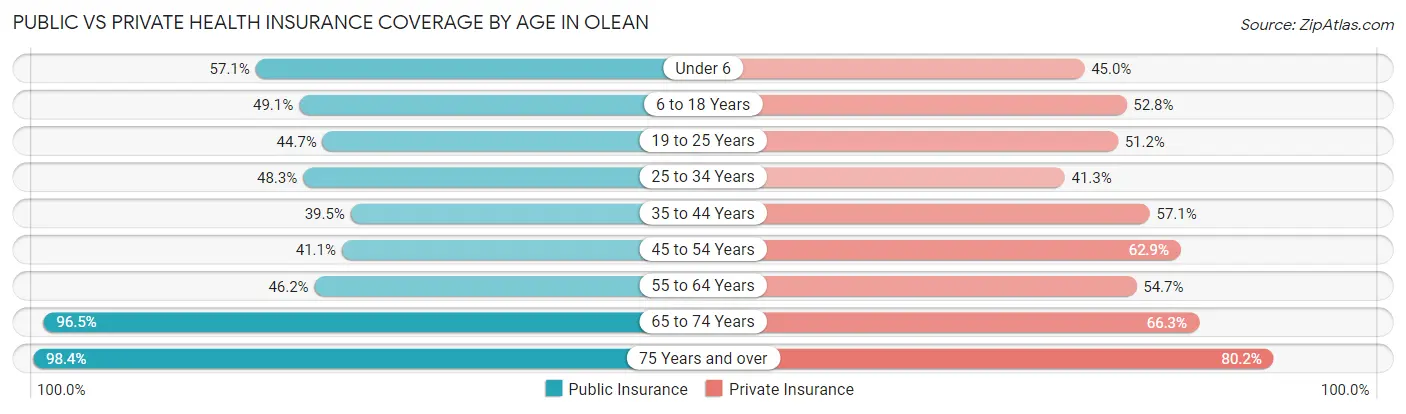
| Age Bracket | Public Insurance | Private Insurance |
| Under 6 | 650 (57.1%) | 512 (45.0%) |
| 6 to 18 Years | 1,122 (49.1%) | 1,208 (52.8%) |
| 19 to 25 Years | 500 (44.7%) | 573 (51.2%) |
| 25 to 34 Years | 803 (48.3%) | 687 (41.3%) |
| 35 to 44 Years | 742 (39.5%) | 1,074 (57.1%) |
| 45 to 54 Years | 642 (41.1%) | 982 (62.9%) |
| 55 to 64 Years | 808 (46.2%) | 956 (54.7%) |
| 65 to 74 Years | 1,462 (96.5%) | 1,004 (66.3%) |
| 75 Years and over | 803 (98.4%) | 654 (80.1%) |
| Total | 7,532 (54.9%) | 7,650 (55.7%) |
Disability Status by Sex by Age in Olean
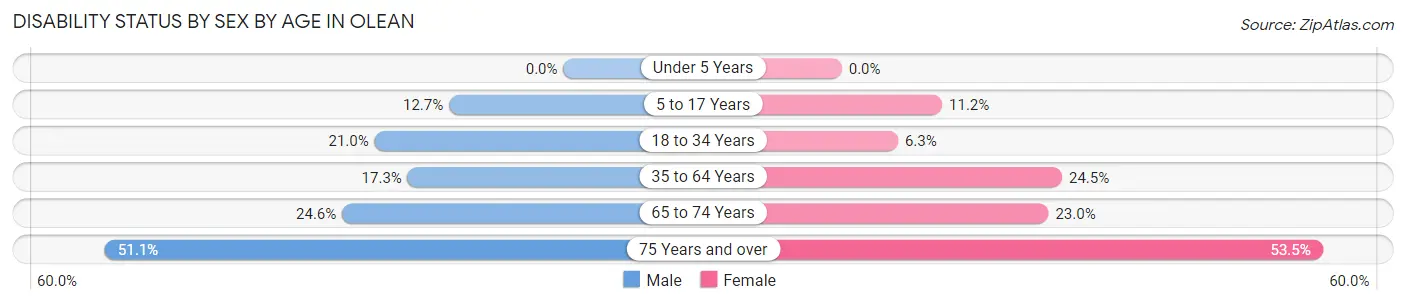
| Age Bracket | Male | Female |
| Under 5 Years | 0 (0.0%) | 0 (0.0%) |
| 5 to 17 Years | 183 (12.7%) | 114 (11.2%) |
| 18 to 34 Years | 274 (21.0%) | 100 (6.3%) |
| 35 to 64 Years | 470 (17.3%) | 608 (24.5%) |
| 65 to 74 Years | 156 (24.6%) | 203 (23.0%) |
| 75 Years and over | 121 (51.0%) | 310 (53.5%) |
Disability Class by Sex by Age in Olean
Disability Class: Hearing Difficulty
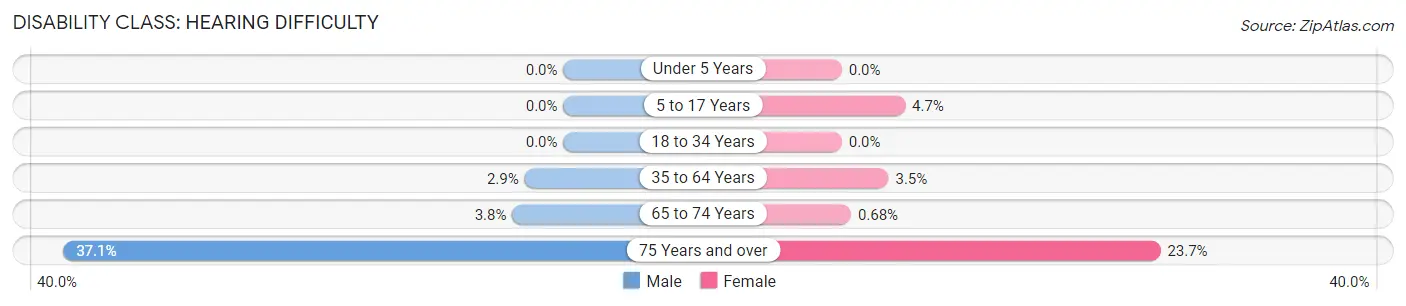
| Age Bracket | Male | Female |
| Under 5 Years | 0 (0.0%) | 0 (0.0%) |
| 5 to 17 Years | 0 (0.0%) | 48 (4.7%) |
| 18 to 34 Years | 0 (0.0%) | 0 (0.0%) |
| 35 to 64 Years | 78 (2.9%) | 86 (3.5%) |
| 65 to 74 Years | 24 (3.8%) | 6 (0.7%) |
| 75 Years and over | 88 (37.1%) | 137 (23.7%) |
Disability Class: Vision Difficulty
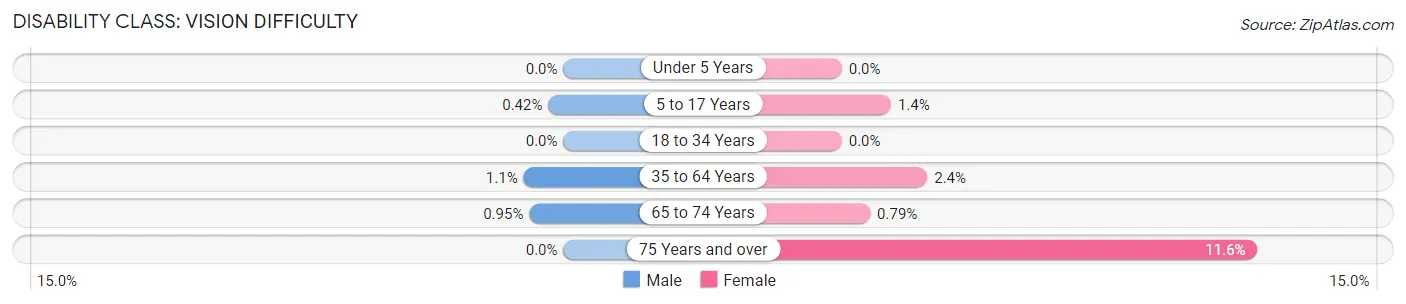
| Age Bracket | Male | Female |
| Under 5 Years | 0 (0.0%) | 0 (0.0%) |
| 5 to 17 Years | 6 (0.4%) | 14 (1.4%) |
| 18 to 34 Years | 0 (0.0%) | 0 (0.0%) |
| 35 to 64 Years | 30 (1.1%) | 59 (2.4%) |
| 65 to 74 Years | 6 (0.9%) | 7 (0.8%) |
| 75 Years and over | 0 (0.0%) | 67 (11.6%) |
Disability Class: Cognitive Difficulty
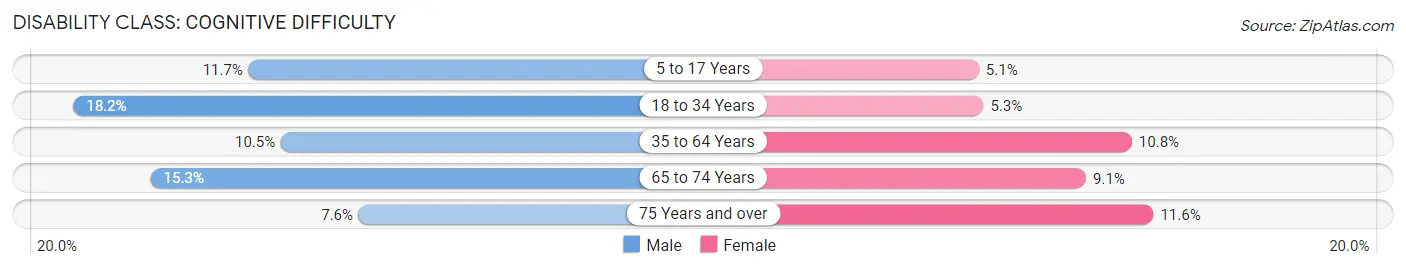
| Age Bracket | Male | Female |
| 5 to 17 Years | 168 (11.7%) | 52 (5.1%) |
| 18 to 34 Years | 237 (18.2%) | 84 (5.3%) |
| 35 to 64 Years | 284 (10.5%) | 267 (10.8%) |
| 65 to 74 Years | 97 (15.3%) | 80 (9.1%) |
| 75 Years and over | 18 (7.6%) | 67 (11.6%) |
Disability Class: Ambulatory Difficulty
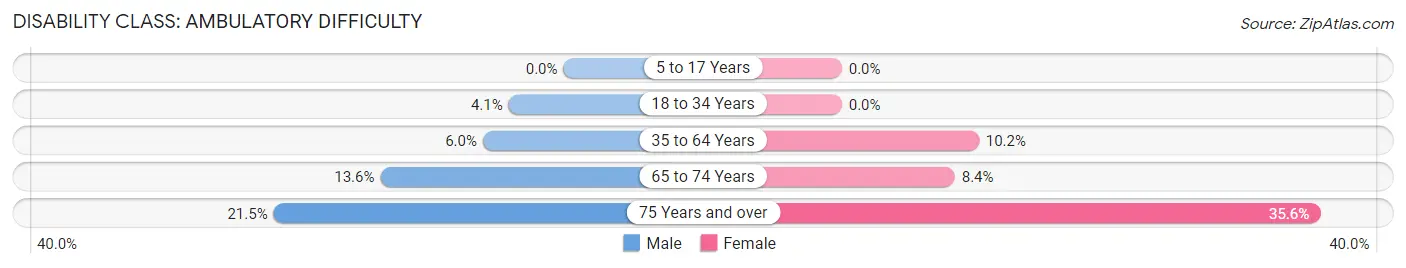
| Age Bracket | Male | Female |
| 5 to 17 Years | 0 (0.0%) | 0 (0.0%) |
| 18 to 34 Years | 53 (4.1%) | 0 (0.0%) |
| 35 to 64 Years | 162 (6.0%) | 252 (10.2%) |
| 65 to 74 Years | 86 (13.6%) | 74 (8.4%) |
| 75 Years and over | 51 (21.5%) | 206 (35.6%) |
Disability Class: Self-Care Difficulty
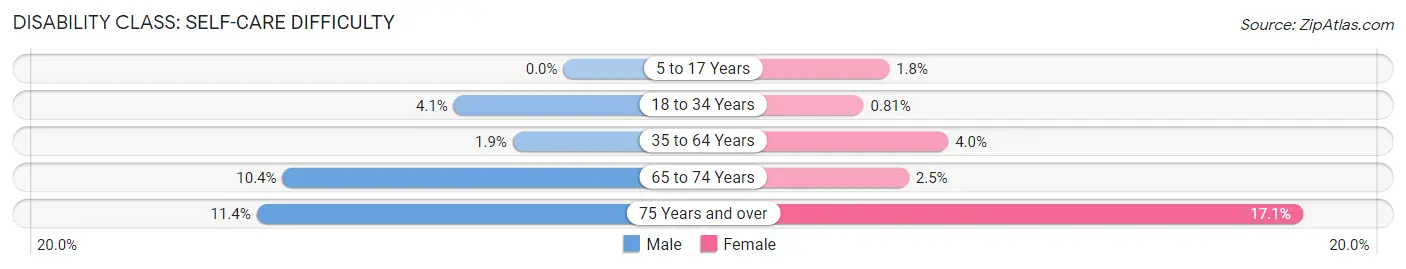
| Age Bracket | Male | Female |
| 5 to 17 Years | 0 (0.0%) | 18 (1.8%) |
| 18 to 34 Years | 53 (4.1%) | 13 (0.8%) |
| 35 to 64 Years | 51 (1.9%) | 98 (4.0%) |
| 65 to 74 Years | 66 (10.4%) | 22 (2.5%) |
| 75 Years and over | 27 (11.4%) | 99 (17.1%) |
Technology Access in Olean
Computing Device Access in Olean
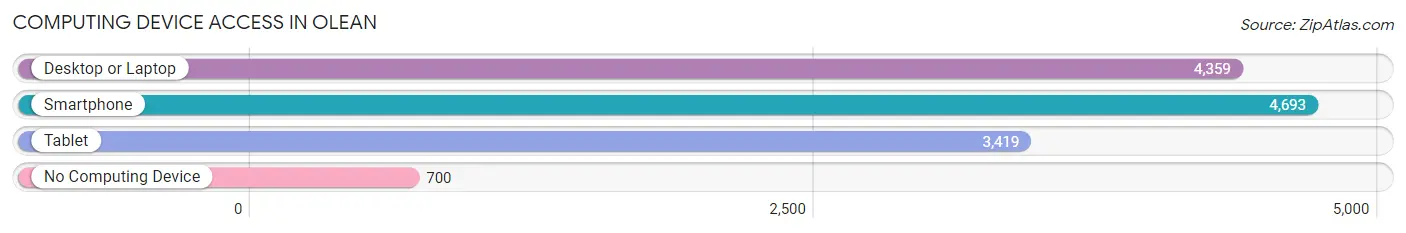
| Device Type | # Households | % Households |
| Desktop or Laptop | 4,359 | 71.0% |
| Smartphone | 4,693 | 76.4% |
| Tablet | 3,419 | 55.7% |
| No Computing Device | 700 | 11.4% |
| Total | 6,142 | 100.0% |
Internet Access in Olean
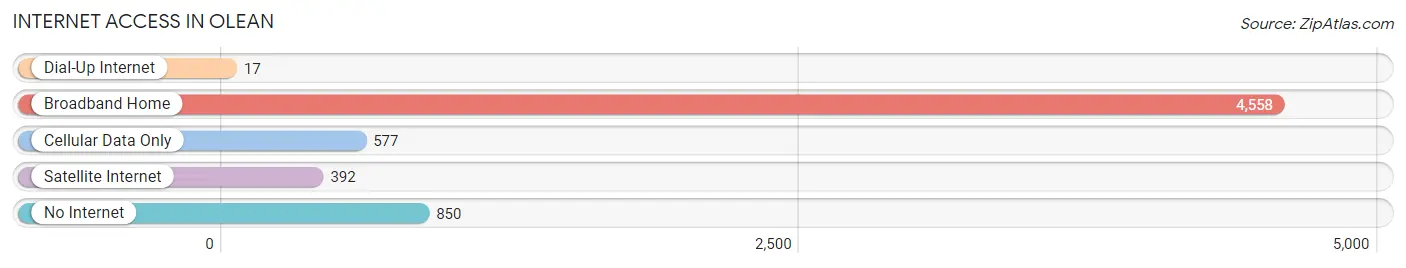
| Internet Type | # Households | % Households |
| Dial-Up Internet | 17 | 0.3% |
| Broadband Home | 4,558 | 74.2% |
| Cellular Data Only | 577 | 9.4% |
| Satellite Internet | 392 | 6.4% |
| No Internet | 850 | 13.8% |
| Total | 6,142 | 100.0% |
Olean Summary
Olean is a city located in Cattaraugus County, New York, United States. It is the largest city in the county and the principal city of the Olean Metropolitan Statistical Area. As of the 2010 census, the city had a population of 14,739.
History
The area around Olean was first settled in 1765 by pioneers from Connecticut. The first settlers were the families of William and Charles Hart, who were followed by the families of John and William Hollenback. The area was known as the "Twelve Towns of Olean" and was part of the Holland Land Company's purchase of the area in 1797. The city was officially incorporated in 1808.
The city was named after the Olean Creek, which was named after the Native American word for "beautiful stream". The creek was a major source of power for the early settlers, and the city was an important stop on the Underground Railroad.
Geography
Olean is located in western New York, in the foothills of the Allegheny Mountains. It is situated on the Allegheny River, about 50 miles south of Buffalo and 60 miles north of Pittsburgh. The city is located in the Southern Tier region of New York, and is the largest city in Cattaraugus County.
The city has a total area of 8.2 square miles, of which 8.1 square miles is land and 0.1 square miles is water. The city is located in a hilly region, with elevations ranging from 1,000 to 1,500 feet above sea level.
Economy
Olean's economy is largely based on manufacturing and retail. The city is home to several large manufacturing companies, including Dresser-Rand, Olean Industries, and Olean Specialty Products. The city is also home to several retail stores, including Walmart, Target, and Lowe's.
The city is also home to several educational institutions, including St. Bonaventure University, Jamestown Community College, and the University of Pittsburgh at Bradford.
Demographics
As of the 2010 census, the city had a population of 14,739. The racial makeup of the city was 92.3% White, 4.2% African American, 0.3% Native American, 0.7% Asian, 0.1% Pacific Islander, 0.7% from other races, and 1.7% from two or more races. Hispanic or Latino of any race were 2.3% of the population.
The median income for a household in the city was $35,945, and the median income for a family was $45,945. The per capita income for the city was $19,945. About 14.3% of families and 18.3% of the population were below the poverty line, including 25.3% of those under age 18 and 8.3% of those age 65 or over.
Common Questions
What is the Total Population of Olean?
Total Population of Olean is 13,890.
What is the Total Male Population of Olean?
Total Male Population of Olean is 6,766.
What is the Total Female Population of Olean?
Total Female Population of Olean is 7,124.
What is the Ratio of Males per 100 Females in Olean?
There are 94.97 Males per 100 Females in Olean.
What is the Ratio of Females per 100 Males in Olean?
There are 105.29 Females per 100 Males in Olean.
What is the Median Population Age in Olean?
Median Population Age in Olean is 38.9 Years.
What is the Average Family Size in Olean
Average Family Size in Olean is 3.0 People.
What is the Average Household Size in Olean
Average Household Size in Olean is 2.2 People.
What is Per Capita Income in Olean?
Per Capita income in Olean is $28,551.
What is the Median Family Income in Olean?
Median Family Income in Olean is $58,387.
What is the Median Household income in Olean?
Median Household Income in Olean is $45,078.
What is Income or Wage Gap in Olean?
Income or Wage Gap in Olean is 28.8%.
Women in Olean earn 71.2 cents for every dollar earned by a man.
What is Family Income Deficit in Olean?
Family Income Deficit in Olean is $11,185.
Families that are below poverty line in Olean earn $11,185 less on average than the poverty threshold level.
What is Inequality or Gini Index in Olean?
Inequality or Gini Index in Olean is 0.46.
How Large is the Labor Force in Olean?
There are 6,524 People in the Labor Forcein in Olean.
What is the Percentage of People in the Labor Force in Olean?
59.8% of People are in the Labor Force in Olean.
What is the Unemployment Rate in Olean?
Unemployment Rate in Olean is 6.6%.