Knox, IN
Knox Map
Knox Overview
3,847
TOTAL POPULATION
1,794
MALE POPULATION
2,053
FEMALE POPULATION
87.38
MALES / 100 FEMALES
114.44
FEMALES / 100 MALES
40.4
MEDIAN AGE
3.3
AVG FAMILY SIZE
2.6
AVG HOUSEHOLD SIZE
$21,125
PER CAPITA INCOME
$55,938
AVG FAMILY INCOME
$47,967
AVG HOUSEHOLD INCOME
26.8%
WAGE / INCOME GAP [ % ]
73.2¢/ $1
WAGE / INCOME GAP [ $ ]
0.44
INEQUALITY / GINI INDEX
1,372
LABOR FORCE [ PEOPLE ]
47.3%
PERCENT IN LABOR FORCE
2.7%
UNEMPLOYMENT RATE
Knox Zip Codes
Knox Area Codes
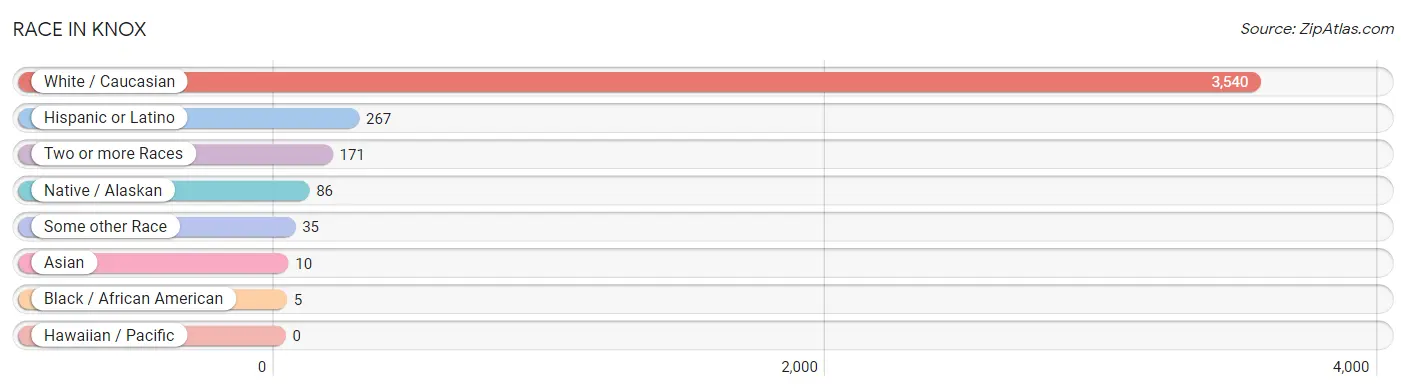
Race in Knox
The most populous races in Knox are White / Caucasian (3,540 | 92.0%), Hispanic or Latino (267 | 6.9%), and Two or more Races (171 | 4.4%).
| Race | # Population | % Population |
| Asian | 10 | 0.3% |
| Black / African American | 5 | 0.1% |
| Hawaiian / Pacific | 0 | 0.0% |
| Hispanic or Latino | 267 | 6.9% |
| Native / Alaskan | 86 | 2.2% |
| White / Caucasian | 3,540 | 92.0% |
| Two or more Races | 171 | 4.4% |
| Some other Race | 35 | 0.9% |
| Total | 3,847 | 100.0% |
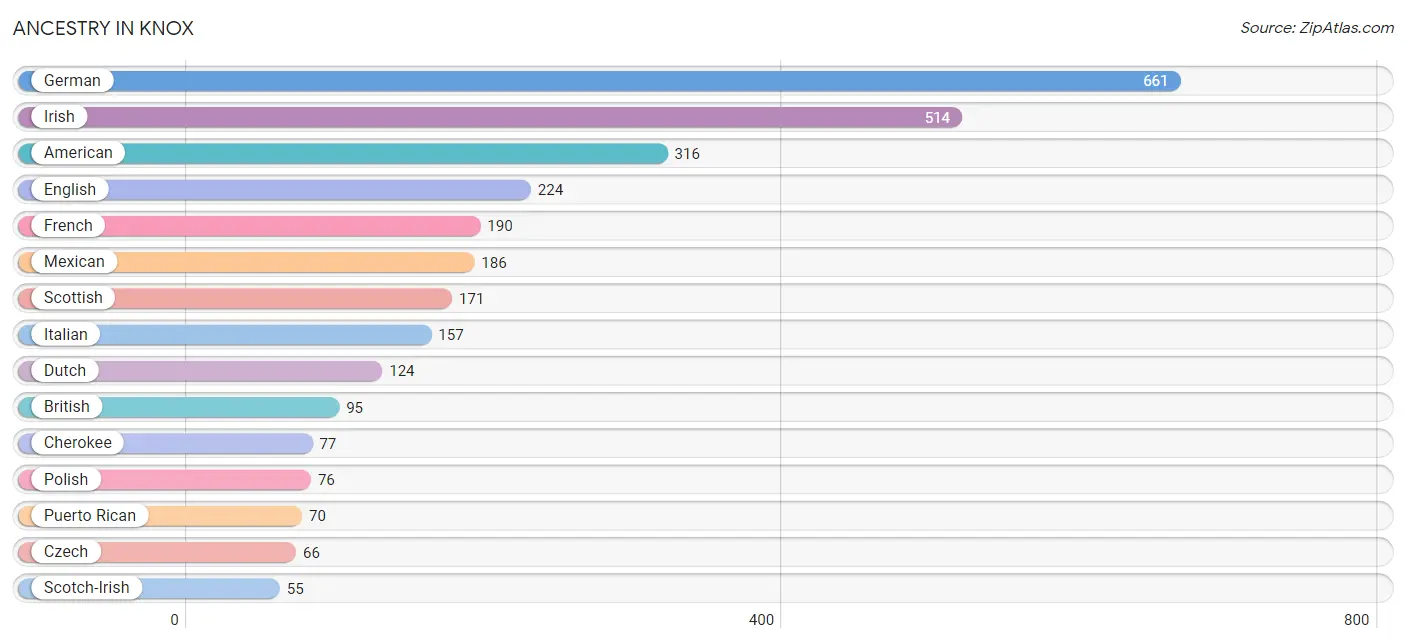
Ancestry in Knox
The most populous ancestries reported in Knox are German (661 | 17.2%), Irish (514 | 13.4%), American (316 | 8.2%), English (224 | 5.8%), and French (190 | 4.9%), together accounting for 49.5% of all Knox residents.
| Ancestry | # Population | % Population |
| American | 316 | 8.2% |
| Austrian | 8 | 0.2% |
| British | 95 | 2.5% |
| Burmese | 6 | 0.2% |
| Cherokee | 77 | 2.0% |
| Chippewa | 33 | 0.9% |
| Czech | 66 | 1.7% |
| Czechoslovakian | 9 | 0.2% |
| Danish | 32 | 0.8% |
| Dutch | 124 | 3.2% |
| Eastern European | 15 | 0.4% |
| English | 224 | 5.8% |
| French | 190 | 4.9% |
| German | 661 | 17.2% |
| Hungarian | 16 | 0.4% |
| Indian (Asian) | 10 | 0.3% |
| Irish | 514 | 13.4% |
| Italian | 157 | 4.1% |
| Lithuanian | 32 | 0.8% |
| Mexican | 186 | 4.8% |
| Norwegian | 24 | 0.6% |
| Polish | 76 | 2.0% |
| Puerto Rican | 70 | 1.8% |
| Romanian | 16 | 0.4% |
| Scotch-Irish | 55 | 1.4% |
| Scottish | 171 | 4.4% |
| Ukrainian | 9 | 0.2% |
| Welsh | 23 | 0.6% | View All 28 Rows |
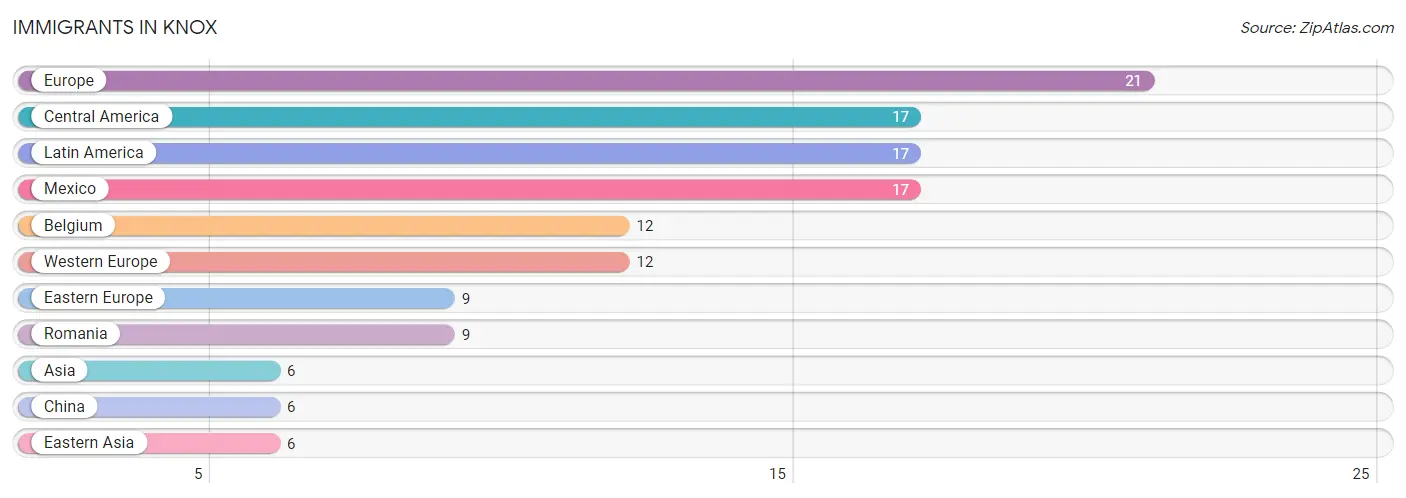
Immigrants in Knox
The most numerous immigrant groups reported in Knox came from Europe (21 | 0.5%), Central America (17 | 0.4%), Latin America (17 | 0.4%), Mexico (17 | 0.4%), and Belgium (12 | 0.3%), together accounting for 2.2% of all Knox residents.
| Immigration Origin | # Population | % Population |
| Asia | 6 | 0.2% |
| Belgium | 12 | 0.3% |
| Central America | 17 | 0.4% |
| China | 6 | 0.2% |
| Eastern Asia | 6 | 0.2% |
| Eastern Europe | 9 | 0.2% |
| Europe | 21 | 0.5% |
| Latin America | 17 | 0.4% |
| Mexico | 17 | 0.4% |
| Romania | 9 | 0.2% |
| Western Europe | 12 | 0.3% | View All 11 Rows |
Sex and Age in Knox
Sex and Age in Knox
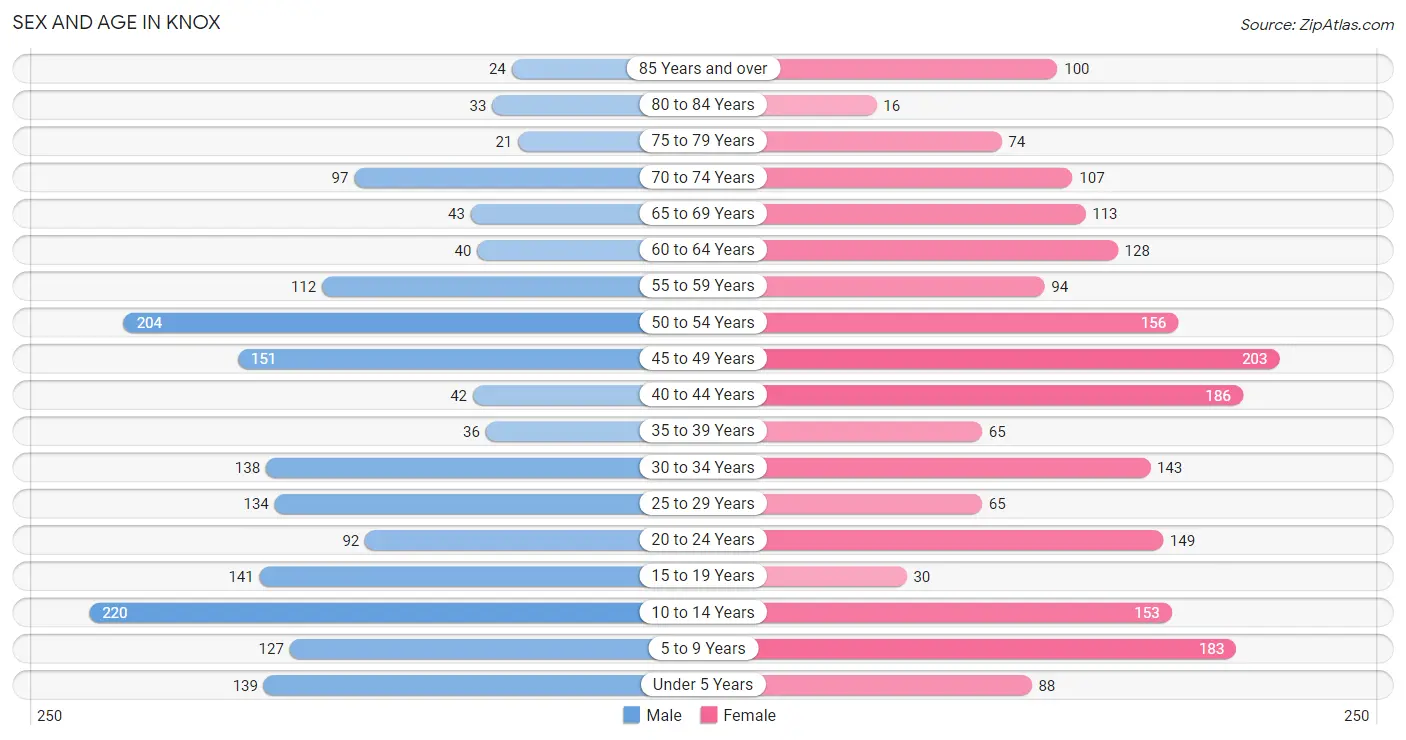
The most populous age groups in Knox are 10 to 14 Years (220 | 12.3%) for men and 45 to 49 Years (203 | 9.9%) for women.
| Age Bracket | Male | Female |
| Under 5 Years | 139 (7.7%) | 88 (4.3%) |
| 5 to 9 Years | 127 (7.1%) | 183 (8.9%) |
| 10 to 14 Years | 220 (12.3%) | 153 (7.4%) |
| 15 to 19 Years | 141 (7.9%) | 30 (1.5%) |
| 20 to 24 Years | 92 (5.1%) | 149 (7.3%) |
| 25 to 29 Years | 134 (7.5%) | 65 (3.2%) |
| 30 to 34 Years | 138 (7.7%) | 143 (7.0%) |
| 35 to 39 Years | 36 (2.0%) | 65 (3.2%) |
| 40 to 44 Years | 42 (2.3%) | 186 (9.1%) |
| 45 to 49 Years | 151 (8.4%) | 203 (9.9%) |
| 50 to 54 Years | 204 (11.4%) | 156 (7.6%) |
| 55 to 59 Years | 112 (6.2%) | 94 (4.6%) |
| 60 to 64 Years | 40 (2.2%) | 128 (6.2%) |
| 65 to 69 Years | 43 (2.4%) | 113 (5.5%) |
| 70 to 74 Years | 97 (5.4%) | 107 (5.2%) |
| 75 to 79 Years | 21 (1.2%) | 74 (3.6%) |
| 80 to 84 Years | 33 (1.8%) | 16 (0.8%) |
| 85 Years and over | 24 (1.3%) | 100 (4.9%) |
| Total | 1,794 (100.0%) | 2,053 (100.0%) |
Families and Households in Knox
Median Family Size in Knox
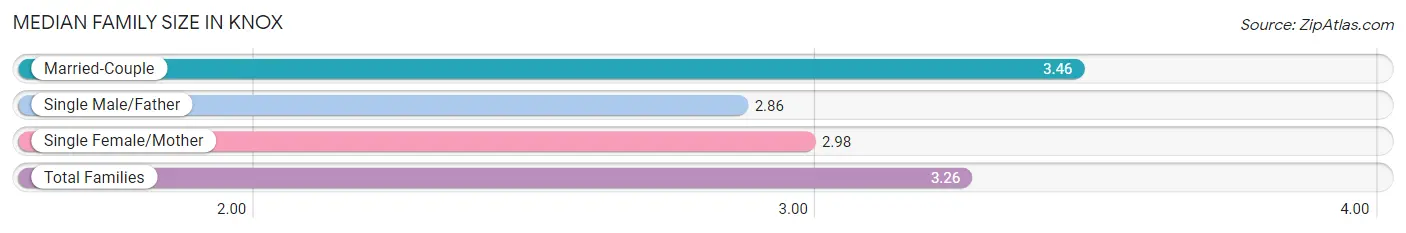
The median family size in Knox is 3.26 persons per family, with married-couple families (578 | 62.4%) accounting for the largest median family size of 3.46 persons per family. On the other hand, single male/father families (168 | 18.1%) represent the smallest median family size with 2.86 persons per family.
| Family Type | # Families | Family Size |
| Married-Couple | 578 (62.4%) | 3.46 |
| Single Male/Father | 168 (18.1%) | 2.86 |
| Single Female/Mother | 181 (19.5%) | 2.98 |
| Total Families | 927 (100.0%) | 3.26 |
Median Household Size in Knox
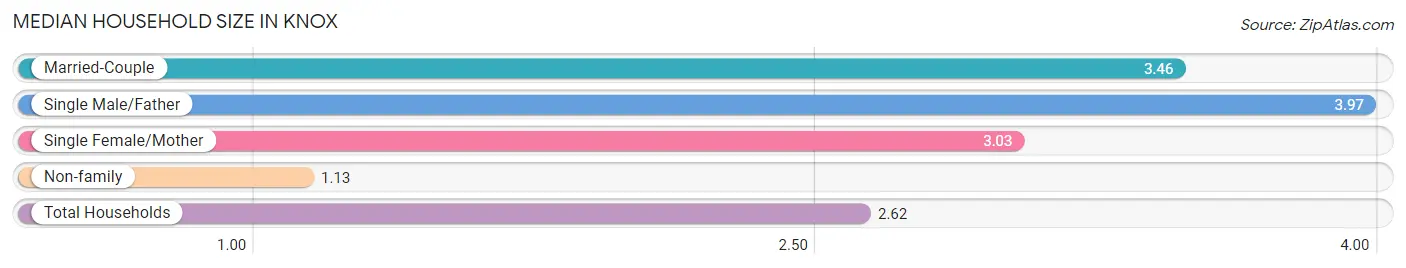
The median household size in Knox is 2.62 persons per household, with single male/father households (168 | 11.6%) accounting for the largest median household size of 3.97 persons per household. non-family households (527 | 36.2%) represent the smallest median household size with 1.13 persons per household.
| Household Type | # Households | Household Size |
| Married-Couple | 578 (39.8%) | 3.46 |
| Single Male/Father | 168 (11.6%) | 3.97 |
| Single Female/Mother | 181 (12.4%) | 3.03 |
| Non-family | 527 (36.2%) | 1.13 |
| Total Households | 1,454 (100.0%) | 2.62 |
Household Size by Marriage Status in Knox
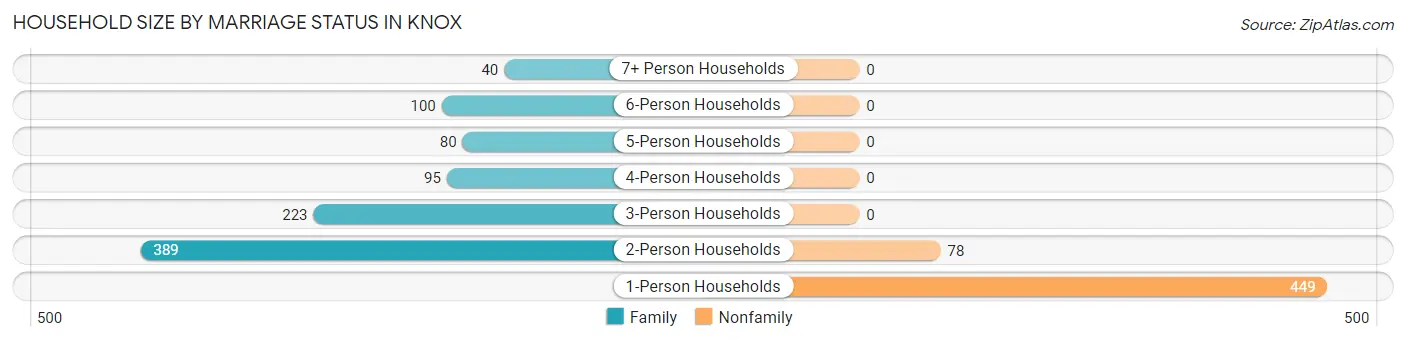
Out of a total of 1,454 households in Knox, 927 (63.8%) are family households, while 527 (36.2%) are nonfamily households. The most numerous type of family households are 2-person households, comprising 389, and the most common type of nonfamily households are 1-person households, comprising 449.
| Household Size | Family Households | Nonfamily Households |
| 1-Person Households | - | 449 (30.9%) |
| 2-Person Households | 389 (26.8%) | 78 (5.4%) |
| 3-Person Households | 223 (15.3%) | 0 (0.0%) |
| 4-Person Households | 95 (6.5%) | 0 (0.0%) |
| 5-Person Households | 80 (5.5%) | 0 (0.0%) |
| 6-Person Households | 100 (6.9%) | 0 (0.0%) |
| 7+ Person Households | 40 (2.8%) | 0 (0.0%) |
| Total | 927 (63.8%) | 527 (36.2%) |
Female Fertility in Knox
Fertility by Age in Knox
Average fertility rate in Knox is 14.0 births per 1,000 women. Women in the age bracket of 20 to 34 years have the highest fertility rate with 34.0 births per 1,000 women. Women in the age bracket of 20 to 34 years acount for 100.0% of all women with births.
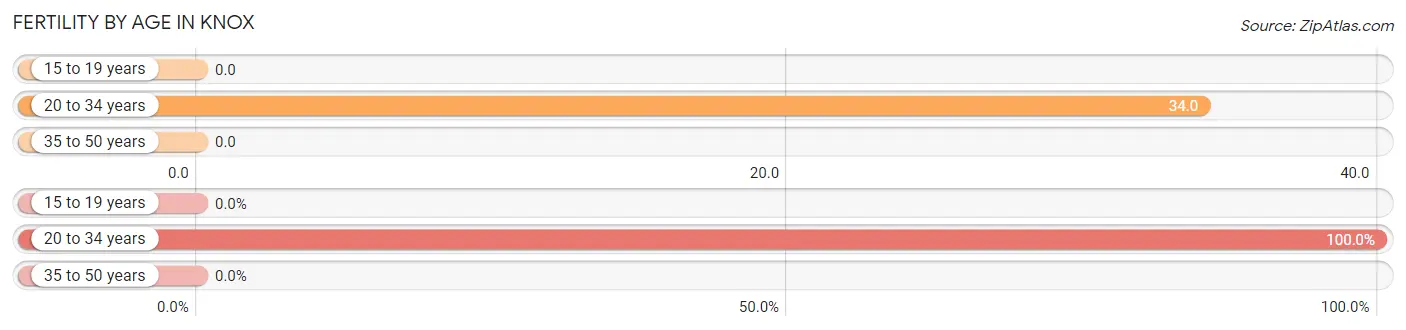
| Age Bracket | Women with Births | Births / 1,000 Women |
| 15 to 19 years | 0 (0.0%) | 0.0 |
| 20 to 34 years | 12 (100.0%) | 34.0 |
| 35 to 50 years | 0 (0.0%) | 0.0 |
| Total | 12 (100.0%) | 14.0 |
Fertility by Age by Marriage Status in Knox
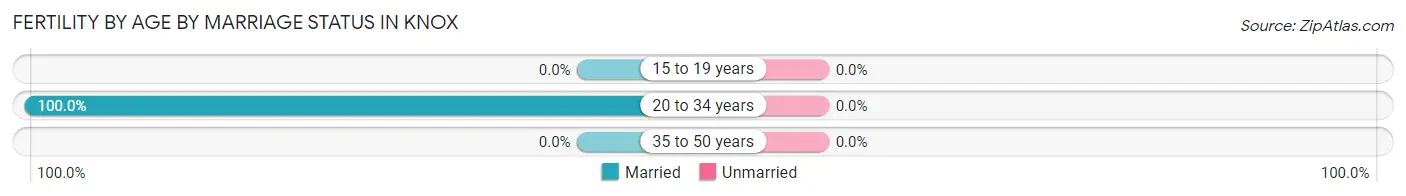
| Age Bracket | Married | Unmarried |
| 15 to 19 years | 0 (0.0%) | 0 (0.0%) |
| 20 to 34 years | 12 (100.0%) | 0 (0.0%) |
| 35 to 50 years | 0 (0.0%) | 0 (0.0%) |
| Total | 12 (100.0%) | 0 (0.0%) |
Fertility by Education in Knox
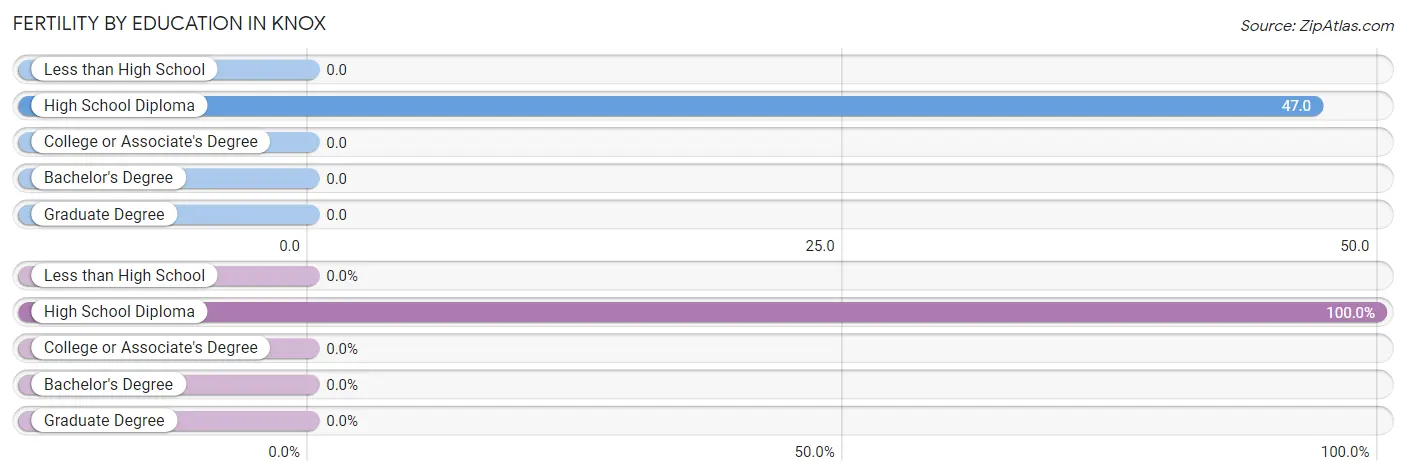
| Educational Attainment | Women with Births | Births / 1,000 Women |
| Less than High School | 0 (0.0%) | 0.0 |
| High School Diploma | 12 (100.0%) | 47.0 |
| College or Associate's Degree | 0 (0.0%) | 0.0 |
| Bachelor's Degree | 0 (0.0%) | 0.0 |
| Graduate Degree | 0 (0.0%) | 0.0 |
| Total | 12 (100.0%) | 14.0 |
Fertility by Education by Marriage Status in Knox
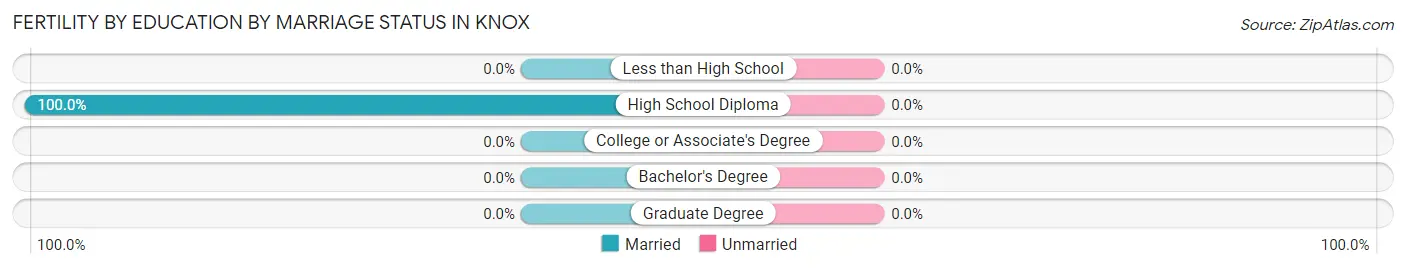
| Educational Attainment | Married | Unmarried |
| Less than High School | 0 (0.0%) | 0 (0.0%) |
| High School Diploma | 12 (100.0%) | 0 (0.0%) |
| College or Associate's Degree | 0 (0.0%) | 0 (0.0%) |
| Bachelor's Degree | 0 (0.0%) | 0 (0.0%) |
| Graduate Degree | 0 (0.0%) | 0 (0.0%) |
| Total | 12 (100.0%) | 0 (0.0%) |
Income in Knox
Income Overview in Knox
Per Capita Income in Knox is $21,125, while median incomes of families and households are $55,938 and $47,967 respectively.
| Characteristic | Number | Measure |
| Per Capita Income | 3,847 | $21,125 |
| Median Family Income | 927 | $55,938 |
| Mean Family Income | 927 | $63,161 |
| Median Household Income | 1,454 | $47,967 |
| Mean Household Income | 1,454 | $55,308 |
| Income Deficit | 927 | $0 |
| Wage / Income Gap (%) | 3,847 | 26.78% |
| Wage / Income Gap ($) | 3,847 | 73.22¢ per $1 |
| Gini / Inequality Index | 3,847 | 0.44 |
Earnings by Sex in Knox
Average Earnings in Knox are $32,419, $38,721 for men and $28,352 for women, a difference of 26.8%.
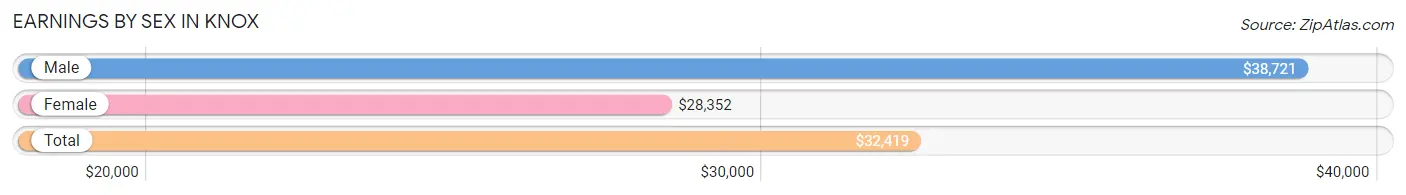
| Sex | Number | Average Earnings |
| Male | 722 (52.0%) | $38,721 |
| Female | 667 (48.0%) | $28,352 |
| Total | 1,389 (100.0%) | $32,419 |
Earnings by Sex by Income Bracket in Knox
The most common earnings brackets in Knox are $45,000 to $49,999 for men (77 | 10.7%) and $7,500 to $9,999 for women (101 | 15.1%).
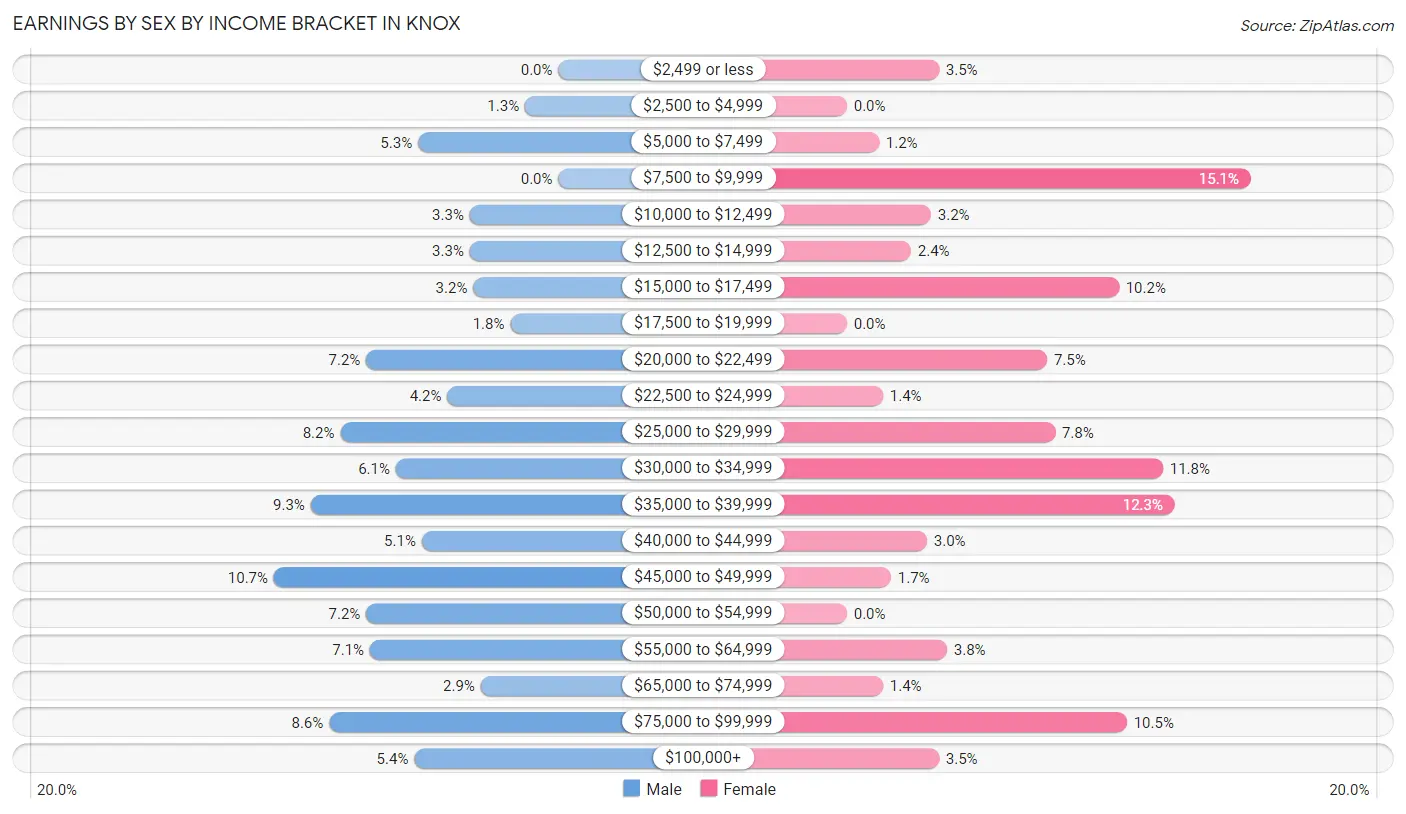
| Income | Male | Female |
| $2,499 or less | 0 (0.0%) | 23 (3.5%) |
| $2,500 to $4,999 | 9 (1.3%) | 0 (0.0%) |
| $5,000 to $7,499 | 38 (5.3%) | 8 (1.2%) |
| $7,500 to $9,999 | 0 (0.0%) | 101 (15.1%) |
| $10,000 to $12,499 | 24 (3.3%) | 21 (3.2%) |
| $12,500 to $14,999 | 24 (3.3%) | 16 (2.4%) |
| $15,000 to $17,499 | 23 (3.2%) | 68 (10.2%) |
| $17,500 to $19,999 | 13 (1.8%) | 0 (0.0%) |
| $20,000 to $22,499 | 52 (7.2%) | 50 (7.5%) |
| $22,500 to $24,999 | 30 (4.2%) | 9 (1.3%) |
| $25,000 to $29,999 | 59 (8.2%) | 52 (7.8%) |
| $30,000 to $34,999 | 44 (6.1%) | 79 (11.8%) |
| $35,000 to $39,999 | 67 (9.3%) | 82 (12.3%) |
| $40,000 to $44,999 | 37 (5.1%) | 20 (3.0%) |
| $45,000 to $49,999 | 77 (10.7%) | 11 (1.7%) |
| $50,000 to $54,999 | 52 (7.2%) | 0 (0.0%) |
| $55,000 to $64,999 | 51 (7.1%) | 25 (3.7%) |
| $65,000 to $74,999 | 21 (2.9%) | 9 (1.3%) |
| $75,000 to $99,999 | 62 (8.6%) | 70 (10.5%) |
| $100,000+ | 39 (5.4%) | 23 (3.5%) |
| Total | 722 (100.0%) | 667 (100.0%) |
Earnings by Sex by Educational Attainment in Knox
Average earnings in Knox are $41,014 for men and $31,607 for women, a difference of 22.9%. Men with an educational attainment of graduate degree enjoy the highest average annual earnings of $102,583, while those with less than high school education earn the least with $31,143. Women with an educational attainment of bachelor's degree earn the most with the average annual earnings of $48,636, while those with college or associate's degree education have the smallest earnings of $25,000.
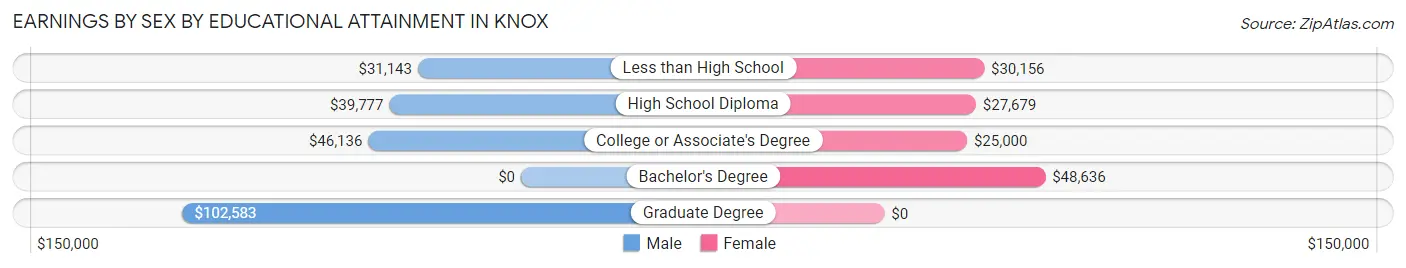
| Educational Attainment | Male Income | Female Income |
| Less than High School | $31,143 | $30,156 |
| High School Diploma | $39,777 | $27,679 |
| College or Associate's Degree | $46,136 | $25,000 |
| Bachelor's Degree | - | - |
| Graduate Degree | $102,583 | $0 |
| Total | $41,014 | $31,607 |
Family Income in Knox
Family Income Brackets in Knox
According to the Knox family income data, there are 193 families falling into the $75,000 to $99,999 income range, which is the most common income bracket and makes up 20.8% of all families. Conversely, the $200,000+ income bracket is the least frequent group with only 25 families (2.7%) belonging to this category.
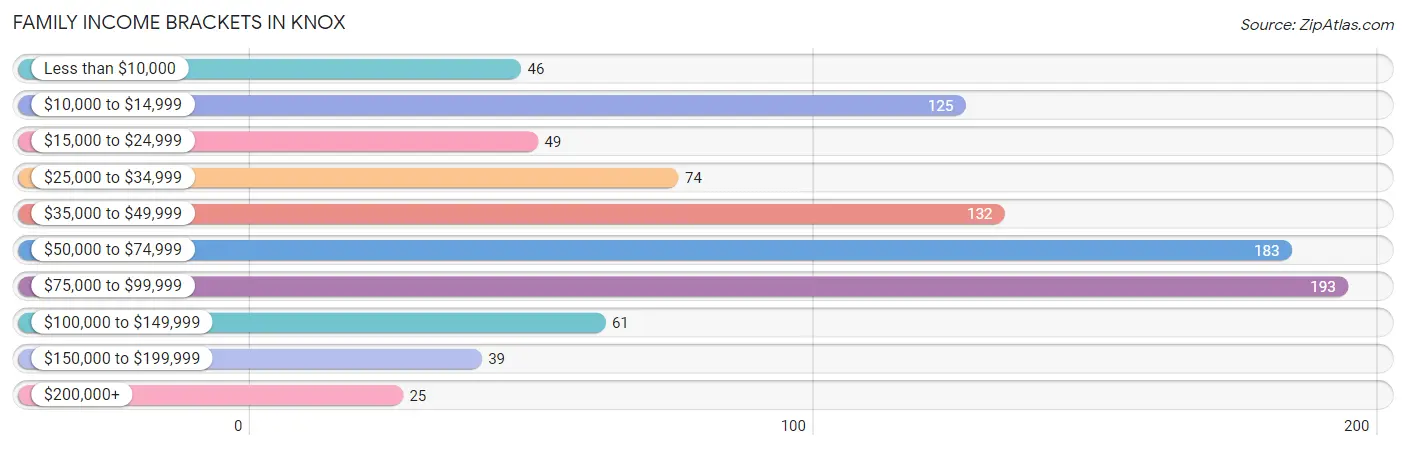
| Income Bracket | # Families | % Families |
| Less than $10,000 | 46 | 5.0% |
| $10,000 to $14,999 | 125 | 13.5% |
| $15,000 to $24,999 | 49 | 5.3% |
| $25,000 to $34,999 | 74 | 8.0% |
| $35,000 to $49,999 | 132 | 14.2% |
| $50,000 to $74,999 | 183 | 19.7% |
| $75,000 to $99,999 | 193 | 20.8% |
| $100,000 to $149,999 | 61 | 6.6% |
| $150,000 to $199,999 | 39 | 4.2% |
| $200,000+ | 25 | 2.7% |
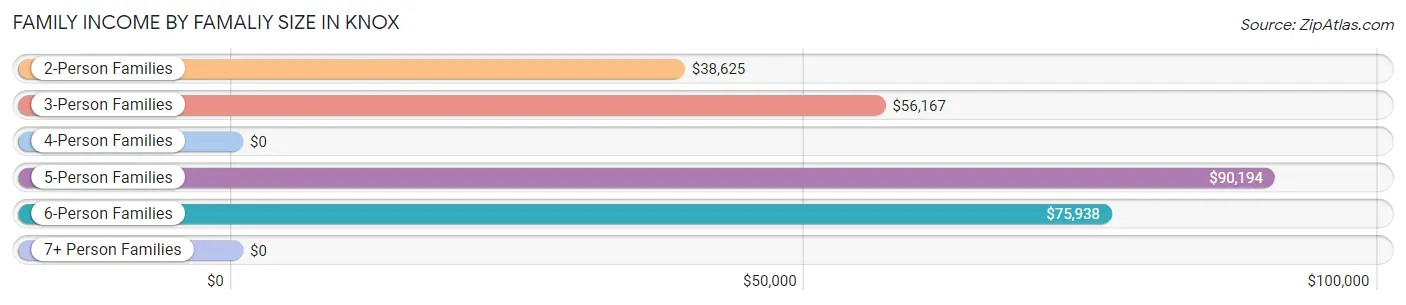
Family Income by Famaliy Size in Knox
5-person families (123 | 13.3%) account for the highest median family income in Knox with $90,194 per family, while 2-person families (511 | 55.1%) have the highest median income of $19,312 per family member.
| Income Bracket | # Families | Median Income |
| 2-Person Families | 511 (55.1%) | $38,625 |
| 3-Person Families | 112 (12.1%) | $56,167 |
| 4-Person Families | 84 (9.1%) | $0 |
| 5-Person Families | 123 (13.3%) | $90,194 |
| 6-Person Families | 57 (6.1%) | $75,938 |
| 7+ Person Families | 40 (4.3%) | $0 |
| Total | 927 (100.0%) | $55,938 |
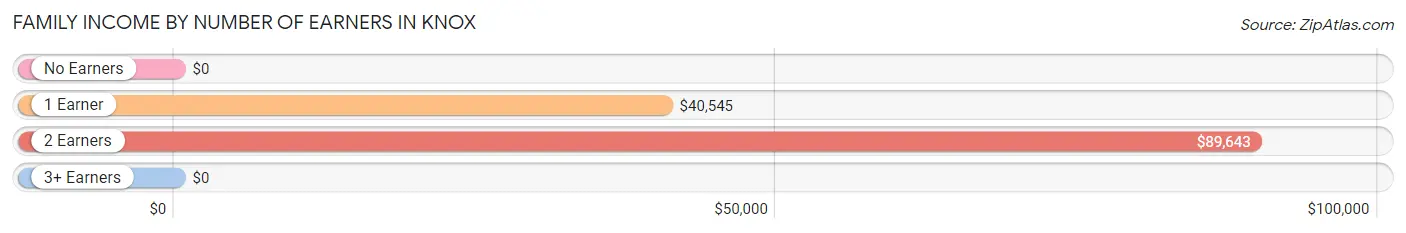
Family Income by Number of Earners in Knox
| Number of Earners | # Families | Median Income |
| No Earners | 235 (25.4%) | $0 |
| 1 Earner | 437 (47.1%) | $40,545 |
| 2 Earners | 202 (21.8%) | $89,643 |
| 3+ Earners | 53 (5.7%) | $0 |
| Total | 927 (100.0%) | $55,938 |
Household Income in Knox
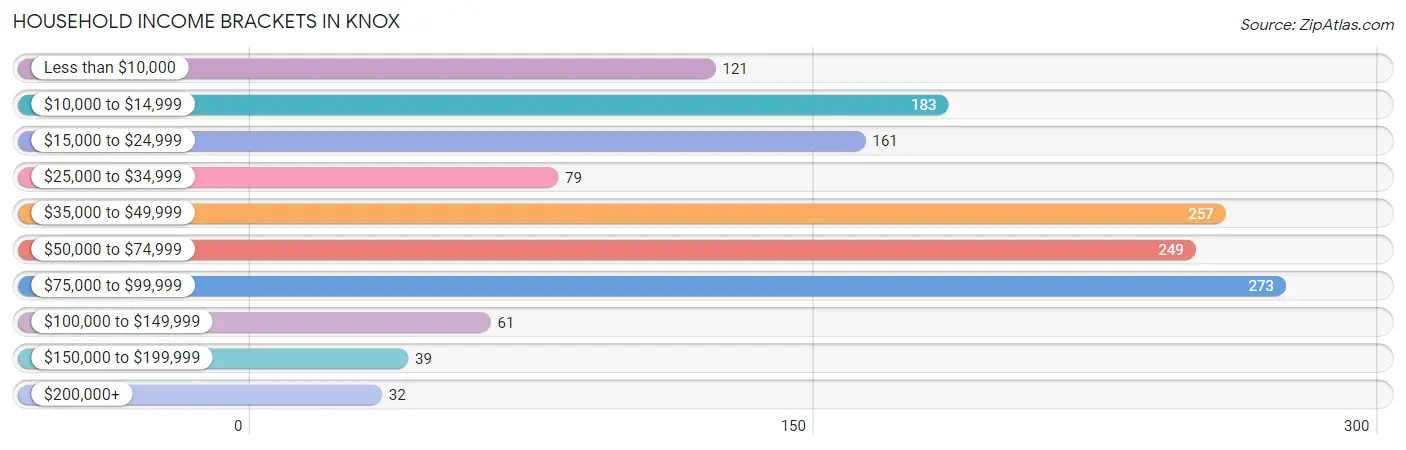
Household Income Brackets in Knox
With 273 households falling in the category, the $75,000 to $99,999 income range is the most frequent in Knox, accounting for 18.8% of all households. In contrast, only 32 households (2.2%) fall into the $200,000+ income bracket, making it the least populous group.
| Income Bracket | # Households | % Households |
| Less than $10,000 | 121 | 8.3% |
| $10,000 to $14,999 | 183 | 12.6% |
| $15,000 to $24,999 | 161 | 11.1% |
| $25,000 to $34,999 | 79 | 5.4% |
| $35,000 to $49,999 | 257 | 17.7% |
| $50,000 to $74,999 | 249 | 17.1% |
| $75,000 to $99,999 | 273 | 18.8% |
| $100,000 to $149,999 | 61 | 4.2% |
| $150,000 to $199,999 | 39 | 2.7% |
| $200,000+ | 32 | 2.2% |
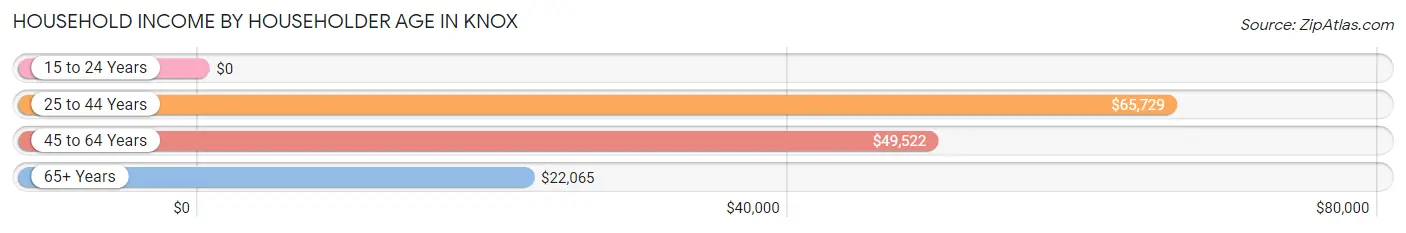
Household Income by Householder Age in Knox
The median household income in Knox is $47,967, with the highest median household income of $65,729 found in the 25 to 44 years age bracket for the primary householder. A total of 394 households (27.1%) fall into this category. Meanwhile, the 15 to 24 years age bracket for the primary householder has the lowest median household income of $0, with 61 households (4.2%) in this group.
| Income Bracket | # Households | Median Income |
| 15 to 24 Years | 61 (4.2%) | $0 |
| 25 to 44 Years | 394 (27.1%) | $65,729 |
| 45 to 64 Years | 571 (39.3%) | $49,522 |
| 65+ Years | 428 (29.4%) | $22,065 |
| Total | 1,454 (100.0%) | $47,967 |
Poverty in Knox
Income Below Poverty by Sex and Age in Knox
With 19.7% poverty level for males and 37.2% for females among the residents of Knox, 16 and 17 year old males and 5 year old females are the most vulnerable to poverty, with 35 males (63.6%) and 23 females (100.0%) in their respective age groups living below the poverty level.
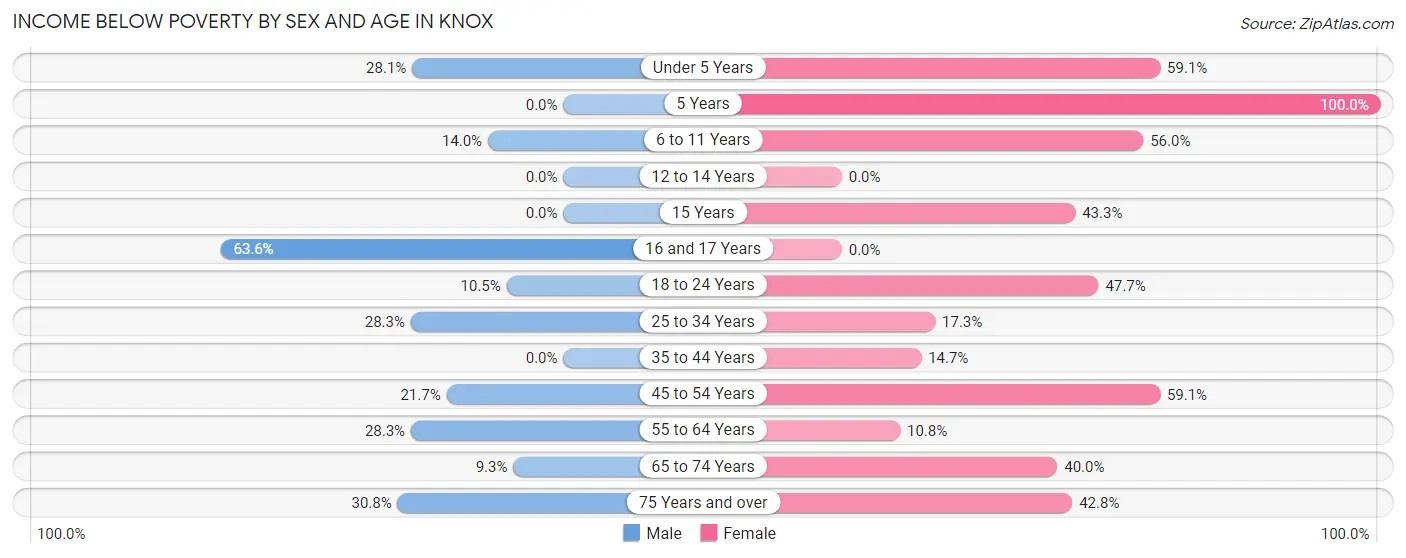
| Age Bracket | Male | Female |
| Under 5 Years | 39 (28.1%) | 52 (59.1%) |
| 5 Years | 0 (0.0%) | 23 (100.0%) |
| 6 to 11 Years | 28 (14.0%) | 127 (55.9%) |
| 12 to 14 Years | 0 (0.0%) | 0 (0.0%) |
| 15 Years | 0 (0.0%) | 13 (43.3%) |
| 16 and 17 Years | 35 (63.6%) | 0 (0.0%) |
| 18 to 24 Years | 18 (10.5%) | 71 (47.6%) |
| 25 to 34 Years | 77 (28.3%) | 36 (17.3%) |
| 35 to 44 Years | 0 (0.0%) | 37 (14.7%) |
| 45 to 54 Years | 77 (21.7%) | 212 (59.1%) |
| 55 to 64 Years | 43 (28.3%) | 24 (10.8%) |
| 65 to 74 Years | 13 (9.3%) | 88 (40.0%) |
| 75 Years and over | 24 (30.8%) | 74 (42.8%) |
| Total | 354 (19.7%) | 757 (37.2%) |
Income Above Poverty by Sex and Age in Knox
According to the poverty statistics in Knox, males aged 5 years and females aged 12 to 14 years are the age groups that are most secure financially, with 100.0% of males and 100.0% of females in these age groups living above the poverty line.
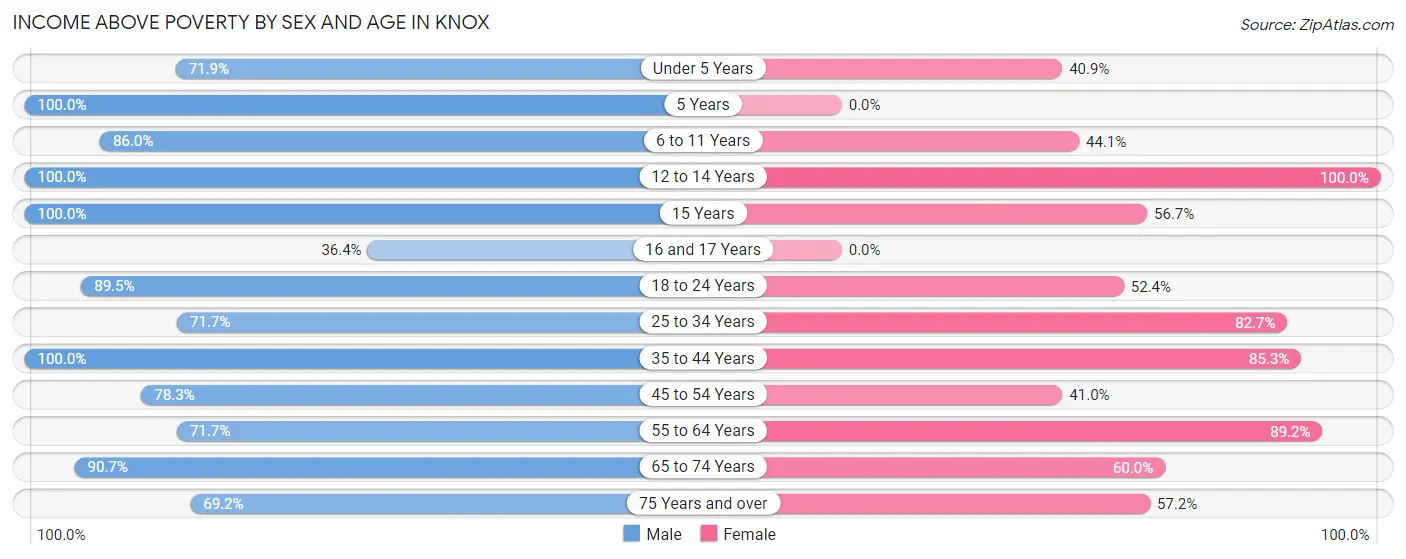
| Age Bracket | Male | Female |
| Under 5 Years | 100 (71.9%) | 36 (40.9%) |
| 5 Years | 36 (100.0%) | 0 (0.0%) |
| 6 to 11 Years | 172 (86.0%) | 100 (44.1%) |
| 12 to 14 Years | 111 (100.0%) | 86 (100.0%) |
| 15 Years | 7 (100.0%) | 17 (56.7%) |
| 16 and 17 Years | 20 (36.4%) | 0 (0.0%) |
| 18 to 24 Years | 153 (89.5%) | 78 (52.3%) |
| 25 to 34 Years | 195 (71.7%) | 172 (82.7%) |
| 35 to 44 Years | 78 (100.0%) | 214 (85.3%) |
| 45 to 54 Years | 278 (78.3%) | 147 (40.9%) |
| 55 to 64 Years | 109 (71.7%) | 198 (89.2%) |
| 65 to 74 Years | 127 (90.7%) | 132 (60.0%) |
| 75 Years and over | 54 (69.2%) | 99 (57.2%) |
| Total | 1,440 (80.3%) | 1,279 (62.8%) |
Income Below Poverty Among Married-Couple Families in Knox
The poverty statistics for married-couple families in Knox show that 10.2% or 59 of the total 578 families live below the poverty line. Families with 5 or more children have the highest poverty rate of 100.0%, comprising of 28 families. On the other hand, families with 3 or 4 children have the lowest poverty rate of 0.0%, which includes 0 families.
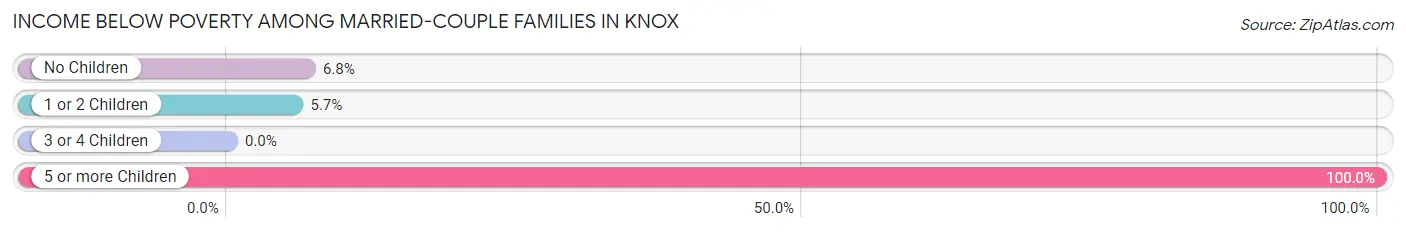
| Children | Above Poverty | Below Poverty |
| No Children | 302 (93.2%) | 22 (6.8%) |
| 1 or 2 Children | 149 (94.3%) | 9 (5.7%) |
| 3 or 4 Children | 68 (100.0%) | 0 (0.0%) |
| 5 or more Children | 0 (0.0%) | 28 (100.0%) |
| Total | 519 (89.8%) | 59 (10.2%) |
Income Below Poverty Among Single-Parent Households in Knox
According to the poverty data in Knox, 71.4% or 120 single-father households and 39.8% or 72 single-mother households are living below the poverty line. Among single-father households, those with 1 or 2 children have the highest poverty rate, with 120 households (91.6%) experiencing poverty. Likewise, among single-mother households, those with no children have the highest poverty rate, with 39 households (78.0%) falling below the poverty line.
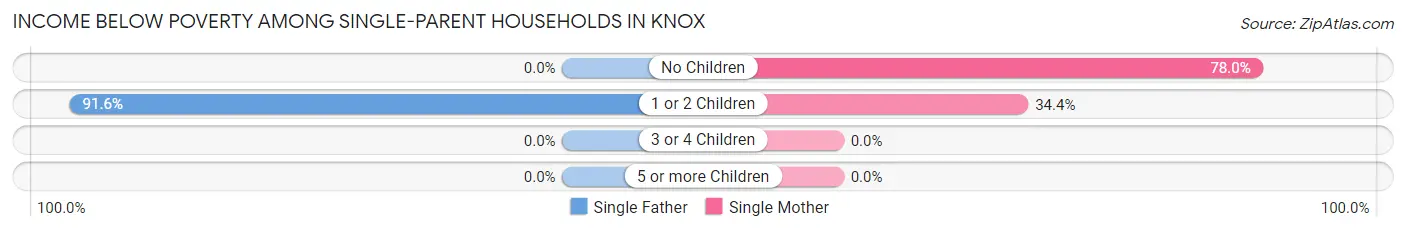
| Children | Single Father | Single Mother |
| No Children | 0 (0.0%) | 39 (78.0%) |
| 1 or 2 Children | 120 (91.6%) | 33 (34.4%) |
| 3 or 4 Children | 0 (0.0%) | 0 (0.0%) |
| 5 or more Children | 0 (0.0%) | 0 (0.0%) |
| Total | 120 (71.4%) | 72 (39.8%) |
Income Below Poverty Among Married-Couple vs Single-Parent Households in Knox
The poverty data for Knox shows that 59 of the married-couple family households (10.2%) and 192 of the single-parent households (55.0%) are living below the poverty level. Within the married-couple family households, those with 5 or more children have the highest poverty rate, with 28 households (100.0%) falling below the poverty line. Among the single-parent households, those with 1 or 2 children have the highest poverty rate, with 153 household (67.4%) living below poverty.
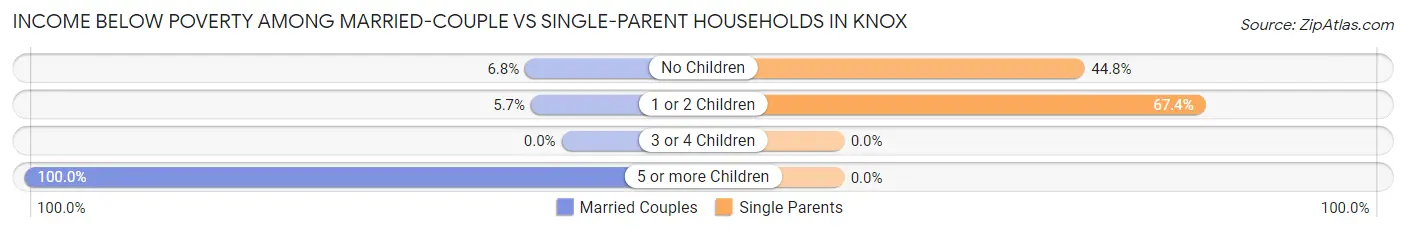
| Children | Married-Couple Families | Single-Parent Households |
| No Children | 22 (6.8%) | 39 (44.8%) |
| 1 or 2 Children | 9 (5.7%) | 153 (67.4%) |
| 3 or 4 Children | 0 (0.0%) | 0 (0.0%) |
| 5 or more Children | 28 (100.0%) | 0 (0.0%) |
| Total | 59 (10.2%) | 192 (55.0%) |
Employment Characteristics in Knox
Employment by Class of Employer in Knox
Among the 1,294 employed individuals in Knox, private company employees (841 | 65.0%), not-for-profit organizations (251 | 19.4%), and local government employees (126 | 9.7%) make up the most common classes of employment.
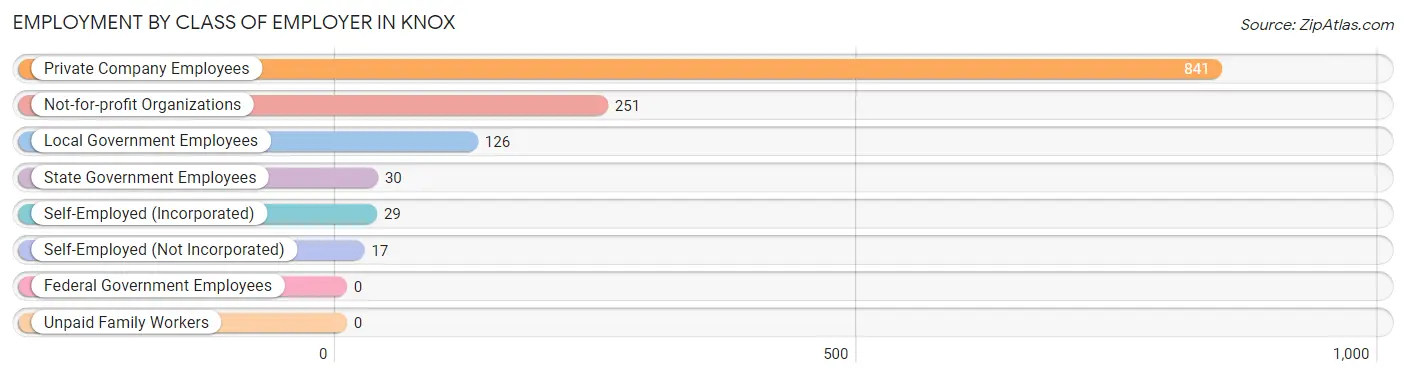
| Employer Class | # Employees | % Employees |
| Private Company Employees | 841 | 65.0% |
| Self-Employed (Incorporated) | 29 | 2.2% |
| Self-Employed (Not Incorporated) | 17 | 1.3% |
| Not-for-profit Organizations | 251 | 19.4% |
| Local Government Employees | 126 | 9.7% |
| State Government Employees | 30 | 2.3% |
| Federal Government Employees | 0 | 0.0% |
| Unpaid Family Workers | 0 | 0.0% |
| Total | 1,294 | 100.0% |
Employment Status by Age in Knox
According to the labor force statistics for Knox, out of the total population over 16 years of age (2,900), 47.3% or 1,372 individuals are in the labor force, with 2.7% or 37 of them unemployed. The age group with the highest labor force participation rate is 35 to 44 years, with 78.4% or 258 individuals in the labor force. Within the labor force, the 55 to 59 years age range has the highest percentage of unemployed individuals, with 30.9% or 25 of them being unemployed.
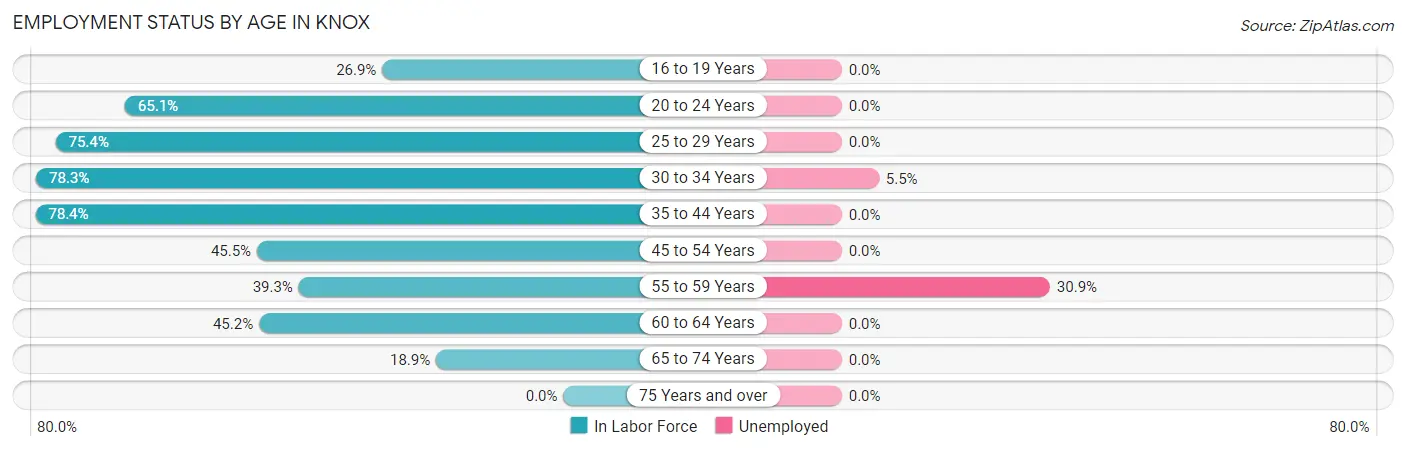
| Age Bracket | In Labor Force | Unemployed |
| 16 to 19 Years | 36 (26.9%) | 0 (0.0%) |
| 20 to 24 Years | 157 (65.1%) | 0 (0.0%) |
| 25 to 29 Years | 150 (75.4%) | 0 (0.0%) |
| 30 to 34 Years | 220 (78.3%) | 12 (5.5%) |
| 35 to 44 Years | 258 (78.4%) | 0 (0.0%) |
| 45 to 54 Years | 325 (45.5%) | 0 (0.0%) |
| 55 to 59 Years | 81 (39.3%) | 25 (30.9%) |
| 60 to 64 Years | 76 (45.2%) | 0 (0.0%) |
| 65 to 74 Years | 68 (18.9%) | 0 (0.0%) |
| 75 Years and over | 0 (0.0%) | 0 (0.0%) |
| Total | 1,372 (47.3%) | 37 (2.7%) |
Employment Status by Educational Attainment in Knox
According to labor force statistics for Knox, 58.5% of individuals (1,110) out of the total population between 25 and 64 years of age (1,897) are in the labor force, with 3.3% or 37 of them being unemployed. The group with the highest labor force participation rate are those with the educational attainment of college / associate degree, with 76.2% or 227 individuals in the labor force. Within the labor force, individuals with college / associate degree education have the highest percentage of unemployment, with 16.3% or 37 of them being unemployed.
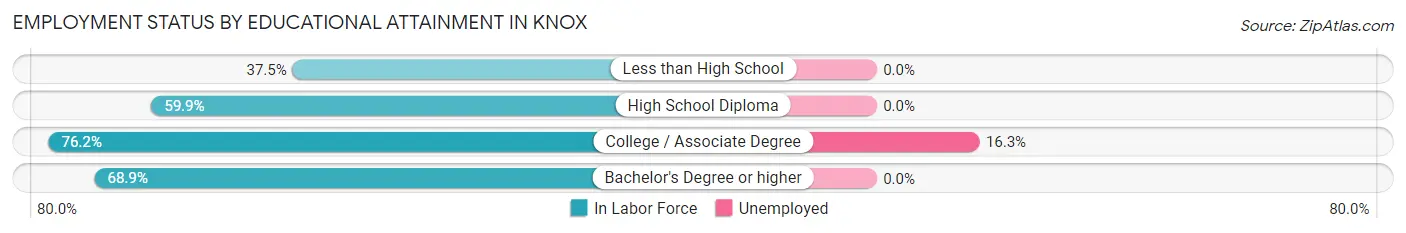
| Educational Attainment | In Labor Force | Unemployed |
| Less than High School | 181 (37.5%) | 0 (0.0%) |
| High School Diploma | 449 (59.9%) | 0 (0.0%) |
| College / Associate Degree | 227 (76.2%) | 49 (16.3%) |
| Bachelor's Degree or higher | 253 (68.9%) | 0 (0.0%) |
| Total | 1,110 (58.5%) | 63 (3.3%) |
Employment Occupations by Sex in Knox
Management, Business, Science and Arts Occupations
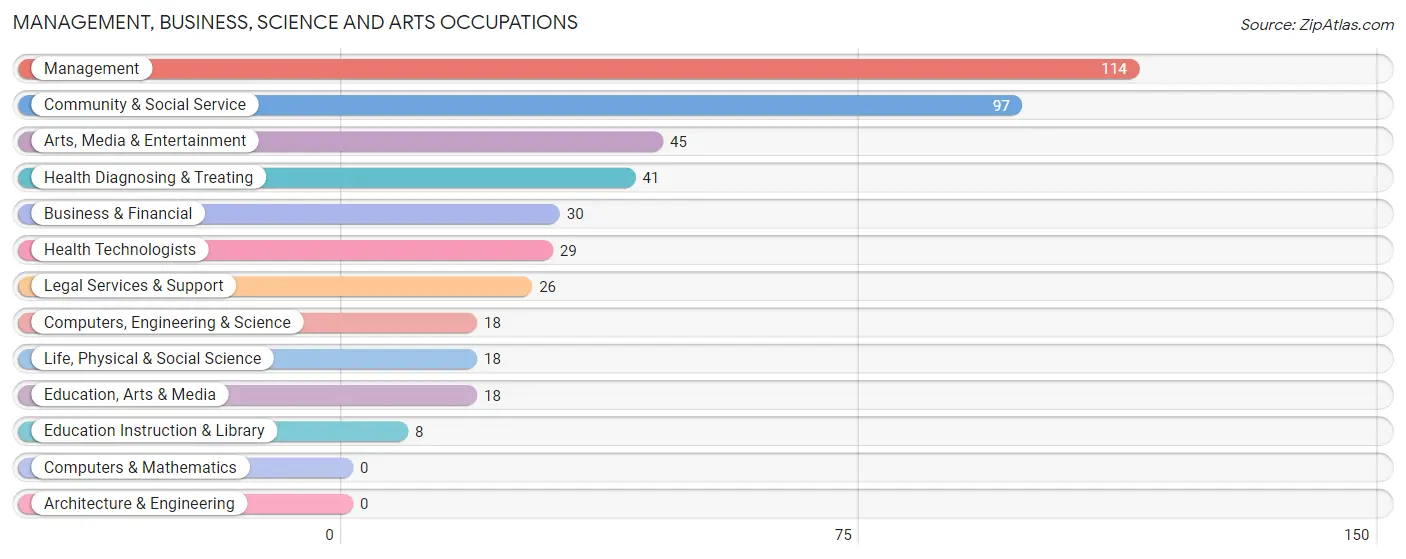
The most common Management, Business, Science and Arts occupations in Knox are Management (114 | 8.6%), Community & Social Service (97 | 7.3%), Arts, Media & Entertainment (45 | 3.4%), Health Diagnosing & Treating (41 | 3.1%), and Business & Financial (30 | 2.2%).
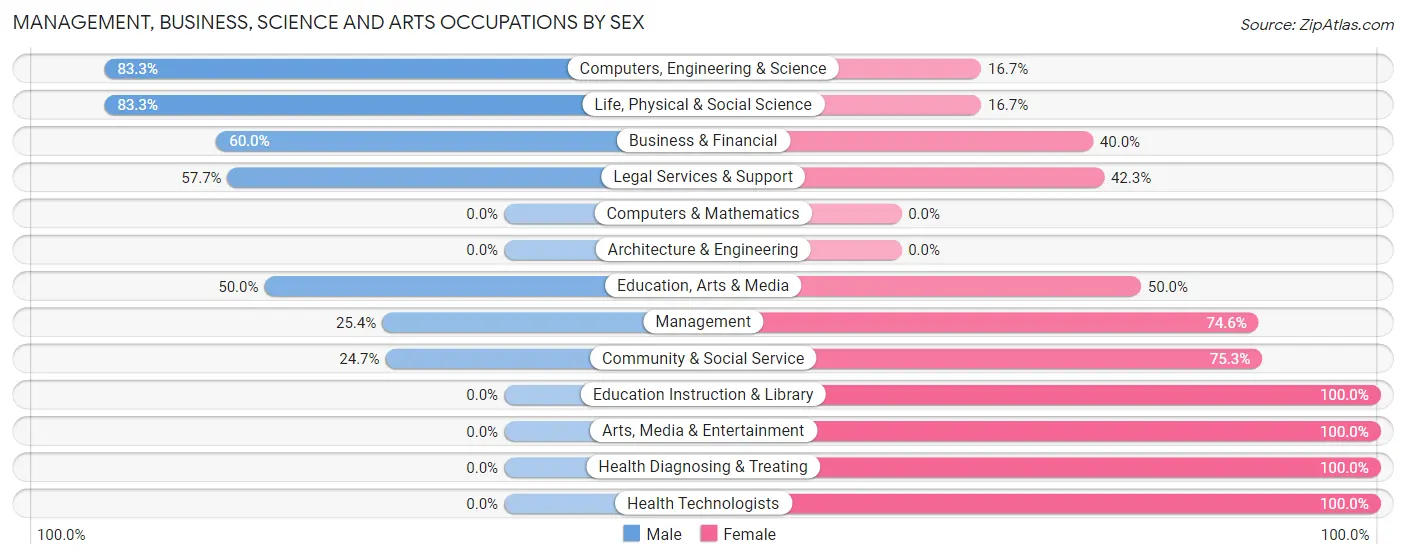
Management, Business, Science and Arts Occupations by Sex
Within the Management, Business, Science and Arts occupations in Knox, the most male-oriented occupations are Computers, Engineering & Science (83.3%), Life, Physical & Social Science (83.3%), and Business & Financial (60.0%), while the most female-oriented occupations are Education Instruction & Library (100.0%), Arts, Media & Entertainment (100.0%), and Health Diagnosing & Treating (100.0%).
| Occupation | Male | Female |
| Management | 29 (25.4%) | 85 (74.6%) |
| Business & Financial | 18 (60.0%) | 12 (40.0%) |
| Computers, Engineering & Science | 15 (83.3%) | 3 (16.7%) |
| Computers & Mathematics | 0 (0.0%) | 0 (0.0%) |
| Architecture & Engineering | 0 (0.0%) | 0 (0.0%) |
| Life, Physical & Social Science | 15 (83.3%) | 3 (16.7%) |
| Community & Social Service | 24 (24.7%) | 73 (75.3%) |
| Education, Arts & Media | 9 (50.0%) | 9 (50.0%) |
| Legal Services & Support | 15 (57.7%) | 11 (42.3%) |
| Education Instruction & Library | 0 (0.0%) | 8 (100.0%) |
| Arts, Media & Entertainment | 0 (0.0%) | 45 (100.0%) |
| Health Diagnosing & Treating | 0 (0.0%) | 41 (100.0%) |
| Health Technologists | 0 (0.0%) | 29 (100.0%) |
| Total (Category) | 86 (28.7%) | 214 (71.3%) |
| Total (Overall) | 697 (52.2%) | 637 (47.7%) |
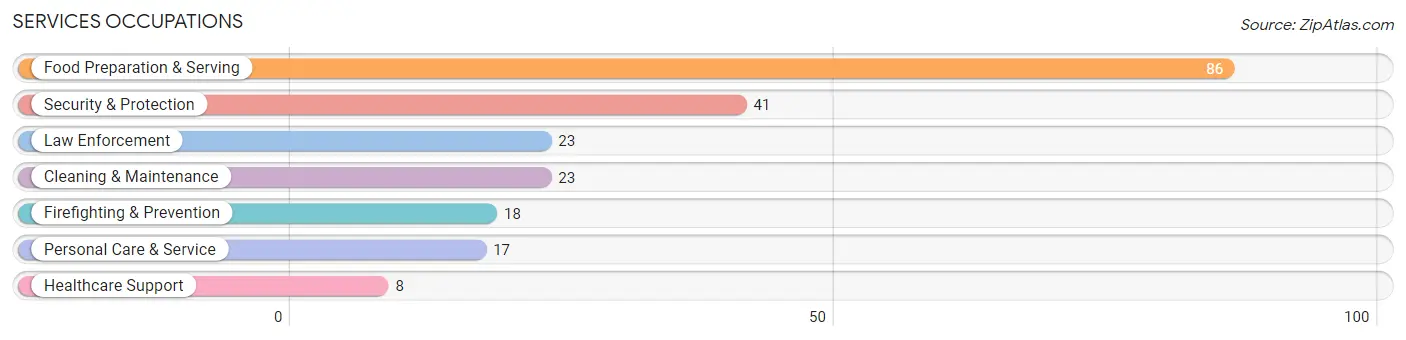
Services Occupations
The most common Services occupations in Knox are Food Preparation & Serving (86 | 6.5%), Security & Protection (41 | 3.1%), Law Enforcement (23 | 1.7%), Cleaning & Maintenance (23 | 1.7%), and Firefighting & Prevention (18 | 1.3%).
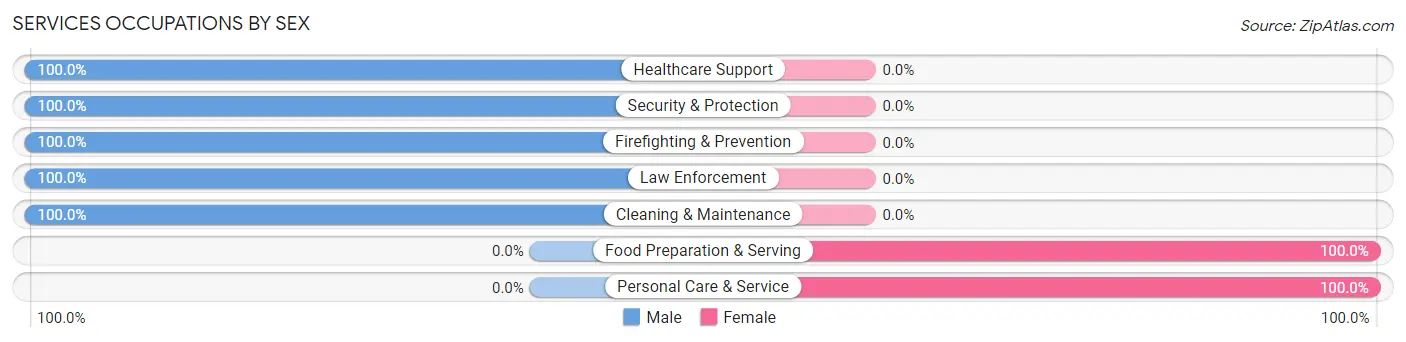
Services Occupations by Sex
Within the Services occupations in Knox, the most male-oriented occupations are Healthcare Support (100.0%), Security & Protection (100.0%), and Firefighting & Prevention (100.0%), while the most female-oriented occupations are Food Preparation & Serving (100.0%), and Personal Care & Service (100.0%).
| Occupation | Male | Female |
| Healthcare Support | 8 (100.0%) | 0 (0.0%) |
| Security & Protection | 41 (100.0%) | 0 (0.0%) |
| Firefighting & Prevention | 18 (100.0%) | 0 (0.0%) |
| Law Enforcement | 23 (100.0%) | 0 (0.0%) |
| Food Preparation & Serving | 0 (0.0%) | 86 (100.0%) |
| Cleaning & Maintenance | 23 (100.0%) | 0 (0.0%) |
| Personal Care & Service | 0 (0.0%) | 17 (100.0%) |
| Total (Category) | 72 (41.1%) | 103 (58.9%) |
| Total (Overall) | 697 (52.2%) | 637 (47.7%) |
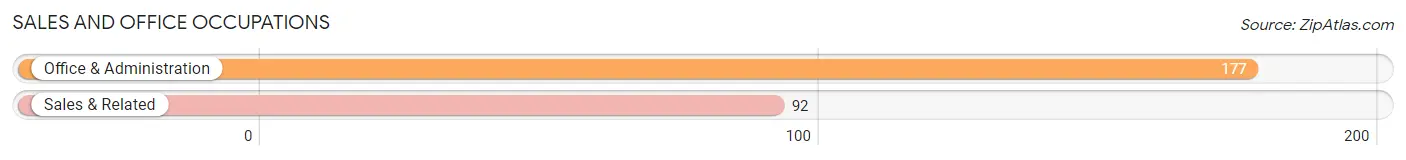
Sales and Office Occupations
The most common Sales and Office occupations in Knox are Office & Administration (177 | 13.3%), and Sales & Related (92 | 6.9%).
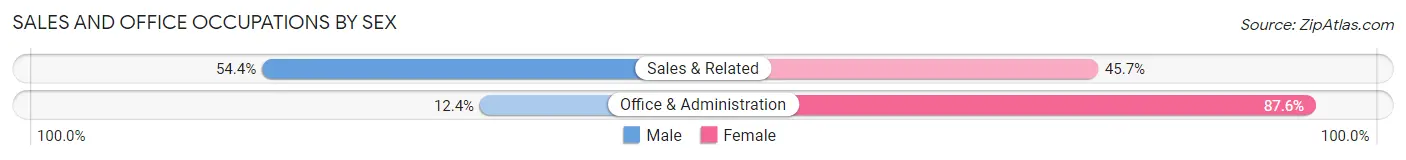
Sales and Office Occupations by Sex
| Occupation | Male | Female |
| Sales & Related | 50 (54.3%) | 42 (45.7%) |
| Office & Administration | 22 (12.4%) | 155 (87.6%) |
| Total (Category) | 72 (26.8%) | 197 (73.2%) |
| Total (Overall) | 697 (52.2%) | 637 (47.7%) |
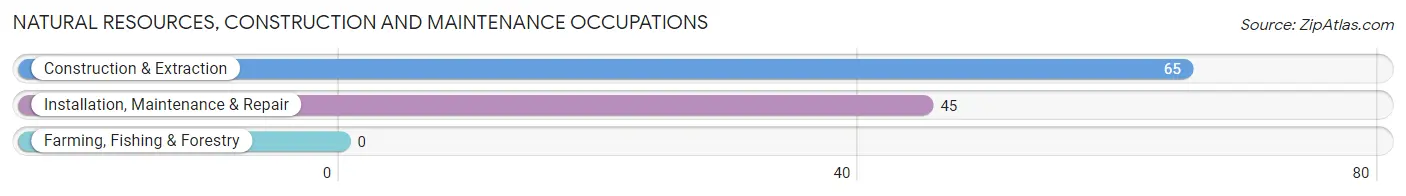
Natural Resources, Construction and Maintenance Occupations
The most common Natural Resources, Construction and Maintenance occupations in Knox are Construction & Extraction (65 | 4.9%), and Installation, Maintenance & Repair (45 | 3.4%).
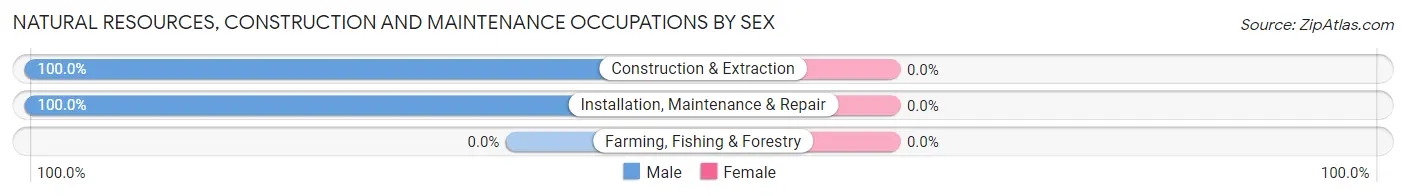
Natural Resources, Construction and Maintenance Occupations by Sex
| Occupation | Male | Female |
| Farming, Fishing & Forestry | 0 (0.0%) | 0 (0.0%) |
| Construction & Extraction | 65 (100.0%) | 0 (0.0%) |
| Installation, Maintenance & Repair | 45 (100.0%) | 0 (0.0%) |
| Total (Category) | 110 (100.0%) | 0 (0.0%) |
| Total (Overall) | 697 (52.2%) | 637 (47.7%) |
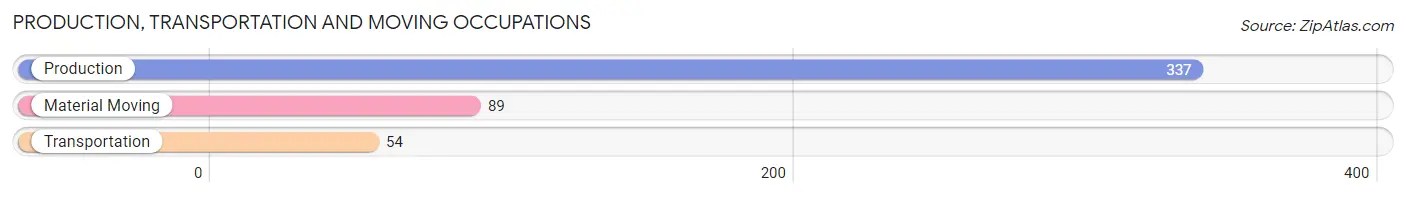
Production, Transportation and Moving Occupations
The most common Production, Transportation and Moving occupations in Knox are Production (337 | 25.3%), Material Moving (89 | 6.7%), and Transportation (54 | 4.1%).
Production, Transportation and Moving Occupations by Sex
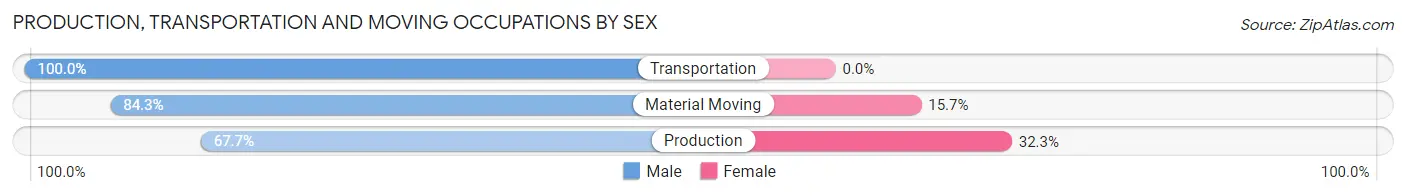
| Occupation | Male | Female |
| Production | 228 (67.7%) | 109 (32.3%) |
| Transportation | 54 (100.0%) | 0 (0.0%) |
| Material Moving | 75 (84.3%) | 14 (15.7%) |
| Total (Category) | 357 (74.4%) | 123 (25.6%) |
| Total (Overall) | 697 (52.2%) | 637 (47.7%) |
Employment Industries by Sex in Knox
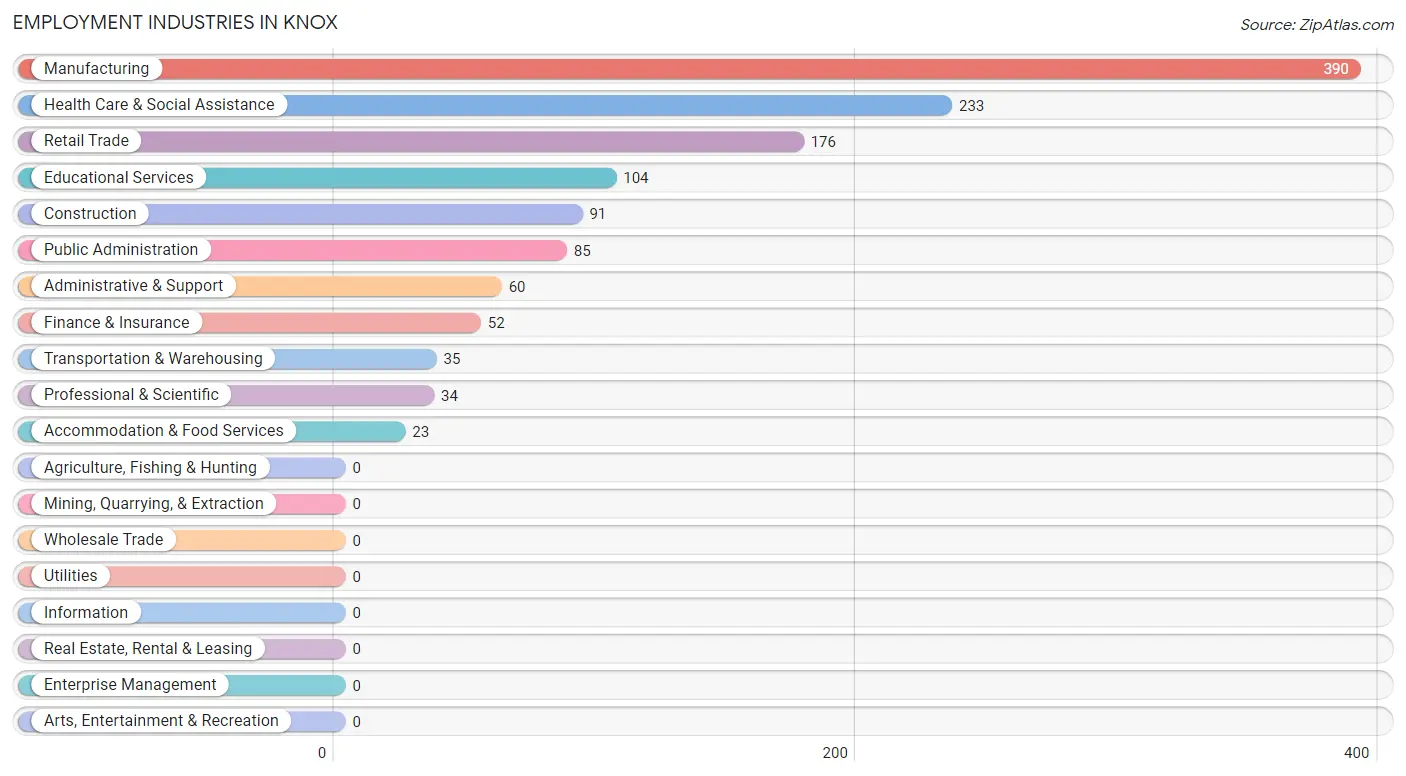
Employment Industries in Knox
The major employment industries in Knox include Manufacturing (390 | 29.2%), Health Care & Social Assistance (233 | 17.5%), Retail Trade (176 | 13.2%), Educational Services (104 | 7.8%), and Construction (91 | 6.8%).
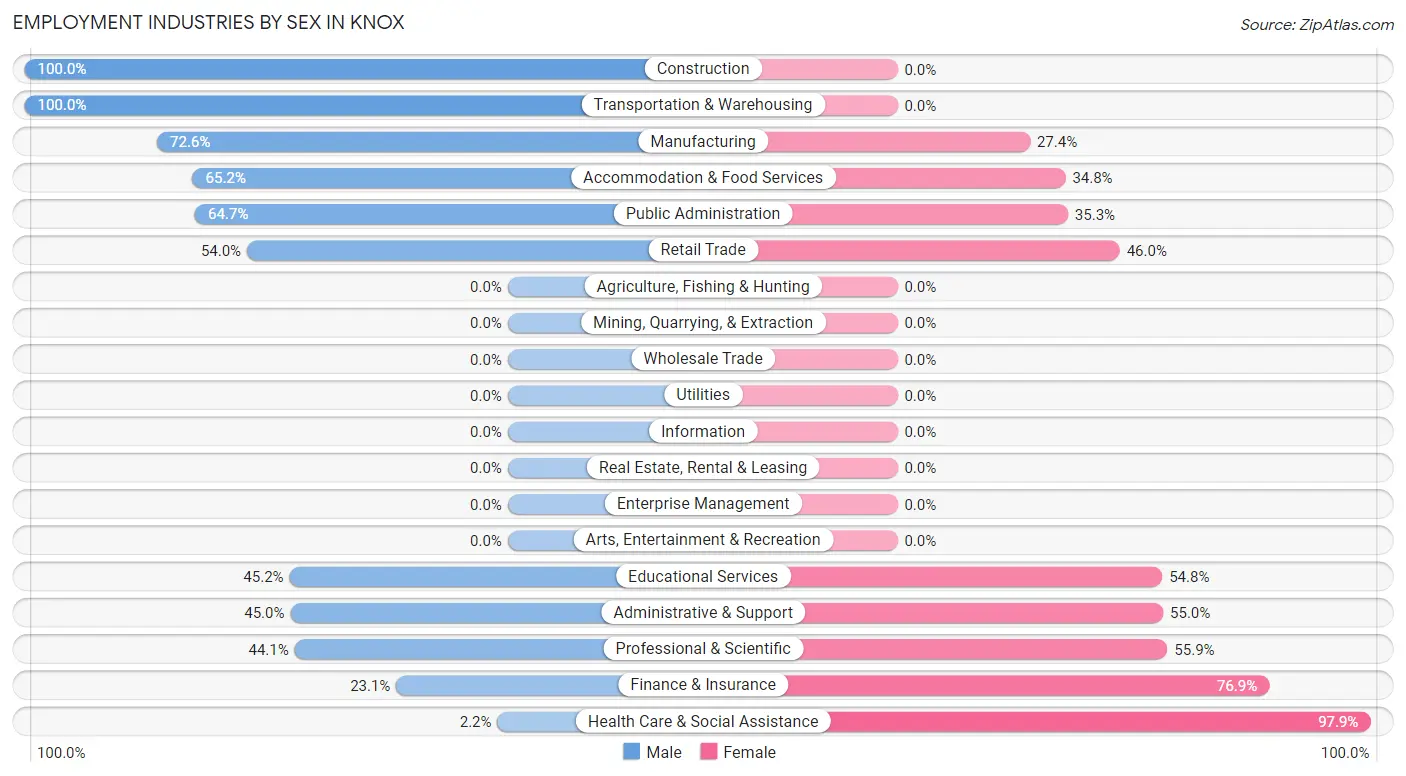
Employment Industries by Sex in Knox
The Knox industries that see more men than women are Construction (100.0%), Transportation & Warehousing (100.0%), and Manufacturing (72.6%), whereas the industries that tend to have a higher number of women are Health Care & Social Assistance (97.9%), Finance & Insurance (76.9%), and Professional & Scientific (55.9%).
| Industry | Male | Female |
| Agriculture, Fishing & Hunting | 0 (0.0%) | 0 (0.0%) |
| Mining, Quarrying, & Extraction | 0 (0.0%) | 0 (0.0%) |
| Construction | 91 (100.0%) | 0 (0.0%) |
| Manufacturing | 283 (72.6%) | 107 (27.4%) |
| Wholesale Trade | 0 (0.0%) | 0 (0.0%) |
| Retail Trade | 95 (54.0%) | 81 (46.0%) |
| Transportation & Warehousing | 35 (100.0%) | 0 (0.0%) |
| Utilities | 0 (0.0%) | 0 (0.0%) |
| Information | 0 (0.0%) | 0 (0.0%) |
| Finance & Insurance | 12 (23.1%) | 40 (76.9%) |
| Real Estate, Rental & Leasing | 0 (0.0%) | 0 (0.0%) |
| Professional & Scientific | 15 (44.1%) | 19 (55.9%) |
| Enterprise Management | 0 (0.0%) | 0 (0.0%) |
| Administrative & Support | 27 (45.0%) | 33 (55.0%) |
| Educational Services | 47 (45.2%) | 57 (54.8%) |
| Health Care & Social Assistance | 5 (2.1%) | 228 (97.9%) |
| Arts, Entertainment & Recreation | 0 (0.0%) | 0 (0.0%) |
| Accommodation & Food Services | 15 (65.2%) | 8 (34.8%) |
| Public Administration | 55 (64.7%) | 30 (35.3%) |
| Total | 697 (52.2%) | 637 (47.7%) |
Education in Knox
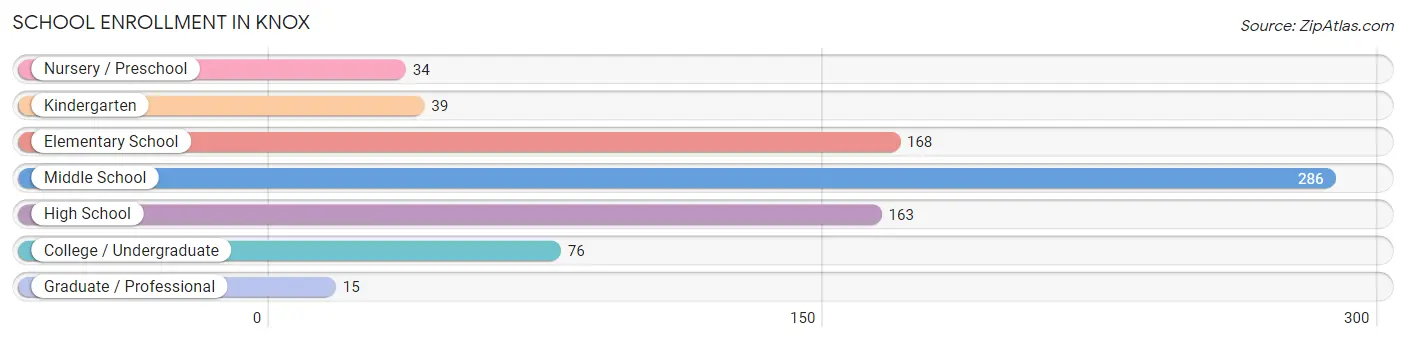
School Enrollment in Knox
The most common levels of schooling among the 781 students in Knox are middle school (286 | 36.6%), elementary school (168 | 21.5%), and high school (163 | 20.9%).
| School Level | # Students | % Students |
| Nursery / Preschool | 34 | 4.3% |
| Kindergarten | 39 | 5.0% |
| Elementary School | 168 | 21.5% |
| Middle School | 286 | 36.6% |
| High School | 163 | 20.9% |
| College / Undergraduate | 76 | 9.7% |
| Graduate / Professional | 15 | 1.9% |
| Total | 781 | 100.0% |
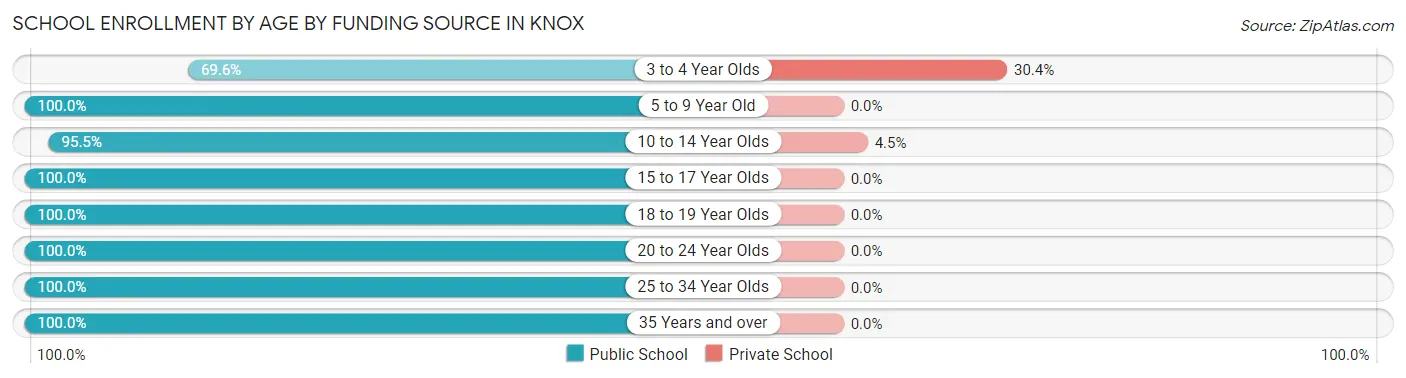
School Enrollment by Age by Funding Source in Knox
Out of a total of 781 students who are enrolled in schools in Knox, 22 (2.8%) attend a private institution, while the remaining 759 (97.2%) are enrolled in public schools. The age group of 3 to 4 year olds has the highest likelihood of being enrolled in private schools, with 7 (30.4% in the age bracket) enrolled. Conversely, the age group of 5 to 9 year old has the lowest likelihood of being enrolled in a private school, with 211 (100.0% in the age bracket) attending a public institution.
| Age Bracket | Public School | Private School |
| 3 to 4 Year Olds | 16 (69.6%) | 7 (30.4%) |
| 5 to 9 Year Old | 211 (100.0%) | 0 (0.0%) |
| 10 to 14 Year Olds | 320 (95.5%) | 15 (4.5%) |
| 15 to 17 Year Olds | 92 (100.0%) | 0 (0.0%) |
| 18 to 19 Year Olds | 15 (100.0%) | 0 (0.0%) |
| 20 to 24 Year Olds | 56 (100.0%) | 0 (0.0%) |
| 25 to 34 Year Olds | 34 (100.0%) | 0 (0.0%) |
| 35 Years and over | 15 (100.0%) | 0 (0.0%) |
| Total | 759 (97.2%) | 22 (2.8%) |
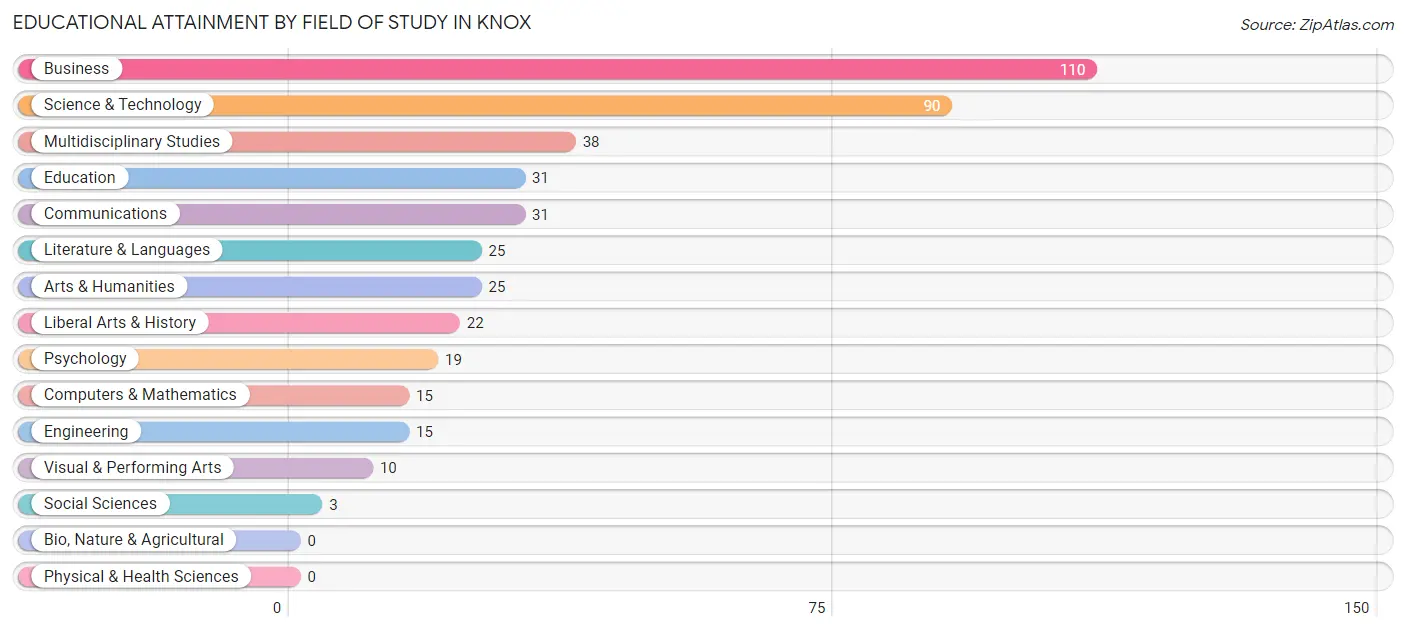
Educational Attainment by Field of Study in Knox
Business (110 | 25.4%), science & technology (90 | 20.7%), multidisciplinary studies (38 | 8.8%), education (31 | 7.1%), and communications (31 | 7.1%) are the most common fields of study among 434 individuals in Knox who have obtained a bachelor's degree or higher.
| Field of Study | # Graduates | % Graduates |
| Computers & Mathematics | 15 | 3.5% |
| Bio, Nature & Agricultural | 0 | 0.0% |
| Physical & Health Sciences | 0 | 0.0% |
| Psychology | 19 | 4.4% |
| Social Sciences | 3 | 0.7% |
| Engineering | 15 | 3.5% |
| Multidisciplinary Studies | 38 | 8.8% |
| Science & Technology | 90 | 20.7% |
| Business | 110 | 25.4% |
| Education | 31 | 7.1% |
| Literature & Languages | 25 | 5.8% |
| Liberal Arts & History | 22 | 5.1% |
| Visual & Performing Arts | 10 | 2.3% |
| Communications | 31 | 7.1% |
| Arts & Humanities | 25 | 5.8% |
| Total | 434 | 100.0% |
Transportation & Commute in Knox
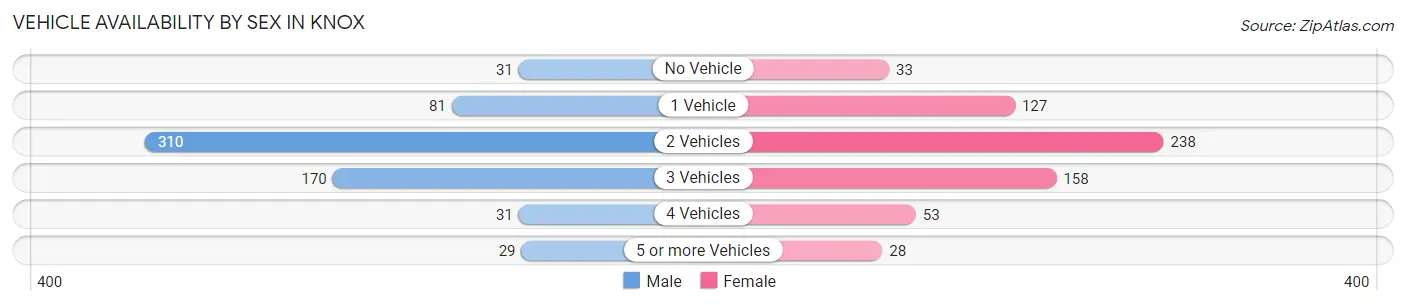
Vehicle Availability by Sex in Knox
The most prevalent vehicle ownership categories in Knox are males with 2 vehicles (310, accounting for 47.5%) and females with 2 vehicles (238, making up 48.7%).
| Vehicles Available | Male | Female |
| No Vehicle | 31 (4.8%) | 33 (5.2%) |
| 1 Vehicle | 81 (12.4%) | 127 (19.9%) |
| 2 Vehicles | 310 (47.5%) | 238 (37.4%) |
| 3 Vehicles | 170 (26.1%) | 158 (24.8%) |
| 4 Vehicles | 31 (4.8%) | 53 (8.3%) |
| 5 or more Vehicles | 29 (4.4%) | 28 (4.4%) |
| Total | 652 (100.0%) | 637 (100.0%) |
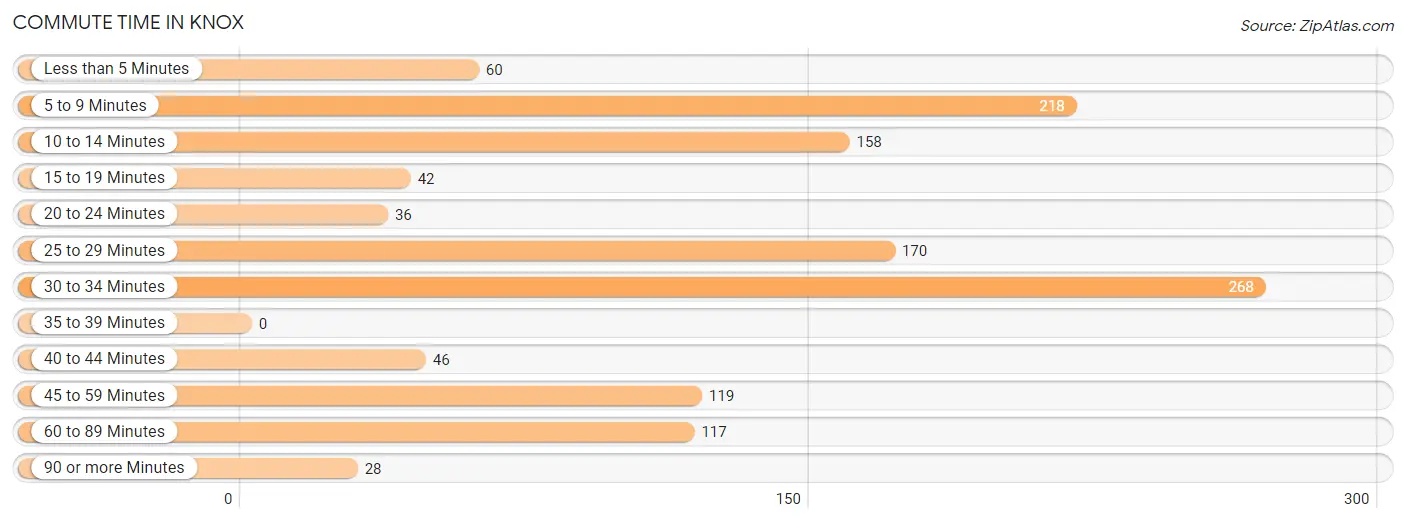
Commute Time in Knox
The most frequently occuring commute durations in Knox are 30 to 34 minutes (268 commuters, 21.2%), 5 to 9 minutes (218 commuters, 17.3%), and 25 to 29 minutes (170 commuters, 13.5%).
| Commute Time | # Commuters | % Commuters |
| Less than 5 Minutes | 60 | 4.8% |
| 5 to 9 Minutes | 218 | 17.3% |
| 10 to 14 Minutes | 158 | 12.5% |
| 15 to 19 Minutes | 42 | 3.3% |
| 20 to 24 Minutes | 36 | 2.9% |
| 25 to 29 Minutes | 170 | 13.5% |
| 30 to 34 Minutes | 268 | 21.2% |
| 35 to 39 Minutes | 0 | 0.0% |
| 40 to 44 Minutes | 46 | 3.6% |
| 45 to 59 Minutes | 119 | 9.4% |
| 60 to 89 Minutes | 117 | 9.3% |
| 90 or more Minutes | 28 | 2.2% |
Commute Time by Sex in Knox
The most common commute times in Knox are 5 to 9 minutes (139 commuters, 21.5%) for males and 30 to 34 minutes (153 commuters, 24.8%) for females.
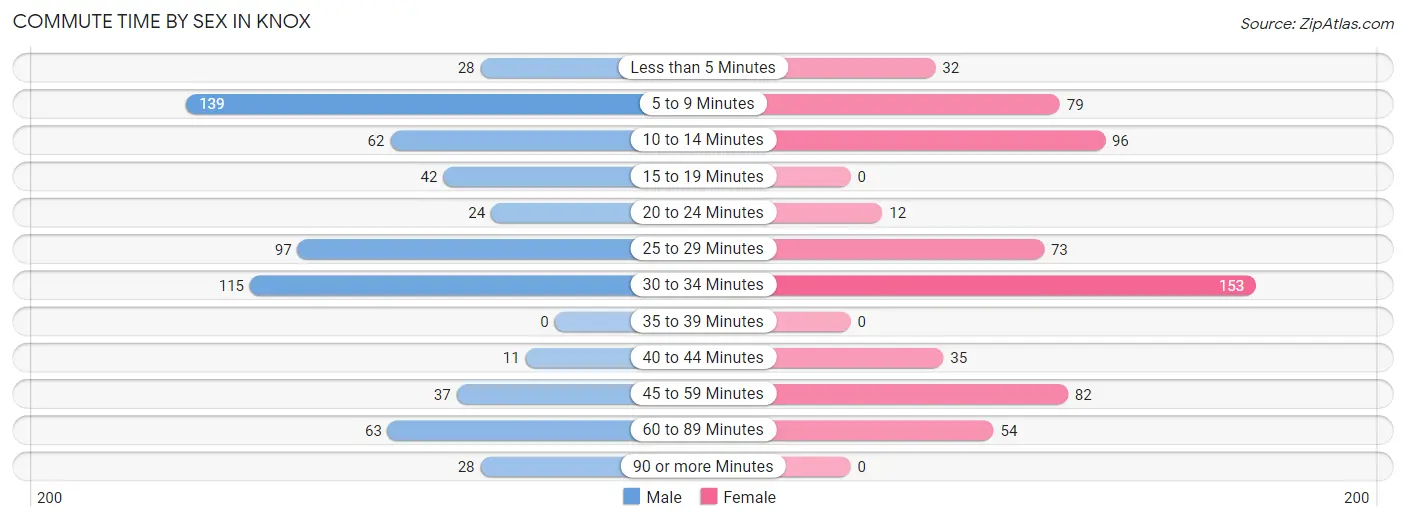
| Commute Time | Male | Female |
| Less than 5 Minutes | 28 (4.3%) | 32 (5.2%) |
| 5 to 9 Minutes | 139 (21.5%) | 79 (12.8%) |
| 10 to 14 Minutes | 62 (9.6%) | 96 (15.6%) |
| 15 to 19 Minutes | 42 (6.5%) | 0 (0.0%) |
| 20 to 24 Minutes | 24 (3.7%) | 12 (1.9%) |
| 25 to 29 Minutes | 97 (15.0%) | 73 (11.8%) |
| 30 to 34 Minutes | 115 (17.8%) | 153 (24.8%) |
| 35 to 39 Minutes | 0 (0.0%) | 0 (0.0%) |
| 40 to 44 Minutes | 11 (1.7%) | 35 (5.7%) |
| 45 to 59 Minutes | 37 (5.7%) | 82 (13.3%) |
| 60 to 89 Minutes | 63 (9.8%) | 54 (8.8%) |
| 90 or more Minutes | 28 (4.3%) | 0 (0.0%) |
Time of Departure to Work by Sex in Knox
The most frequent times of departure to work in Knox are 12:00 PM to 3:59 PM (170, 26.3%) for males and 7:30 AM to 7:59 AM (118, 19.2%) for females.
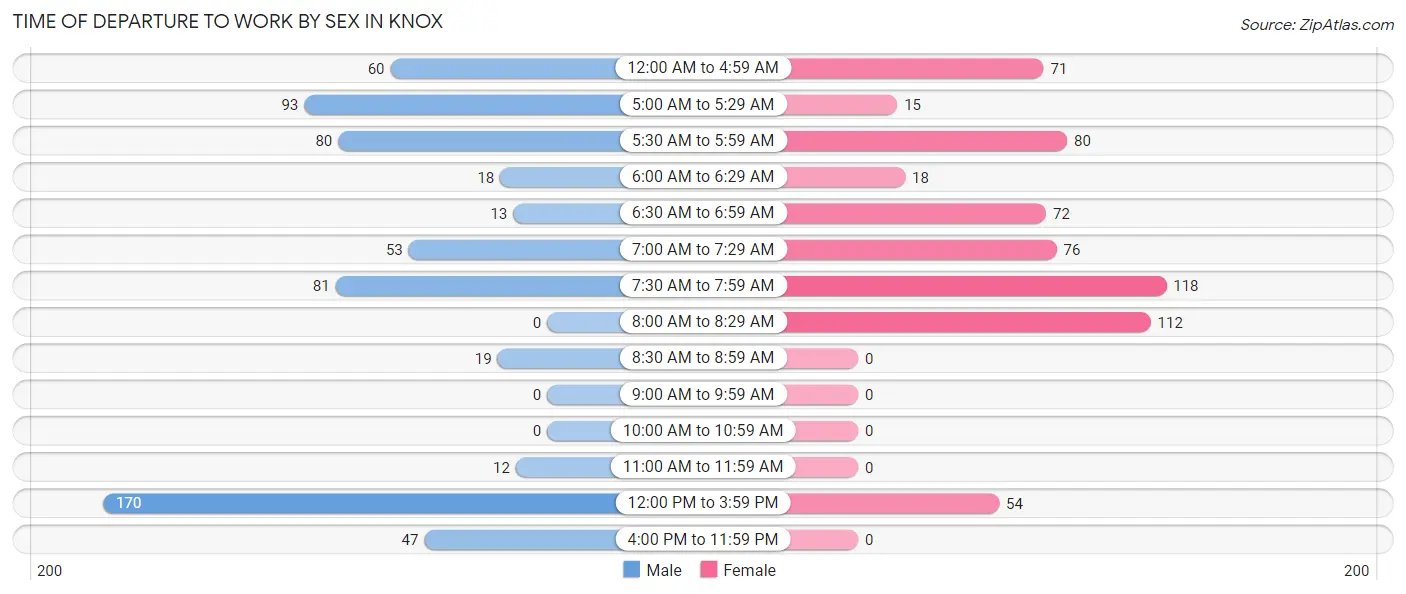
| Time of Departure | Male | Female |
| 12:00 AM to 4:59 AM | 60 (9.3%) | 71 (11.5%) |
| 5:00 AM to 5:29 AM | 93 (14.4%) | 15 (2.4%) |
| 5:30 AM to 5:59 AM | 80 (12.4%) | 80 (13.0%) |
| 6:00 AM to 6:29 AM | 18 (2.8%) | 18 (2.9%) |
| 6:30 AM to 6:59 AM | 13 (2.0%) | 72 (11.7%) |
| 7:00 AM to 7:29 AM | 53 (8.2%) | 76 (12.3%) |
| 7:30 AM to 7:59 AM | 81 (12.5%) | 118 (19.2%) |
| 8:00 AM to 8:29 AM | 0 (0.0%) | 112 (18.2%) |
| 8:30 AM to 8:59 AM | 19 (2.9%) | 0 (0.0%) |
| 9:00 AM to 9:59 AM | 0 (0.0%) | 0 (0.0%) |
| 10:00 AM to 10:59 AM | 0 (0.0%) | 0 (0.0%) |
| 11:00 AM to 11:59 AM | 12 (1.9%) | 0 (0.0%) |
| 12:00 PM to 3:59 PM | 170 (26.3%) | 54 (8.8%) |
| 4:00 PM to 11:59 PM | 47 (7.3%) | 0 (0.0%) |
| Total | 646 (100.0%) | 616 (100.0%) |
Housing Occupancy in Knox
Occupancy by Ownership in Knox
Of the total 1,454 dwellings in Knox, owner-occupied units account for 901 (62.0%), while renter-occupied units make up 553 (38.0%).
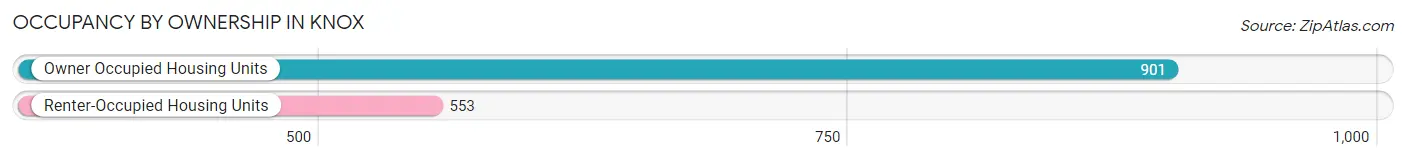
| Occupancy | # Housing Units | % Housing Units |
| Owner Occupied Housing Units | 901 | 62.0% |
| Renter-Occupied Housing Units | 553 | 38.0% |
| Total Occupied Housing Units | 1,454 | 100.0% |
Occupancy by Household Size in Knox
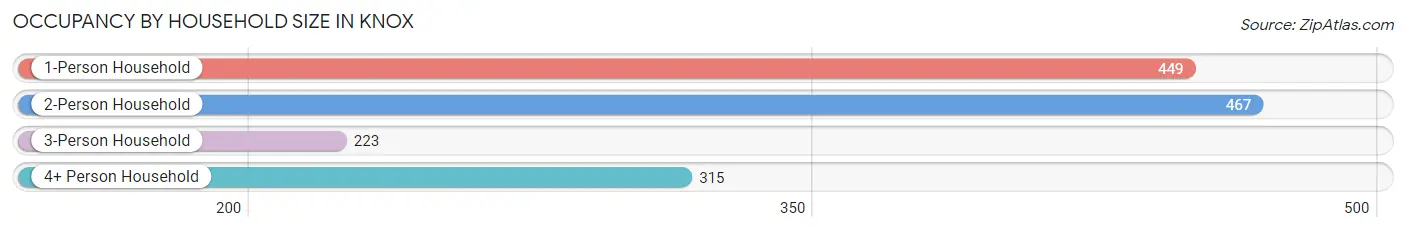
| Household Size | # Housing Units | % Housing Units |
| 1-Person Household | 449 | 30.9% |
| 2-Person Household | 467 | 32.1% |
| 3-Person Household | 223 | 15.3% |
| 4+ Person Household | 315 | 21.7% |
| Total Housing Units | 1,454 | 100.0% |
Occupancy by Ownership by Household Size in Knox
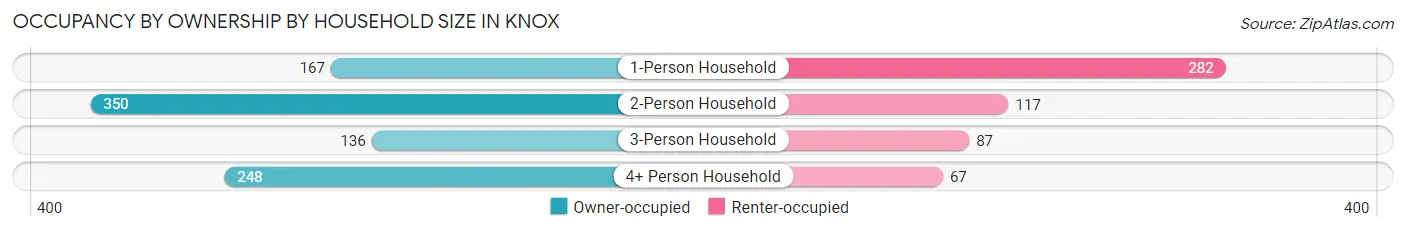
| Household Size | Owner-occupied | Renter-occupied |
| 1-Person Household | 167 (37.2%) | 282 (62.8%) |
| 2-Person Household | 350 (75.0%) | 117 (25.1%) |
| 3-Person Household | 136 (61.0%) | 87 (39.0%) |
| 4+ Person Household | 248 (78.7%) | 67 (21.3%) |
| Total Housing Units | 901 (62.0%) | 553 (38.0%) |
Occupancy by Educational Attainment in Knox
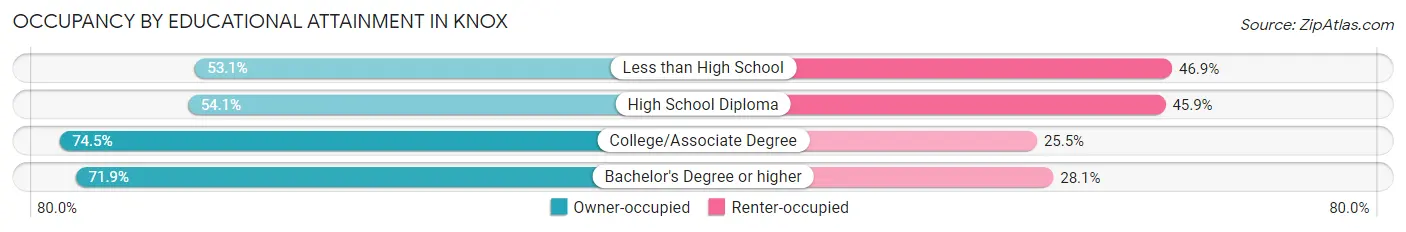
| Household Size | Owner-occupied | Renter-occupied |
| Less than High School | 95 (53.1%) | 84 (46.9%) |
| High School Diploma | 361 (54.1%) | 306 (45.9%) |
| College/Associate Degree | 225 (74.5%) | 77 (25.5%) |
| Bachelor's Degree or higher | 220 (71.9%) | 86 (28.1%) |
Occupancy by Age of Householder in Knox
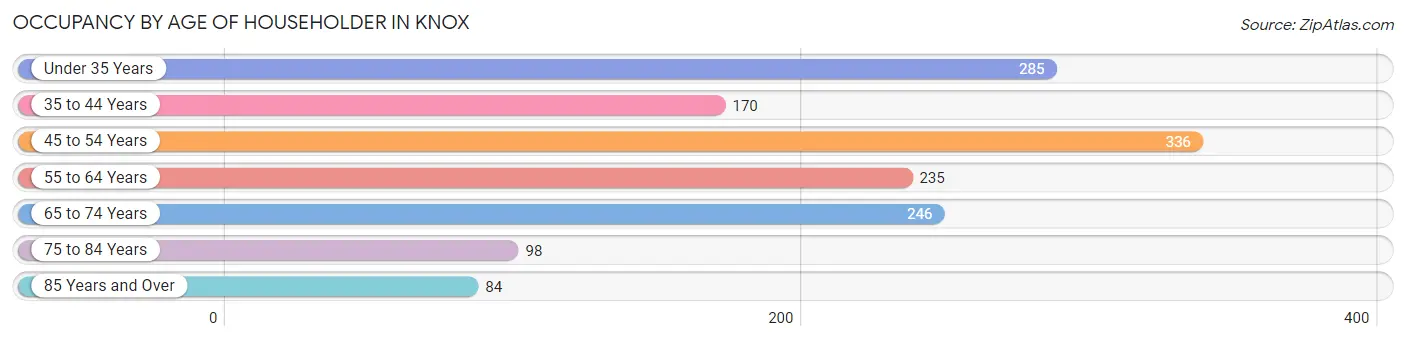
| Age Bracket | # Households | % Households |
| Under 35 Years | 285 | 19.6% |
| 35 to 44 Years | 170 | 11.7% |
| 45 to 54 Years | 336 | 23.1% |
| 55 to 64 Years | 235 | 16.2% |
| 65 to 74 Years | 246 | 16.9% |
| 75 to 84 Years | 98 | 6.7% |
| 85 Years and Over | 84 | 5.8% |
| Total | 1,454 | 100.0% |
Housing Finances in Knox
Median Income by Occupancy in Knox
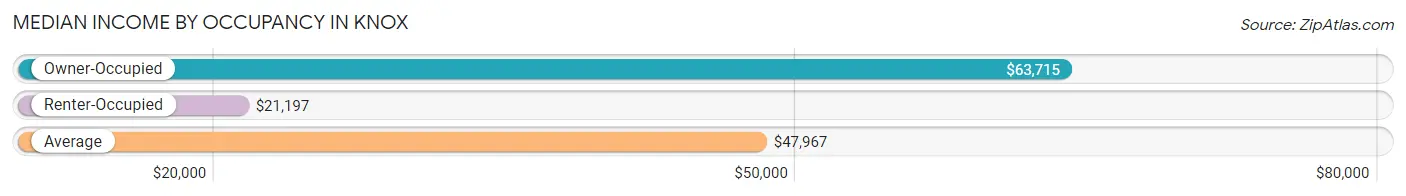
| Occupancy Type | # Households | Median Income |
| Owner-Occupied | 901 (62.0%) | $63,715 |
| Renter-Occupied | 553 (38.0%) | $21,197 |
| Average | 1,454 (100.0%) | $47,967 |
Occupancy by Householder Income Bracket in Knox
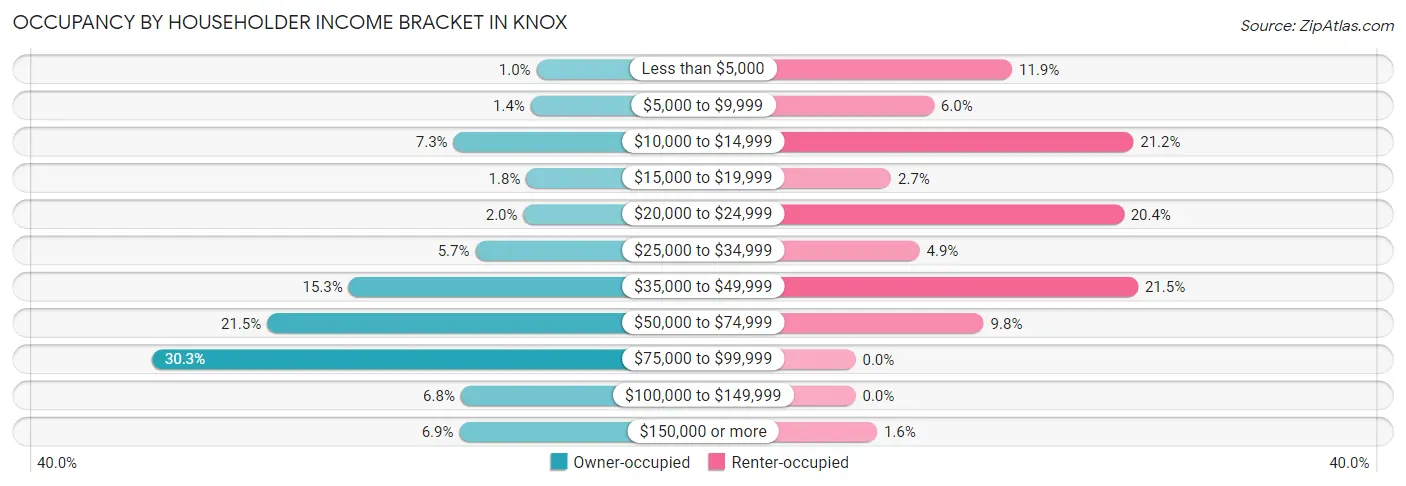
| Income Bracket | Owner-occupied | Renter-occupied |
| Less than $5,000 | 9 (1.0%) | 66 (11.9%) |
| $5,000 to $9,999 | 13 (1.4%) | 33 (6.0%) |
| $10,000 to $14,999 | 66 (7.3%) | 117 (21.2%) |
| $15,000 to $19,999 | 16 (1.8%) | 15 (2.7%) |
| $20,000 to $24,999 | 18 (2.0%) | 113 (20.4%) |
| $25,000 to $34,999 | 51 (5.7%) | 27 (4.9%) |
| $35,000 to $49,999 | 138 (15.3%) | 119 (21.5%) |
| $50,000 to $74,999 | 194 (21.5%) | 54 (9.8%) |
| $75,000 to $99,999 | 273 (30.3%) | 0 (0.0%) |
| $100,000 to $149,999 | 61 (6.8%) | 0 (0.0%) |
| $150,000 or more | 62 (6.9%) | 9 (1.6%) |
| Total | 901 (100.0%) | 553 (100.0%) |
Monthly Housing Cost Tiers in Knox
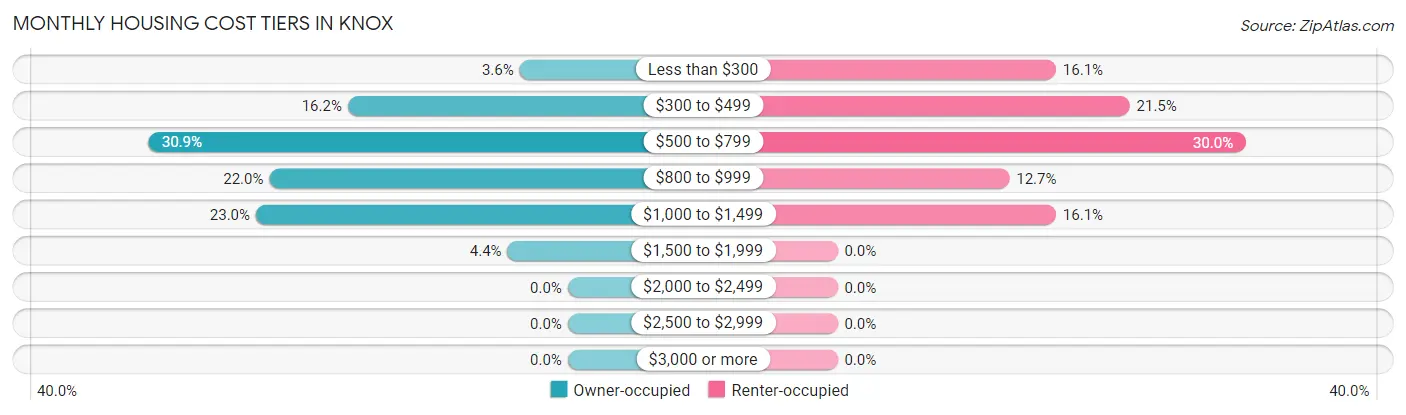
| Monthly Cost | Owner-occupied | Renter-occupied |
| Less than $300 | 32 (3.5%) | 89 (16.1%) |
| $300 to $499 | 146 (16.2%) | 119 (21.5%) |
| $500 to $799 | 278 (30.8%) | 166 (30.0%) |
| $800 to $999 | 198 (22.0%) | 70 (12.7%) |
| $1,000 to $1,499 | 207 (23.0%) | 89 (16.1%) |
| $1,500 to $1,999 | 40 (4.4%) | 0 (0.0%) |
| $2,000 to $2,499 | 0 (0.0%) | 0 (0.0%) |
| $2,500 to $2,999 | 0 (0.0%) | 0 (0.0%) |
| $3,000 or more | 0 (0.0%) | 0 (0.0%) |
| Total | 901 (100.0%) | 553 (100.0%) |
Physical Housing Characteristics in Knox
Housing Structures in Knox
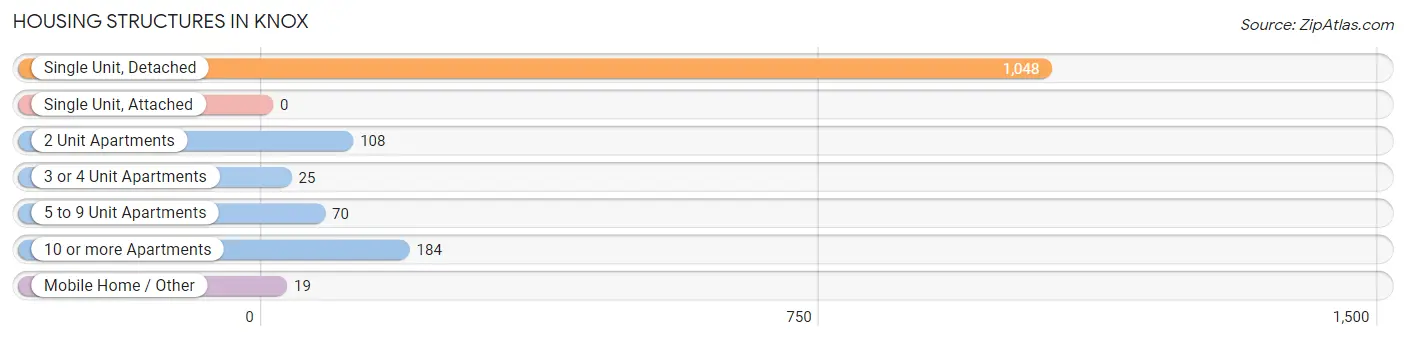
| Structure Type | # Housing Units | % Housing Units |
| Single Unit, Detached | 1,048 | 72.1% |
| Single Unit, Attached | 0 | 0.0% |
| 2 Unit Apartments | 108 | 7.4% |
| 3 or 4 Unit Apartments | 25 | 1.7% |
| 5 to 9 Unit Apartments | 70 | 4.8% |
| 10 or more Apartments | 184 | 12.7% |
| Mobile Home / Other | 19 | 1.3% |
| Total | 1,454 | 100.0% |
Housing Structures by Occupancy in Knox
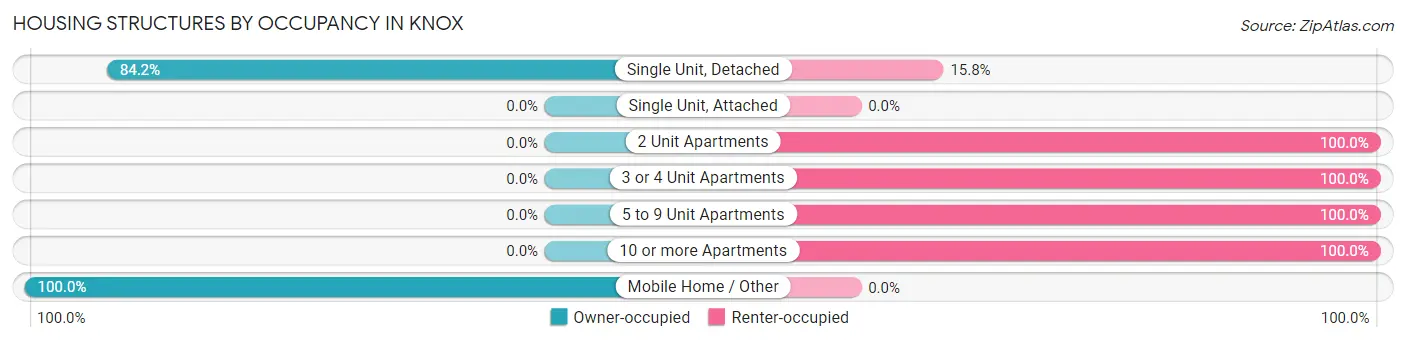
| Structure Type | Owner-occupied | Renter-occupied |
| Single Unit, Detached | 882 (84.2%) | 166 (15.8%) |
| Single Unit, Attached | 0 (0.0%) | 0 (0.0%) |
| 2 Unit Apartments | 0 (0.0%) | 108 (100.0%) |
| 3 or 4 Unit Apartments | 0 (0.0%) | 25 (100.0%) |
| 5 to 9 Unit Apartments | 0 (0.0%) | 70 (100.0%) |
| 10 or more Apartments | 0 (0.0%) | 184 (100.0%) |
| Mobile Home / Other | 19 (100.0%) | 0 (0.0%) |
| Total | 901 (62.0%) | 553 (38.0%) |
Housing Structures by Number of Rooms in Knox
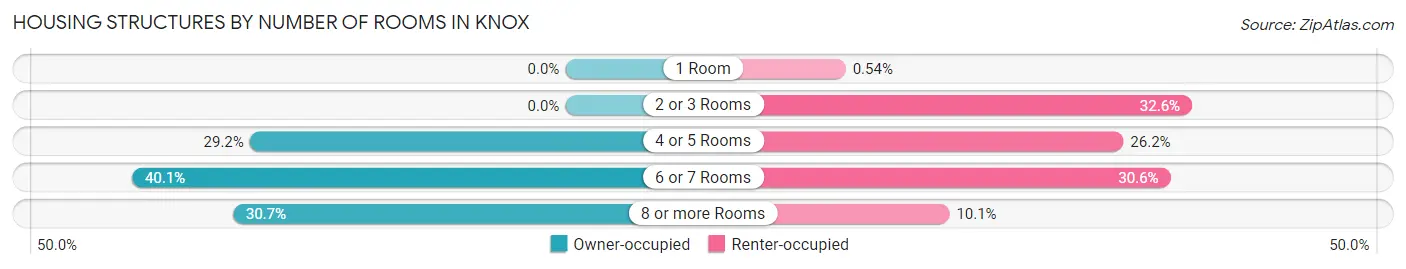
| Number of Rooms | Owner-occupied | Renter-occupied |
| 1 Room | 0 (0.0%) | 3 (0.5%) |
| 2 or 3 Rooms | 0 (0.0%) | 180 (32.6%) |
| 4 or 5 Rooms | 263 (29.2%) | 145 (26.2%) |
| 6 or 7 Rooms | 361 (40.1%) | 169 (30.6%) |
| 8 or more Rooms | 277 (30.7%) | 56 (10.1%) |
| Total | 901 (100.0%) | 553 (100.0%) |
Housing Structure by Heating Type in Knox
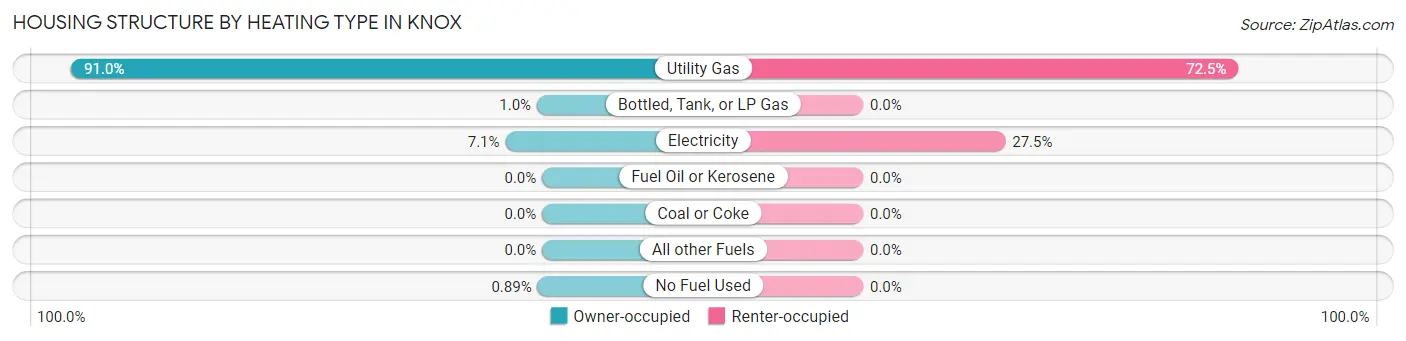
| Heating Type | Owner-occupied | Renter-occupied |
| Utility Gas | 820 (91.0%) | 401 (72.5%) |
| Bottled, Tank, or LP Gas | 9 (1.0%) | 0 (0.0%) |
| Electricity | 64 (7.1%) | 152 (27.5%) |
| Fuel Oil or Kerosene | 0 (0.0%) | 0 (0.0%) |
| Coal or Coke | 0 (0.0%) | 0 (0.0%) |
| All other Fuels | 0 (0.0%) | 0 (0.0%) |
| No Fuel Used | 8 (0.9%) | 0 (0.0%) |
| Total | 901 (100.0%) | 553 (100.0%) |
Household Vehicle Usage in Knox
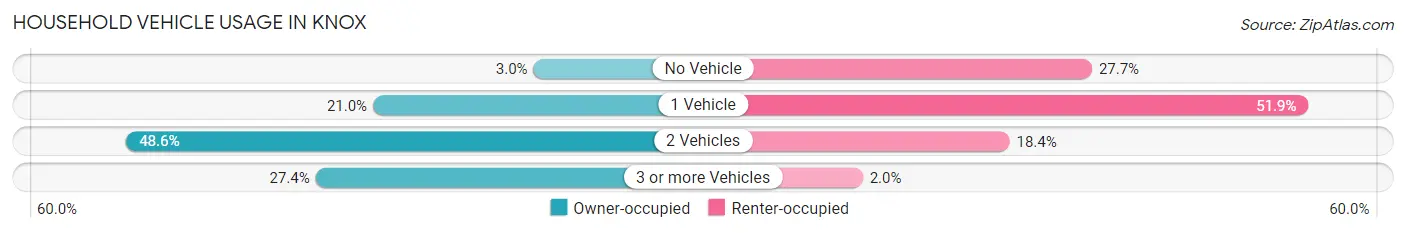
| Vehicles per Household | Owner-occupied | Renter-occupied |
| No Vehicle | 27 (3.0%) | 153 (27.7%) |
| 1 Vehicle | 189 (21.0%) | 287 (51.9%) |
| 2 Vehicles | 438 (48.6%) | 102 (18.4%) |
| 3 or more Vehicles | 247 (27.4%) | 11 (2.0%) |
| Total | 901 (100.0%) | 553 (100.0%) |
Real Estate & Mortgages in Knox
Real Estate and Mortgage Overview in Knox
| Characteristic | Without Mortgage | With Mortgage |
| Housing Units | 385 | 516 |
| Median Property Value | $155,300 | $105,200 |
| Median Household Income | $58,711 | $44 |
| Monthly Housing Costs | $603 | $0 |
| Real Estate Taxes | $853 | $0 |
Property Value by Mortgage Status in Knox
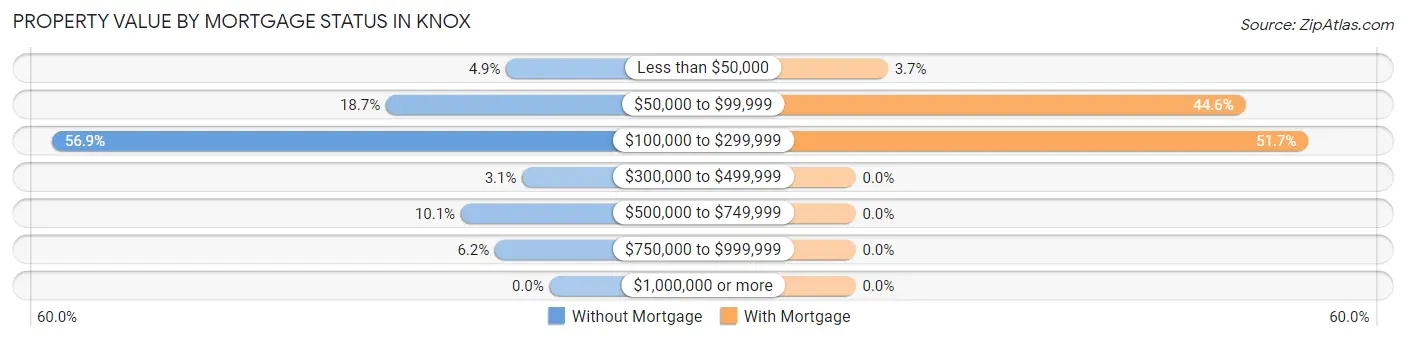
| Property Value | Without Mortgage | With Mortgage |
| Less than $50,000 | 19 (4.9%) | 19 (3.7%) |
| $50,000 to $99,999 | 72 (18.7%) | 230 (44.6%) |
| $100,000 to $299,999 | 219 (56.9%) | 267 (51.7%) |
| $300,000 to $499,999 | 12 (3.1%) | 0 (0.0%) |
| $500,000 to $749,999 | 39 (10.1%) | 0 (0.0%) |
| $750,000 to $999,999 | 24 (6.2%) | 0 (0.0%) |
| $1,000,000 or more | 0 (0.0%) | 0 (0.0%) |
| Total | 385 (100.0%) | 516 (100.0%) |
Household Income by Mortgage Status in Knox
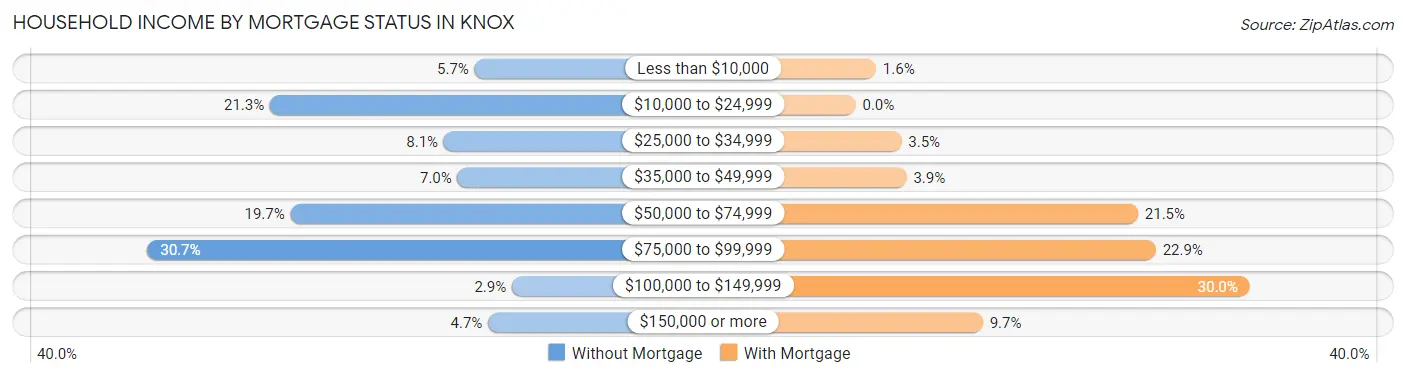
| Household Income | Without Mortgage | With Mortgage |
| Less than $10,000 | 22 (5.7%) | 8 (1.5%) |
| $10,000 to $24,999 | 82 (21.3%) | 0 (0.0%) |
| $25,000 to $34,999 | 31 (8.1%) | 18 (3.5%) |
| $35,000 to $49,999 | 27 (7.0%) | 20 (3.9%) |
| $50,000 to $74,999 | 76 (19.7%) | 111 (21.5%) |
| $75,000 to $99,999 | 118 (30.6%) | 118 (22.9%) |
| $100,000 to $149,999 | 11 (2.9%) | 155 (30.0%) |
| $150,000 or more | 18 (4.7%) | 50 (9.7%) |
| Total | 385 (100.0%) | 516 (100.0%) |
Property Value to Household Income Ratio in Knox
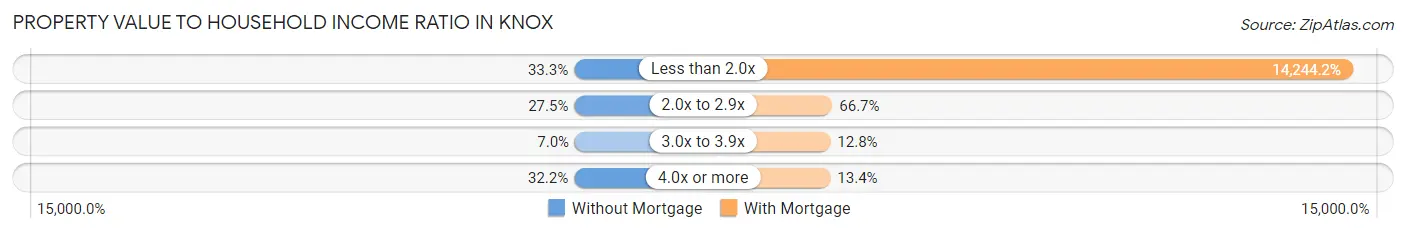
| Value-to-Income Ratio | Without Mortgage | With Mortgage |
| Less than 2.0x | 128 (33.3%) | 73,500 (14,244.2%) |
| 2.0x to 2.9x | 106 (27.5%) | 344 (66.7%) |
| 3.0x to 3.9x | 27 (7.0%) | 66 (12.8%) |
| 4.0x or more | 124 (32.2%) | 69 (13.4%) |
| Total | 385 (100.0%) | 516 (100.0%) |
Real Estate Taxes by Mortgage Status in Knox
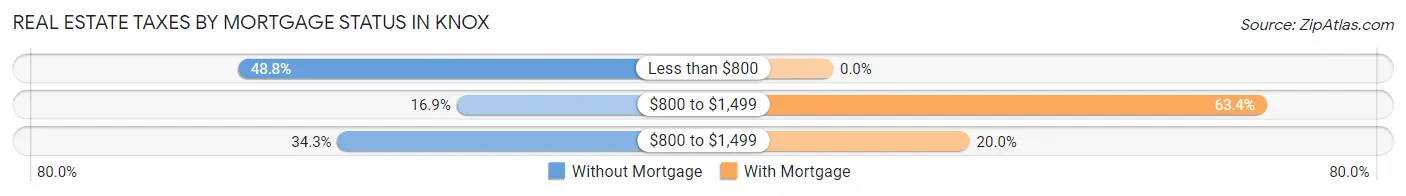
| Property Taxes | Without Mortgage | With Mortgage |
| Less than $800 | 188 (48.8%) | 0 (0.0%) |
| $800 to $1,499 | 65 (16.9%) | 327 (63.4%) |
| $800 to $1,499 | 132 (34.3%) | 103 (20.0%) |
| Total | 385 (100.0%) | 516 (100.0%) |
Health & Disability in Knox
Health Insurance Coverage by Age in Knox
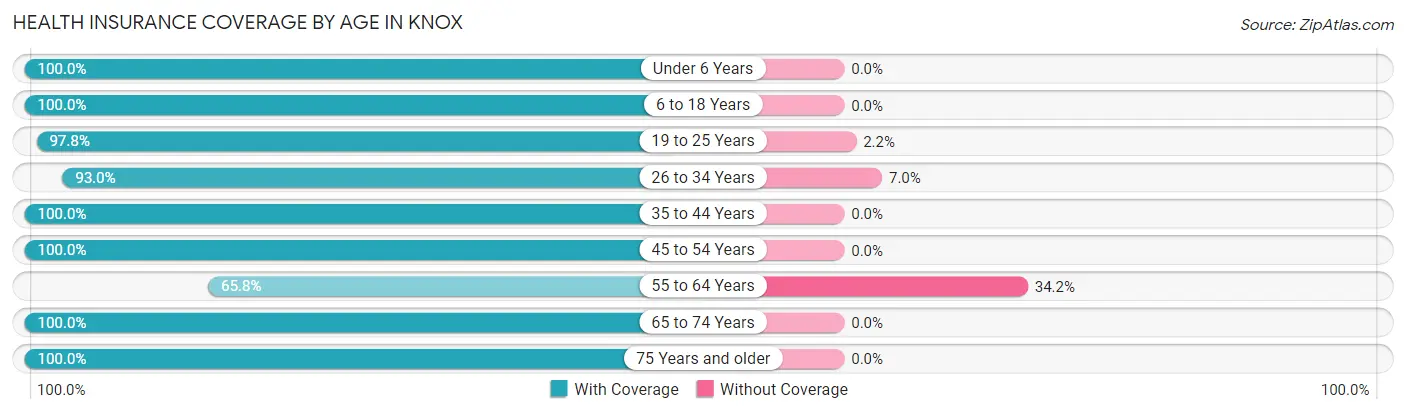
| Age Bracket | With Coverage | Without Coverage |
| Under 6 Years | 286 (100.0%) | 0 (0.0%) |
| 6 to 18 Years | 731 (100.0%) | 0 (0.0%) |
| 19 to 25 Years | 309 (97.8%) | 7 (2.2%) |
| 26 to 34 Years | 436 (93.0%) | 33 (7.0%) |
| 35 to 44 Years | 329 (100.0%) | 0 (0.0%) |
| 45 to 54 Years | 714 (100.0%) | 0 (0.0%) |
| 55 to 64 Years | 246 (65.8%) | 128 (34.2%) |
| 65 to 74 Years | 360 (100.0%) | 0 (0.0%) |
| 75 Years and older | 251 (100.0%) | 0 (0.0%) |
| Total | 3,662 (95.6%) | 168 (4.4%) |
Health Insurance Coverage by Citizenship Status in Knox
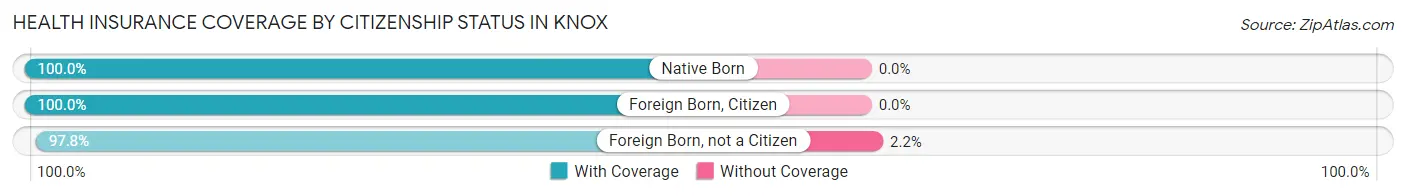
| Citizenship Status | With Coverage | Without Coverage |
| Native Born | 286 (100.0%) | 0 (0.0%) |
| Foreign Born, Citizen | 731 (100.0%) | 0 (0.0%) |
| Foreign Born, not a Citizen | 309 (97.8%) | 7 (2.2%) |
Health Insurance Coverage by Household Income in Knox
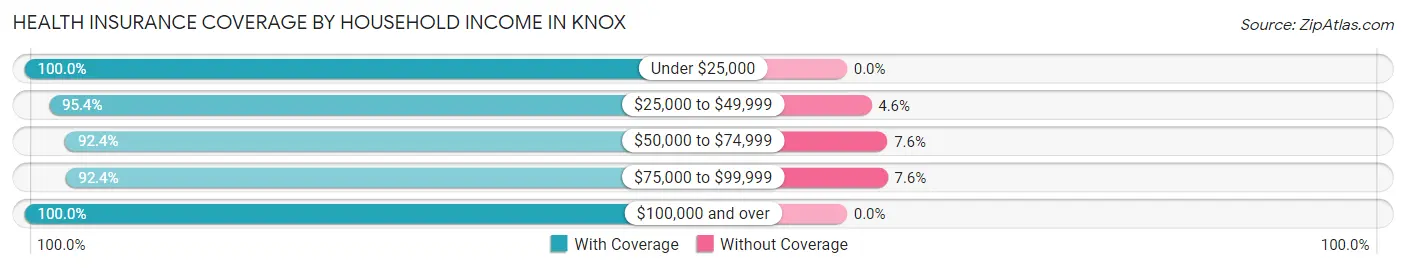
| Household Income | With Coverage | Without Coverage |
| Under $25,000 | 788 (100.0%) | 0 (0.0%) |
| $25,000 to $49,999 | 935 (95.4%) | 45 (4.6%) |
| $50,000 to $74,999 | 768 (92.4%) | 63 (7.6%) |
| $75,000 to $99,999 | 726 (92.4%) | 60 (7.6%) |
| $100,000 and over | 426 (100.0%) | 0 (0.0%) |
Public vs Private Health Insurance Coverage by Age in Knox
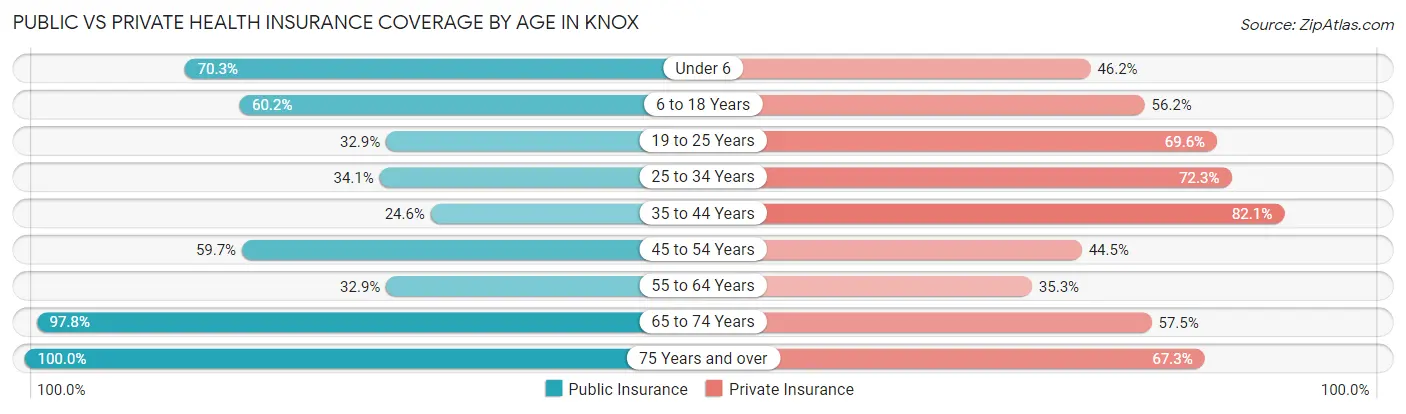
| Age Bracket | Public Insurance | Private Insurance |
| Under 6 | 201 (70.3%) | 132 (46.2%) |
| 6 to 18 Years | 440 (60.2%) | 411 (56.2%) |
| 19 to 25 Years | 104 (32.9%) | 220 (69.6%) |
| 25 to 34 Years | 160 (34.1%) | 339 (72.3%) |
| 35 to 44 Years | 81 (24.6%) | 270 (82.1%) |
| 45 to 54 Years | 426 (59.7%) | 318 (44.5%) |
| 55 to 64 Years | 123 (32.9%) | 132 (35.3%) |
| 65 to 74 Years | 352 (97.8%) | 207 (57.5%) |
| 75 Years and over | 251 (100.0%) | 169 (67.3%) |
| Total | 2,138 (55.8%) | 2,198 (57.4%) |
Disability Status by Sex by Age in Knox
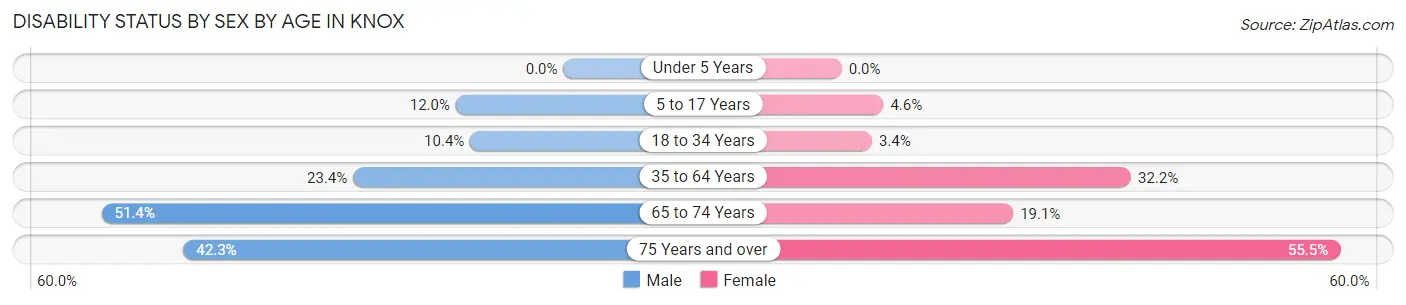
| Age Bracket | Male | Female |
| Under 5 Years | 0 (0.0%) | 0 (0.0%) |
| 5 to 17 Years | 49 (12.0%) | 17 (4.6%) |
| 18 to 34 Years | 46 (10.4%) | 12 (3.4%) |
| 35 to 64 Years | 137 (23.4%) | 268 (32.2%) |
| 65 to 74 Years | 72 (51.4%) | 42 (19.1%) |
| 75 Years and over | 33 (42.3%) | 96 (55.5%) |
Disability Class by Sex by Age in Knox
Disability Class: Hearing Difficulty
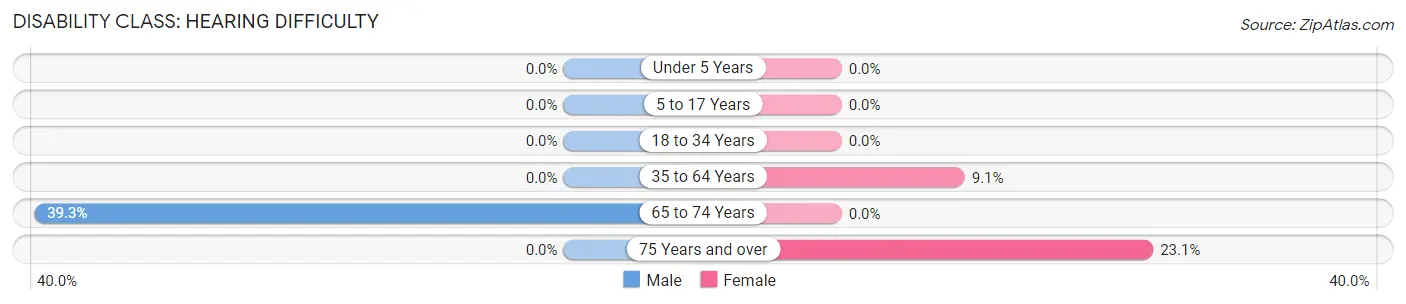
| Age Bracket | Male | Female |
| Under 5 Years | 0 (0.0%) | 0 (0.0%) |
| 5 to 17 Years | 0 (0.0%) | 0 (0.0%) |
| 18 to 34 Years | 0 (0.0%) | 0 (0.0%) |
| 35 to 64 Years | 0 (0.0%) | 76 (9.1%) |
| 65 to 74 Years | 55 (39.3%) | 0 (0.0%) |
| 75 Years and over | 0 (0.0%) | 40 (23.1%) |
Disability Class: Vision Difficulty
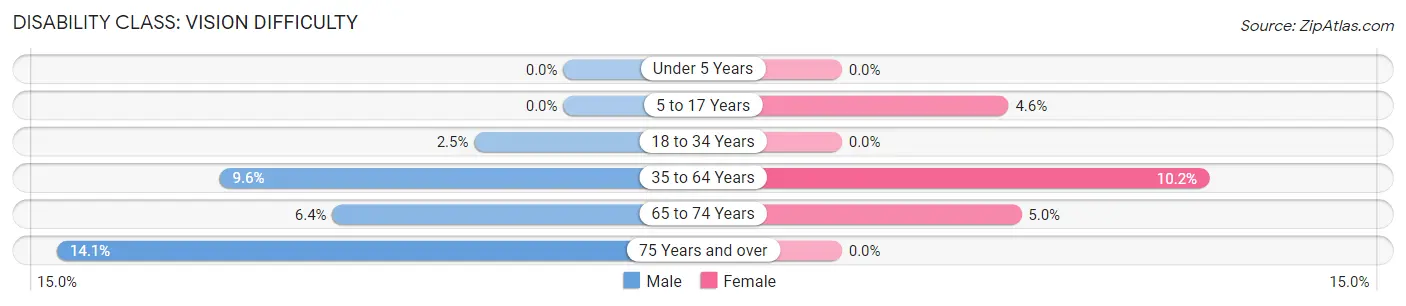
| Age Bracket | Male | Female |
| Under 5 Years | 0 (0.0%) | 0 (0.0%) |
| 5 to 17 Years | 0 (0.0%) | 17 (4.6%) |
| 18 to 34 Years | 11 (2.5%) | 0 (0.0%) |
| 35 to 64 Years | 56 (9.6%) | 85 (10.2%) |
| 65 to 74 Years | 9 (6.4%) | 11 (5.0%) |
| 75 Years and over | 11 (14.1%) | 0 (0.0%) |
Disability Class: Cognitive Difficulty
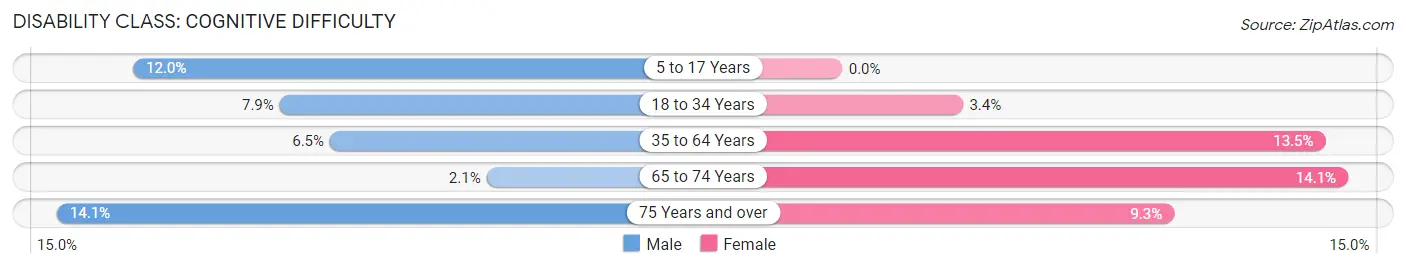
| Age Bracket | Male | Female |
| 5 to 17 Years | 49 (12.0%) | 0 (0.0%) |
| 18 to 34 Years | 35 (7.9%) | 12 (3.4%) |
| 35 to 64 Years | 38 (6.5%) | 112 (13.5%) |
| 65 to 74 Years | 3 (2.1%) | 31 (14.1%) |
| 75 Years and over | 11 (14.1%) | 16 (9.2%) |
Disability Class: Ambulatory Difficulty
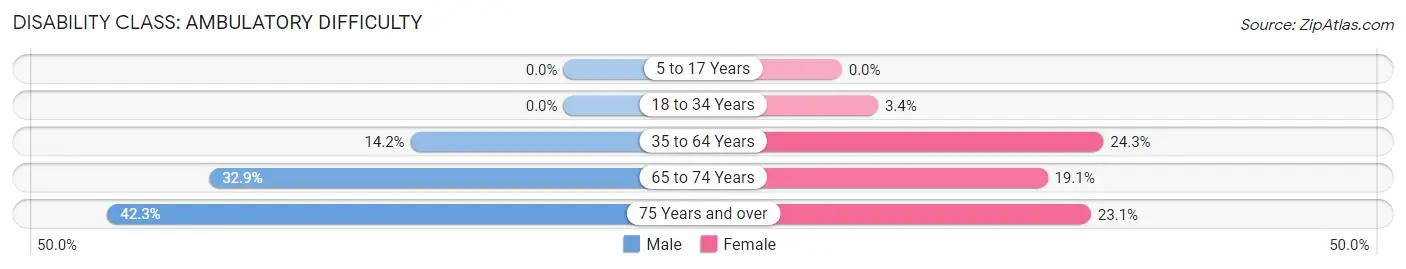
| Age Bracket | Male | Female |
| 5 to 17 Years | 0 (0.0%) | 0 (0.0%) |
| 18 to 34 Years | 0 (0.0%) | 12 (3.4%) |
| 35 to 64 Years | 83 (14.2%) | 202 (24.3%) |
| 65 to 74 Years | 46 (32.9%) | 42 (19.1%) |
| 75 Years and over | 33 (42.3%) | 40 (23.1%) |
Disability Class: Self-Care Difficulty
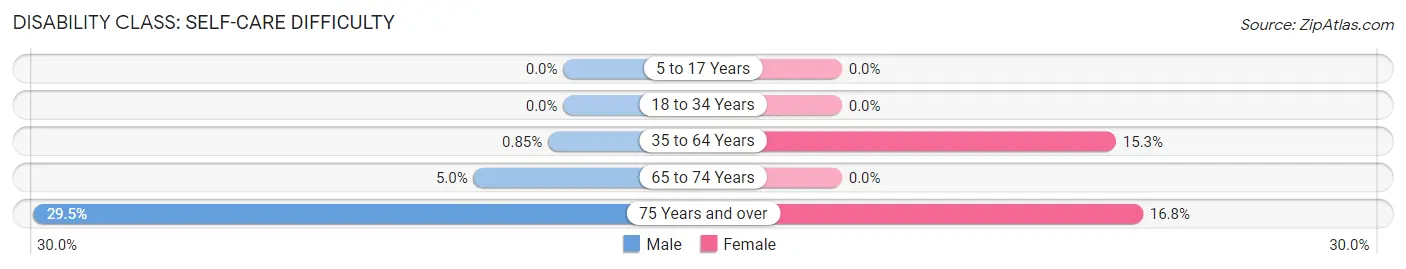
| Age Bracket | Male | Female |
| 5 to 17 Years | 0 (0.0%) | 0 (0.0%) |
| 18 to 34 Years | 0 (0.0%) | 0 (0.0%) |
| 35 to 64 Years | 5 (0.9%) | 127 (15.3%) |
| 65 to 74 Years | 7 (5.0%) | 0 (0.0%) |
| 75 Years and over | 23 (29.5%) | 29 (16.8%) |
Technology Access in Knox
Computing Device Access in Knox
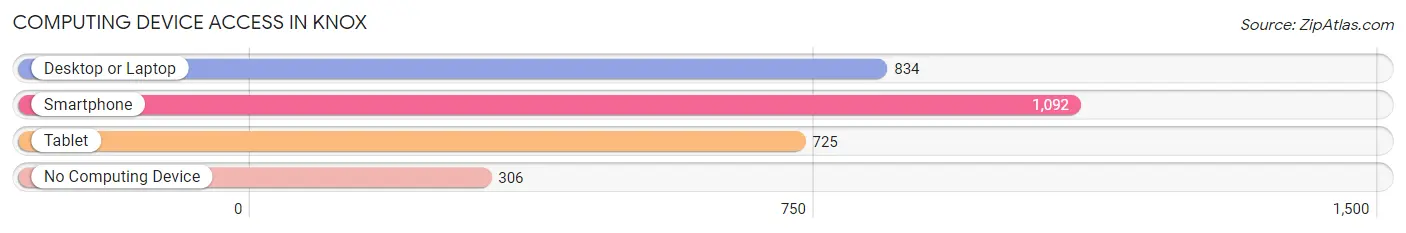
| Device Type | # Households | % Households |
| Desktop or Laptop | 834 | 57.4% |
| Smartphone | 1,092 | 75.1% |
| Tablet | 725 | 49.9% |
| No Computing Device | 306 | 21.0% |
| Total | 1,454 | 100.0% |
Internet Access in Knox
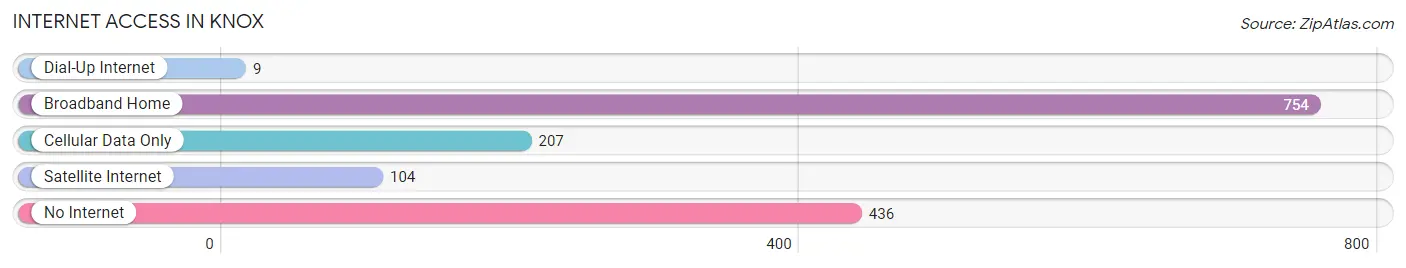
| Internet Type | # Households | % Households |
| Dial-Up Internet | 9 | 0.6% |
| Broadband Home | 754 | 51.9% |
| Cellular Data Only | 207 | 14.2% |
| Satellite Internet | 104 | 7.1% |
| No Internet | 436 | 30.0% |
| Total | 1,454 | 100.0% |
Knox Summary
Knox, Indiana is a small city located in Starke County, Indiana. It is situated in the northern part of the state, approximately 50 miles from the state capital of Indianapolis. The city has a population of approximately 3,500 people and is the county seat of Starke County.
Knox was founded in 1851 by a group of settlers from Ohio. The city was named after General Henry Knox, a Revolutionary War hero. The city was incorporated in 1867 and has since grown to become a thriving community.
Geographically, Knox is located in the northern part of Indiana, in the Tippecanoe River Valley. The city is situated on the banks of the Tippecanoe River, which provides a scenic backdrop to the city. The city is surrounded by rolling hills and farmland, and is home to several parks and recreational areas.
The economy of Knox is largely based on agriculture and manufacturing. The city is home to several large agricultural operations, including a large dairy farm and a large hog farm. The city also has several manufacturing plants, including a paper mill and a plastics factory. The city also has a number of small businesses, including restaurants, retail stores, and service providers.
The demographics of Knox are largely white, with a small percentage of African Americans and Hispanics. The median household income in Knox is approximately $40,000, and the median home value is approximately $90,000. The city has a low unemployment rate, and the poverty rate is below the national average.
Knox is served by the Starke County School District, which includes four elementary schools, one middle school, and one high school. The city also has a number of private schools, including a Catholic school and a Lutheran school. The city is also home to a branch of Ivy Tech Community College.
Knox is a small city with a rich history and a vibrant economy. The city is home to a diverse population and is a great place to live and work. The city is home to a number of parks and recreational areas, and is a great place to raise a family.
Common Questions
What is the Total Population of Knox?
Total Population of Knox is 3,847.
What is the Total Male Population of Knox?
Total Male Population of Knox is 1,794.
What is the Total Female Population of Knox?
Total Female Population of Knox is 2,053.
What is the Ratio of Males per 100 Females in Knox?
There are 87.38 Males per 100 Females in Knox.
What is the Ratio of Females per 100 Males in Knox?
There are 114.44 Females per 100 Males in Knox.
What is the Median Population Age in Knox?
Median Population Age in Knox is 40.4 Years.
What is the Average Family Size in Knox
Average Family Size in Knox is 3.3 People.
What is the Average Household Size in Knox
Average Household Size in Knox is 2.6 People.
What is Per Capita Income in Knox?
Per Capita income in Knox is $21,125.
What is the Median Family Income in Knox?
Median Family Income in Knox is $55,938.
What is the Median Household income in Knox?
Median Household Income in Knox is $47,967.
What is Income or Wage Gap in Knox?
Income or Wage Gap in Knox is 26.8%.
Women in Knox earn 73.2 cents for every dollar earned by a man.
What is Inequality or Gini Index in Knox?
Inequality or Gini Index in Knox is 0.44.
How Large is the Labor Force in Knox?
There are 1,372 People in the Labor Forcein in Knox.
What is the Percentage of People in the Labor Force in Knox?
47.3% of People are in the Labor Force in Knox.
What is the Unemployment Rate in Knox?
Unemployment Rate in Knox is 2.7%.