Plymouth, IN
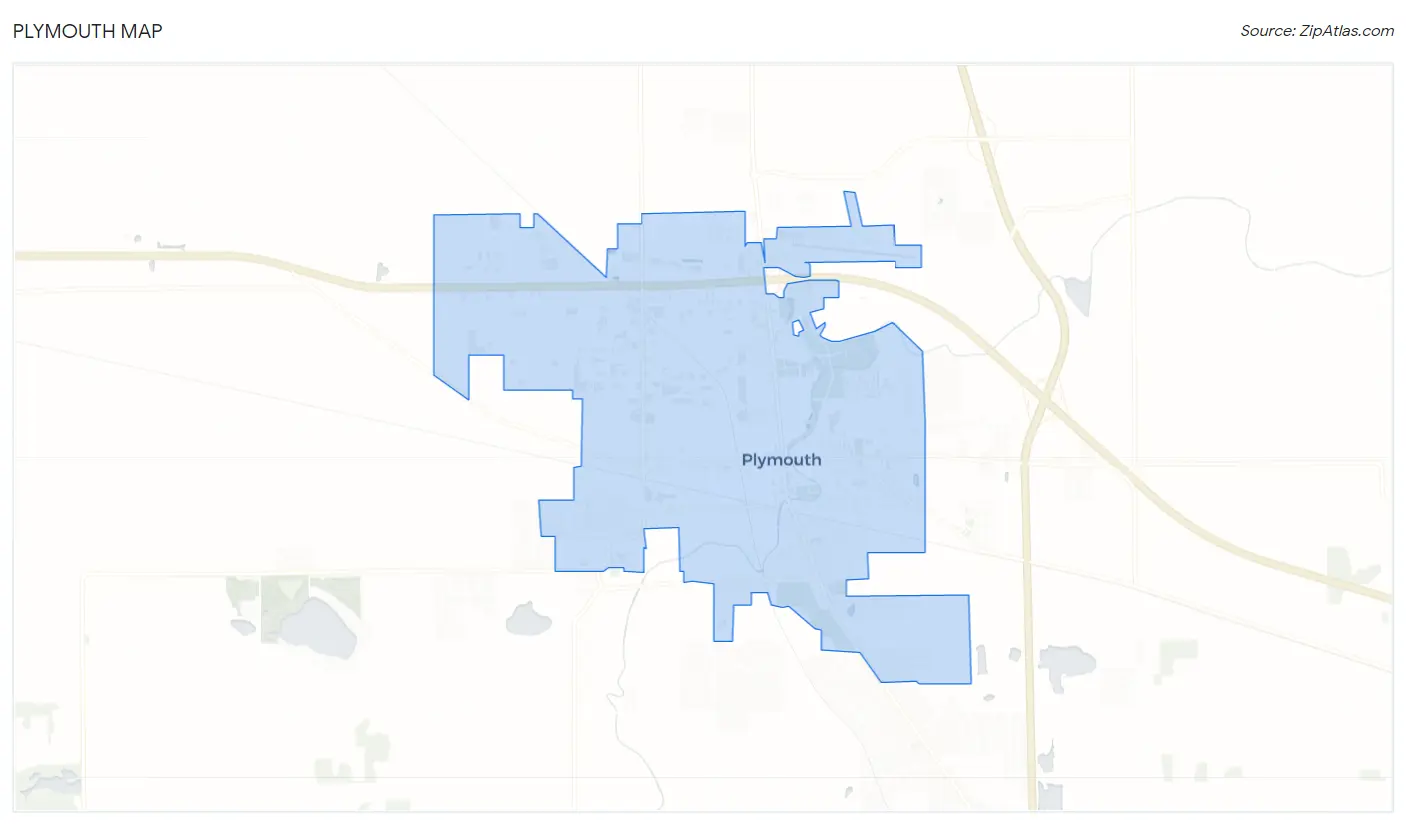
Plymouth Map
Plymouth Overview
10,369
TOTAL POPULATION
5,294
MALE POPULATION
5,075
FEMALE POPULATION
104.32
MALES / 100 FEMALES
95.86
FEMALES / 100 MALES
35.4
MEDIAN AGE
3.5
AVG FAMILY SIZE
2.6
AVG HOUSEHOLD SIZE
$26,797
PER CAPITA INCOME
$73,346
AVG FAMILY INCOME
$49,306
AVG HOUSEHOLD INCOME
21.8%
WAGE / INCOME GAP [ % ]
78.2¢/ $1
WAGE / INCOME GAP [ $ ]
0.44
INEQUALITY / GINI INDEX
4,945
LABOR FORCE [ PEOPLE ]
62.0%
PERCENT IN LABOR FORCE
4.5%
UNEMPLOYMENT RATE
Plymouth Zip Codes
Plymouth Area Codes
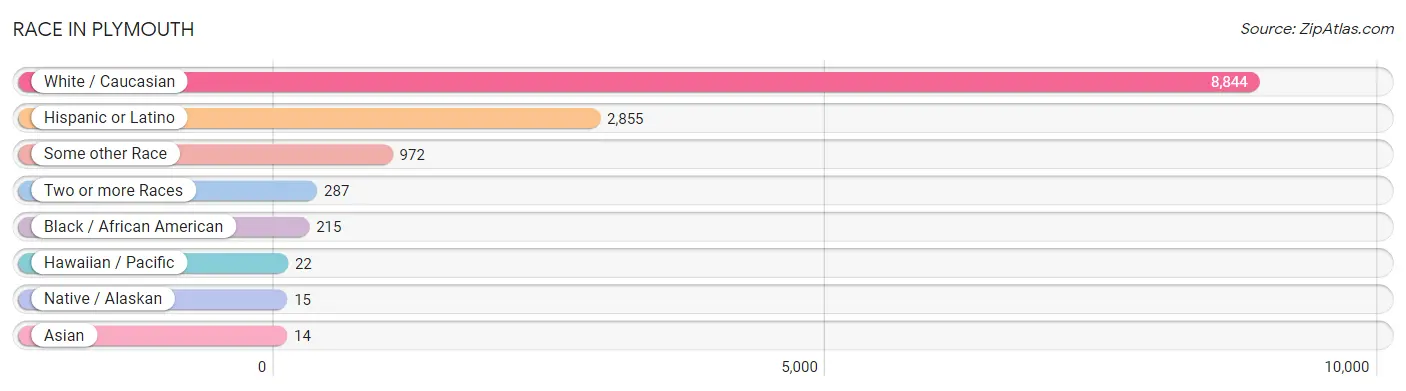
Race in Plymouth
The most populous races in Plymouth are White / Caucasian (8,844 | 85.3%), Hispanic or Latino (2,855 | 27.5%), and Some other Race (972 | 9.4%).
| Race | # Population | % Population |
| Asian | 14 | 0.1% |
| Black / African American | 215 | 2.1% |
| Hawaiian / Pacific | 22 | 0.2% |
| Hispanic or Latino | 2,855 | 27.5% |
| Native / Alaskan | 15 | 0.1% |
| White / Caucasian | 8,844 | 85.3% |
| Two or more Races | 287 | 2.8% |
| Some other Race | 972 | 9.4% |
| Total | 10,369 | 100.0% |
Ancestry in Plymouth
The most populous ancestries reported in Plymouth are Mexican (1,933 | 18.6%), German (1,488 | 14.3%), Central American (837 | 8.1%), Honduran (806 | 7.8%), and Irish (583 | 5.6%), together accounting for 54.4% of all Plymouth residents.
| Ancestry | # Population | % Population |
| African | 22 | 0.2% |
| American | 421 | 4.1% |
| Central American | 837 | 8.1% |
| Cherokee | 4 | 0.0% |
| Croatian | 15 | 0.1% |
| Dutch | 82 | 0.8% |
| Dutch West Indian | 13 | 0.1% |
| English | 511 | 4.9% |
| European | 88 | 0.9% |
| French | 104 | 1.0% |
| German | 1,488 | 14.3% |
| Guatemalan | 31 | 0.3% |
| Honduran | 806 | 7.8% |
| Hungarian | 19 | 0.2% |
| Indian (Asian) | 3 | 0.0% |
| Irish | 583 | 5.6% |
| Italian | 40 | 0.4% |
| Korean | 9 | 0.1% |
| Mexican | 1,933 | 18.6% |
| Navajo | 15 | 0.1% |
| Northern European | 14 | 0.1% |
| Norwegian | 41 | 0.4% |
| Pennsylvania German | 18 | 0.2% |
| Polish | 415 | 4.0% |
| Puerto Rican | 69 | 0.7% |
| Russian | 99 | 0.9% |
| Scandinavian | 24 | 0.2% |
| Scotch-Irish | 123 | 1.2% |
| Scottish | 47 | 0.4% |
| Sri Lankan | 3 | 0.0% |
| Subsaharan African | 22 | 0.2% |
| Swedish | 65 | 0.6% |
| Swiss | 27 | 0.3% |
| Thai | 15 | 0.1% |
| Turkish | 1 | 0.0% |
| Welsh | 24 | 0.2% |
| West Indian | 2 | 0.0% | View All 37 Rows |
Immigrants in Plymouth
The most numerous immigrant groups reported in Plymouth came from Latin America (1,346 | 13.0%), Central America (1,344 | 13.0%), Mexico (787 | 7.6%), Honduras (526 | 5.1%), and Europe (63 | 0.6%), together accounting for 39.2% of all Plymouth residents.
| Immigration Origin | # Population | % Population |
| Asia | 9 | 0.1% |
| Central America | 1,344 | 13.0% |
| Eastern Europe | 35 | 0.3% |
| Europe | 63 | 0.6% |
| Germany | 28 | 0.3% |
| Guatemala | 31 | 0.3% |
| Guyana | 2 | 0.0% |
| Honduras | 526 | 5.1% |
| Latin America | 1,346 | 13.0% |
| Mexico | 787 | 7.6% |
| Philippines | 9 | 0.1% |
| Russia | 35 | 0.3% |
| South America | 2 | 0.0% |
| South Eastern Asia | 9 | 0.1% |
| Western Europe | 28 | 0.3% | View All 15 Rows |
Sex and Age in Plymouth
Sex and Age in Plymouth
The most populous age groups in Plymouth are 15 to 19 Years (529 | 10.0%) for men and 35 to 39 Years (399 | 7.9%) for women.
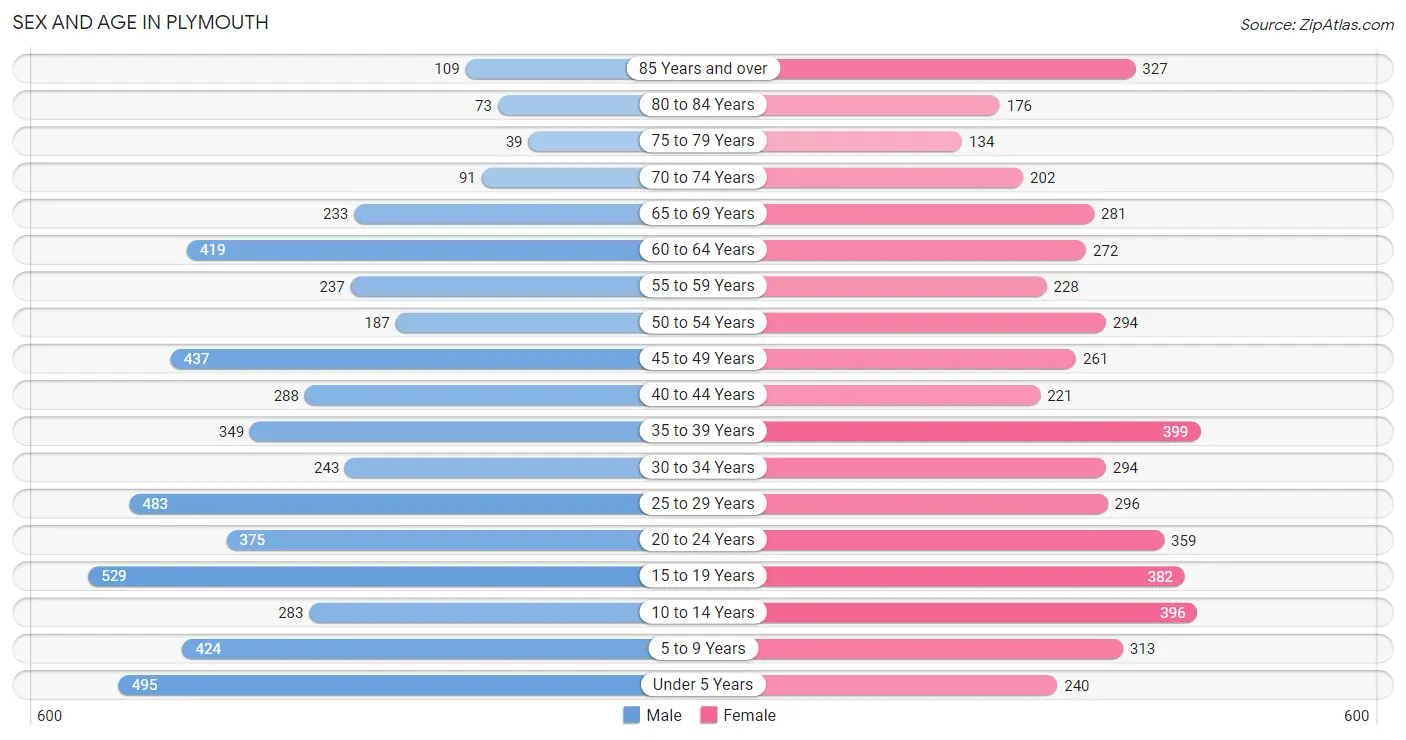
| Age Bracket | Male | Female |
| Under 5 Years | 495 (9.3%) | 240 (4.7%) |
| 5 to 9 Years | 424 (8.0%) | 313 (6.2%) |
| 10 to 14 Years | 283 (5.3%) | 396 (7.8%) |
| 15 to 19 Years | 529 (10.0%) | 382 (7.5%) |
| 20 to 24 Years | 375 (7.1%) | 359 (7.1%) |
| 25 to 29 Years | 483 (9.1%) | 296 (5.8%) |
| 30 to 34 Years | 243 (4.6%) | 294 (5.8%) |
| 35 to 39 Years | 349 (6.6%) | 399 (7.9%) |
| 40 to 44 Years | 288 (5.4%) | 221 (4.3%) |
| 45 to 49 Years | 437 (8.3%) | 261 (5.1%) |
| 50 to 54 Years | 187 (3.5%) | 294 (5.8%) |
| 55 to 59 Years | 237 (4.5%) | 228 (4.5%) |
| 60 to 64 Years | 419 (7.9%) | 272 (5.4%) |
| 65 to 69 Years | 233 (4.4%) | 281 (5.5%) |
| 70 to 74 Years | 91 (1.7%) | 202 (4.0%) |
| 75 to 79 Years | 39 (0.7%) | 134 (2.6%) |
| 80 to 84 Years | 73 (1.4%) | 176 (3.5%) |
| 85 Years and over | 109 (2.1%) | 327 (6.4%) |
| Total | 5,294 (100.0%) | 5,075 (100.0%) |
Families and Households in Plymouth
Median Family Size in Plymouth
The median family size in Plymouth is 3.51 persons per family, with married-couple families (1,471 | 68.0%) accounting for the largest median family size of 3.78 persons per family. On the other hand, single male/father families (324 | 15.0%) represent the smallest median family size with 1.99 persons per family.
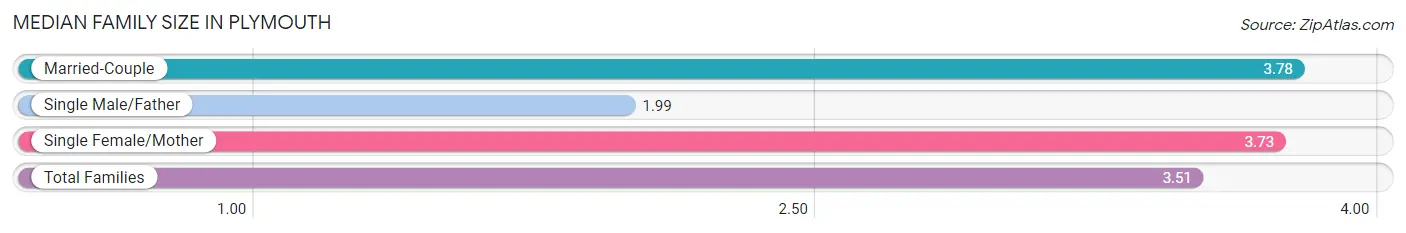
| Family Type | # Families | Family Size |
| Married-Couple | 1,471 (68.0%) | 3.78 |
| Single Male/Father | 324 (15.0%) | 1.99 |
| Single Female/Mother | 368 (17.0%) | 3.73 |
| Total Families | 2,163 (100.0%) | 3.51 |
Median Household Size in Plymouth
The median household size in Plymouth is 2.58 persons per household, with single female/mother households (368 | 9.5%) accounting for the largest median household size of 3.97 persons per household. non-family households (1,705 | 44.1%) represent the smallest median household size with 1.20 persons per household.
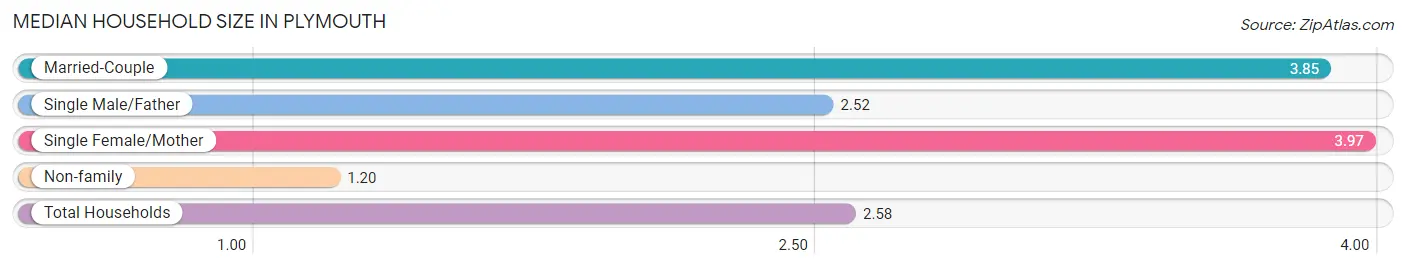
| Household Type | # Households | Household Size |
| Married-Couple | 1,471 (38.0%) | 3.85 |
| Single Male/Father | 324 (8.4%) | 2.52 |
| Single Female/Mother | 368 (9.5%) | 3.97 |
| Non-family | 1,705 (44.1%) | 1.20 |
| Total Households | 3,868 (100.0%) | 2.58 |
Household Size by Marriage Status in Plymouth
Out of a total of 3,868 households in Plymouth, 2,163 (55.9%) are family households, while 1,705 (44.1%) are nonfamily households. The most numerous type of family households are 2-person households, comprising 718, and the most common type of nonfamily households are 1-person households, comprising 1,466.
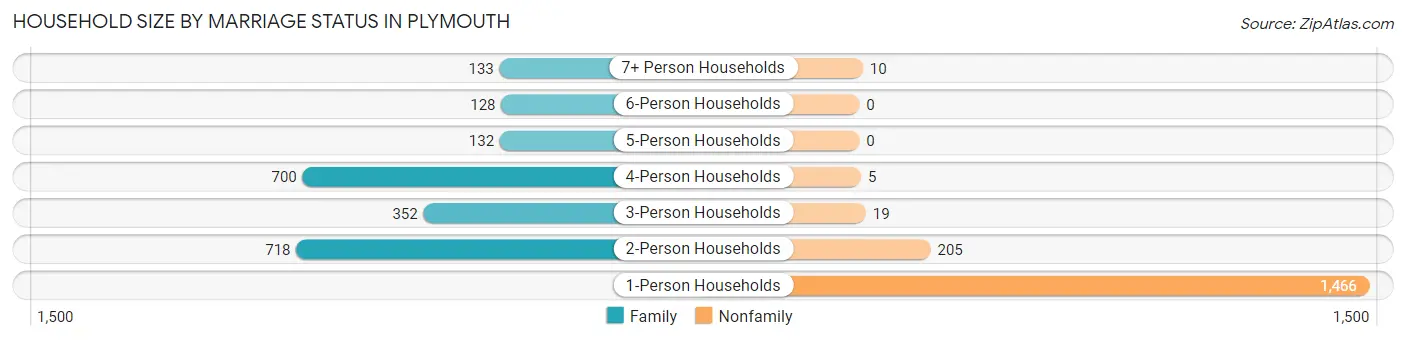
| Household Size | Family Households | Nonfamily Households |
| 1-Person Households | - | 1,466 (37.9%) |
| 2-Person Households | 718 (18.6%) | 205 (5.3%) |
| 3-Person Households | 352 (9.1%) | 19 (0.5%) |
| 4-Person Households | 700 (18.1%) | 5 (0.1%) |
| 5-Person Households | 132 (3.4%) | 0 (0.0%) |
| 6-Person Households | 128 (3.3%) | 0 (0.0%) |
| 7+ Person Households | 133 (3.4%) | 10 (0.3%) |
| Total | 2,163 (55.9%) | 1,705 (44.1%) |
Female Fertility in Plymouth
Fertility by Age in Plymouth
Average fertility rate in Plymouth is 25.0 births per 1,000 women. Women in the age bracket of 20 to 34 years have the highest fertility rate with 55.0 births per 1,000 women. Women in the age bracket of 20 to 34 years acount for 92.9% of all women with births.
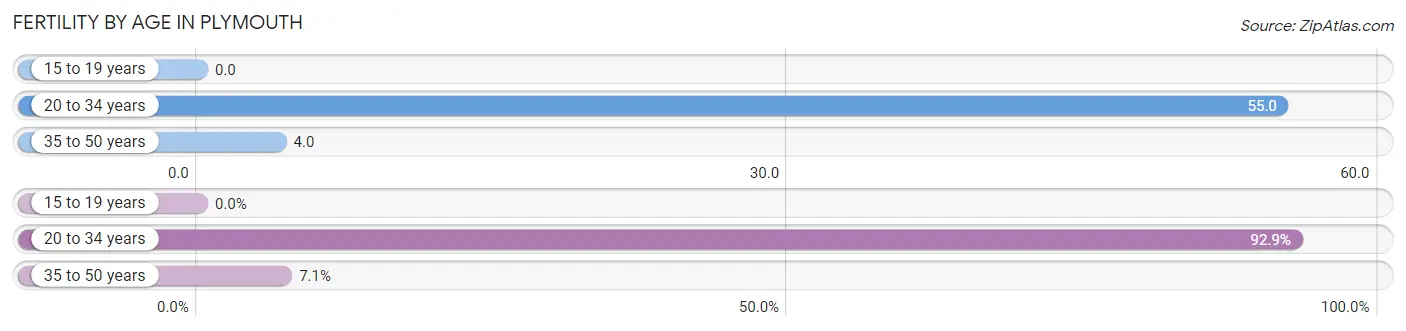
| Age Bracket | Women with Births | Births / 1,000 Women |
| 15 to 19 years | 0 (0.0%) | 0.0 |
| 20 to 34 years | 52 (92.9%) | 55.0 |
| 35 to 50 years | 4 (7.1%) | 4.0 |
| Total | 56 (100.0%) | 25.0 |
Fertility by Age by Marriage Status in Plymouth
94.6% of women with births (56) in Plymouth are married. The highest percentage of unmarried women with births falls into 20 to 34 years age bracket with 5.8% of them unmarried at the time of birth, while the lowest percentage of unmarried women with births belong to 35 to 50 years age bracket with 0.0% of them unmarried.
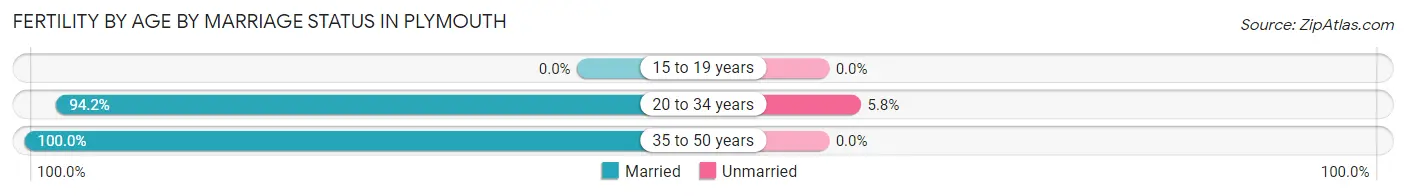
| Age Bracket | Married | Unmarried |
| 15 to 19 years | 0 (0.0%) | 0 (0.0%) |
| 20 to 34 years | 49 (94.2%) | 3 (5.8%) |
| 35 to 50 years | 4 (100.0%) | 0 (0.0%) |
| Total | 53 (94.6%) | 3 (5.4%) |
Fertility by Education in Plymouth
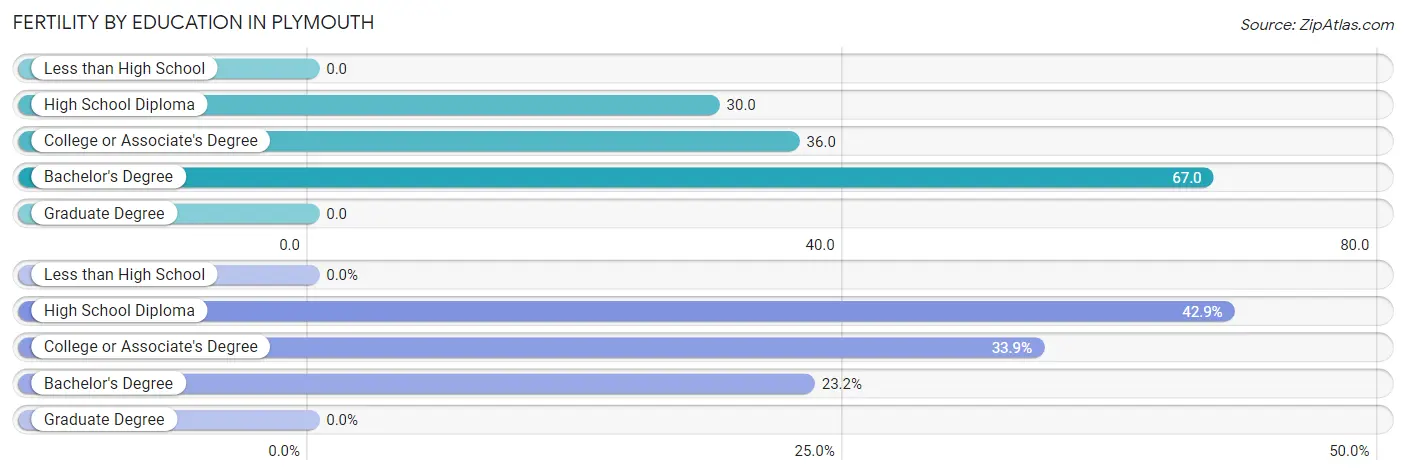
| Educational Attainment | Women with Births | Births / 1,000 Women |
| Less than High School | 0 (0.0%) | 0.0 |
| High School Diploma | 24 (42.9%) | 30.0 |
| College or Associate's Degree | 19 (33.9%) | 36.0 |
| Bachelor's Degree | 13 (23.2%) | 67.0 |
| Graduate Degree | 0 (0.0%) | 0.0 |
| Total | 56 (100.0%) | 25.0 |
Fertility by Education by Marriage Status in Plymouth
5.4% of women with births in Plymouth are unmarried. Women with the educational attainment of high school diploma are most likely to be married with 100.0% of them married at childbirth, while women with the educational attainment of bachelor's degree are least likely to be married with 23.1% of them unmarried at childbirth.
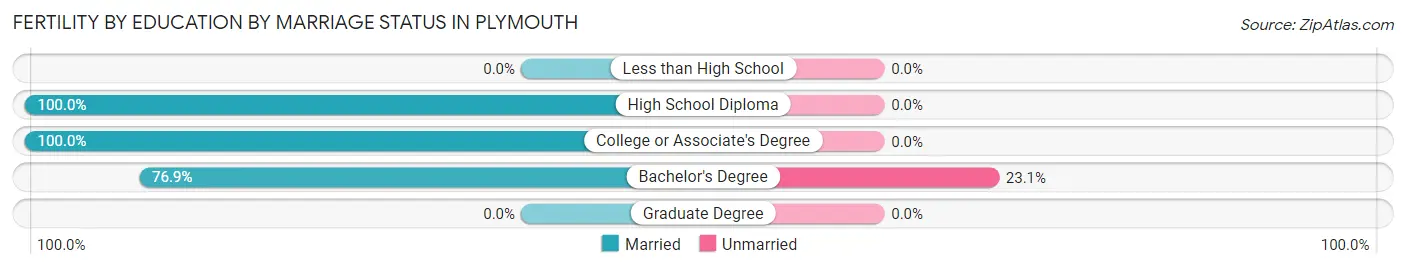
| Educational Attainment | Married | Unmarried |
| Less than High School | 0 (0.0%) | 0 (0.0%) |
| High School Diploma | 24 (100.0%) | 0 (0.0%) |
| College or Associate's Degree | 19 (100.0%) | 0 (0.0%) |
| Bachelor's Degree | 10 (76.9%) | 3 (23.1%) |
| Graduate Degree | 0 (0.0%) | 0 (0.0%) |
| Total | 53 (94.6%) | 3 (5.4%) |
Income in Plymouth
Income Overview in Plymouth
Per Capita Income in Plymouth is $26,797, while median incomes of families and households are $73,346 and $49,306 respectively.
| Characteristic | Number | Measure |
| Per Capita Income | 10,369 | $26,797 |
| Median Family Income | 2,163 | $73,346 |
| Mean Family Income | 2,163 | $79,718 |
| Median Household Income | 3,868 | $49,306 |
| Mean Household Income | 3,868 | $67,529 |
| Income Deficit | 2,163 | $0 |
| Wage / Income Gap (%) | 10,369 | 21.81% |
| Wage / Income Gap ($) | 10,369 | 78.19¢ per $1 |
| Gini / Inequality Index | 10,369 | 0.44 |
Earnings by Sex in Plymouth
Average Earnings in Plymouth are $34,965, $37,738 for men and $29,509 for women, a difference of 21.8%.
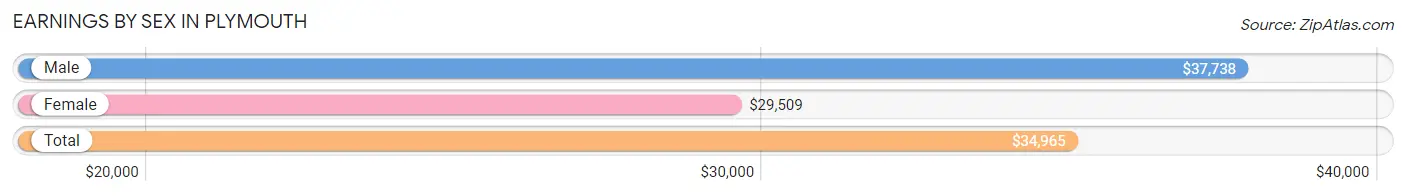
| Sex | Number | Average Earnings |
| Male | 2,854 (56.1%) | $37,738 |
| Female | 2,230 (43.9%) | $29,509 |
| Total | 5,084 (100.0%) | $34,965 |
Earnings by Sex by Income Bracket in Plymouth
The most common earnings brackets in Plymouth are $30,000 to $34,999 for men (420 | 14.7%) and $45,000 to $49,999 for women (217 | 9.7%).
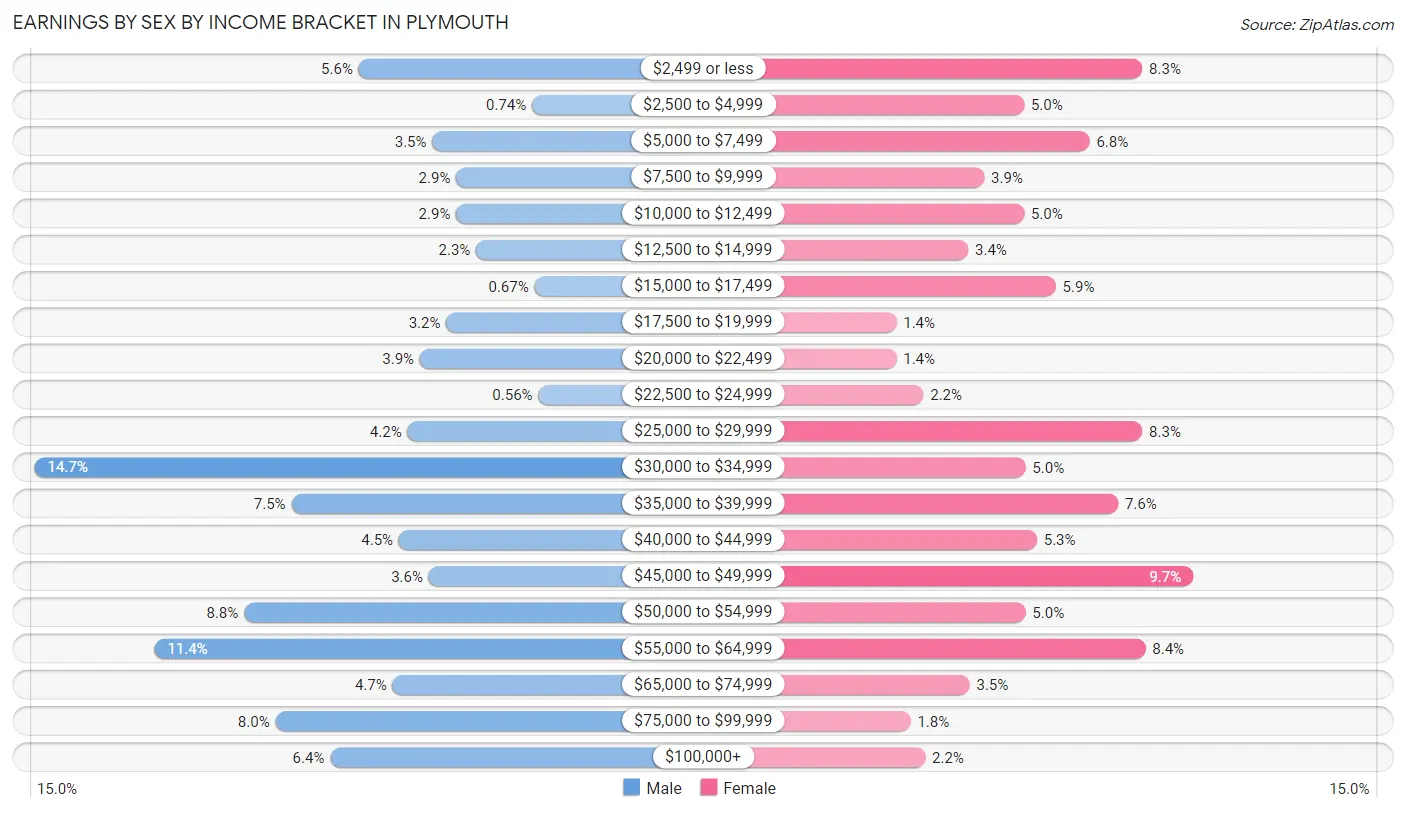
| Income | Male | Female |
| $2,499 or less | 160 (5.6%) | 185 (8.3%) |
| $2,500 to $4,999 | 21 (0.7%) | 111 (5.0%) |
| $5,000 to $7,499 | 101 (3.5%) | 152 (6.8%) |
| $7,500 to $9,999 | 82 (2.9%) | 86 (3.9%) |
| $10,000 to $12,499 | 82 (2.9%) | 111 (5.0%) |
| $12,500 to $14,999 | 66 (2.3%) | 76 (3.4%) |
| $15,000 to $17,499 | 19 (0.7%) | 131 (5.9%) |
| $17,500 to $19,999 | 90 (3.2%) | 31 (1.4%) |
| $20,000 to $22,499 | 111 (3.9%) | 31 (1.4%) |
| $22,500 to $24,999 | 16 (0.6%) | 48 (2.1%) |
| $25,000 to $29,999 | 121 (4.2%) | 185 (8.3%) |
| $30,000 to $34,999 | 420 (14.7%) | 112 (5.0%) |
| $35,000 to $39,999 | 214 (7.5%) | 170 (7.6%) |
| $40,000 to $44,999 | 128 (4.5%) | 119 (5.3%) |
| $45,000 to $49,999 | 104 (3.6%) | 217 (9.7%) |
| $50,000 to $54,999 | 252 (8.8%) | 112 (5.0%) |
| $55,000 to $64,999 | 324 (11.4%) | 187 (8.4%) |
| $65,000 to $74,999 | 133 (4.7%) | 77 (3.5%) |
| $75,000 to $99,999 | 227 (8.0%) | 40 (1.8%) |
| $100,000+ | 183 (6.4%) | 49 (2.2%) |
| Total | 2,854 (100.0%) | 2,230 (100.0%) |
Earnings by Sex by Educational Attainment in Plymouth
Average earnings in Plymouth are $44,018 for men and $34,877 for women, a difference of 20.8%. Men with an educational attainment of college or associate's degree enjoy the highest average annual earnings of $57,937, while those with bachelor's degree education earn the least with $34,303. Women with an educational attainment of bachelor's degree earn the most with the average annual earnings of $47,757, while those with high school diploma education have the smallest earnings of $22,228.
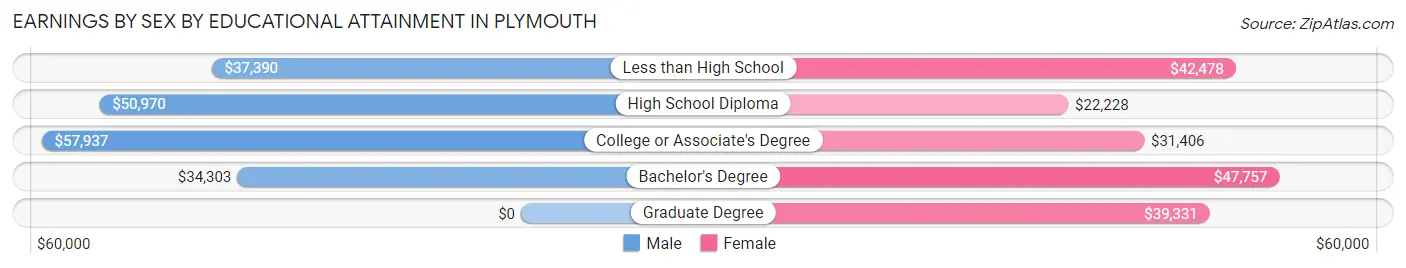
| Educational Attainment | Male Income | Female Income |
| Less than High School | $37,390 | $42,478 |
| High School Diploma | $50,970 | $22,228 |
| College or Associate's Degree | $57,937 | $31,406 |
| Bachelor's Degree | $34,303 | $47,757 |
| Graduate Degree | - | - |
| Total | $44,018 | $34,877 |
Family Income in Plymouth
Family Income Brackets in Plymouth
According to the Plymouth family income data, there are 491 families falling into the $75,000 to $99,999 income range, which is the most common income bracket and makes up 22.7% of all families. Conversely, the less than $10,000 income bracket is the least frequent group with only 9 families (0.4%) belonging to this category.
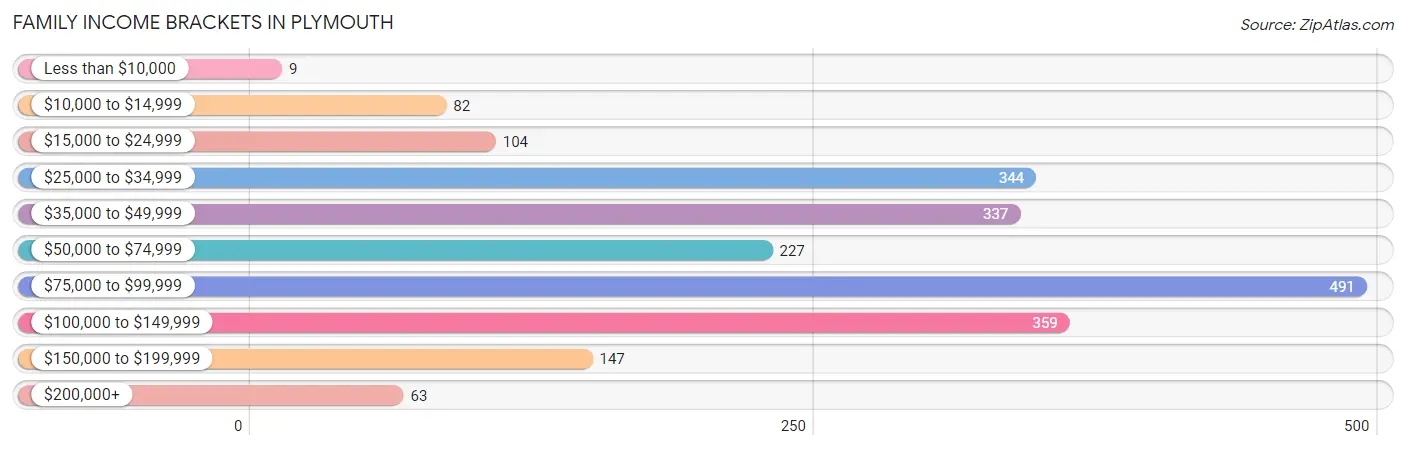
| Income Bracket | # Families | % Families |
| Less than $10,000 | 9 | 0.4% |
| $10,000 to $14,999 | 82 | 3.8% |
| $15,000 to $24,999 | 104 | 4.8% |
| $25,000 to $34,999 | 344 | 15.9% |
| $35,000 to $49,999 | 337 | 15.6% |
| $50,000 to $74,999 | 227 | 10.5% |
| $75,000 to $99,999 | 491 | 22.7% |
| $100,000 to $149,999 | 359 | 16.6% |
| $150,000 to $199,999 | 147 | 6.8% |
| $200,000+ | 63 | 2.9% |
Family Income by Famaliy Size in Plymouth
7+ person families (121 | 5.6%) account for the highest median family income in Plymouth with $105,815 per family, while 2-person families (735 | 34.0%) have the highest median income of $24,558 per family member.
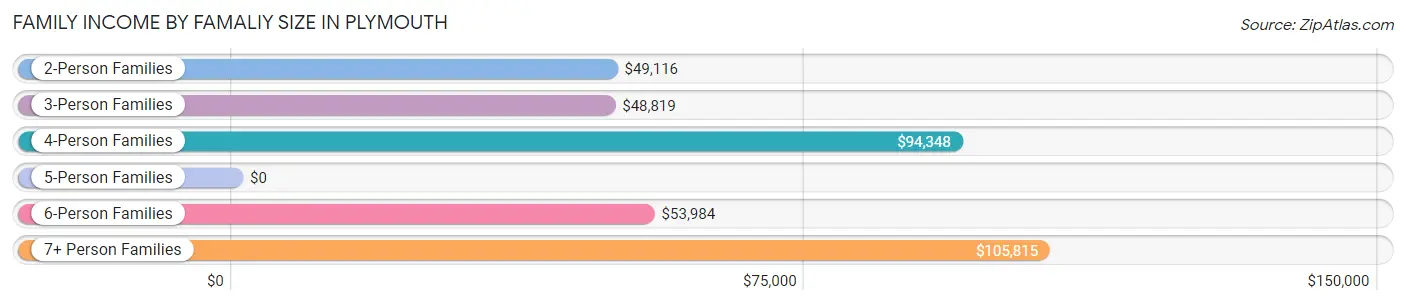
| Income Bracket | # Families | Median Income |
| 2-Person Families | 735 (34.0%) | $49,116 |
| 3-Person Families | 577 (26.7%) | $48,819 |
| 4-Person Families | 482 (22.3%) | $94,348 |
| 5-Person Families | 133 (6.1%) | $0 |
| 6-Person Families | 115 (5.3%) | $53,984 |
| 7+ Person Families | 121 (5.6%) | $105,815 |
| Total | 2,163 (100.0%) | $73,346 |
Family Income by Number of Earners in Plymouth
The median family income in Plymouth is $73,346, with families comprising 3+ earners (331) having the highest median family income of $126,958, while families with no earners (271) have the lowest median family income of $31,607, accounting for 15.3% and 12.5% of families, respectively.
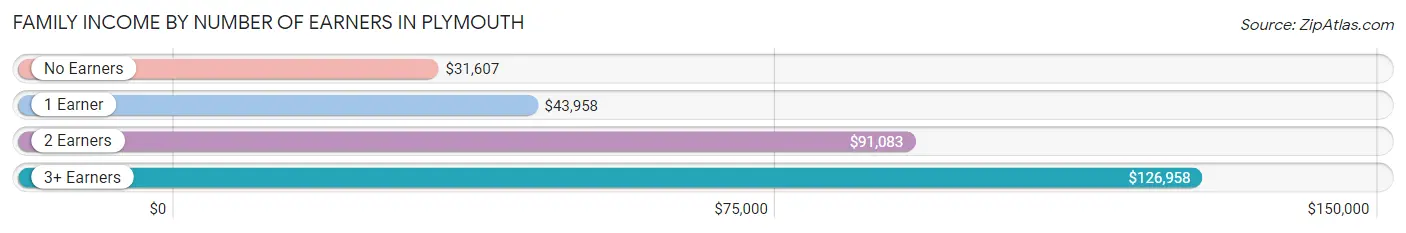
| Number of Earners | # Families | Median Income |
| No Earners | 271 (12.5%) | $31,607 |
| 1 Earner | 958 (44.3%) | $43,958 |
| 2 Earners | 603 (27.9%) | $91,083 |
| 3+ Earners | 331 (15.3%) | $126,958 |
| Total | 2,163 (100.0%) | $73,346 |
Household Income in Plymouth
Household Income Brackets in Plymouth
With 859 households falling in the category, the $35,000 to $49,999 income range is the most frequent in Plymouth, accounting for 22.2% of all households. In contrast, only 85 households (2.2%) fall into the $200,000+ income bracket, making it the least populous group.
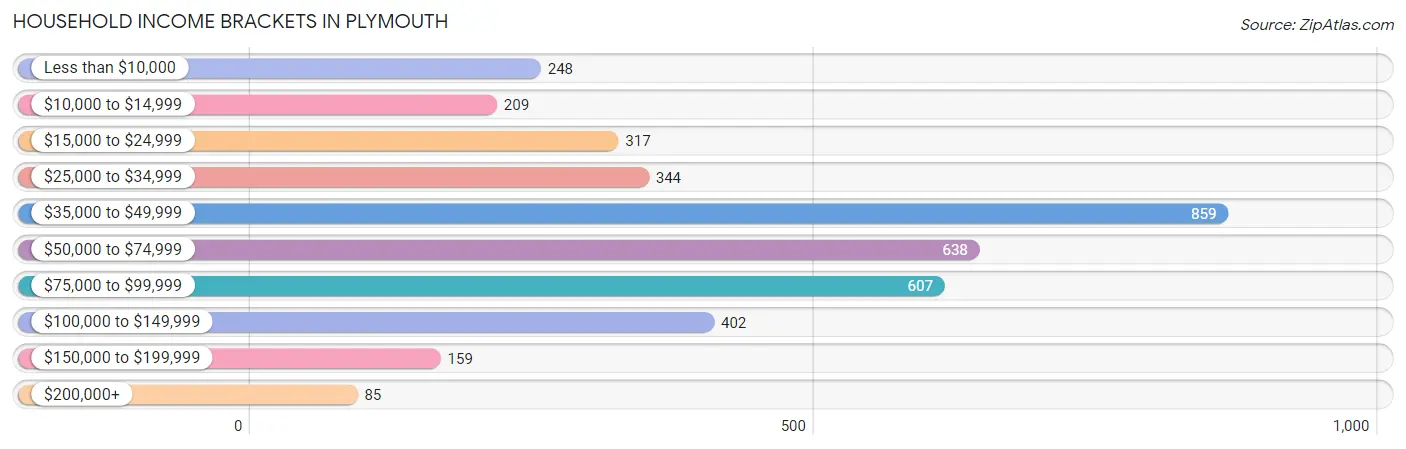
| Income Bracket | # Households | % Households |
| Less than $10,000 | 248 | 6.4% |
| $10,000 to $14,999 | 209 | 5.4% |
| $15,000 to $24,999 | 317 | 8.2% |
| $25,000 to $34,999 | 344 | 8.9% |
| $35,000 to $49,999 | 859 | 22.2% |
| $50,000 to $74,999 | 638 | 16.5% |
| $75,000 to $99,999 | 607 | 15.7% |
| $100,000 to $149,999 | 402 | 10.4% |
| $150,000 to $199,999 | 159 | 4.1% |
| $200,000+ | 85 | 2.2% |
Household Income by Householder Age in Plymouth
The median household income in Plymouth is $49,306, with the highest median household income of $59,079 found in the 45 to 64 years age bracket for the primary householder. A total of 1,547 households (40.0%) fall into this category. Meanwhile, the 15 to 24 years age bracket for the primary householder has the lowest median household income of $0, with 158 households (4.1%) in this group.
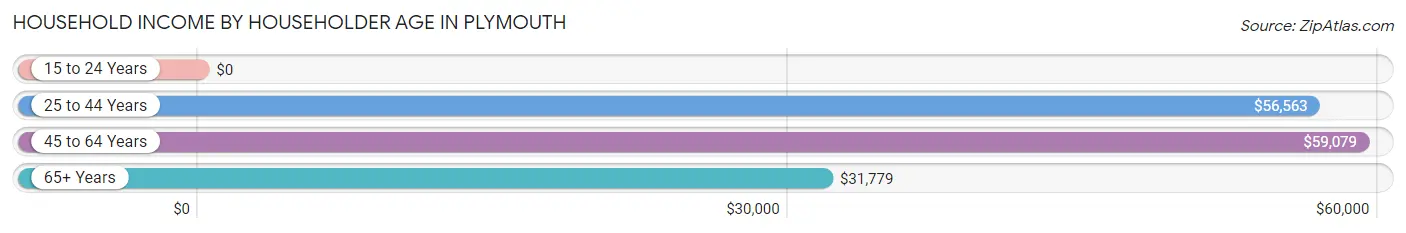
| Income Bracket | # Households | Median Income |
| 15 to 24 Years | 158 (4.1%) | $0 |
| 25 to 44 Years | 1,018 (26.3%) | $56,563 |
| 45 to 64 Years | 1,547 (40.0%) | $59,079 |
| 65+ Years | 1,145 (29.6%) | $31,779 |
| Total | 3,868 (100.0%) | $49,306 |
Poverty in Plymouth
Income Below Poverty by Sex and Age in Plymouth
With 10.3% poverty level for males and 19.3% for females among the residents of Plymouth, 15 year old males and 75 year old and over females are the most vulnerable to poverty, with 38 males (21.2%) and 170 females (30.8%) in their respective age groups living below the poverty level.
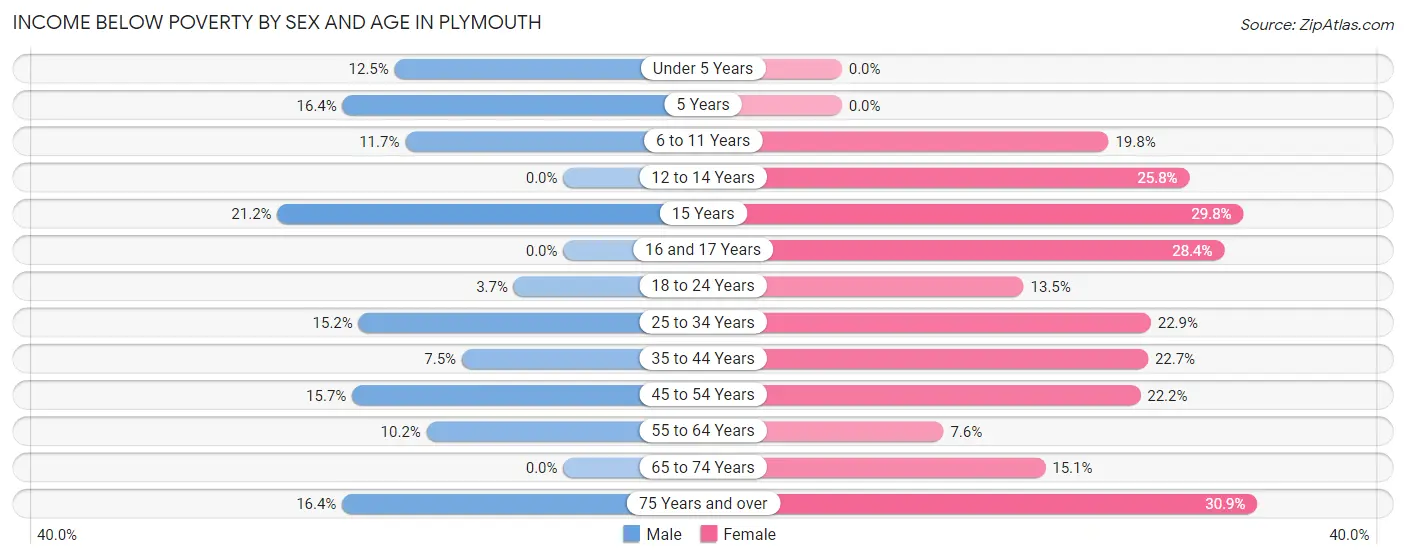
| Age Bracket | Male | Female |
| Under 5 Years | 62 (12.5%) | 0 (0.0%) |
| 5 Years | 10 (16.4%) | 0 (0.0%) |
| 6 to 11 Years | 50 (11.7%) | 97 (19.8%) |
| 12 to 14 Years | 0 (0.0%) | 48 (25.8%) |
| 15 Years | 38 (21.2%) | 17 (29.8%) |
| 16 and 17 Years | 0 (0.0%) | 46 (28.4%) |
| 18 to 24 Years | 19 (3.7%) | 69 (13.5%) |
| 25 to 34 Years | 104 (15.2%) | 131 (22.9%) |
| 35 to 44 Years | 45 (7.5%) | 135 (22.7%) |
| 45 to 54 Years | 93 (15.7%) | 121 (22.2%) |
| 55 to 64 Years | 66 (10.2%) | 37 (7.5%) |
| 65 to 74 Years | 0 (0.0%) | 71 (15.1%) |
| 75 Years and over | 33 (16.4%) | 170 (30.8%) |
| Total | 520 (10.3%) | 942 (19.3%) |
Income Above Poverty by Sex and Age in Plymouth
According to the poverty statistics in Plymouth, males aged 12 to 14 years and females aged under 5 years are the age groups that are most secure financially, with 100.0% of males and 100.0% of females in these age groups living above the poverty line.
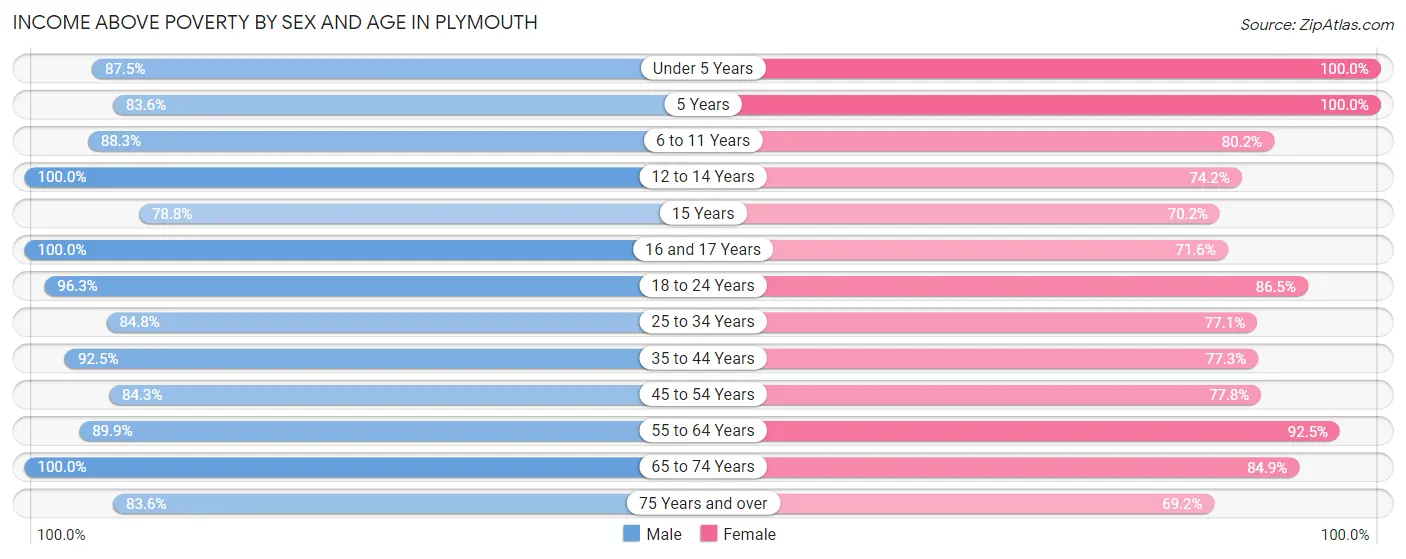
| Age Bracket | Male | Female |
| Under 5 Years | 433 (87.5%) | 240 (100.0%) |
| 5 Years | 51 (83.6%) | 10 (100.0%) |
| 6 to 11 Years | 376 (88.3%) | 393 (80.2%) |
| 12 to 14 Years | 144 (100.0%) | 138 (74.2%) |
| 15 Years | 141 (78.8%) | 40 (70.2%) |
| 16 and 17 Years | 193 (100.0%) | 116 (71.6%) |
| 18 to 24 Years | 497 (96.3%) | 442 (86.5%) |
| 25 to 34 Years | 580 (84.8%) | 440 (77.1%) |
| 35 to 44 Years | 553 (92.5%) | 459 (77.3%) |
| 45 to 54 Years | 500 (84.3%) | 425 (77.8%) |
| 55 to 64 Years | 584 (89.8%) | 453 (92.4%) |
| 65 to 74 Years | 314 (100.0%) | 399 (84.9%) |
| 75 Years and over | 168 (83.6%) | 381 (69.2%) |
| Total | 4,534 (89.7%) | 3,936 (80.7%) |
Income Below Poverty Among Married-Couple Families in Plymouth
The poverty statistics for married-couple families in Plymouth show that 7.5% or 110 of the total 1,471 families live below the poverty line. Families with 3 or 4 children have the highest poverty rate of 37.7%, comprising of 52 families. On the other hand, families with 5 or more children have the lowest poverty rate of 0.0%, which includes 0 families.
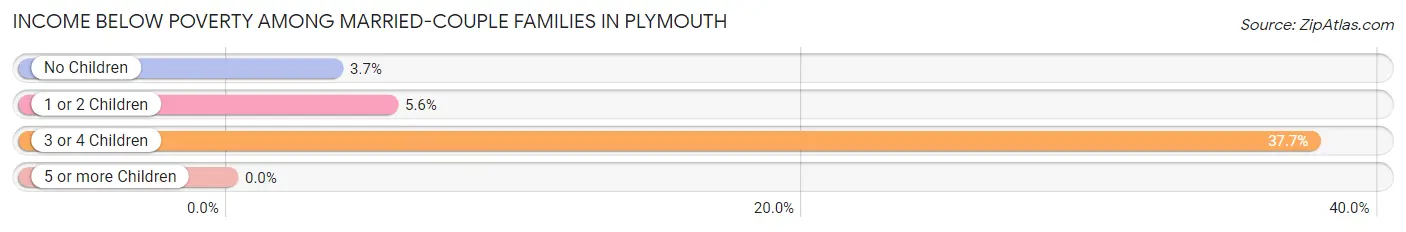
| Children | Above Poverty | Below Poverty |
| No Children | 631 (96.3%) | 24 (3.7%) |
| 1 or 2 Children | 576 (94.4%) | 34 (5.6%) |
| 3 or 4 Children | 86 (62.3%) | 52 (37.7%) |
| 5 or more Children | 68 (100.0%) | 0 (0.0%) |
| Total | 1,361 (92.5%) | 110 (7.5%) |
Income Below Poverty Among Single-Parent Households in Plymouth
According to the poverty data in Plymouth, 2.8% or 9 single-father households and 21.5% or 79 single-mother households are living below the poverty line. Among single-father households, those with 1 or 2 children have the highest poverty rate, with 9 households (3.3%) experiencing poverty. Likewise, among single-mother households, those with 1 or 2 children have the highest poverty rate, with 57 households (33.9%) falling below the poverty line.
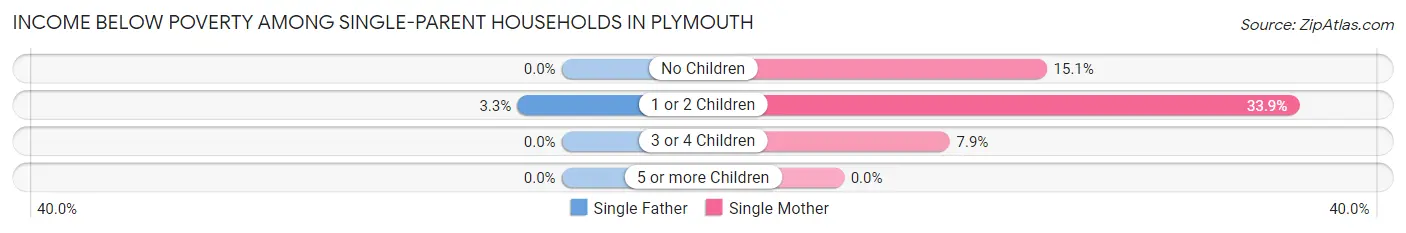
| Children | Single Father | Single Mother |
| No Children | 0 (0.0%) | 13 (15.1%) |
| 1 or 2 Children | 9 (3.3%) | 57 (33.9%) |
| 3 or 4 Children | 0 (0.0%) | 9 (7.9%) |
| 5 or more Children | 0 (0.0%) | 0 (0.0%) |
| Total | 9 (2.8%) | 79 (21.5%) |
Income Below Poverty Among Married-Couple vs Single-Parent Households in Plymouth
The poverty data for Plymouth shows that 110 of the married-couple family households (7.5%) and 88 of the single-parent households (12.7%) are living below the poverty level. Within the married-couple family households, those with 3 or 4 children have the highest poverty rate, with 52 households (37.7%) falling below the poverty line. Among the single-parent households, those with 1 or 2 children have the highest poverty rate, with 66 household (15.0%) living below poverty.
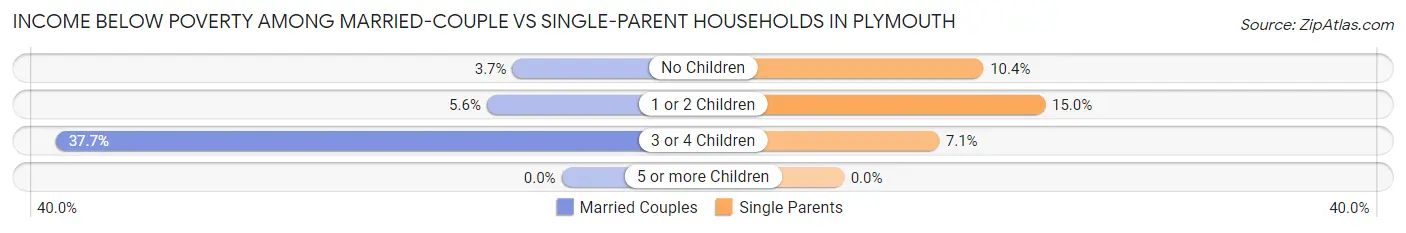
| Children | Married-Couple Families | Single-Parent Households |
| No Children | 24 (3.7%) | 13 (10.4%) |
| 1 or 2 Children | 34 (5.6%) | 66 (15.0%) |
| 3 or 4 Children | 52 (37.7%) | 9 (7.1%) |
| 5 or more Children | 0 (0.0%) | 0 (0.0%) |
| Total | 110 (7.5%) | 88 (12.7%) |
Employment Characteristics in Plymouth
Employment by Class of Employer in Plymouth
Among the 4,664 employed individuals in Plymouth, private company employees (3,801 | 81.5%), not-for-profit organizations (353 | 7.6%), and self-employed (not incorporated) (265 | 5.7%) make up the most common classes of employment.
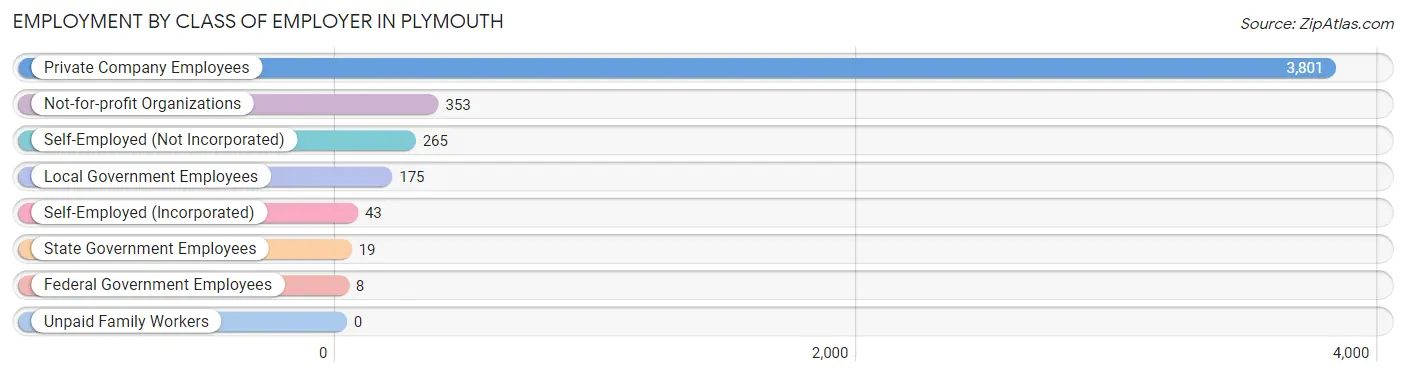
| Employer Class | # Employees | % Employees |
| Private Company Employees | 3,801 | 81.5% |
| Self-Employed (Incorporated) | 43 | 0.9% |
| Self-Employed (Not Incorporated) | 265 | 5.7% |
| Not-for-profit Organizations | 353 | 7.6% |
| Local Government Employees | 175 | 3.7% |
| State Government Employees | 19 | 0.4% |
| Federal Government Employees | 8 | 0.2% |
| Unpaid Family Workers | 0 | 0.0% |
| Total | 4,664 | 100.0% |
Employment Status by Age in Plymouth
According to the labor force statistics for Plymouth, out of the total population over 16 years of age (7,976), 62.0% or 4,945 individuals are in the labor force, with 4.5% or 223 of them unemployed. The age group with the highest labor force participation rate is 25 to 29 years, with 88.2% or 687 individuals in the labor force. Within the labor force, the 16 to 19 years age range has the highest percentage of unemployed individuals, with 16.2% or 43 of them being unemployed.
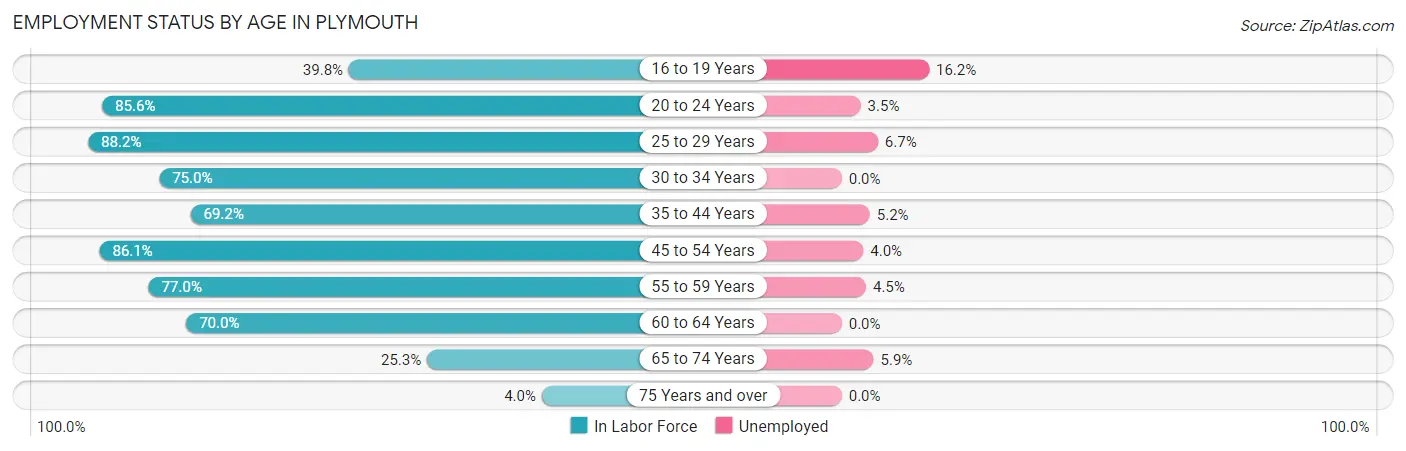
| Age Bracket | In Labor Force | Unemployed |
| 16 to 19 Years | 266 (39.8%) | 43 (16.2%) |
| 20 to 24 Years | 628 (85.6%) | 22 (3.5%) |
| 25 to 29 Years | 687 (88.2%) | 46 (6.7%) |
| 30 to 34 Years | 403 (75.0%) | 0 (0.0%) |
| 35 to 44 Years | 870 (69.2%) | 45 (5.2%) |
| 45 to 54 Years | 1,015 (86.1%) | 41 (4.0%) |
| 55 to 59 Years | 358 (77.0%) | 16 (4.5%) |
| 60 to 64 Years | 484 (70.0%) | 0 (0.0%) |
| 65 to 74 Years | 204 (25.3%) | 12 (5.9%) |
| 75 Years and over | 34 (4.0%) | 0 (0.0%) |
| Total | 4,945 (62.0%) | 223 (4.5%) |
Employment Status by Educational Attainment in Plymouth
According to labor force statistics for Plymouth, 77.8% of individuals (3,818) out of the total population between 25 and 64 years of age (4,908) are in the labor force, with 3.9% or 149 of them being unemployed. The group with the highest labor force participation rate are those with the educational attainment of bachelor's degree or higher, with 85.8% or 763 individuals in the labor force. Within the labor force, individuals with college / associate degree education have the highest percentage of unemployment, with 6.8% or 66 of them being unemployed.
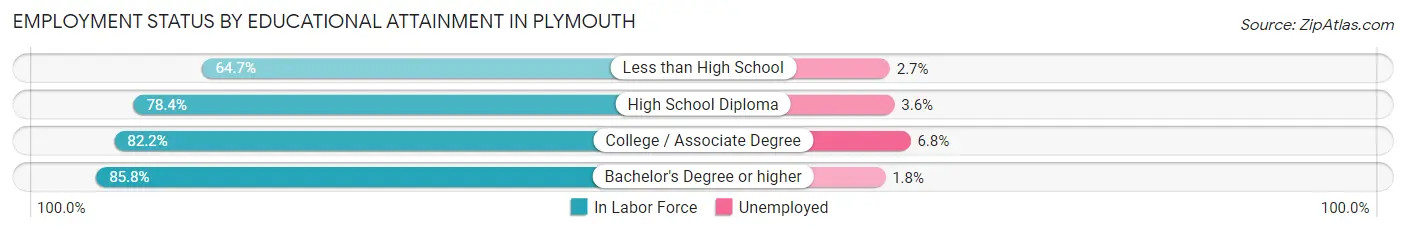
| Educational Attainment | In Labor Force | Unemployed |
| Less than High School | 675 (64.7%) | 28 (2.7%) |
| High School Diploma | 1,404 (78.4%) | 64 (3.6%) |
| College / Associate Degree | 974 (82.2%) | 81 (6.8%) |
| Bachelor's Degree or higher | 763 (85.8%) | 16 (1.8%) |
| Total | 3,818 (77.8%) | 191 (3.9%) |
Employment Occupations by Sex in Plymouth
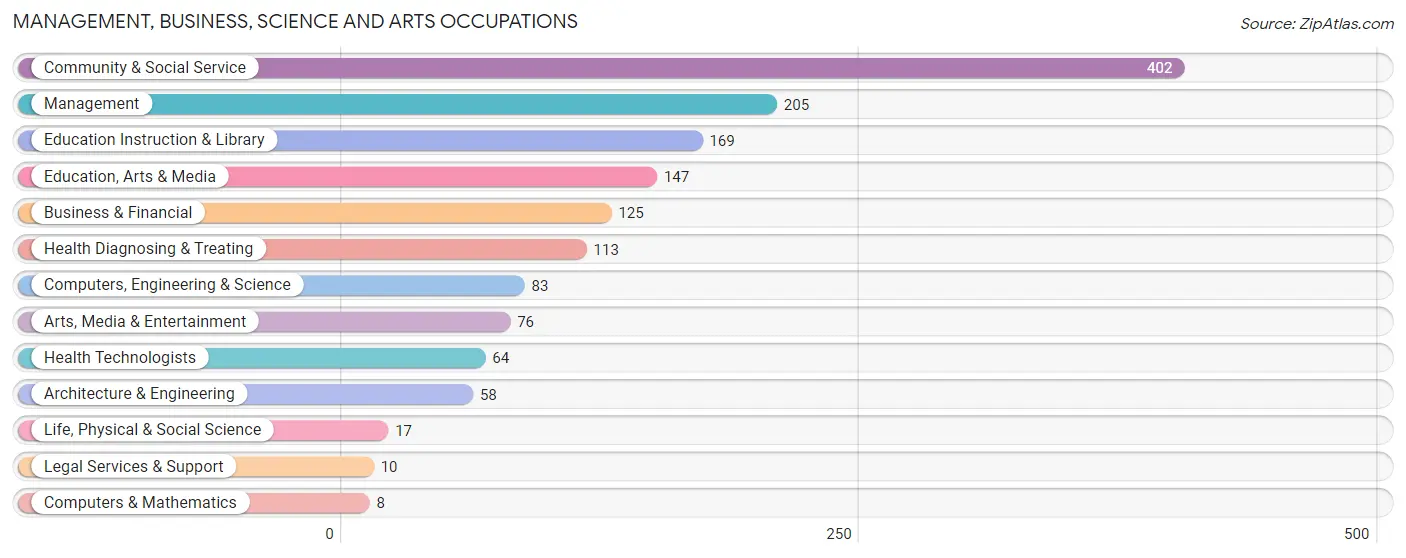
Management, Business, Science and Arts Occupations
The most common Management, Business, Science and Arts occupations in Plymouth are Community & Social Service (402 | 8.5%), Management (205 | 4.3%), Education Instruction & Library (169 | 3.6%), Education, Arts & Media (147 | 3.1%), and Business & Financial (125 | 2.6%).
Management, Business, Science and Arts Occupations by Sex
Within the Management, Business, Science and Arts occupations in Plymouth, the most male-oriented occupations are Life, Physical & Social Science (100.0%), Legal Services & Support (100.0%), and Architecture & Engineering (93.1%), while the most female-oriented occupations are Computers & Mathematics (100.0%), Health Diagnosing & Treating (80.5%), and Education Instruction & Library (77.5%).
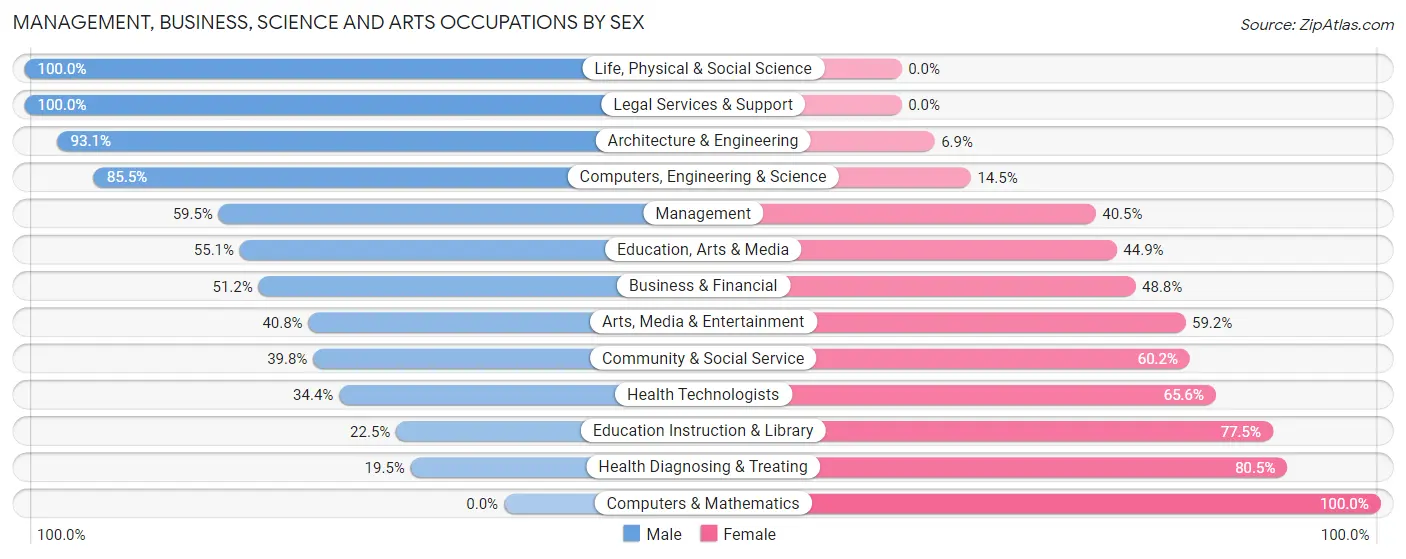
| Occupation | Male | Female |
| Management | 122 (59.5%) | 83 (40.5%) |
| Business & Financial | 64 (51.2%) | 61 (48.8%) |
| Computers, Engineering & Science | 71 (85.5%) | 12 (14.5%) |
| Computers & Mathematics | 0 (0.0%) | 8 (100.0%) |
| Architecture & Engineering | 54 (93.1%) | 4 (6.9%) |
| Life, Physical & Social Science | 17 (100.0%) | 0 (0.0%) |
| Community & Social Service | 160 (39.8%) | 242 (60.2%) |
| Education, Arts & Media | 81 (55.1%) | 66 (44.9%) |
| Legal Services & Support | 10 (100.0%) | 0 (0.0%) |
| Education Instruction & Library | 38 (22.5%) | 131 (77.5%) |
| Arts, Media & Entertainment | 31 (40.8%) | 45 (59.2%) |
| Health Diagnosing & Treating | 22 (19.5%) | 91 (80.5%) |
| Health Technologists | 22 (34.4%) | 42 (65.6%) |
| Total (Category) | 439 (47.3%) | 489 (52.7%) |
| Total (Overall) | 2,647 (56.0%) | 2,077 (44.0%) |
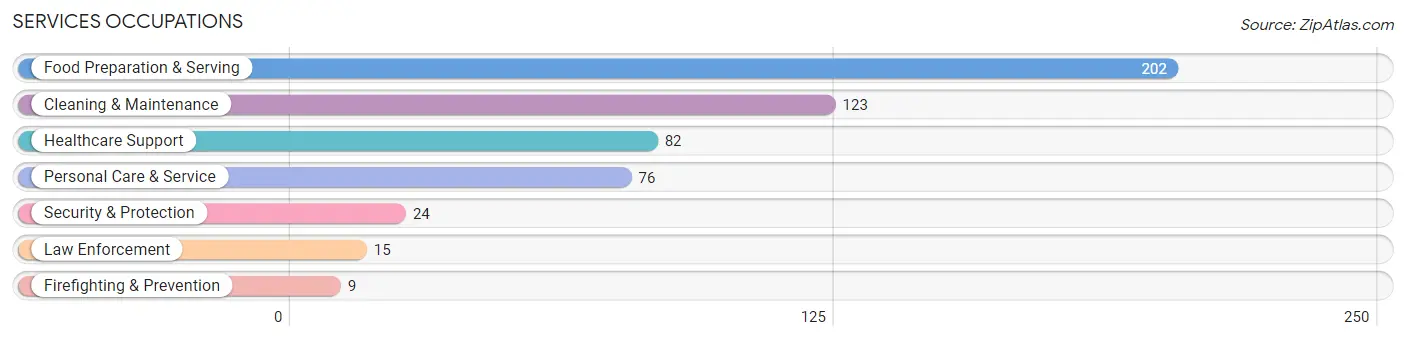
Services Occupations
The most common Services occupations in Plymouth are Food Preparation & Serving (202 | 4.3%), Cleaning & Maintenance (123 | 2.6%), Healthcare Support (82 | 1.7%), Personal Care & Service (76 | 1.6%), and Security & Protection (24 | 0.5%).
Services Occupations by Sex
Within the Services occupations in Plymouth, the most male-oriented occupations are Security & Protection (100.0%), Firefighting & Prevention (100.0%), and Law Enforcement (100.0%), while the most female-oriented occupations are Healthcare Support (100.0%), Personal Care & Service (100.0%), and Food Preparation & Serving (71.3%).
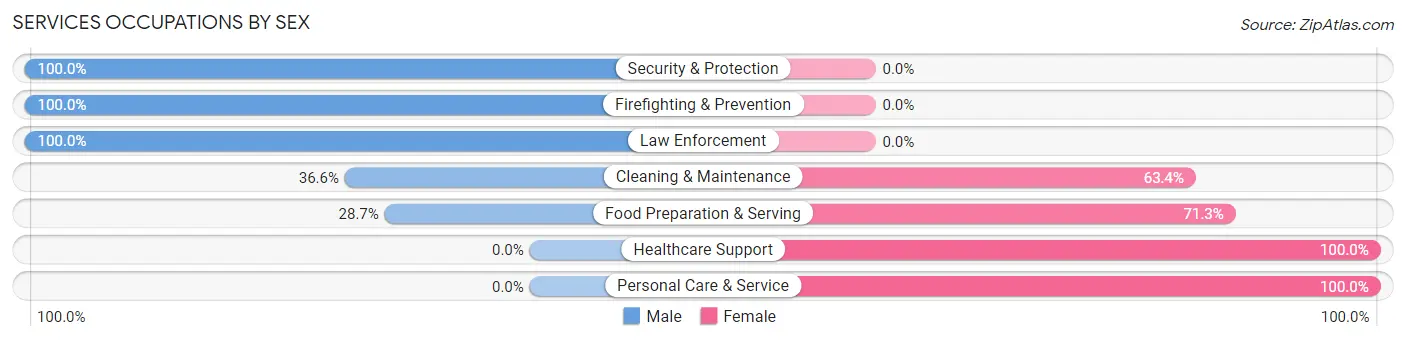
| Occupation | Male | Female |
| Healthcare Support | 0 (0.0%) | 82 (100.0%) |
| Security & Protection | 24 (100.0%) | 0 (0.0%) |
| Firefighting & Prevention | 9 (100.0%) | 0 (0.0%) |
| Law Enforcement | 15 (100.0%) | 0 (0.0%) |
| Food Preparation & Serving | 58 (28.7%) | 144 (71.3%) |
| Cleaning & Maintenance | 45 (36.6%) | 78 (63.4%) |
| Personal Care & Service | 0 (0.0%) | 76 (100.0%) |
| Total (Category) | 127 (25.1%) | 380 (75.0%) |
| Total (Overall) | 2,647 (56.0%) | 2,077 (44.0%) |
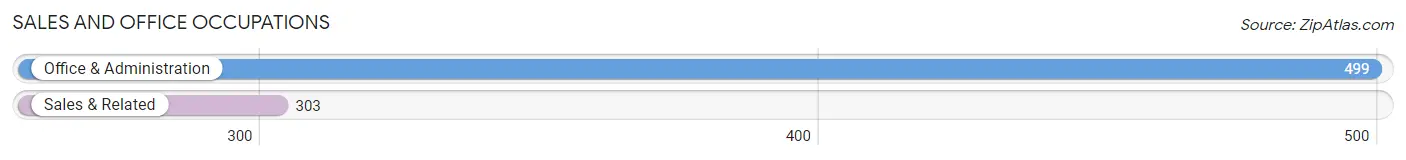
Sales and Office Occupations
The most common Sales and Office occupations in Plymouth are Office & Administration (499 | 10.6%), and Sales & Related (303 | 6.4%).
Sales and Office Occupations by Sex
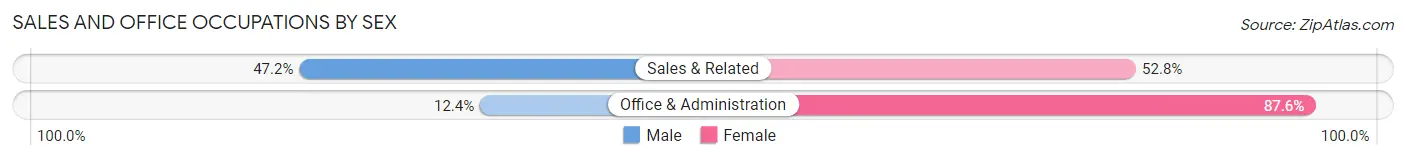
| Occupation | Male | Female |
| Sales & Related | 143 (47.2%) | 160 (52.8%) |
| Office & Administration | 62 (12.4%) | 437 (87.6%) |
| Total (Category) | 205 (25.6%) | 597 (74.4%) |
| Total (Overall) | 2,647 (56.0%) | 2,077 (44.0%) |
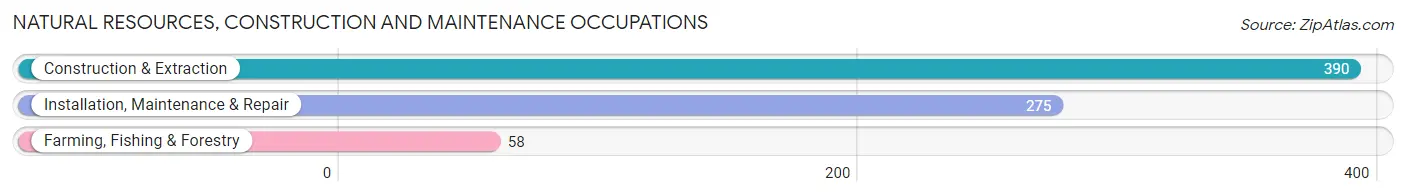
Natural Resources, Construction and Maintenance Occupations
The most common Natural Resources, Construction and Maintenance occupations in Plymouth are Construction & Extraction (390 | 8.3%), Installation, Maintenance & Repair (275 | 5.8%), and Farming, Fishing & Forestry (58 | 1.2%).
Natural Resources, Construction and Maintenance Occupations by Sex
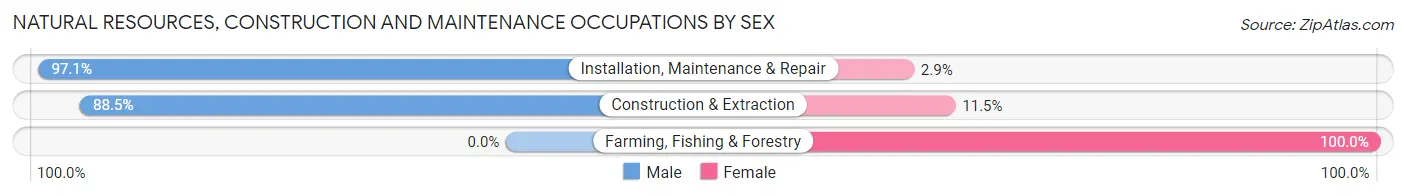
| Occupation | Male | Female |
| Farming, Fishing & Forestry | 0 (0.0%) | 58 (100.0%) |
| Construction & Extraction | 345 (88.5%) | 45 (11.5%) |
| Installation, Maintenance & Repair | 267 (97.1%) | 8 (2.9%) |
| Total (Category) | 612 (84.7%) | 111 (15.3%) |
| Total (Overall) | 2,647 (56.0%) | 2,077 (44.0%) |
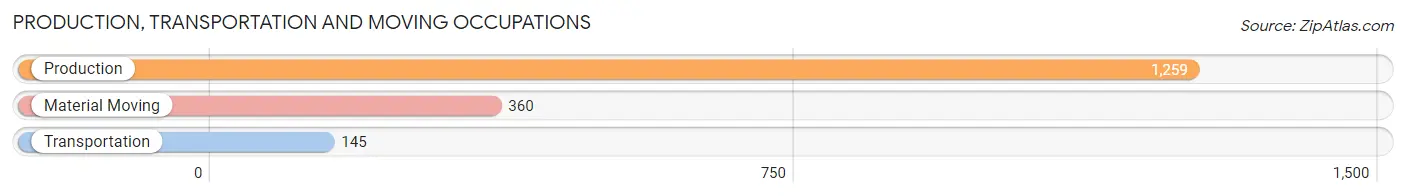
Production, Transportation and Moving Occupations
The most common Production, Transportation and Moving occupations in Plymouth are Production (1,259 | 26.7%), Material Moving (360 | 7.6%), and Transportation (145 | 3.1%).
Production, Transportation and Moving Occupations by Sex
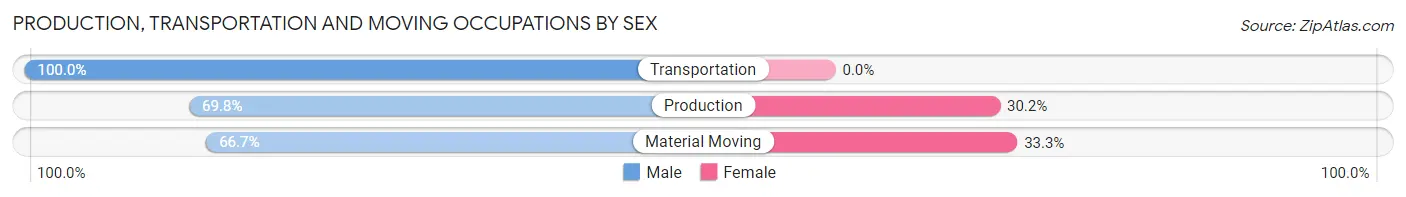
| Occupation | Male | Female |
| Production | 879 (69.8%) | 380 (30.2%) |
| Transportation | 145 (100.0%) | 0 (0.0%) |
| Material Moving | 240 (66.7%) | 120 (33.3%) |
| Total (Category) | 1,264 (71.7%) | 500 (28.3%) |
| Total (Overall) | 2,647 (56.0%) | 2,077 (44.0%) |
Employment Industries by Sex in Plymouth
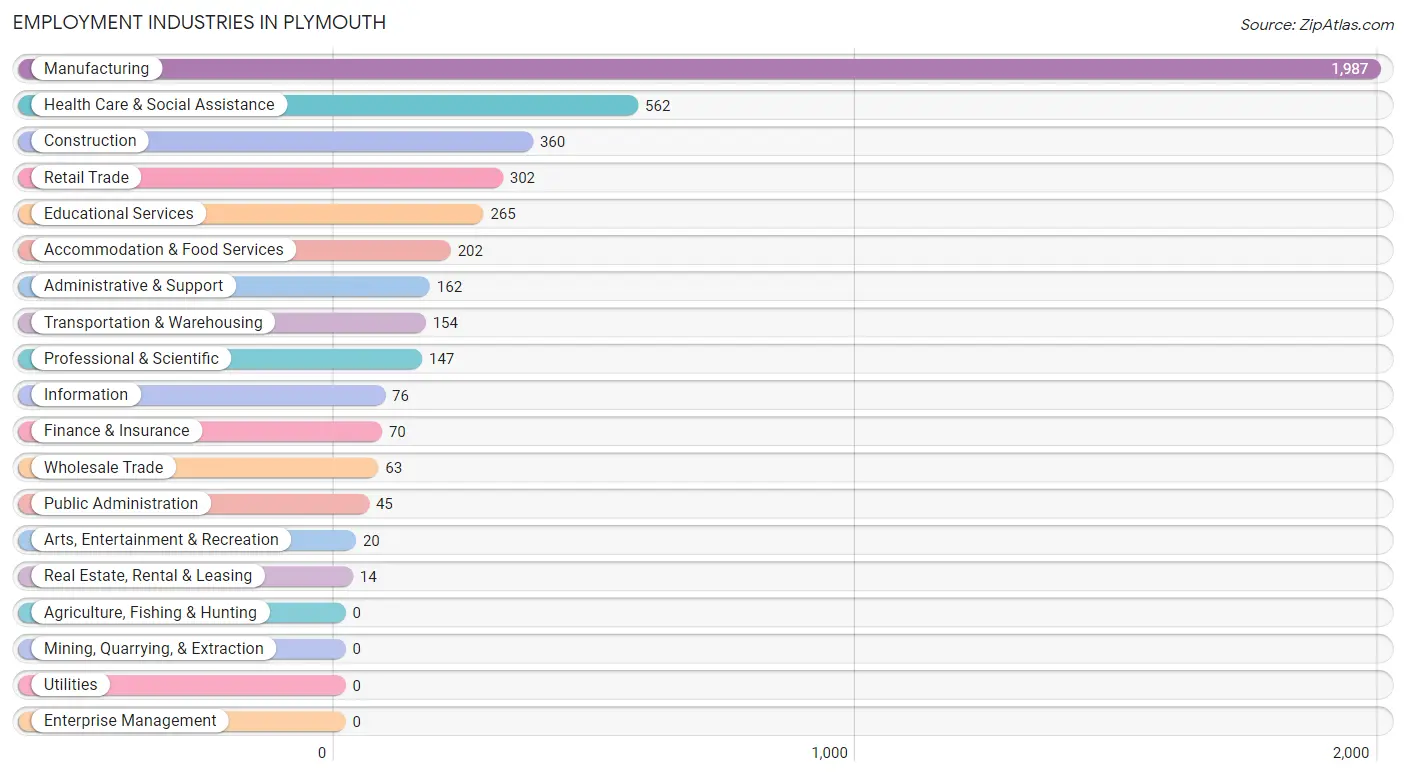
Employment Industries in Plymouth
The major employment industries in Plymouth include Manufacturing (1,987 | 42.1%), Health Care & Social Assistance (562 | 11.9%), Construction (360 | 7.6%), Retail Trade (302 | 6.4%), and Educational Services (265 | 5.6%).
Employment Industries by Sex in Plymouth
The Plymouth industries that see more men than women are Arts, Entertainment & Recreation (100.0%), Construction (87.5%), and Transportation & Warehousing (81.8%), whereas the industries that tend to have a higher number of women are Finance & Insurance (100.0%), Real Estate, Rental & Leasing (100.0%), and Administrative & Support (77.8%).
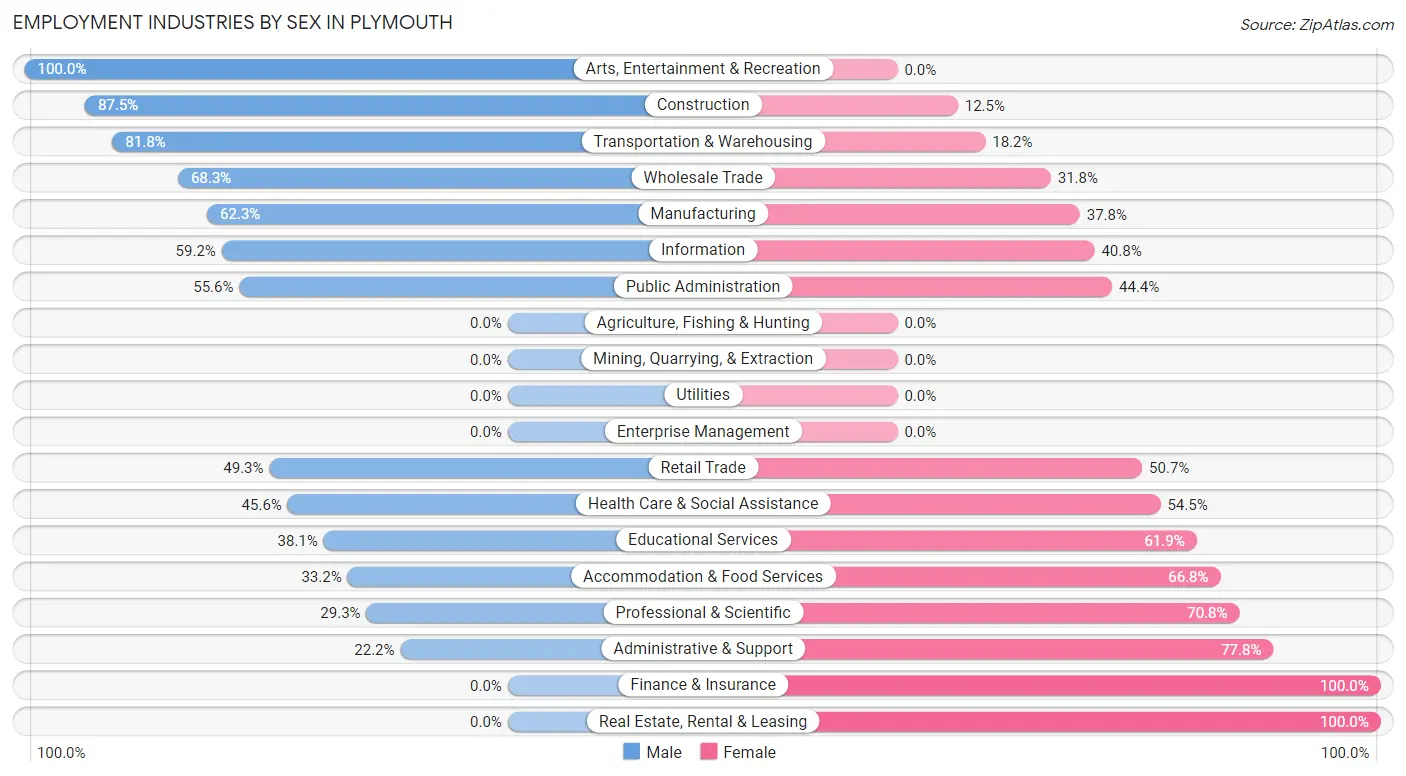
| Industry | Male | Female |
| Agriculture, Fishing & Hunting | 0 (0.0%) | 0 (0.0%) |
| Mining, Quarrying, & Extraction | 0 (0.0%) | 0 (0.0%) |
| Construction | 315 (87.5%) | 45 (12.5%) |
| Manufacturing | 1,237 (62.3%) | 750 (37.8%) |
| Wholesale Trade | 43 (68.2%) | 20 (31.8%) |
| Retail Trade | 149 (49.3%) | 153 (50.7%) |
| Transportation & Warehousing | 126 (81.8%) | 28 (18.2%) |
| Utilities | 0 (0.0%) | 0 (0.0%) |
| Information | 45 (59.2%) | 31 (40.8%) |
| Finance & Insurance | 0 (0.0%) | 70 (100.0%) |
| Real Estate, Rental & Leasing | 0 (0.0%) | 14 (100.0%) |
| Professional & Scientific | 43 (29.2%) | 104 (70.8%) |
| Enterprise Management | 0 (0.0%) | 0 (0.0%) |
| Administrative & Support | 36 (22.2%) | 126 (77.8%) |
| Educational Services | 101 (38.1%) | 164 (61.9%) |
| Health Care & Social Assistance | 256 (45.6%) | 306 (54.4%) |
| Arts, Entertainment & Recreation | 20 (100.0%) | 0 (0.0%) |
| Accommodation & Food Services | 67 (33.2%) | 135 (66.8%) |
| Public Administration | 25 (55.6%) | 20 (44.4%) |
| Total | 2,647 (56.0%) | 2,077 (44.0%) |
Education in Plymouth
School Enrollment in Plymouth
The most common levels of schooling among the 2,685 students in Plymouth are high school (739 | 27.5%), middle school (676 | 25.2%), and elementary school (597 | 22.2%).
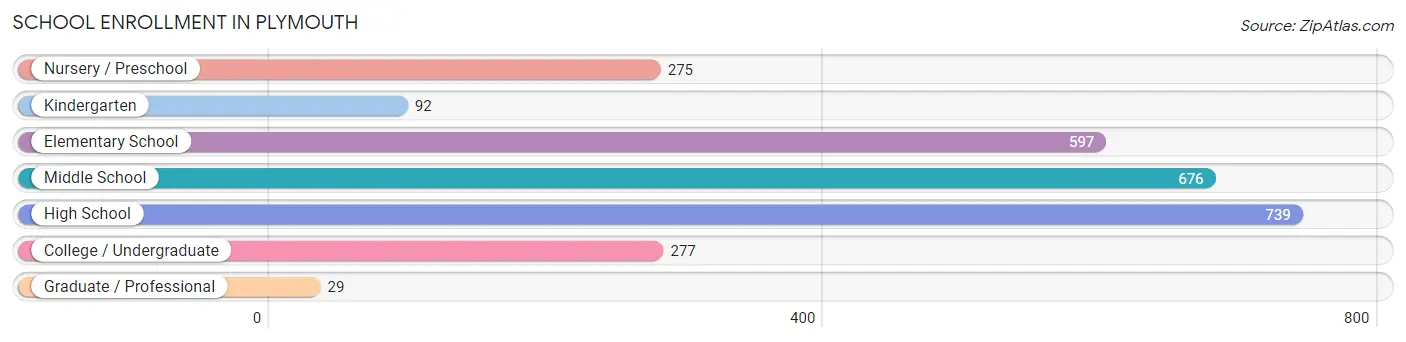
| School Level | # Students | % Students |
| Nursery / Preschool | 275 | 10.2% |
| Kindergarten | 92 | 3.4% |
| Elementary School | 597 | 22.2% |
| Middle School | 676 | 25.2% |
| High School | 739 | 27.5% |
| College / Undergraduate | 277 | 10.3% |
| Graduate / Professional | 29 | 1.1% |
| Total | 2,685 | 100.0% |
School Enrollment by Age by Funding Source in Plymouth
Out of a total of 2,685 students who are enrolled in schools in Plymouth, 188 (7.0%) attend a private institution, while the remaining 2,497 (93.0%) are enrolled in public schools. The age group of 35 years and over has the highest likelihood of being enrolled in private schools, with 59 (57.8% in the age bracket) enrolled. Conversely, the age group of 5 to 9 year old has the lowest likelihood of being enrolled in a private school, with 712 (100.0% in the age bracket) attending a public institution.
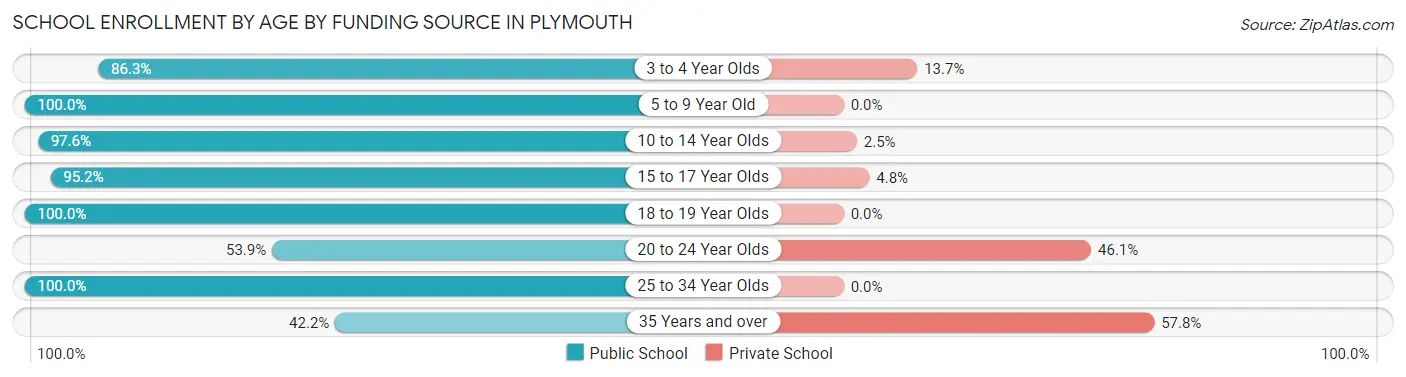
| Age Bracket | Public School | Private School |
| 3 to 4 Year Olds | 189 (86.3%) | 30 (13.7%) |
| 5 to 9 Year Old | 712 (100.0%) | 0 (0.0%) |
| 10 to 14 Year Olds | 638 (97.6%) | 16 (2.5%) |
| 15 to 17 Year Olds | 576 (95.2%) | 29 (4.8%) |
| 18 to 19 Year Olds | 224 (100.0%) | 0 (0.0%) |
| 20 to 24 Year Olds | 62 (53.9%) | 53 (46.1%) |
| 25 to 34 Year Olds | 54 (100.0%) | 0 (0.0%) |
| 35 Years and over | 43 (42.2%) | 59 (57.8%) |
| Total | 2,497 (93.0%) | 188 (7.0%) |
Educational Attainment by Field of Study in Plymouth
Education (337 | 25.7%), physical & health sciences (221 | 16.9%), science & technology (157 | 12.0%), business (113 | 8.6%), and arts & humanities (113 | 8.6%) are the most common fields of study among 1,311 individuals in Plymouth who have obtained a bachelor's degree or higher.
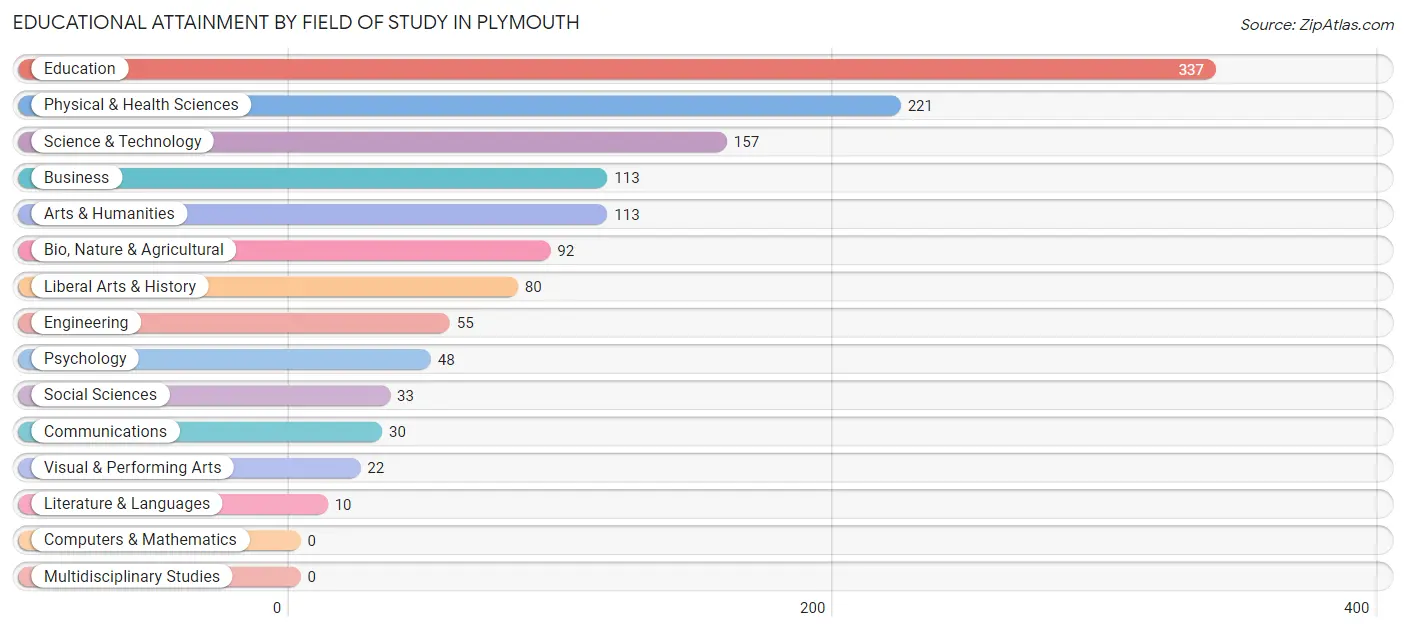
| Field of Study | # Graduates | % Graduates |
| Computers & Mathematics | 0 | 0.0% |
| Bio, Nature & Agricultural | 92 | 7.0% |
| Physical & Health Sciences | 221 | 16.9% |
| Psychology | 48 | 3.7% |
| Social Sciences | 33 | 2.5% |
| Engineering | 55 | 4.2% |
| Multidisciplinary Studies | 0 | 0.0% |
| Science & Technology | 157 | 12.0% |
| Business | 113 | 8.6% |
| Education | 337 | 25.7% |
| Literature & Languages | 10 | 0.8% |
| Liberal Arts & History | 80 | 6.1% |
| Visual & Performing Arts | 22 | 1.7% |
| Communications | 30 | 2.3% |
| Arts & Humanities | 113 | 8.6% |
| Total | 1,311 | 100.0% |
Transportation & Commute in Plymouth
Vehicle Availability by Sex in Plymouth
The most prevalent vehicle ownership categories in Plymouth are males with 2 vehicles (997, accounting for 38.0%) and females with 2 vehicles (617, making up 48.9%).
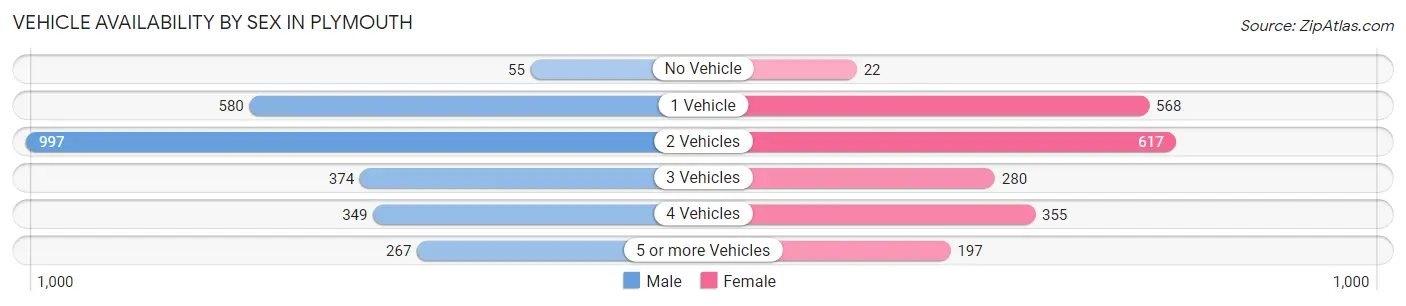
| Vehicles Available | Male | Female |
| No Vehicle | 55 (2.1%) | 22 (1.1%) |
| 1 Vehicle | 580 (22.1%) | 568 (27.9%) |
| 2 Vehicles | 997 (38.0%) | 617 (30.3%) |
| 3 Vehicles | 374 (14.3%) | 280 (13.7%) |
| 4 Vehicles | 349 (13.3%) | 355 (17.4%) |
| 5 or more Vehicles | 267 (10.2%) | 197 (9.7%) |
| Total | 2,622 (100.0%) | 2,039 (100.0%) |
Commute Time in Plymouth
The most frequently occuring commute durations in Plymouth are 5 to 9 minutes (1,002 commuters, 21.9%), 10 to 14 minutes (849 commuters, 18.5%), and 30 to 34 minutes (658 commuters, 14.4%).
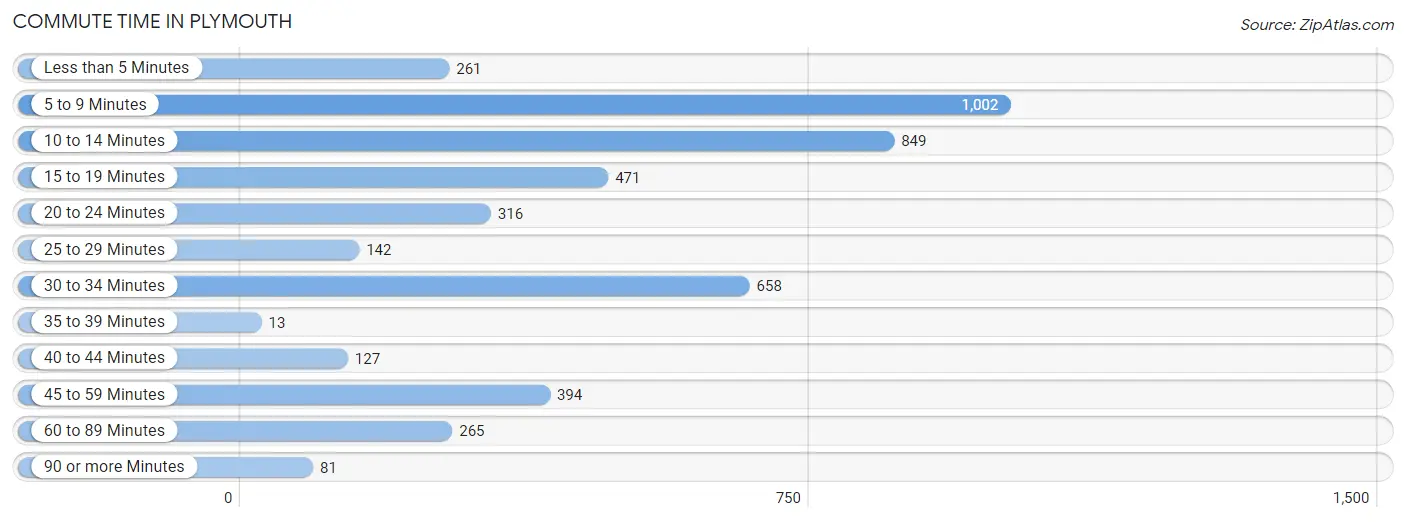
| Commute Time | # Commuters | % Commuters |
| Less than 5 Minutes | 261 | 5.7% |
| 5 to 9 Minutes | 1,002 | 21.9% |
| 10 to 14 Minutes | 849 | 18.5% |
| 15 to 19 Minutes | 471 | 10.3% |
| 20 to 24 Minutes | 316 | 6.9% |
| 25 to 29 Minutes | 142 | 3.1% |
| 30 to 34 Minutes | 658 | 14.4% |
| 35 to 39 Minutes | 13 | 0.3% |
| 40 to 44 Minutes | 127 | 2.8% |
| 45 to 59 Minutes | 394 | 8.6% |
| 60 to 89 Minutes | 265 | 5.8% |
| 90 or more Minutes | 81 | 1.8% |
Commute Time by Sex in Plymouth
The most common commute times in Plymouth are 5 to 9 minutes (541 commuters, 21.0%) for males and 5 to 9 minutes (461 commuters, 23.0%) for females.
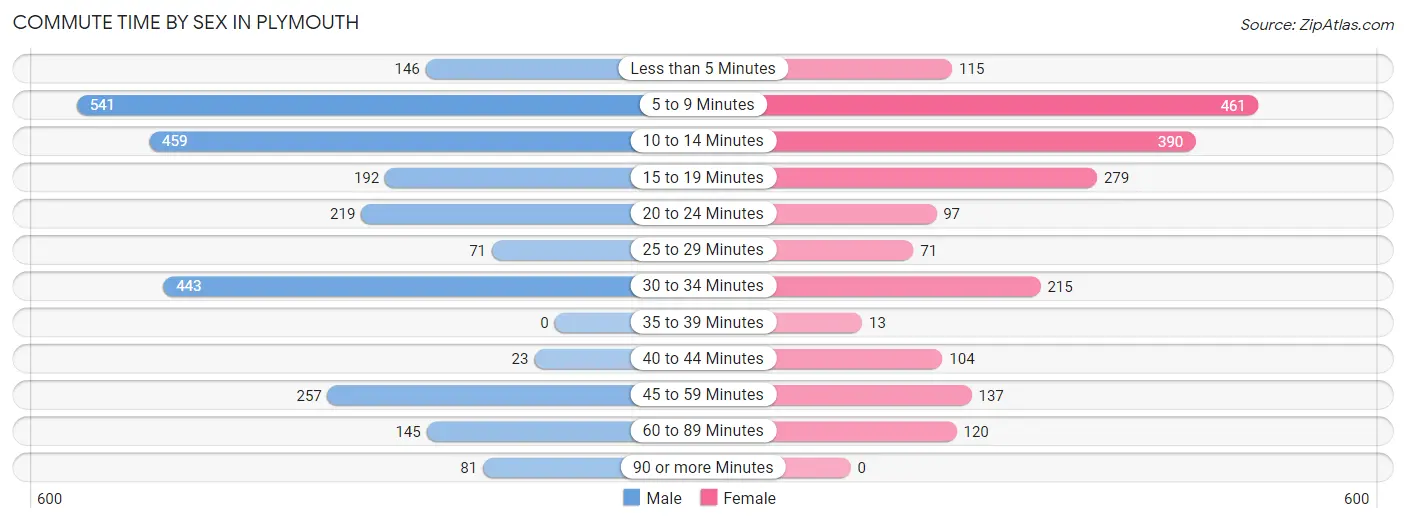
| Commute Time | Male | Female |
| Less than 5 Minutes | 146 (5.7%) | 115 (5.7%) |
| 5 to 9 Minutes | 541 (21.0%) | 461 (23.0%) |
| 10 to 14 Minutes | 459 (17.8%) | 390 (19.5%) |
| 15 to 19 Minutes | 192 (7.4%) | 279 (13.9%) |
| 20 to 24 Minutes | 219 (8.5%) | 97 (4.9%) |
| 25 to 29 Minutes | 71 (2.8%) | 71 (3.5%) |
| 30 to 34 Minutes | 443 (17.2%) | 215 (10.7%) |
| 35 to 39 Minutes | 0 (0.0%) | 13 (0.6%) |
| 40 to 44 Minutes | 23 (0.9%) | 104 (5.2%) |
| 45 to 59 Minutes | 257 (10.0%) | 137 (6.8%) |
| 60 to 89 Minutes | 145 (5.6%) | 120 (6.0%) |
| 90 or more Minutes | 81 (3.1%) | 0 (0.0%) |
Time of Departure to Work by Sex in Plymouth
The most frequent times of departure to work in Plymouth are 4:00 PM to 11:59 PM (553, 21.5%) for males and 12:00 AM to 4:59 AM (297, 14.8%) for females.
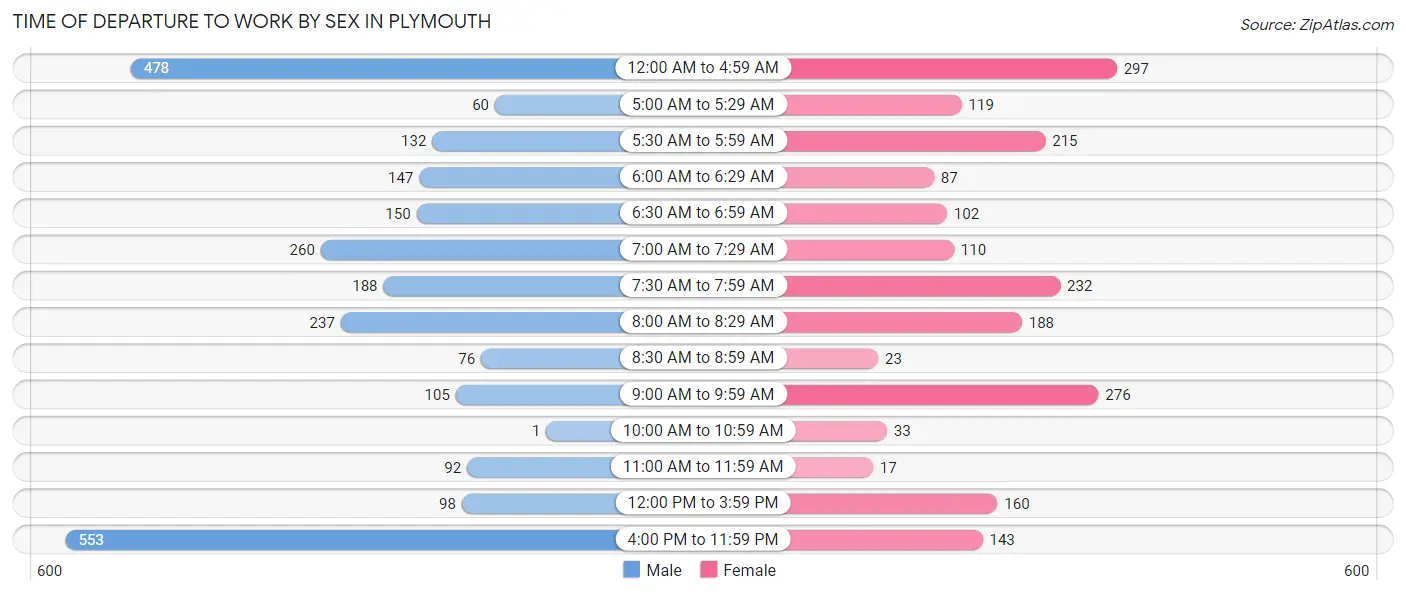
| Time of Departure | Male | Female |
| 12:00 AM to 4:59 AM | 478 (18.5%) | 297 (14.8%) |
| 5:00 AM to 5:29 AM | 60 (2.3%) | 119 (5.9%) |
| 5:30 AM to 5:59 AM | 132 (5.1%) | 215 (10.7%) |
| 6:00 AM to 6:29 AM | 147 (5.7%) | 87 (4.3%) |
| 6:30 AM to 6:59 AM | 150 (5.8%) | 102 (5.1%) |
| 7:00 AM to 7:29 AM | 260 (10.1%) | 110 (5.5%) |
| 7:30 AM to 7:59 AM | 188 (7.3%) | 232 (11.6%) |
| 8:00 AM to 8:29 AM | 237 (9.2%) | 188 (9.4%) |
| 8:30 AM to 8:59 AM | 76 (2.9%) | 23 (1.1%) |
| 9:00 AM to 9:59 AM | 105 (4.1%) | 276 (13.8%) |
| 10:00 AM to 10:59 AM | 1 (0.0%) | 33 (1.7%) |
| 11:00 AM to 11:59 AM | 92 (3.6%) | 17 (0.9%) |
| 12:00 PM to 3:59 PM | 98 (3.8%) | 160 (8.0%) |
| 4:00 PM to 11:59 PM | 553 (21.5%) | 143 (7.1%) |
| Total | 2,577 (100.0%) | 2,002 (100.0%) |
Housing Occupancy in Plymouth
Occupancy by Ownership in Plymouth
Of the total 3,868 dwellings in Plymouth, owner-occupied units account for 2,196 (56.8%), while renter-occupied units make up 1,672 (43.2%).
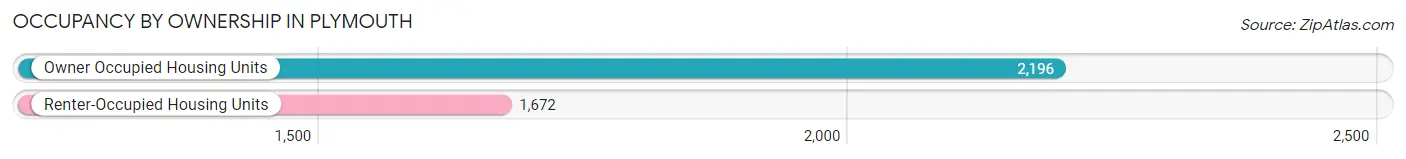
| Occupancy | # Housing Units | % Housing Units |
| Owner Occupied Housing Units | 2,196 | 56.8% |
| Renter-Occupied Housing Units | 1,672 | 43.2% |
| Total Occupied Housing Units | 3,868 | 100.0% |
Occupancy by Household Size in Plymouth
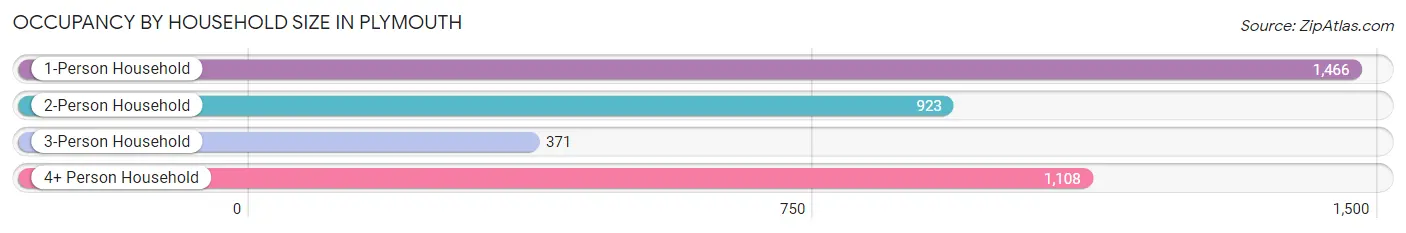
| Household Size | # Housing Units | % Housing Units |
| 1-Person Household | 1,466 | 37.9% |
| 2-Person Household | 923 | 23.9% |
| 3-Person Household | 371 | 9.6% |
| 4+ Person Household | 1,108 | 28.6% |
| Total Housing Units | 3,868 | 100.0% |
Occupancy by Ownership by Household Size in Plymouth
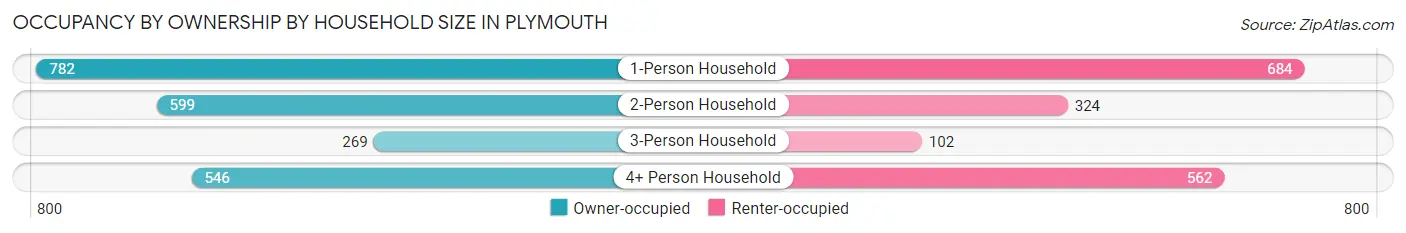
| Household Size | Owner-occupied | Renter-occupied |
| 1-Person Household | 782 (53.3%) | 684 (46.7%) |
| 2-Person Household | 599 (64.9%) | 324 (35.1%) |
| 3-Person Household | 269 (72.5%) | 102 (27.5%) |
| 4+ Person Household | 546 (49.3%) | 562 (50.7%) |
| Total Housing Units | 2,196 (56.8%) | 1,672 (43.2%) |
Occupancy by Educational Attainment in Plymouth
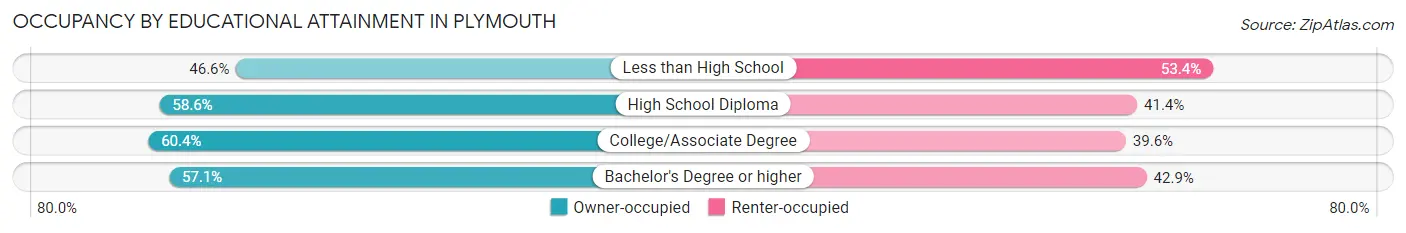
| Household Size | Owner-occupied | Renter-occupied |
| Less than High School | 285 (46.6%) | 327 (53.4%) |
| High School Diploma | 827 (58.6%) | 584 (41.4%) |
| College/Associate Degree | 561 (60.4%) | 368 (39.6%) |
| Bachelor's Degree or higher | 523 (57.1%) | 393 (42.9%) |
Occupancy by Age of Householder in Plymouth
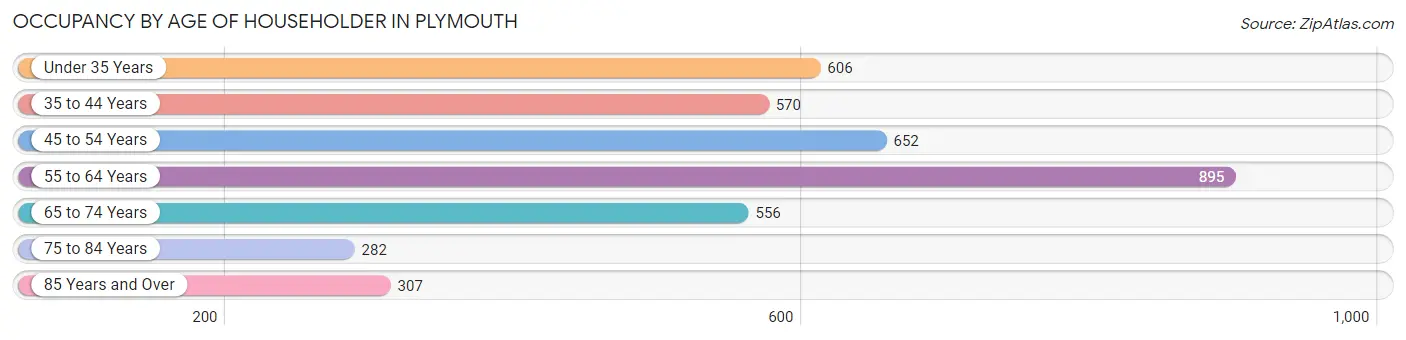
| Age Bracket | # Households | % Households |
| Under 35 Years | 606 | 15.7% |
| 35 to 44 Years | 570 | 14.7% |
| 45 to 54 Years | 652 | 16.9% |
| 55 to 64 Years | 895 | 23.1% |
| 65 to 74 Years | 556 | 14.4% |
| 75 to 84 Years | 282 | 7.3% |
| 85 Years and Over | 307 | 7.9% |
| Total | 3,868 | 100.0% |
Housing Finances in Plymouth
Median Income by Occupancy in Plymouth
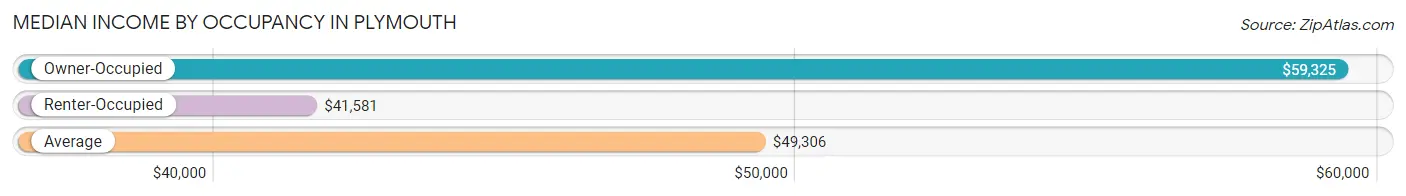
| Occupancy Type | # Households | Median Income |
| Owner-Occupied | 2,196 (56.8%) | $59,325 |
| Renter-Occupied | 1,672 (43.2%) | $41,581 |
| Average | 3,868 (100.0%) | $49,306 |
Occupancy by Householder Income Bracket in Plymouth
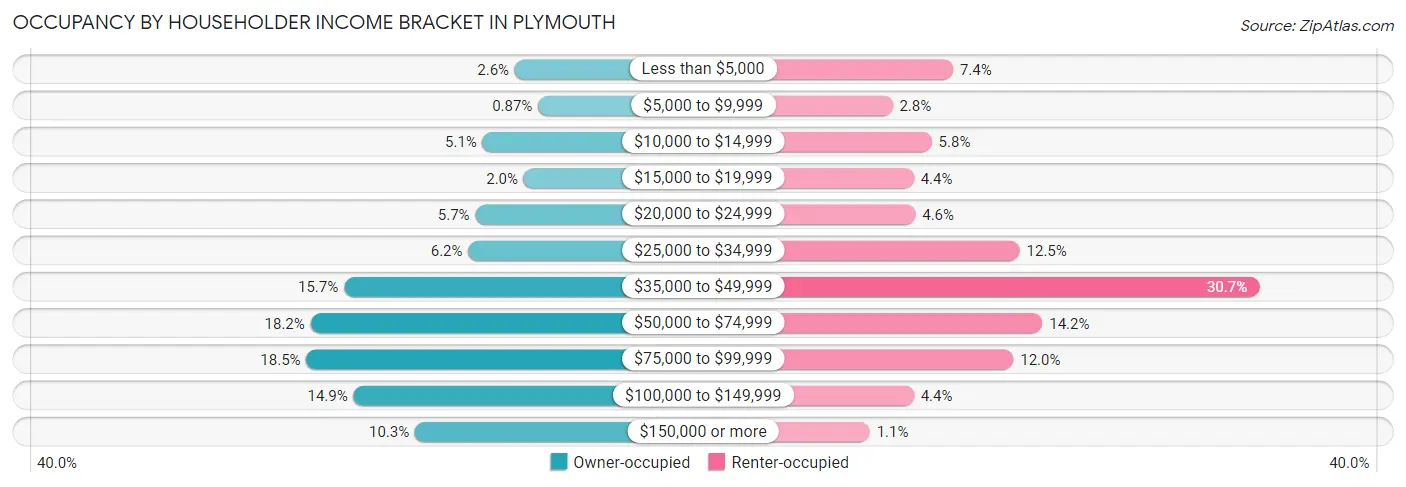
| Income Bracket | Owner-occupied | Renter-occupied |
| Less than $5,000 | 58 (2.6%) | 124 (7.4%) |
| $5,000 to $9,999 | 19 (0.9%) | 47 (2.8%) |
| $10,000 to $14,999 | 112 (5.1%) | 97 (5.8%) |
| $15,000 to $19,999 | 43 (2.0%) | 74 (4.4%) |
| $20,000 to $24,999 | 124 (5.7%) | 76 (4.5%) |
| $25,000 to $34,999 | 136 (6.2%) | 209 (12.5%) |
| $35,000 to $49,999 | 344 (15.7%) | 514 (30.7%) |
| $50,000 to $74,999 | 400 (18.2%) | 238 (14.2%) |
| $75,000 to $99,999 | 407 (18.5%) | 201 (12.0%) |
| $100,000 to $149,999 | 328 (14.9%) | 74 (4.4%) |
| $150,000 or more | 225 (10.2%) | 18 (1.1%) |
| Total | 2,196 (100.0%) | 1,672 (100.0%) |
Monthly Housing Cost Tiers in Plymouth
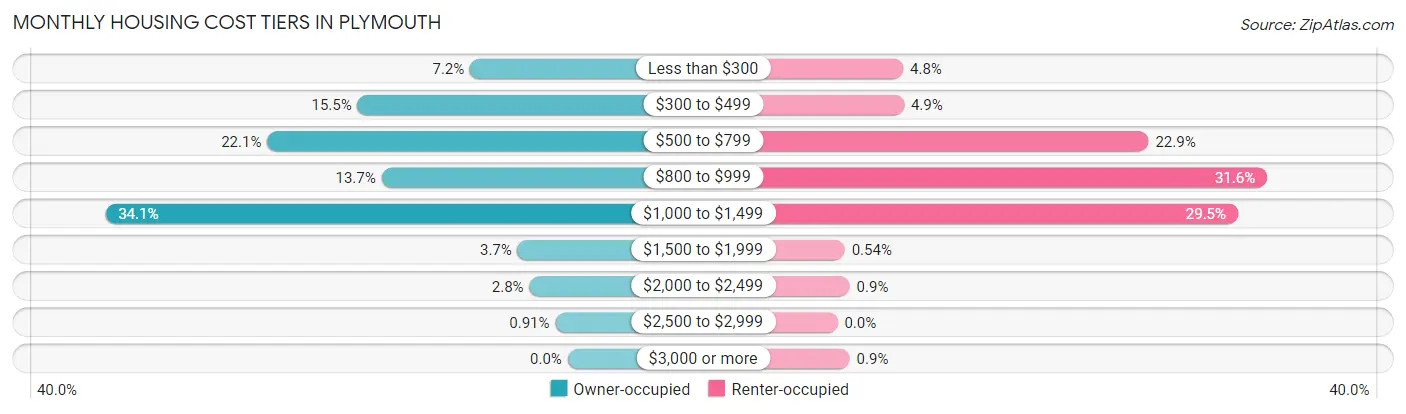
| Monthly Cost | Owner-occupied | Renter-occupied |
| Less than $300 | 158 (7.2%) | 81 (4.8%) |
| $300 to $499 | 340 (15.5%) | 82 (4.9%) |
| $500 to $799 | 486 (22.1%) | 383 (22.9%) |
| $800 to $999 | 301 (13.7%) | 529 (31.6%) |
| $1,000 to $1,499 | 748 (34.1%) | 493 (29.5%) |
| $1,500 to $1,999 | 81 (3.7%) | 9 (0.5%) |
| $2,000 to $2,499 | 62 (2.8%) | 15 (0.9%) |
| $2,500 to $2,999 | 20 (0.9%) | 0 (0.0%) |
| $3,000 or more | 0 (0.0%) | 15 (0.9%) |
| Total | 2,196 (100.0%) | 1,672 (100.0%) |
Physical Housing Characteristics in Plymouth
Housing Structures in Plymouth
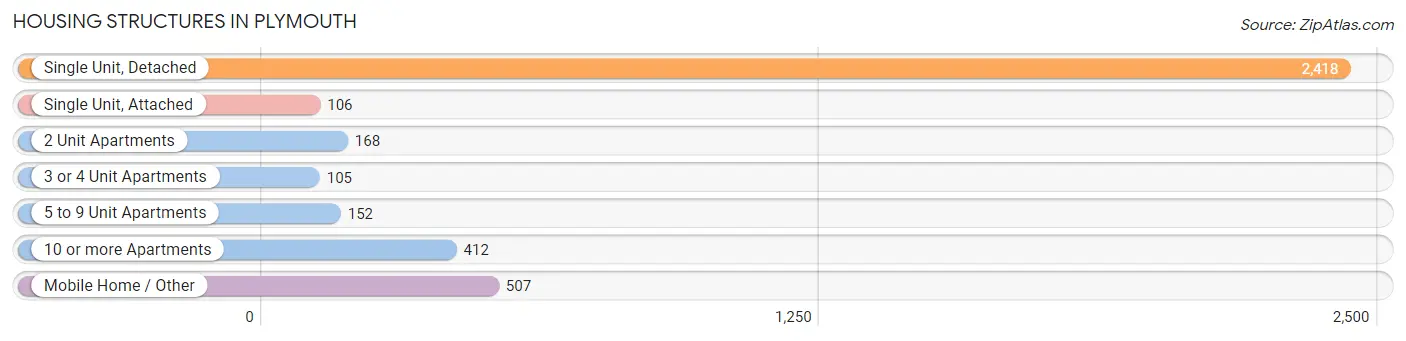
| Structure Type | # Housing Units | % Housing Units |
| Single Unit, Detached | 2,418 | 62.5% |
| Single Unit, Attached | 106 | 2.7% |
| 2 Unit Apartments | 168 | 4.3% |
| 3 or 4 Unit Apartments | 105 | 2.7% |
| 5 to 9 Unit Apartments | 152 | 3.9% |
| 10 or more Apartments | 412 | 10.6% |
| Mobile Home / Other | 507 | 13.1% |
| Total | 3,868 | 100.0% |
Housing Structures by Occupancy in Plymouth
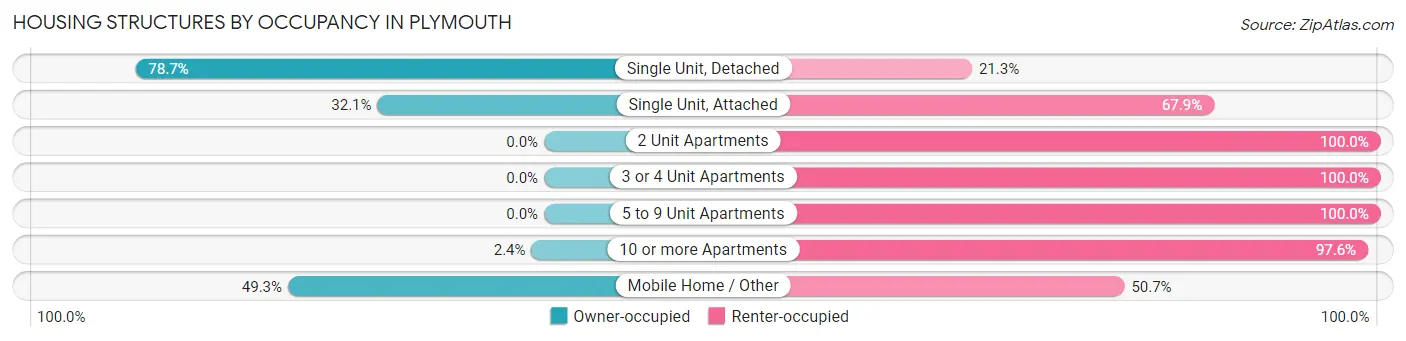
| Structure Type | Owner-occupied | Renter-occupied |
| Single Unit, Detached | 1,902 (78.7%) | 516 (21.3%) |
| Single Unit, Attached | 34 (32.1%) | 72 (67.9%) |
| 2 Unit Apartments | 0 (0.0%) | 168 (100.0%) |
| 3 or 4 Unit Apartments | 0 (0.0%) | 105 (100.0%) |
| 5 to 9 Unit Apartments | 0 (0.0%) | 152 (100.0%) |
| 10 or more Apartments | 10 (2.4%) | 402 (97.6%) |
| Mobile Home / Other | 250 (49.3%) | 257 (50.7%) |
| Total | 2,196 (56.8%) | 1,672 (43.2%) |
Housing Structures by Number of Rooms in Plymouth
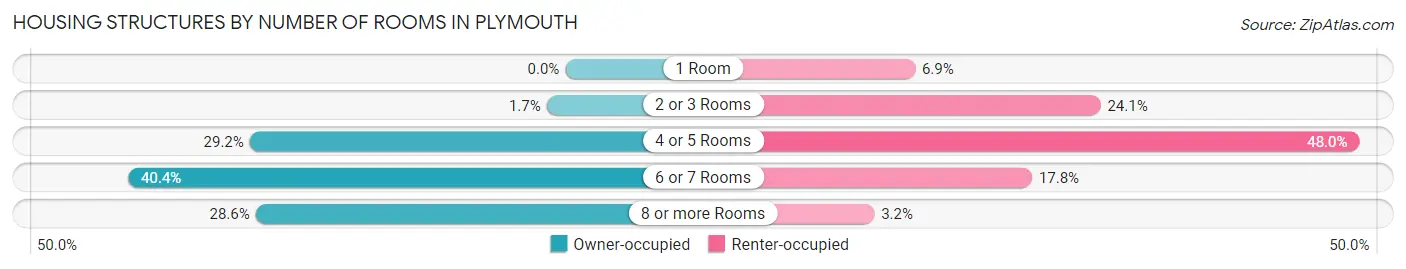
| Number of Rooms | Owner-occupied | Renter-occupied |
| 1 Room | 0 (0.0%) | 116 (6.9%) |
| 2 or 3 Rooms | 38 (1.7%) | 403 (24.1%) |
| 4 or 5 Rooms | 641 (29.2%) | 803 (48.0%) |
| 6 or 7 Rooms | 888 (40.4%) | 297 (17.8%) |
| 8 or more Rooms | 629 (28.6%) | 53 (3.2%) |
| Total | 2,196 (100.0%) | 1,672 (100.0%) |
Housing Structure by Heating Type in Plymouth
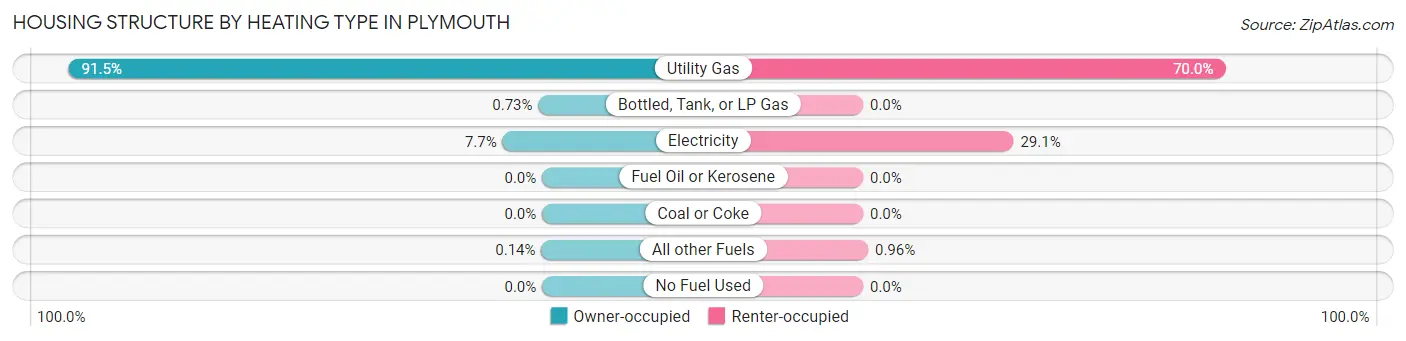
| Heating Type | Owner-occupied | Renter-occupied |
| Utility Gas | 2,009 (91.5%) | 1,170 (70.0%) |
| Bottled, Tank, or LP Gas | 16 (0.7%) | 0 (0.0%) |
| Electricity | 168 (7.6%) | 486 (29.1%) |
| Fuel Oil or Kerosene | 0 (0.0%) | 0 (0.0%) |
| Coal or Coke | 0 (0.0%) | 0 (0.0%) |
| All other Fuels | 3 (0.1%) | 16 (1.0%) |
| No Fuel Used | 0 (0.0%) | 0 (0.0%) |
| Total | 2,196 (100.0%) | 1,672 (100.0%) |
Household Vehicle Usage in Plymouth
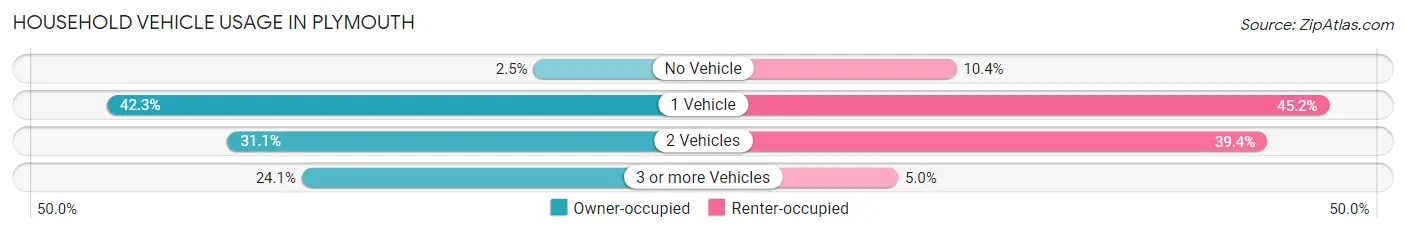
| Vehicles per Household | Owner-occupied | Renter-occupied |
| No Vehicle | 55 (2.5%) | 174 (10.4%) |
| 1 Vehicle | 929 (42.3%) | 756 (45.2%) |
| 2 Vehicles | 682 (31.1%) | 659 (39.4%) |
| 3 or more Vehicles | 530 (24.1%) | 83 (5.0%) |
| Total | 2,196 (100.0%) | 1,672 (100.0%) |
Real Estate & Mortgages in Plymouth
Real Estate and Mortgage Overview in Plymouth
| Characteristic | Without Mortgage | With Mortgage |
| Housing Units | 789 | 1,407 |
| Median Property Value | $114,400 | $118,400 |
| Median Household Income | $38,974 | $196 |
| Monthly Housing Costs | $454 | $0 |
| Real Estate Taxes | $642 | $58 |
Property Value by Mortgage Status in Plymouth
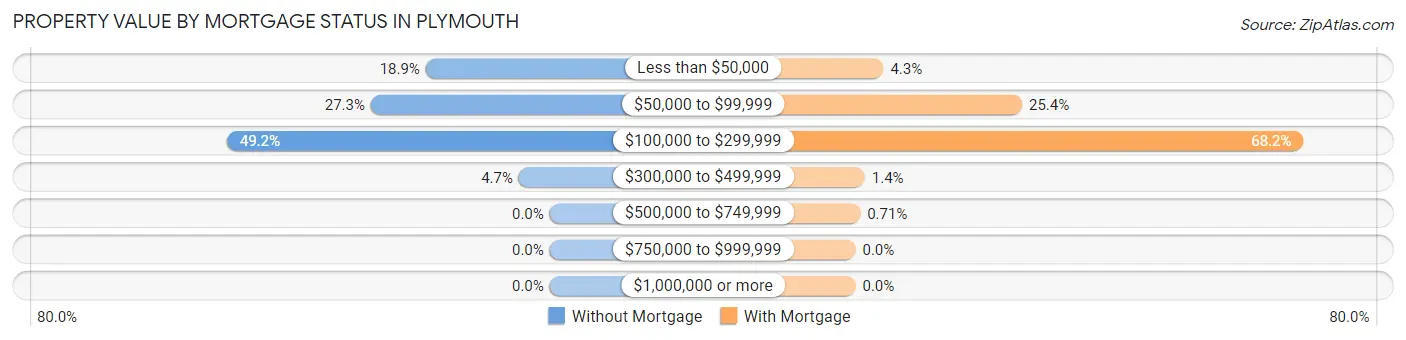
| Property Value | Without Mortgage | With Mortgage |
| Less than $50,000 | 149 (18.9%) | 60 (4.3%) |
| $50,000 to $99,999 | 215 (27.3%) | 357 (25.4%) |
| $100,000 to $299,999 | 388 (49.2%) | 960 (68.2%) |
| $300,000 to $499,999 | 37 (4.7%) | 20 (1.4%) |
| $500,000 to $749,999 | 0 (0.0%) | 10 (0.7%) |
| $750,000 to $999,999 | 0 (0.0%) | 0 (0.0%) |
| $1,000,000 or more | 0 (0.0%) | 0 (0.0%) |
| Total | 789 (100.0%) | 1,407 (100.0%) |
Household Income by Mortgage Status in Plymouth
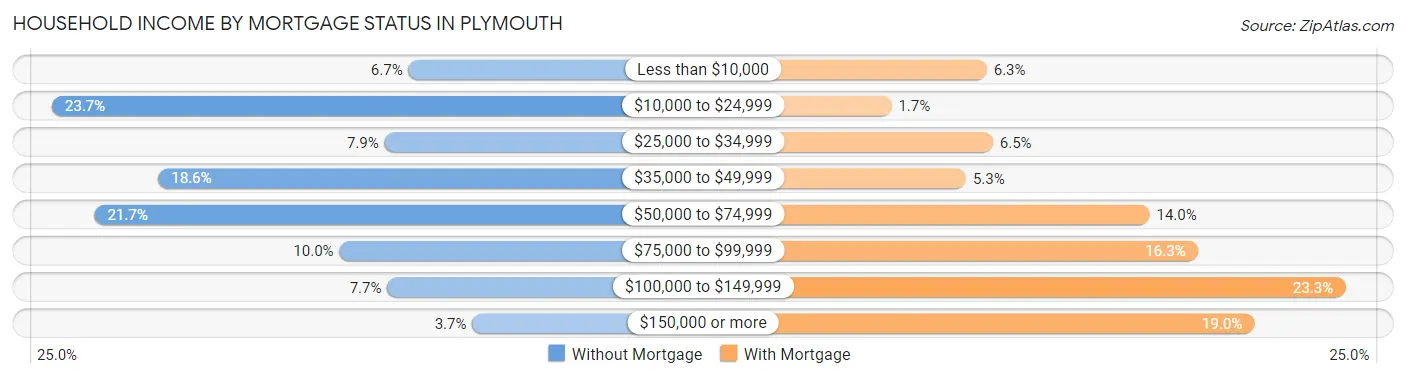
| Household Income | Without Mortgage | With Mortgage |
| Less than $10,000 | 53 (6.7%) | 88 (6.2%) |
| $10,000 to $24,999 | 187 (23.7%) | 24 (1.7%) |
| $25,000 to $34,999 | 62 (7.9%) | 92 (6.5%) |
| $35,000 to $49,999 | 147 (18.6%) | 74 (5.3%) |
| $50,000 to $74,999 | 171 (21.7%) | 197 (14.0%) |
| $75,000 to $99,999 | 79 (10.0%) | 229 (16.3%) |
| $100,000 to $149,999 | 61 (7.7%) | 328 (23.3%) |
| $150,000 or more | 29 (3.7%) | 267 (19.0%) |
| Total | 789 (100.0%) | 1,407 (100.0%) |
Property Value to Household Income Ratio in Plymouth
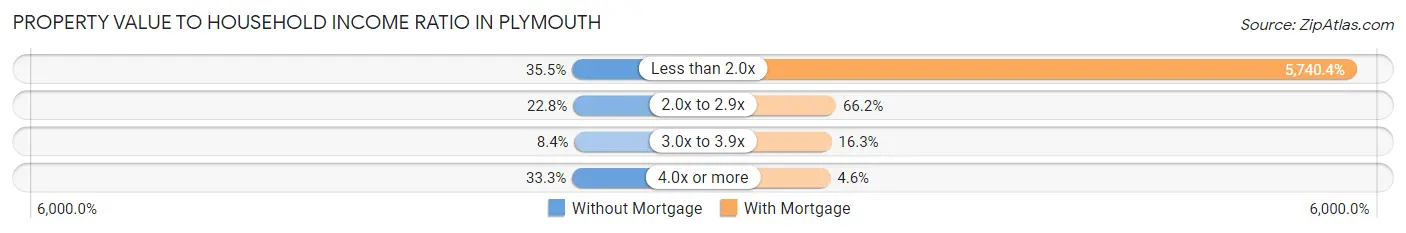
| Value-to-Income Ratio | Without Mortgage | With Mortgage |
| Less than 2.0x | 280 (35.5%) | 80,768 (5,740.4%) |
| 2.0x to 2.9x | 180 (22.8%) | 931 (66.2%) |
| 3.0x to 3.9x | 66 (8.4%) | 229 (16.3%) |
| 4.0x or more | 263 (33.3%) | 65 (4.6%) |
| Total | 789 (100.0%) | 1,407 (100.0%) |
Real Estate Taxes by Mortgage Status in Plymouth
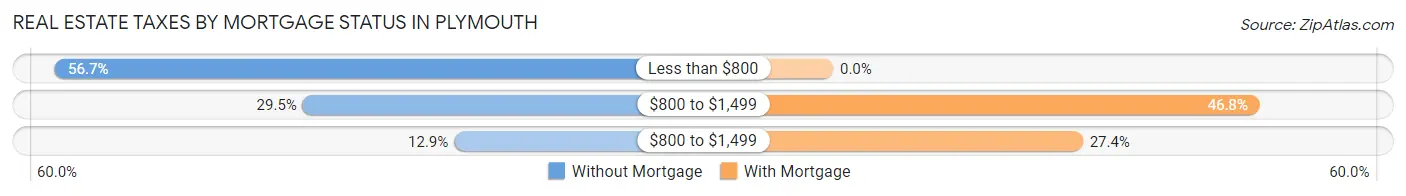
| Property Taxes | Without Mortgage | With Mortgage |
| Less than $800 | 447 (56.7%) | 0 (0.0%) |
| $800 to $1,499 | 233 (29.5%) | 658 (46.8%) |
| $800 to $1,499 | 102 (12.9%) | 385 (27.4%) |
| Total | 789 (100.0%) | 1,407 (100.0%) |
Health & Disability in Plymouth
Health Insurance Coverage by Age in Plymouth
| Age Bracket | With Coverage | Without Coverage |
| Under 6 Years | 674 (80.5%) | 163 (19.5%) |
| 6 to 18 Years | 1,914 (90.7%) | 197 (9.3%) |
| 19 to 25 Years | 744 (83.7%) | 145 (16.3%) |
| 26 to 34 Years | 720 (61.0%) | 461 (39.0%) |
| 35 to 44 Years | 845 (70.9%) | 347 (29.1%) |
| 45 to 54 Years | 995 (87.4%) | 144 (12.6%) |
| 55 to 64 Years | 1,049 (92.0%) | 91 (8.0%) |
| 65 to 74 Years | 784 (100.0%) | 0 (0.0%) |
| 75 Years and older | 752 (100.0%) | 0 (0.0%) |
| Total | 8,477 (84.6%) | 1,548 (15.4%) |
Health Insurance Coverage by Citizenship Status in Plymouth
| Citizenship Status | With Coverage | Without Coverage |
| Native Born | 674 (80.5%) | 163 (19.5%) |
| Foreign Born, Citizen | 1,914 (90.7%) | 197 (9.3%) |
| Foreign Born, not a Citizen | 744 (83.7%) | 145 (16.3%) |
Health Insurance Coverage by Household Income in Plymouth
| Household Income | With Coverage | Without Coverage |
| Under $25,000 | 875 (79.5%) | 225 (20.4%) |
| $25,000 to $49,999 | 1,877 (76.5%) | 576 (23.5%) |
| $50,000 to $74,999 | 1,107 (92.2%) | 94 (7.8%) |
| $75,000 to $99,999 | 2,005 (86.1%) | 325 (14.0%) |
| $100,000 and over | 2,580 (88.7%) | 328 (11.3%) |
Public vs Private Health Insurance Coverage by Age in Plymouth
| Age Bracket | Public Insurance | Private Insurance |
| Under 6 | 364 (43.5%) | 327 (39.1%) |
| 6 to 18 Years | 889 (42.1%) | 1,226 (58.1%) |
| 19 to 25 Years | 57 (6.4%) | 707 (79.5%) |
| 25 to 34 Years | 234 (19.8%) | 528 (44.7%) |
| 35 to 44 Years | 177 (14.8%) | 746 (62.6%) |
| 45 to 54 Years | 128 (11.2%) | 892 (78.3%) |
| 55 to 64 Years | 239 (21.0%) | 844 (74.0%) |
| 65 to 74 Years | 731 (93.2%) | 358 (45.7%) |
| 75 Years and over | 752 (100.0%) | 407 (54.1%) |
| Total | 3,571 (35.6%) | 6,035 (60.2%) |
Disability Status by Sex by Age in Plymouth
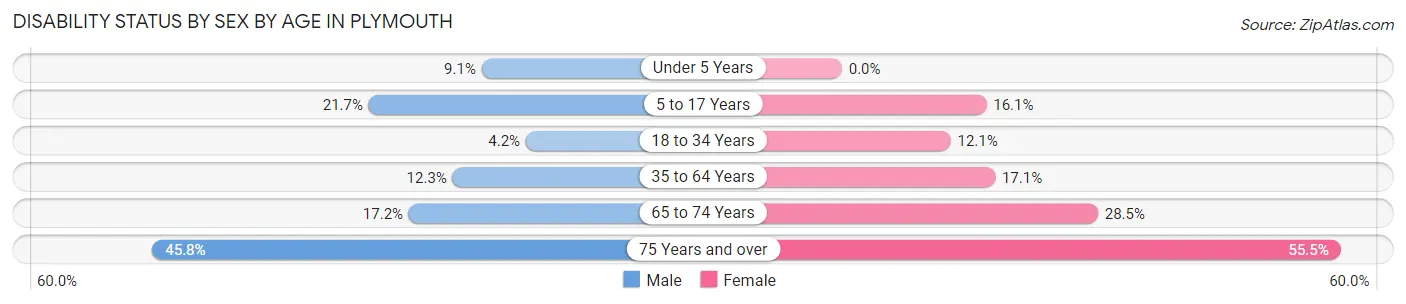
| Age Bracket | Male | Female |
| Under 5 Years | 45 (9.1%) | 0 (0.0%) |
| 5 to 17 Years | 233 (21.7%) | 149 (16.1%) |
| 18 to 34 Years | 50 (4.2%) | 131 (12.1%) |
| 35 to 64 Years | 227 (12.3%) | 278 (17.1%) |
| 65 to 74 Years | 54 (17.2%) | 134 (28.5%) |
| 75 Years and over | 92 (45.8%) | 306 (55.5%) |
Disability Class by Sex by Age in Plymouth
Disability Class: Hearing Difficulty
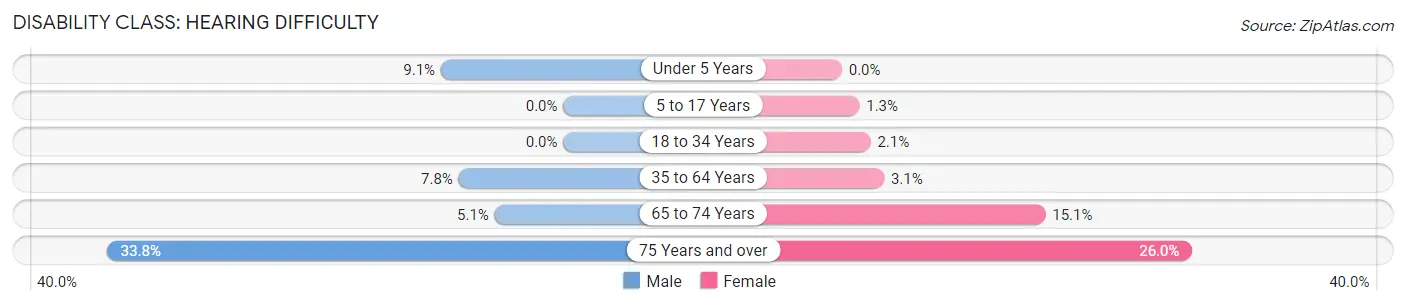
| Age Bracket | Male | Female |
| Under 5 Years | 45 (9.1%) | 0 (0.0%) |
| 5 to 17 Years | 0 (0.0%) | 12 (1.3%) |
| 18 to 34 Years | 0 (0.0%) | 23 (2.1%) |
| 35 to 64 Years | 143 (7.8%) | 51 (3.1%) |
| 65 to 74 Years | 16 (5.1%) | 71 (15.1%) |
| 75 Years and over | 68 (33.8%) | 143 (26.0%) |
Disability Class: Vision Difficulty
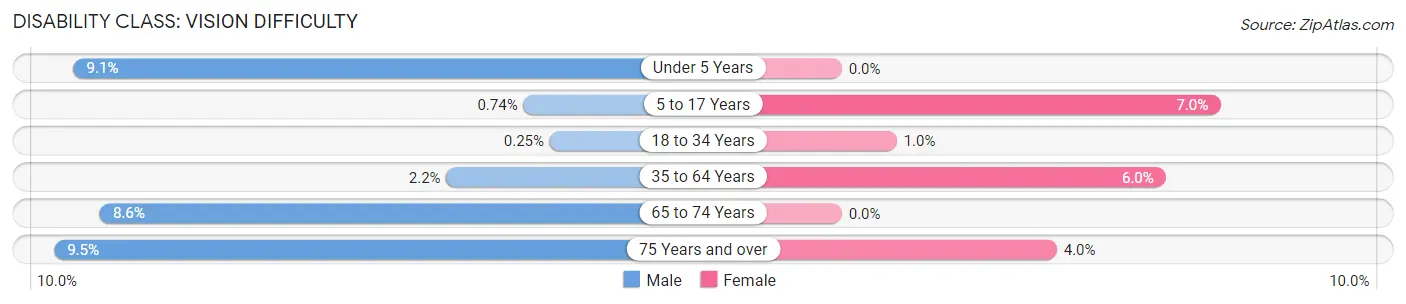
| Age Bracket | Male | Female |
| Under 5 Years | 45 (9.1%) | 0 (0.0%) |
| 5 to 17 Years | 8 (0.7%) | 65 (7.0%) |
| 18 to 34 Years | 3 (0.3%) | 11 (1.0%) |
| 35 to 64 Years | 40 (2.2%) | 98 (6.0%) |
| 65 to 74 Years | 27 (8.6%) | 0 (0.0%) |
| 75 Years and over | 19 (9.5%) | 22 (4.0%) |
Disability Class: Cognitive Difficulty
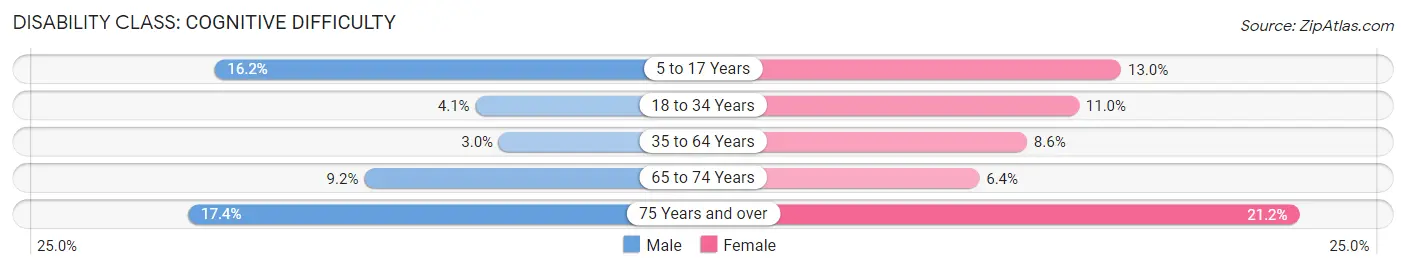
| Age Bracket | Male | Female |
| 5 to 17 Years | 174 (16.2%) | 120 (13.0%) |
| 18 to 34 Years | 49 (4.1%) | 119 (11.0%) |
| 35 to 64 Years | 55 (3.0%) | 140 (8.6%) |
| 65 to 74 Years | 29 (9.2%) | 30 (6.4%) |
| 75 Years and over | 35 (17.4%) | 117 (21.2%) |
Disability Class: Ambulatory Difficulty
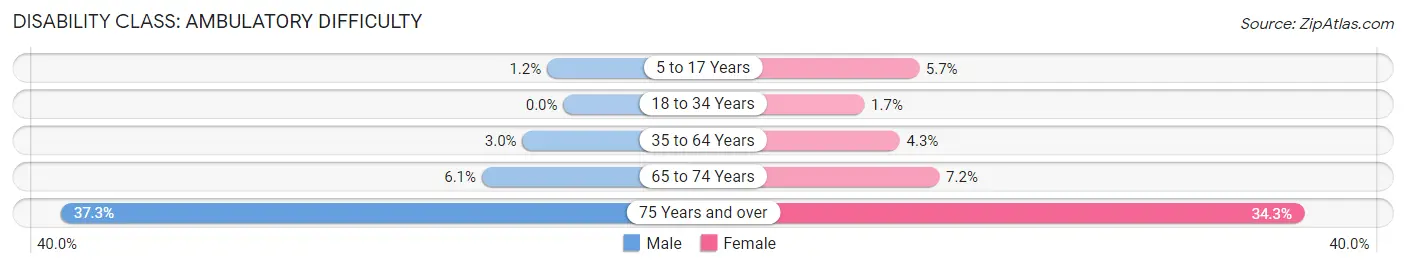
| Age Bracket | Male | Female |
| 5 to 17 Years | 13 (1.2%) | 53 (5.7%) |
| 18 to 34 Years | 0 (0.0%) | 18 (1.7%) |
| 35 to 64 Years | 56 (3.0%) | 70 (4.3%) |
| 65 to 74 Years | 19 (6.0%) | 34 (7.2%) |
| 75 Years and over | 75 (37.3%) | 189 (34.3%) |
Disability Class: Self-Care Difficulty
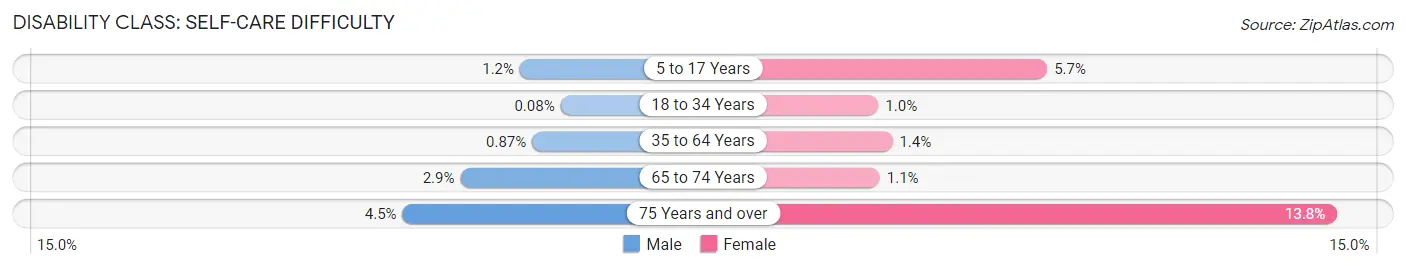
| Age Bracket | Male | Female |
| 5 to 17 Years | 13 (1.2%) | 53 (5.7%) |
| 18 to 34 Years | 1 (0.1%) | 11 (1.0%) |
| 35 to 64 Years | 16 (0.9%) | 23 (1.4%) |
| 65 to 74 Years | 9 (2.9%) | 5 (1.1%) |
| 75 Years and over | 9 (4.5%) | 76 (13.8%) |
Technology Access in Plymouth
Computing Device Access in Plymouth
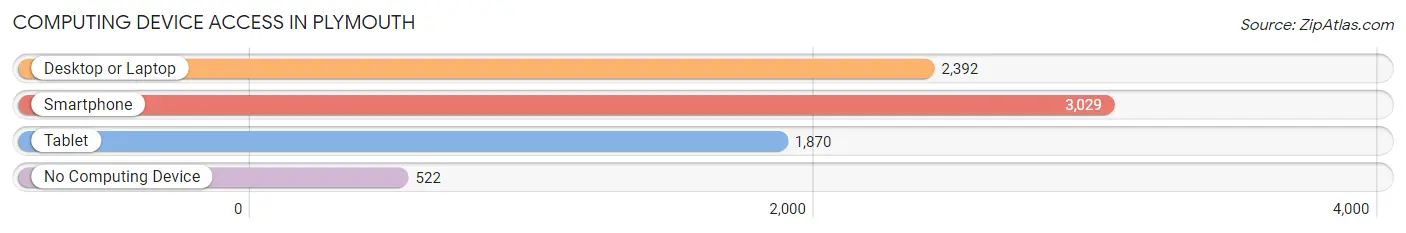
| Device Type | # Households | % Households |
| Desktop or Laptop | 2,392 | 61.8% |
| Smartphone | 3,029 | 78.3% |
| Tablet | 1,870 | 48.3% |
| No Computing Device | 522 | 13.5% |
| Total | 3,868 | 100.0% |
Internet Access in Plymouth
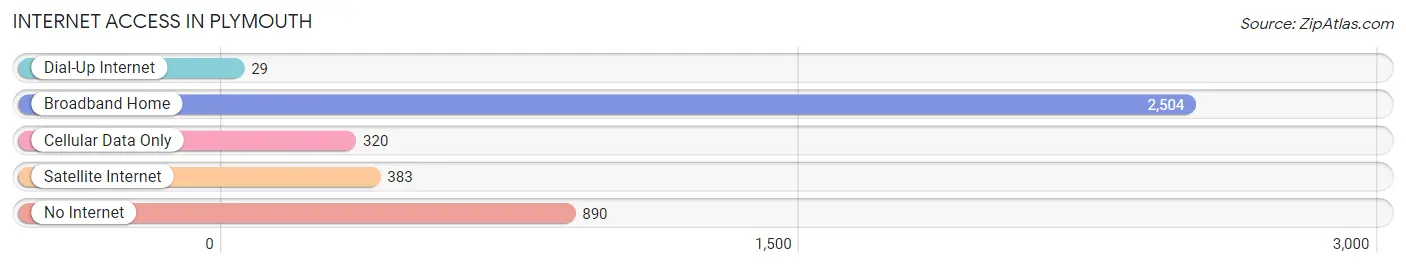
| Internet Type | # Households | % Households |
| Dial-Up Internet | 29 | 0.7% |
| Broadband Home | 2,504 | 64.7% |
| Cellular Data Only | 320 | 8.3% |
| Satellite Internet | 383 | 9.9% |
| No Internet | 890 | 23.0% |
| Total | 3,868 | 100.0% |
Plymouth Summary
Plymouth, Indiana is a city located in Marshall County, Indiana, United States. It is the county seat of Marshall County and is located in the northern part of the state, about 25 miles south of South Bend. The population of Plymouth was 10,033 at the 2010 census, making it the largest city in Marshall County.
History
Plymouth was founded in 1834 by settlers from New England. The town was named after Plymouth, Massachusetts, the original settlement of the Pilgrims. The first settlers were mostly farmers from New England, and the town was laid out in a grid pattern. The first post office was established in 1837, and the first school was built in 1838.
The town grew slowly until the arrival of the railroad in 1851. The railroad brought new industry and jobs to the area, and the population began to grow rapidly. By the turn of the century, Plymouth had become a thriving industrial center, with several factories producing furniture, clothing, and other goods.
Geography
Plymouth is located in northern Indiana, about 25 miles south of South Bend. The city is situated on the Yellow River, which flows through the city and is a popular recreational spot for fishing and boating. The city is surrounded by farmland and woodlands, and is located in the Tippecanoe River Valley.
The climate in Plymouth is typical of the Midwest, with hot summers and cold winters. The average temperature in July is around 80 degrees Fahrenheit, and the average temperature in January is around 20 degrees Fahrenheit.
Economy
Plymouth’s economy is largely based on manufacturing and agriculture. The city is home to several factories that produce furniture, clothing, and other goods. The city is also home to several agricultural businesses, including dairy farms, grain elevators, and feed mills.
The city is also home to several retail stores, restaurants, and other businesses. The city is served by several major highways, including US 31, US 30, and US 6.
Demographics
As of the 2010 census, the population of Plymouth was 10,033. The racial makeup of the city was 95.3% White, 0.7% African American, 0.3% Native American, 0.7% Asian, 0.1% Pacific Islander, 1.3% from other races, and 1.9% from two or more races. Hispanic or Latino of any race were 3.2% of the population.
The median income for a household in the city was $41,945, and the median income for a family was $50,945. The per capita income for the city was $20,945. About 11.3% of families and 14.2% of the population were below the poverty line, including 19.2% of those under age 18 and 8.2% of those age 65 or over.
Plymouth is a diverse city with a rich history and a strong economy. The city is home to several factories and agricultural businesses, as well as a variety of retail stores and restaurants. The city is served by several major highways, making it a convenient location for commuters. The city is also home to a diverse population, with a variety of racial and ethnic backgrounds.
Common Questions
What is the Total Population of Plymouth?
Total Population of Plymouth is 10,369.
What is the Total Male Population of Plymouth?
Total Male Population of Plymouth is 5,294.
What is the Total Female Population of Plymouth?
Total Female Population of Plymouth is 5,075.
What is the Ratio of Males per 100 Females in Plymouth?
There are 104.32 Males per 100 Females in Plymouth.
What is the Ratio of Females per 100 Males in Plymouth?
There are 95.86 Females per 100 Males in Plymouth.
What is the Median Population Age in Plymouth?
Median Population Age in Plymouth is 35.4 Years.
What is the Average Family Size in Plymouth
Average Family Size in Plymouth is 3.5 People.
What is the Average Household Size in Plymouth
Average Household Size in Plymouth is 2.6 People.
What is Per Capita Income in Plymouth?
Per Capita income in Plymouth is $26,797.
What is the Median Family Income in Plymouth?
Median Family Income in Plymouth is $73,346.
What is the Median Household income in Plymouth?
Median Household Income in Plymouth is $49,306.
What is Income or Wage Gap in Plymouth?
Income or Wage Gap in Plymouth is 21.8%.
Women in Plymouth earn 78.2 cents for every dollar earned by a man.
What is Inequality or Gini Index in Plymouth?
Inequality or Gini Index in Plymouth is 0.44.
How Large is the Labor Force in Plymouth?
There are 4,945 People in the Labor Forcein in Plymouth.
What is the Percentage of People in the Labor Force in Plymouth?
62.0% of People are in the Labor Force in Plymouth.
What is the Unemployment Rate in Plymouth?
Unemployment Rate in Plymouth is 4.5%.