Heritage Lake, IN
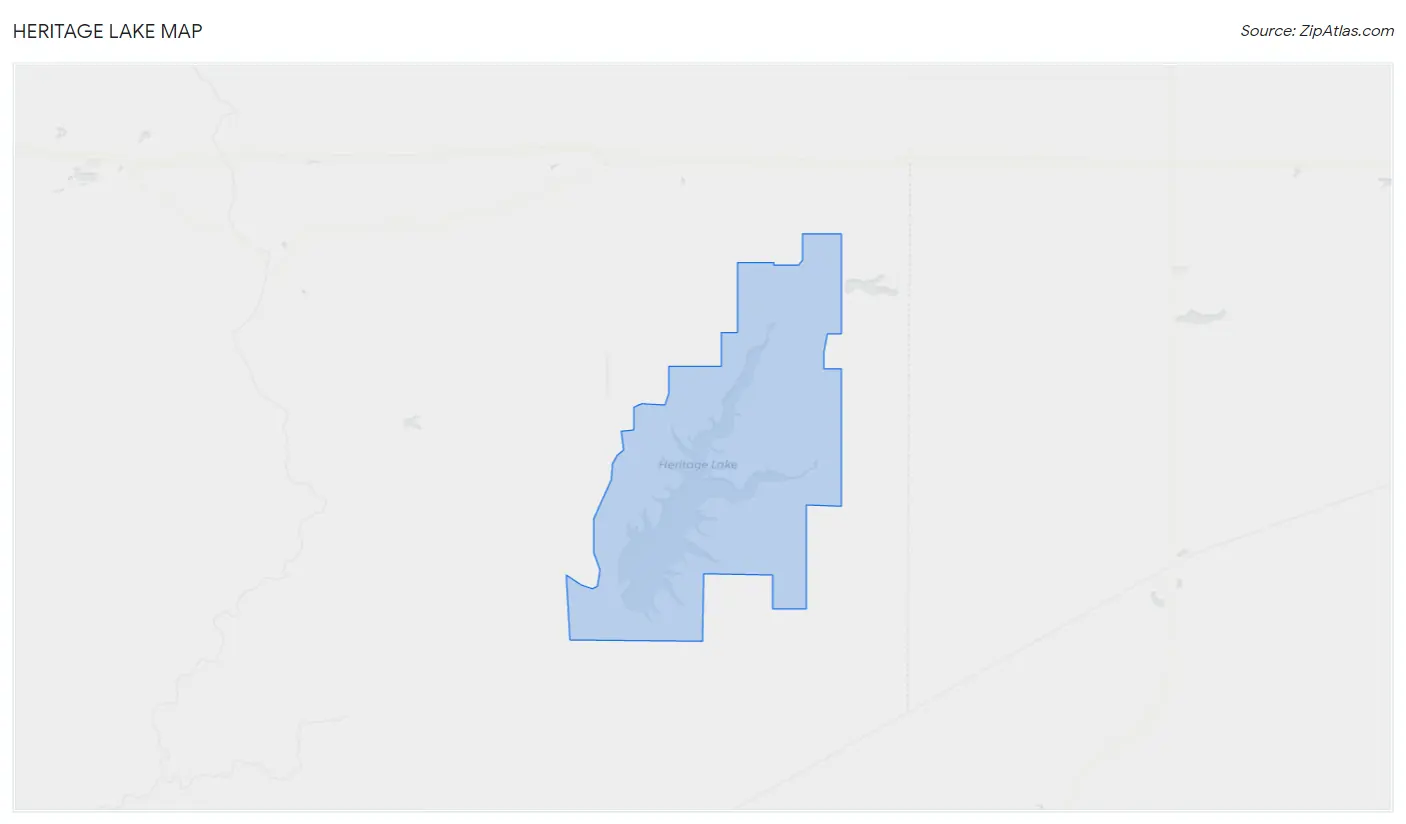
Heritage Lake Map
Heritage Lake Overview
2,770
TOTAL POPULATION
1,338
MALE POPULATION
1,432
FEMALE POPULATION
93.44
MALES / 100 FEMALES
107.03
FEMALES / 100 MALES
33.8
MEDIAN AGE
2.2
AVG FAMILY SIZE
2.1
AVG HOUSEHOLD SIZE
$38,793
PER CAPITA INCOME
$74,242
AVG FAMILY INCOME
$76,573
AVG HOUSEHOLD INCOME
57.8%
WAGE / INCOME GAP [ % ]
42.2¢/ $1
WAGE / INCOME GAP [ $ ]
0.34
INEQUALITY / GINI INDEX
1,666
LABOR FORCE [ PEOPLE ]
73.5%
PERCENT IN LABOR FORCE
4.5%
UNEMPLOYMENT RATE
Race in Heritage Lake
The most populous races in Heritage Lake are White / Caucasian (2,742 | 99.0%), Native / Alaskan (16 | 0.6%), and Some other Race (12 | 0.4%).
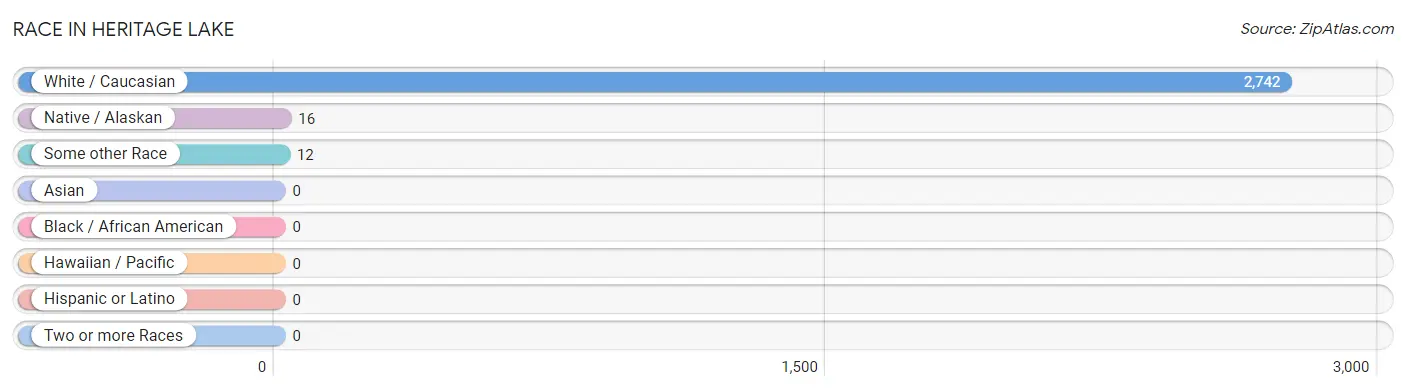
| Race | # Population | % Population |
| Asian | 0 | 0.0% |
| Black / African American | 0 | 0.0% |
| Hawaiian / Pacific | 0 | 0.0% |
| Hispanic or Latino | 0 | 0.0% |
| Native / Alaskan | 16 | 0.6% |
| White / Caucasian | 2,742 | 99.0% |
| Two or more Races | 0 | 0.0% |
| Some other Race | 12 | 0.4% |
| Total | 2,770 | 100.0% |
Ancestry in Heritage Lake
The most populous ancestries reported in Heritage Lake are German (511 | 18.4%), European (416 | 15.0%), English (236 | 8.5%), American (209 | 7.5%), and Irish (197 | 7.1%), together accounting for 56.7% of all Heritage Lake residents.
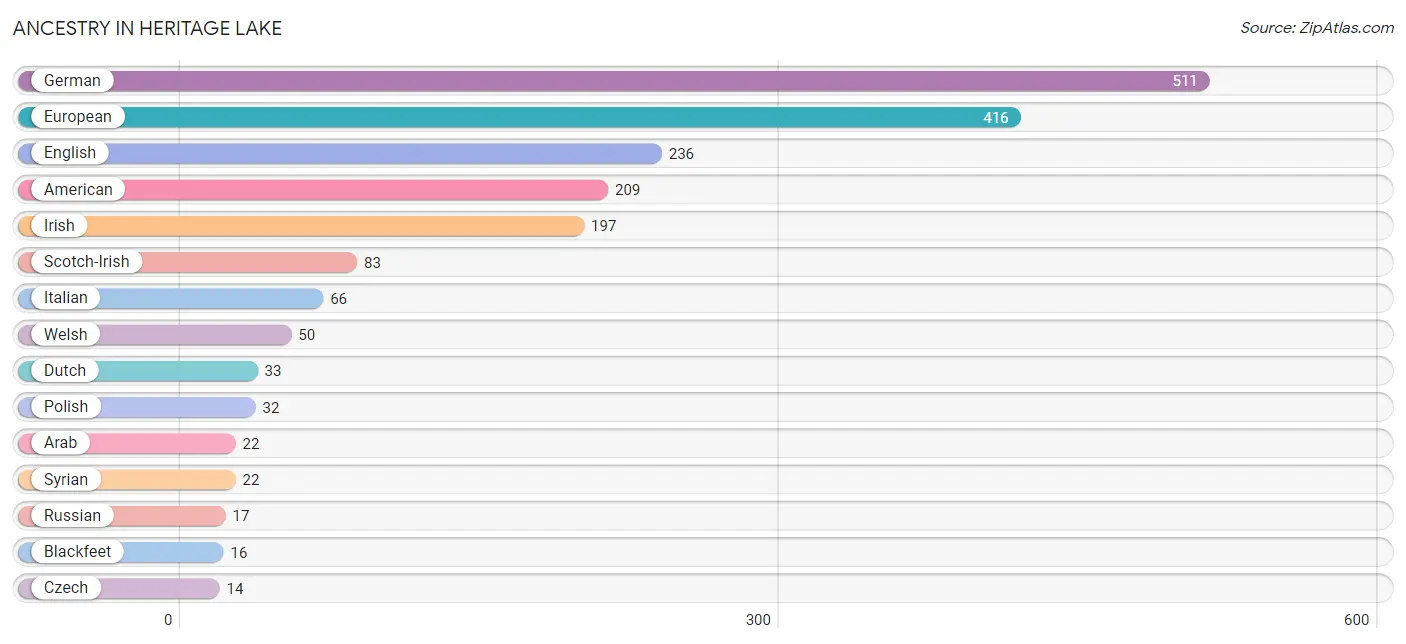
| Ancestry | # Population | % Population |
| American | 209 | 7.5% |
| Arab | 22 | 0.8% |
| Austrian | 8 | 0.3% |
| Belgian | 5 | 0.2% |
| Blackfeet | 16 | 0.6% |
| Czech | 14 | 0.5% |
| Dutch | 33 | 1.2% |
| English | 236 | 8.5% |
| European | 416 | 15.0% |
| French | 14 | 0.5% |
| German | 511 | 18.4% |
| Irish | 197 | 7.1% |
| Italian | 66 | 2.4% |
| Lithuanian | 6 | 0.2% |
| Polish | 32 | 1.2% |
| Romanian | 10 | 0.4% |
| Russian | 17 | 0.6% |
| Scotch-Irish | 83 | 3.0% |
| Scottish | 13 | 0.5% |
| Slavic | 9 | 0.3% |
| Swedish | 5 | 0.2% |
| Swiss | 9 | 0.3% |
| Syrian | 22 | 0.8% |
| Welsh | 50 | 1.8% | View All 24 Rows |
Immigrants in Heritage Lake
The most numerous immigrant groups reported in Heritage Lake came from Europe (15 | 0.5%), Netherlands (15 | 0.5%), and Western Europe (15 | 0.5%), together accounting for 1.6% of all Heritage Lake residents.

| Immigration Origin | # Population | % Population |
| Europe | 15 | 0.5% |
| Netherlands | 15 | 0.5% |
| Western Europe | 15 | 0.5% | View All 3 Rows |
Sex and Age in Heritage Lake
Sex and Age in Heritage Lake
The most populous age groups in Heritage Lake are 30 to 34 Years (216 | 16.1%) for men and 30 to 34 Years (318 | 22.2%) for women.

| Age Bracket | Male | Female |
| Under 5 Years | 51 (3.8%) | 76 (5.3%) |
| 5 to 9 Years | 132 (9.9%) | 0 (0.0%) |
| 10 to 14 Years | 64 (4.8%) | 178 (12.4%) |
| 15 to 19 Years | 30 (2.2%) | 0 (0.0%) |
| 20 to 24 Years | 79 (5.9%) | 65 (4.5%) |
| 25 to 29 Years | 172 (12.9%) | 124 (8.7%) |
| 30 to 34 Years | 216 (16.1%) | 318 (22.2%) |
| 35 to 39 Years | 32 (2.4%) | 77 (5.4%) |
| 40 to 44 Years | 99 (7.4%) | 73 (5.1%) |
| 45 to 49 Years | 88 (6.6%) | 82 (5.7%) |
| 50 to 54 Years | 49 (3.7%) | 46 (3.2%) |
| 55 to 59 Years | 20 (1.5%) | 53 (3.7%) |
| 60 to 64 Years | 151 (11.3%) | 137 (9.6%) |
| 65 to 69 Years | 87 (6.5%) | 107 (7.5%) |
| 70 to 74 Years | 38 (2.8%) | 48 (3.4%) |
| 75 to 79 Years | 27 (2.0%) | 47 (3.3%) |
| 80 to 84 Years | 3 (0.2%) | 0 (0.0%) |
| 85 Years and over | 0 (0.0%) | 1 (0.1%) |
| Total | 1,338 (100.0%) | 1,432 (100.0%) |
Families and Households in Heritage Lake
Median Family Size in Heritage Lake
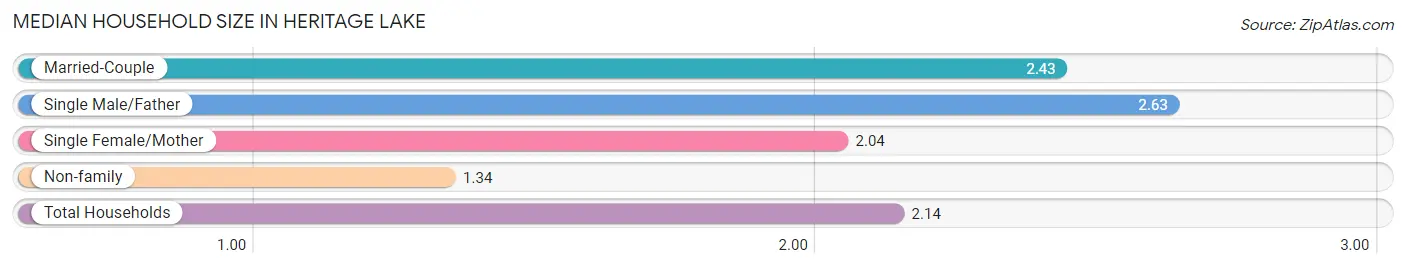
The median family size in Heritage Lake is 2.20 persons per family, with married-couple families (596 | 62.3%) accounting for the largest median family size of 2.43 persons per family. On the other hand, single male/father families (213 | 22.3%) represent the smallest median family size with 1.67 persons per family.
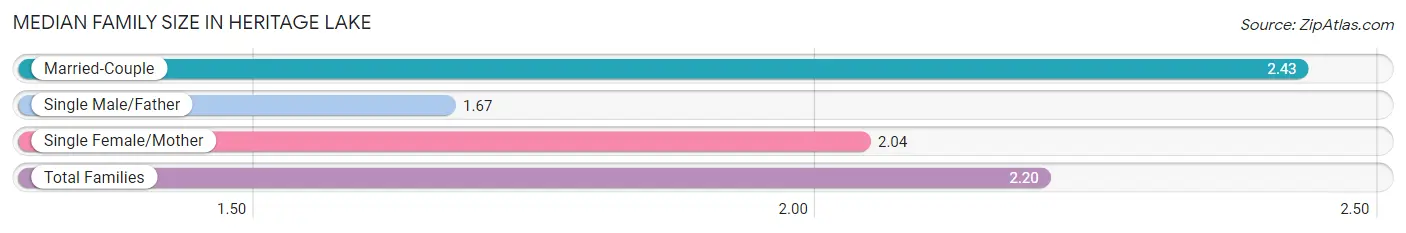
| Family Type | # Families | Family Size |
| Married-Couple | 596 (62.3%) | 2.43 |
| Single Male/Father | 213 (22.3%) | 1.67 |
| Single Female/Mother | 147 (15.4%) | 2.04 |
| Total Families | 956 (100.0%) | 2.20 |
Median Household Size in Heritage Lake
The median household size in Heritage Lake is 2.14 persons per household, with single male/father households (213 | 16.4%) accounting for the largest median household size of 2.63 persons per household. non-family households (341 | 26.3%) represent the smallest median household size with 1.34 persons per household.
| Household Type | # Households | Household Size |
| Married-Couple | 596 (46.0%) | 2.43 |
| Single Male/Father | 213 (16.4%) | 2.63 |
| Single Female/Mother | 147 (11.3%) | 2.04 |
| Non-family | 341 (26.3%) | 1.34 |
| Total Households | 1,297 (100.0%) | 2.14 |
Household Size by Marriage Status in Heritage Lake
Out of a total of 1,297 households in Heritage Lake, 956 (73.7%) are family households, while 341 (26.3%) are nonfamily households. The most numerous type of family households are 2-person households, comprising 469, and the most common type of nonfamily households are 1-person households, comprising 210.

| Household Size | Family Households | Nonfamily Households |
| 1-Person Households | - | 210 (16.2%) |
| 2-Person Households | 469 (36.2%) | 131 (10.1%) |
| 3-Person Households | 322 (24.8%) | 0 (0.0%) |
| 4-Person Households | 91 (7.0%) | 0 (0.0%) |
| 5-Person Households | 74 (5.7%) | 0 (0.0%) |
| 6-Person Households | 0 (0.0%) | 0 (0.0%) |
| 7+ Person Households | 0 (0.0%) | 0 (0.0%) |
| Total | 956 (73.7%) | 341 (26.3%) |
Female Fertility in Heritage Lake
Fertility by Age in Heritage Lake
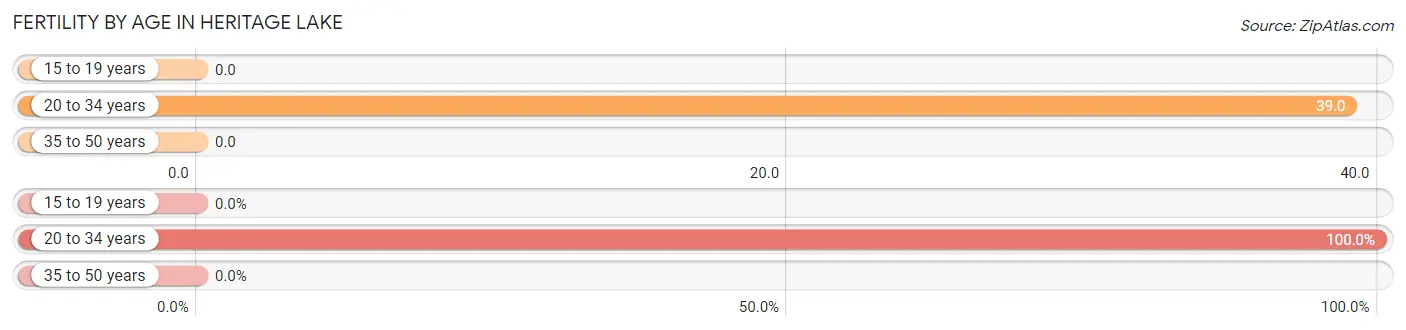
Average fertility rate in Heritage Lake is 26.0 births per 1,000 women. Women in the age bracket of 20 to 34 years have the highest fertility rate with 39.0 births per 1,000 women. Women in the age bracket of 20 to 34 years acount for 100.0% of all women with births.
| Age Bracket | Women with Births | Births / 1,000 Women |
| 15 to 19 years | 0 (0.0%) | 0.0 |
| 20 to 34 years | 20 (100.0%) | 39.0 |
| 35 to 50 years | 0 (0.0%) | 0.0 |
| Total | 20 (100.0%) | 26.0 |
Fertility by Age by Marriage Status in Heritage Lake
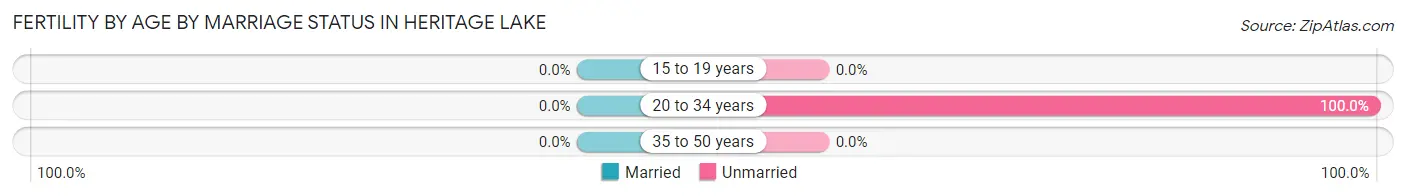
| Age Bracket | Married | Unmarried |
| 15 to 19 years | 0 (0.0%) | 0 (0.0%) |
| 20 to 34 years | 0 (0.0%) | 20 (100.0%) |
| 35 to 50 years | 0 (0.0%) | 0 (0.0%) |
| Total | 0 (0.0%) | 20 (100.0%) |
Fertility by Education in Heritage Lake
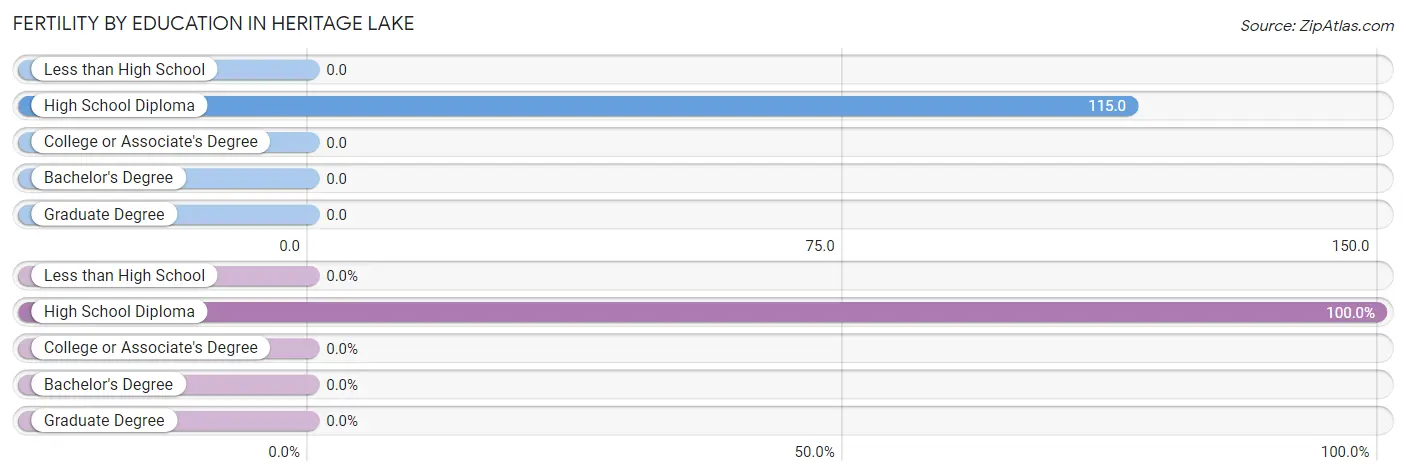
| Educational Attainment | Women with Births | Births / 1,000 Women |
| Less than High School | 0 (0.0%) | 0.0 |
| High School Diploma | 20 (100.0%) | 115.0 |
| College or Associate's Degree | 0 (0.0%) | 0.0 |
| Bachelor's Degree | 0 (0.0%) | 0.0 |
| Graduate Degree | 0 (0.0%) | 0.0 |
| Total | 20 (100.0%) | 26.0 |
Fertility by Education by Marriage Status in Heritage Lake
| Educational Attainment | Married | Unmarried |
| Less than High School | 0 (0.0%) | 0 (0.0%) |
| High School Diploma | 0 (0.0%) | 20 (100.0%) |
| College or Associate's Degree | 0 (0.0%) | 0 (0.0%) |
| Bachelor's Degree | 0 (0.0%) | 0 (0.0%) |
| Graduate Degree | 0 (0.0%) | 0 (0.0%) |
| Total | 0 (0.0%) | 20 (100.0%) |
Income in Heritage Lake
Income Overview in Heritage Lake
Per Capita Income in Heritage Lake is $38,793, while median incomes of families and households are $74,242 and $76,573 respectively.
| Characteristic | Number | Measure |
| Per Capita Income | 2,770 | $38,793 |
| Median Family Income | 956 | $74,242 |
| Mean Family Income | 956 | $89,518 |
| Median Household Income | 1,297 | $76,573 |
| Mean Household Income | 1,297 | $86,982 |
| Income Deficit | 956 | $0 |
| Wage / Income Gap (%) | 2,770 | 57.83% |
| Wage / Income Gap ($) | 2,770 | 42.17¢ per $1 |
| Gini / Inequality Index | 2,770 | 0.34 |
Earnings by Sex in Heritage Lake
Average Earnings in Heritage Lake are $51,875, $58,208 for men and $24,544 for women, a difference of 57.8%.
| Sex | Number | Average Earnings |
| Male | 874 (51.8%) | $58,208 |
| Female | 812 (48.2%) | $24,544 |
| Total | 1,686 (100.0%) | $51,875 |
Earnings by Sex by Income Bracket in Heritage Lake
The most common earnings brackets in Heritage Lake are $100,000+ for men (185 | 21.2%) and $22,500 to $24,999 for women (170 | 20.9%).
| Income | Male | Female |
| $2,499 or less | 17 (1.9%) | 22 (2.7%) |
| $2,500 to $4,999 | 0 (0.0%) | 48 (5.9%) |
| $5,000 to $7,499 | 15 (1.7%) | 17 (2.1%) |
| $7,500 to $9,999 | 0 (0.0%) | 25 (3.1%) |
| $10,000 to $12,499 | 14 (1.6%) | 121 (14.9%) |
| $12,500 to $14,999 | 0 (0.0%) | 0 (0.0%) |
| $15,000 to $17,499 | 0 (0.0%) | 0 (0.0%) |
| $17,500 to $19,999 | 33 (3.8%) | 0 (0.0%) |
| $20,000 to $22,499 | 8 (0.9%) | 34 (4.2%) |
| $22,500 to $24,999 | 18 (2.1%) | 170 (20.9%) |
| $25,000 to $29,999 | 0 (0.0%) | 92 (11.3%) |
| $30,000 to $34,999 | 40 (4.6%) | 19 (2.3%) |
| $35,000 to $39,999 | 26 (3.0%) | 29 (3.6%) |
| $40,000 to $44,999 | 17 (1.9%) | 25 (3.1%) |
| $45,000 to $49,999 | 20 (2.3%) | 0 (0.0%) |
| $50,000 to $54,999 | 172 (19.7%) | 7 (0.9%) |
| $55,000 to $64,999 | 175 (20.0%) | 40 (4.9%) |
| $65,000 to $74,999 | 105 (12.0%) | 49 (6.0%) |
| $75,000 to $99,999 | 29 (3.3%) | 70 (8.6%) |
| $100,000+ | 185 (21.2%) | 44 (5.4%) |
| Total | 874 (100.0%) | 812 (100.0%) |
Earnings by Sex by Educational Attainment in Heritage Lake
Average earnings in Heritage Lake are $58,396 for men and $24,728 for women, a difference of 57.7%. Men with an educational attainment of bachelor's degree enjoy the highest average annual earnings of $89,205, while those with college or associate's degree education earn the least with $54,583. Women with an educational attainment of college or associate's degree earn the most with the average annual earnings of $24,051, while those with college or associate's degree education have the smallest earnings of $24,051.
| Educational Attainment | Male Income | Female Income |
| Less than High School | $58,511 | $0 |
| High School Diploma | $68,886 | $0 |
| College or Associate's Degree | $54,583 | $24,051 |
| Bachelor's Degree | $89,205 | $0 |
| Graduate Degree | - | - |
| Total | $58,396 | $24,728 |
Family Income in Heritage Lake
Family Income Brackets in Heritage Lake
According to the Heritage Lake family income data, there are 360 families falling into the $50,000 to $74,999 income range, which is the most common income bracket and makes up 37.7% of all families. Conversely, the $15,000 to $24,999 income bracket is the least frequent group with only 6 families (0.6%) belonging to this category.
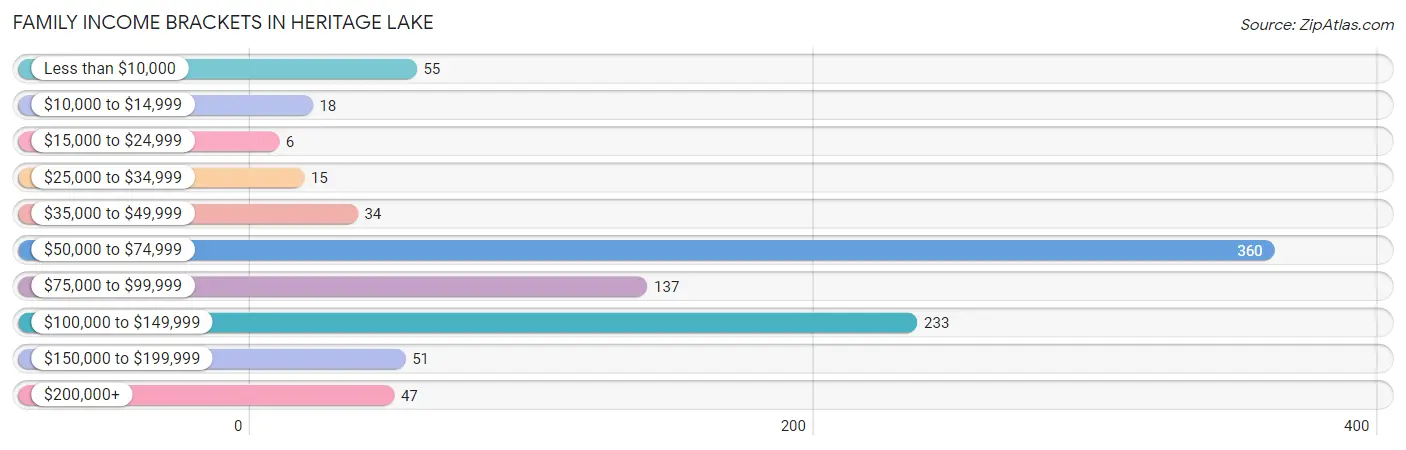
| Income Bracket | # Families | % Families |
| Less than $10,000 | 55 | 5.8% |
| $10,000 to $14,999 | 18 | 1.9% |
| $15,000 to $24,999 | 6 | 0.6% |
| $25,000 to $34,999 | 15 | 1.6% |
| $35,000 to $49,999 | 34 | 3.6% |
| $50,000 to $74,999 | 360 | 37.7% |
| $75,000 to $99,999 | 137 | 14.3% |
| $100,000 to $149,999 | 233 | 24.4% |
| $150,000 to $199,999 | 51 | 5.3% |
| $200,000+ | 47 | 4.9% |
Family Income by Famaliy Size in Heritage Lake
4-person families (45 | 4.7%) account for the highest median family income in Heritage Lake with $121,583 per family, while 2-person families (636 | 66.5%) have the highest median income of $37,310 per family member.
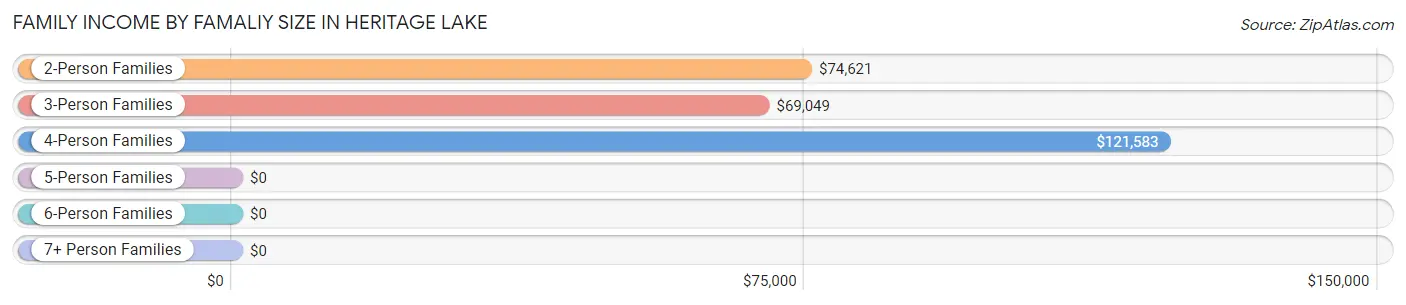
| Income Bracket | # Families | Median Income |
| 2-Person Families | 636 (66.5%) | $74,621 |
| 3-Person Families | 201 (21.0%) | $69,049 |
| 4-Person Families | 45 (4.7%) | $121,583 |
| 5-Person Families | 74 (7.7%) | $0 |
| 6-Person Families | 0 (0.0%) | $0 |
| 7+ Person Families | 0 (0.0%) | $0 |
| Total | 956 (100.0%) | $74,242 |
Family Income by Number of Earners in Heritage Lake
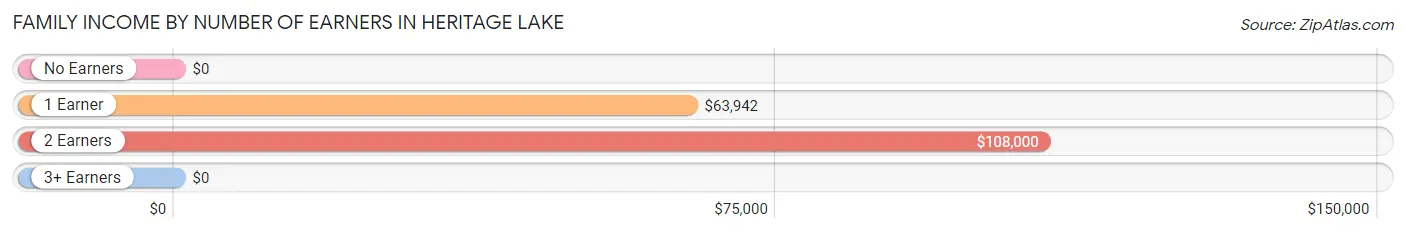
| Number of Earners | # Families | Median Income |
| No Earners | 122 (12.8%) | $0 |
| 1 Earner | 419 (43.8%) | $63,942 |
| 2 Earners | 398 (41.6%) | $108,000 |
| 3+ Earners | 17 (1.8%) | $0 |
| Total | 956 (100.0%) | $74,242 |
Household Income in Heritage Lake
Household Income Brackets in Heritage Lake
With 351 households falling in the category, the $75,000 to $99,999 income range is the most frequent in Heritage Lake, accounting for 27.1% of all households. In contrast, only 16 households (1.2%) fall into the $25,000 to $34,999 income bracket, making it the least populous group.
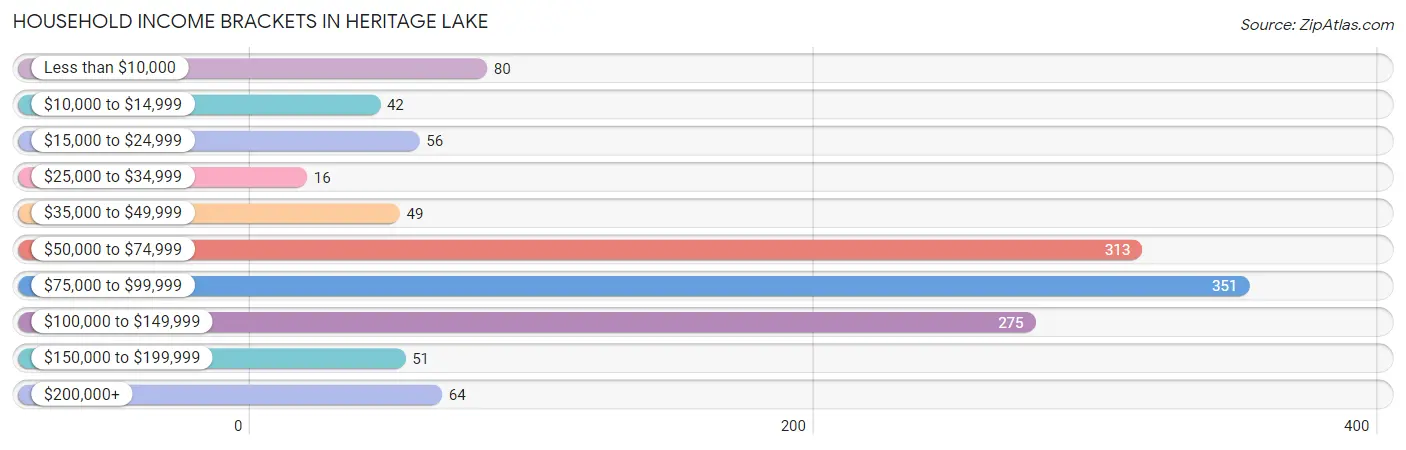
| Income Bracket | # Households | % Households |
| Less than $10,000 | 80 | 6.2% |
| $10,000 to $14,999 | 42 | 3.2% |
| $15,000 to $24,999 | 56 | 4.3% |
| $25,000 to $34,999 | 16 | 1.2% |
| $35,000 to $49,999 | 49 | 3.8% |
| $50,000 to $74,999 | 313 | 24.1% |
| $75,000 to $99,999 | 351 | 27.1% |
| $100,000 to $149,999 | 275 | 21.2% |
| $150,000 to $199,999 | 51 | 3.9% |
| $200,000+ | 64 | 4.9% |
Household Income by Householder Age in Heritage Lake
The median household income in Heritage Lake is $76,573, with the highest median household income of $112,656 found in the 45 to 64 years age bracket for the primary householder. A total of 385 households (29.7%) fall into this category. Meanwhile, the 15 to 24 years age bracket for the primary householder has the lowest median household income of $0, with 32 households (2.5%) in this group.
| Income Bracket | # Households | Median Income |
| 15 to 24 Years | 32 (2.5%) | $0 |
| 25 to 44 Years | 631 (48.6%) | $76,165 |
| 45 to 64 Years | 385 (29.7%) | $112,656 |
| 65+ Years | 249 (19.2%) | $57,781 |
| Total | 1,297 (100.0%) | $76,573 |
Poverty in Heritage Lake
Income Below Poverty by Sex and Age in Heritage Lake
With 6.7% poverty level for males and 17.2% for females among the residents of Heritage Lake, 6 to 11 year old males and under 5 year old females are the most vulnerable to poverty, with 36 males (20.3%) and 45 females (59.2%) in their respective age groups living below the poverty level.
| Age Bracket | Male | Female |
| Under 5 Years | 0 (0.0%) | 45 (59.2%) |
| 5 Years | 0 (0.0%) | 0 (0.0%) |
| 6 to 11 Years | 36 (20.3%) | 0 (0.0%) |
| 12 to 14 Years | 0 (0.0%) | 0 (0.0%) |
| 15 Years | 0 (0.0%) | 0 (0.0%) |
| 16 and 17 Years | 0 (0.0%) | 0 (0.0%) |
| 18 to 24 Years | 0 (0.0%) | 0 (0.0%) |
| 25 to 34 Years | 0 (0.0%) | 172 (38.9%) |
| 35 to 44 Years | 0 (0.0%) | 0 (0.0%) |
| 45 to 54 Years | 15 (11.0%) | 0 (0.0%) |
| 55 to 64 Years | 14 (8.2%) | 11 (5.8%) |
| 65 to 74 Years | 24 (19.2%) | 18 (11.6%) |
| 75 Years and over | 0 (0.0%) | 0 (0.0%) |
| Total | 89 (6.7%) | 246 (17.2%) |
Income Above Poverty by Sex and Age in Heritage Lake
According to the poverty statistics in Heritage Lake, males aged under 5 years and females aged 6 to 11 years are the age groups that are most secure financially, with 100.0% of males and 100.0% of females in these age groups living above the poverty line.
| Age Bracket | Male | Female |
| Under 5 Years | 51 (100.0%) | 31 (40.8%) |
| 5 Years | 0 (0.0%) | 0 (0.0%) |
| 6 to 11 Years | 141 (79.7%) | 37 (100.0%) |
| 12 to 14 Years | 19 (100.0%) | 141 (100.0%) |
| 15 Years | 3 (100.0%) | 0 (0.0%) |
| 16 and 17 Years | 27 (100.0%) | 0 (0.0%) |
| 18 to 24 Years | 79 (100.0%) | 65 (100.0%) |
| 25 to 34 Years | 388 (100.0%) | 270 (61.1%) |
| 35 to 44 Years | 131 (100.0%) | 150 (100.0%) |
| 45 to 54 Years | 122 (89.0%) | 128 (100.0%) |
| 55 to 64 Years | 157 (91.8%) | 179 (94.2%) |
| 65 to 74 Years | 101 (80.8%) | 137 (88.4%) |
| 75 Years and over | 30 (100.0%) | 48 (100.0%) |
| Total | 1,249 (93.3%) | 1,186 (82.8%) |
Income Below Poverty Among Married-Couple Families in Heritage Lake
The poverty statistics for married-couple families in Heritage Lake show that 3.0% or 18 of the total 596 families live below the poverty line. Families with no children have the highest poverty rate of 4.4%, comprising of 18 families. On the other hand, families with 1 or 2 children have the lowest poverty rate of 0.0%, which includes 0 families.
| Children | Above Poverty | Below Poverty |
| No Children | 393 (95.6%) | 18 (4.4%) |
| 1 or 2 Children | 111 (100.0%) | 0 (0.0%) |
| 3 or 4 Children | 74 (100.0%) | 0 (0.0%) |
| 5 or more Children | 0 (0.0%) | 0 (0.0%) |
| Total | 578 (97.0%) | 18 (3.0%) |
Income Below Poverty Among Single-Parent Households in Heritage Lake
| Children | Single Father | Single Mother |
| No Children | 0 (0.0%) | 0 (0.0%) |
| 1 or 2 Children | 0 (0.0%) | 55 (75.3%) |
| 3 or 4 Children | 0 (0.0%) | 0 (0.0%) |
| 5 or more Children | 0 (0.0%) | 0 (0.0%) |
| Total | 0 (0.0%) | 55 (37.4%) |
Income Below Poverty Among Married-Couple vs Single-Parent Households in Heritage Lake
The poverty data for Heritage Lake shows that 18 of the married-couple family households (3.0%) and 55 of the single-parent households (15.3%) are living below the poverty level. Within the married-couple family households, those with no children have the highest poverty rate, with 18 households (4.4%) falling below the poverty line. Among the single-parent households, those with 1 or 2 children have the highest poverty rate, with 55 household (19.2%) living below poverty.
| Children | Married-Couple Families | Single-Parent Households |
| No Children | 18 (4.4%) | 0 (0.0%) |
| 1 or 2 Children | 0 (0.0%) | 55 (19.2%) |
| 3 or 4 Children | 0 (0.0%) | 0 (0.0%) |
| 5 or more Children | 0 (0.0%) | 0 (0.0%) |
| Total | 18 (3.0%) | 55 (15.3%) |
Employment Characteristics in Heritage Lake
Employment by Class of Employer in Heritage Lake
Among the 1,578 employed individuals in Heritage Lake, private company employees (1,004 | 63.6%), state government employees (164 | 10.4%), and self-employed (not incorporated) (160 | 10.1%) make up the most common classes of employment.

| Employer Class | # Employees | % Employees |
| Private Company Employees | 1,004 | 63.6% |
| Self-Employed (Incorporated) | 60 | 3.8% |
| Self-Employed (Not Incorporated) | 160 | 10.1% |
| Not-for-profit Organizations | 117 | 7.4% |
| Local Government Employees | 62 | 3.9% |
| State Government Employees | 164 | 10.4% |
| Federal Government Employees | 11 | 0.7% |
| Unpaid Family Workers | 0 | 0.0% |
| Total | 1,578 | 100.0% |
Employment Status by Age in Heritage Lake
According to the labor force statistics for Heritage Lake, out of the total population over 16 years of age (2,266), 73.5% or 1,666 individuals are in the labor force, with 4.5% or 75 of them unemployed. The age group with the highest labor force participation rate is 20 to 24 years, with 100.0% or 144 individuals in the labor force. Within the labor force, the 30 to 34 years age range has the highest percentage of unemployed individuals, with 10.3% or 55 of them being unemployed.
| Age Bracket | In Labor Force | Unemployed |
| 16 to 19 Years | 3 (11.1%) | 0 (0.0%) |
| 20 to 24 Years | 144 (100.0%) | 0 (0.0%) |
| 25 to 29 Years | 179 (60.5%) | 0 (0.0%) |
| 30 to 34 Years | 534 (100.0%) | 55 (10.3%) |
| 35 to 44 Years | 257 (91.5%) | 0 (0.0%) |
| 45 to 54 Years | 197 (74.3%) | 20 (10.2%) |
| 55 to 59 Years | 67 (91.8%) | 0 (0.0%) |
| 60 to 64 Years | 237 (82.3%) | 0 (0.0%) |
| 65 to 74 Years | 47 (16.8%) | 0 (0.0%) |
| 75 Years and over | 0 (0.0%) | 0 (0.0%) |
| Total | 1,666 (73.5%) | 75 (4.5%) |
Employment Status by Educational Attainment in Heritage Lake
According to labor force statistics for Heritage Lake, 84.7% of individuals (1,471) out of the total population between 25 and 64 years of age (1,737) are in the labor force, with 5.1% or 75 of them being unemployed. The group with the highest labor force participation rate are those with the educational attainment of less than high school, with 100.0% or 92 individuals in the labor force. Within the labor force, individuals with college / associate degree education have the highest percentage of unemployment, with 8.9% or 70 of them being unemployed.
| Educational Attainment | In Labor Force | Unemployed |
| Less than High School | 92 (100.0%) | 0 (0.0%) |
| High School Diploma | 285 (72.0%) | 0 (0.0%) |
| College / Associate Degree | 785 (88.7%) | 79 (8.9%) |
| Bachelor's Degree or higher | 309 (84.9%) | 6 (1.6%) |
| Total | 1,471 (84.7%) | 89 (5.1%) |
Employment Occupations by Sex in Heritage Lake
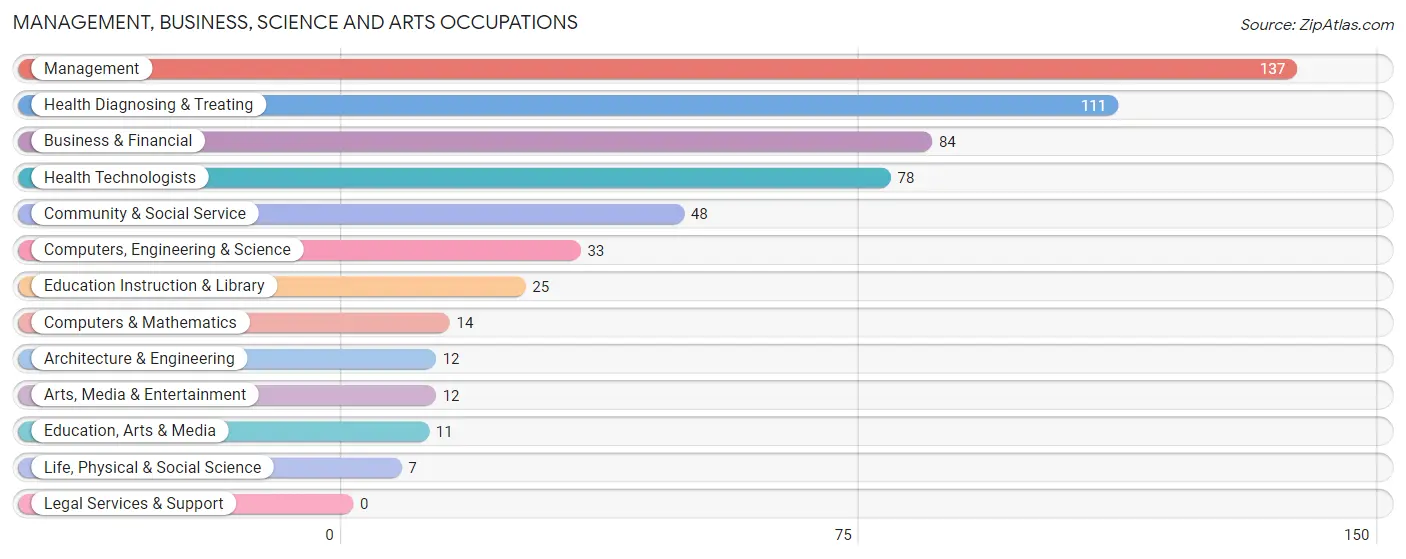
Management, Business, Science and Arts Occupations
The most common Management, Business, Science and Arts occupations in Heritage Lake are Management (137 | 8.6%), Health Diagnosing & Treating (111 | 7.0%), Business & Financial (84 | 5.3%), Health Technologists (78 | 4.9%), and Community & Social Service (48 | 3.0%).
Management, Business, Science and Arts Occupations by Sex
Within the Management, Business, Science and Arts occupations in Heritage Lake, the most male-oriented occupations are Computers & Mathematics (100.0%), Architecture & Engineering (100.0%), and Education, Arts & Media (100.0%), while the most female-oriented occupations are Life, Physical & Social Science (100.0%), Arts, Media & Entertainment (100.0%), and Health Diagnosing & Treating (100.0%).
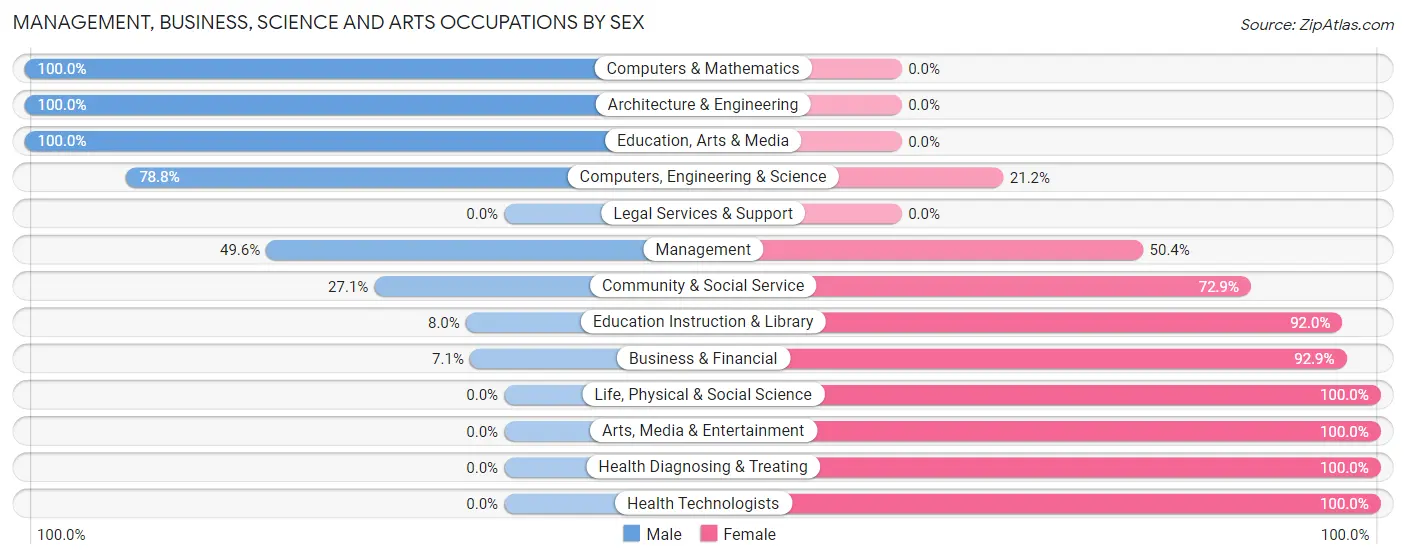
| Occupation | Male | Female |
| Management | 68 (49.6%) | 69 (50.4%) |
| Business & Financial | 6 (7.1%) | 78 (92.9%) |
| Computers, Engineering & Science | 26 (78.8%) | 7 (21.2%) |
| Computers & Mathematics | 14 (100.0%) | 0 (0.0%) |
| Architecture & Engineering | 12 (100.0%) | 0 (0.0%) |
| Life, Physical & Social Science | 0 (0.0%) | 7 (100.0%) |
| Community & Social Service | 13 (27.1%) | 35 (72.9%) |
| Education, Arts & Media | 11 (100.0%) | 0 (0.0%) |
| Legal Services & Support | 0 (0.0%) | 0 (0.0%) |
| Education Instruction & Library | 2 (8.0%) | 23 (92.0%) |
| Arts, Media & Entertainment | 0 (0.0%) | 12 (100.0%) |
| Health Diagnosing & Treating | 0 (0.0%) | 111 (100.0%) |
| Health Technologists | 0 (0.0%) | 78 (100.0%) |
| Total (Category) | 113 (27.4%) | 300 (72.6%) |
| Total (Overall) | 858 (54.0%) | 732 (46.0%) |
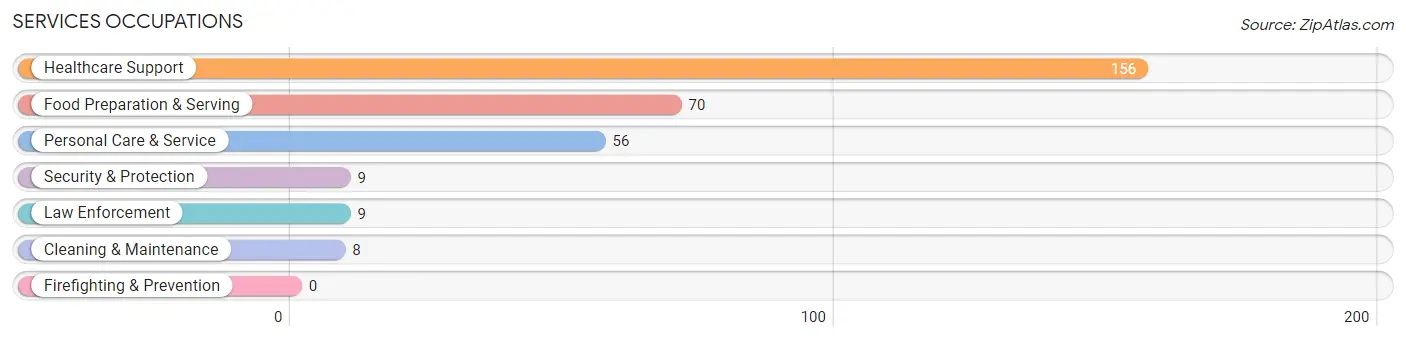
Services Occupations
The most common Services occupations in Heritage Lake are Healthcare Support (156 | 9.8%), Food Preparation & Serving (70 | 4.4%), Personal Care & Service (56 | 3.5%), Security & Protection (9 | 0.6%), and Law Enforcement (9 | 0.6%).
Services Occupations by Sex
Within the Services occupations in Heritage Lake, the most male-oriented occupations are Security & Protection (100.0%), Law Enforcement (100.0%), and Cleaning & Maintenance (100.0%), while the most female-oriented occupations are Personal Care & Service (100.0%), Healthcare Support (78.8%), and Food Preparation & Serving (50.0%).
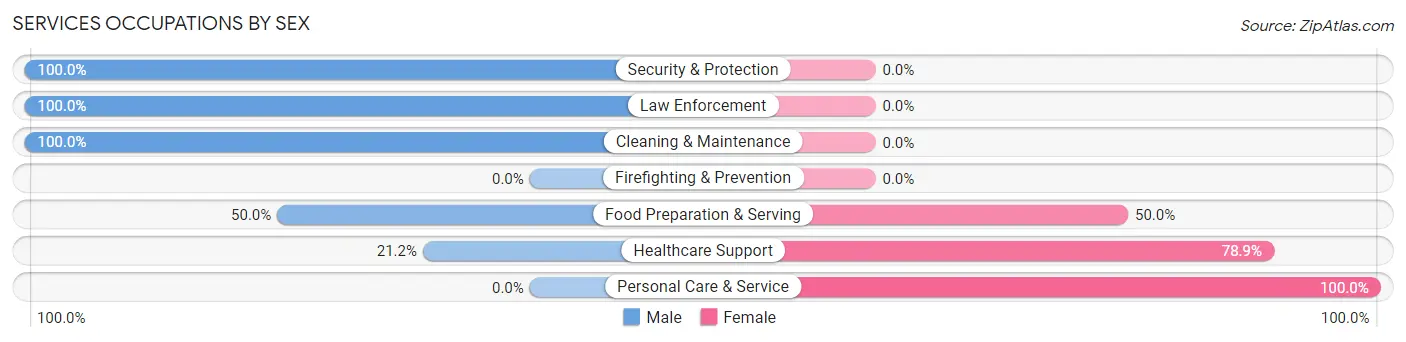
| Occupation | Male | Female |
| Healthcare Support | 33 (21.1%) | 123 (78.8%) |
| Security & Protection | 9 (100.0%) | 0 (0.0%) |
| Firefighting & Prevention | 0 (0.0%) | 0 (0.0%) |
| Law Enforcement | 9 (100.0%) | 0 (0.0%) |
| Food Preparation & Serving | 35 (50.0%) | 35 (50.0%) |
| Cleaning & Maintenance | 8 (100.0%) | 0 (0.0%) |
| Personal Care & Service | 0 (0.0%) | 56 (100.0%) |
| Total (Category) | 85 (28.4%) | 214 (71.6%) |
| Total (Overall) | 858 (54.0%) | 732 (46.0%) |
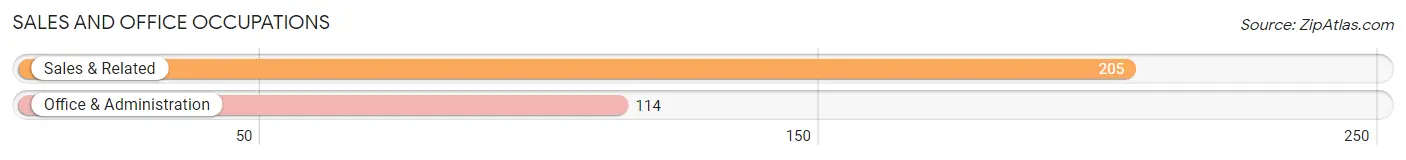
Sales and Office Occupations
The most common Sales and Office occupations in Heritage Lake are Sales & Related (205 | 12.9%), and Office & Administration (114 | 7.2%).
Sales and Office Occupations by Sex
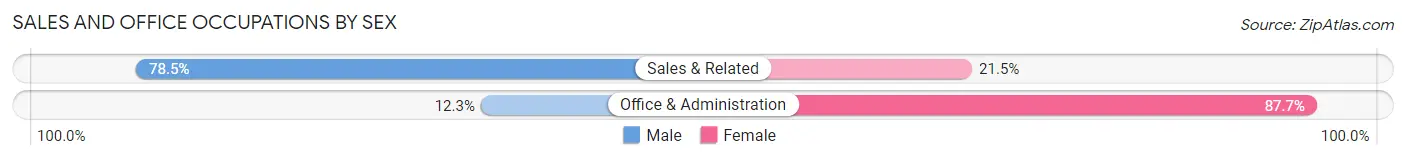
| Occupation | Male | Female |
| Sales & Related | 161 (78.5%) | 44 (21.5%) |
| Office & Administration | 14 (12.3%) | 100 (87.7%) |
| Total (Category) | 175 (54.9%) | 144 (45.1%) |
| Total (Overall) | 858 (54.0%) | 732 (46.0%) |
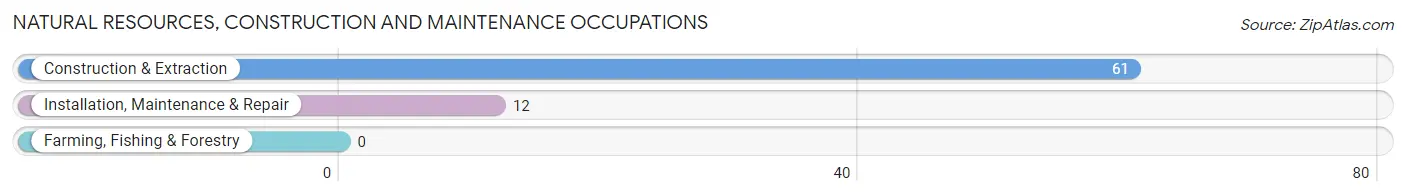
Natural Resources, Construction and Maintenance Occupations
The most common Natural Resources, Construction and Maintenance occupations in Heritage Lake are Construction & Extraction (61 | 3.8%), and Installation, Maintenance & Repair (12 | 0.7%).
Natural Resources, Construction and Maintenance Occupations by Sex
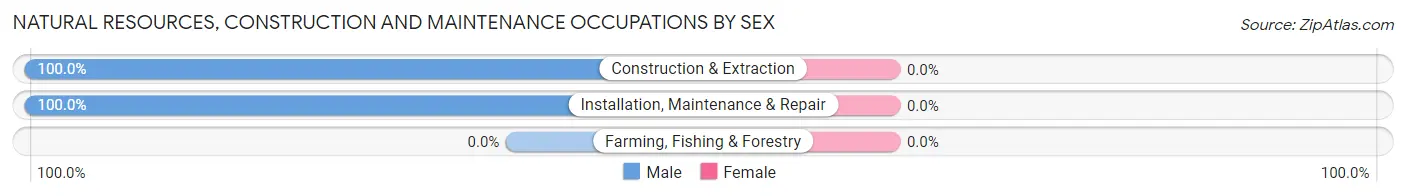
| Occupation | Male | Female |
| Farming, Fishing & Forestry | 0 (0.0%) | 0 (0.0%) |
| Construction & Extraction | 61 (100.0%) | 0 (0.0%) |
| Installation, Maintenance & Repair | 12 (100.0%) | 0 (0.0%) |
| Total (Category) | 73 (100.0%) | 0 (0.0%) |
| Total (Overall) | 858 (54.0%) | 732 (46.0%) |
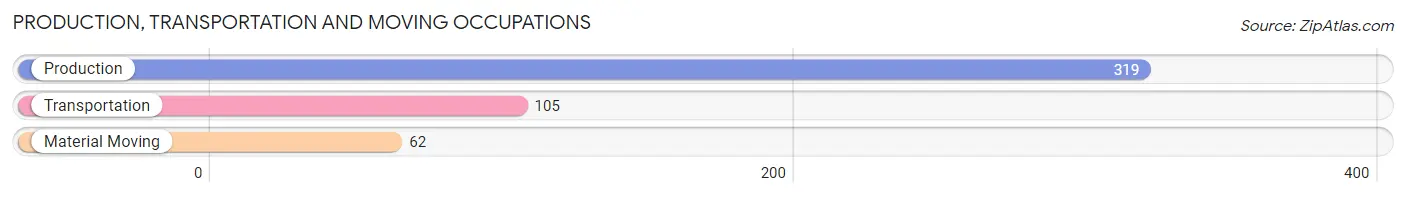
Production, Transportation and Moving Occupations
The most common Production, Transportation and Moving occupations in Heritage Lake are Production (319 | 20.1%), Transportation (105 | 6.6%), and Material Moving (62 | 3.9%).
Production, Transportation and Moving Occupations by Sex
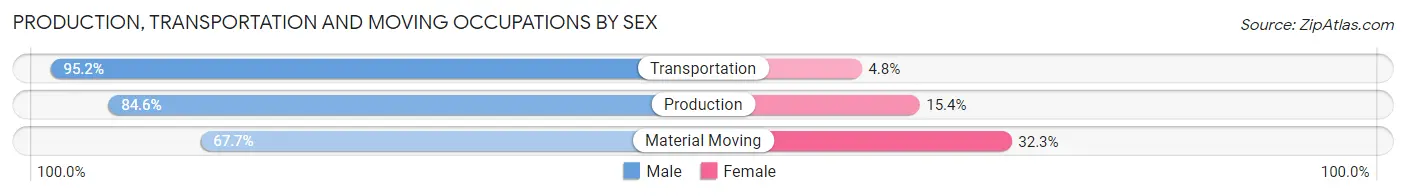
| Occupation | Male | Female |
| Production | 270 (84.6%) | 49 (15.4%) |
| Transportation | 100 (95.2%) | 5 (4.8%) |
| Material Moving | 42 (67.7%) | 20 (32.3%) |
| Total (Category) | 412 (84.8%) | 74 (15.2%) |
| Total (Overall) | 858 (54.0%) | 732 (46.0%) |
Employment Industries by Sex in Heritage Lake
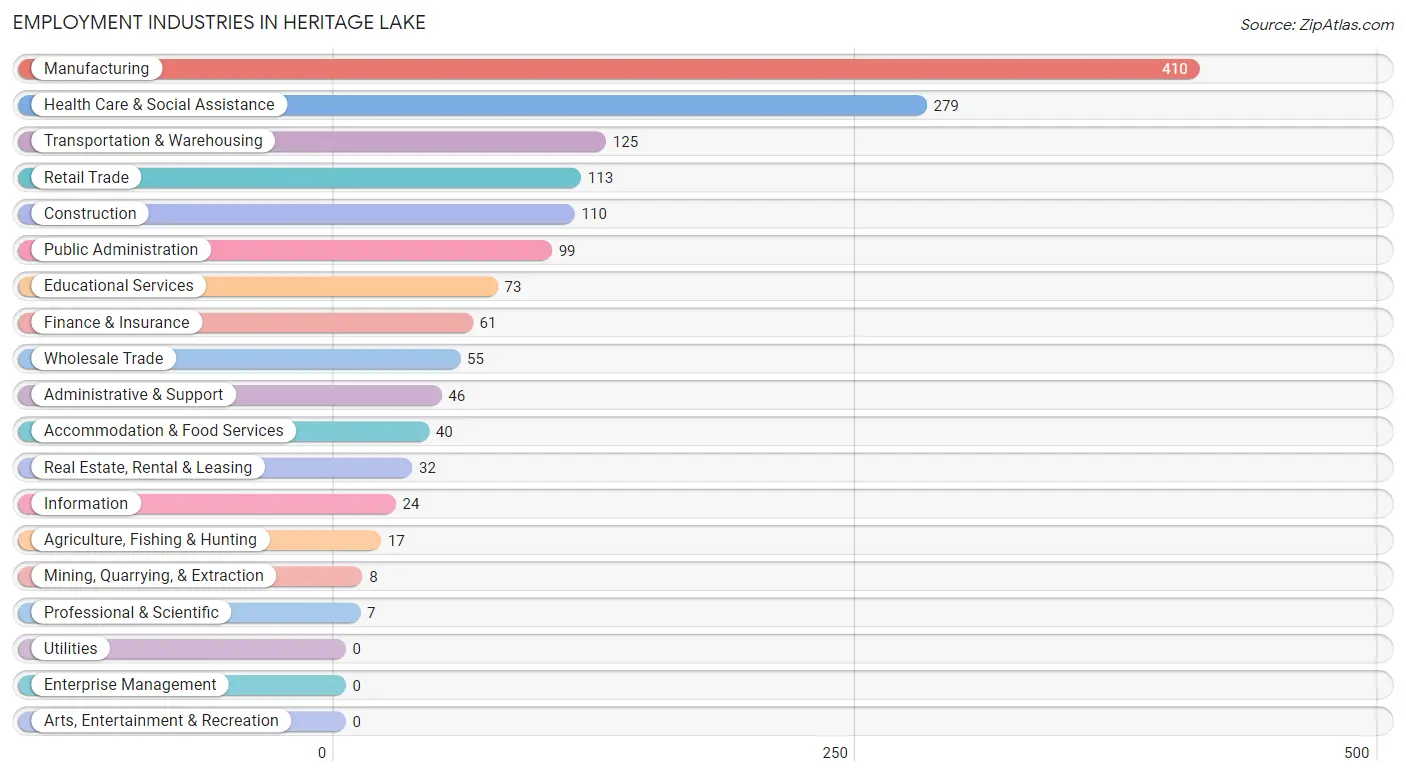
Employment Industries in Heritage Lake
The major employment industries in Heritage Lake include Manufacturing (410 | 25.8%), Health Care & Social Assistance (279 | 17.5%), Transportation & Warehousing (125 | 7.9%), Retail Trade (113 | 7.1%), and Construction (110 | 6.9%).
Employment Industries by Sex in Heritage Lake
The Heritage Lake industries that see more men than women are Mining, Quarrying, & Extraction (100.0%), Wholesale Trade (100.0%), and Information (100.0%), whereas the industries that tend to have a higher number of women are Agriculture, Fishing & Hunting (100.0%), Finance & Insurance (100.0%), and Professional & Scientific (100.0%).
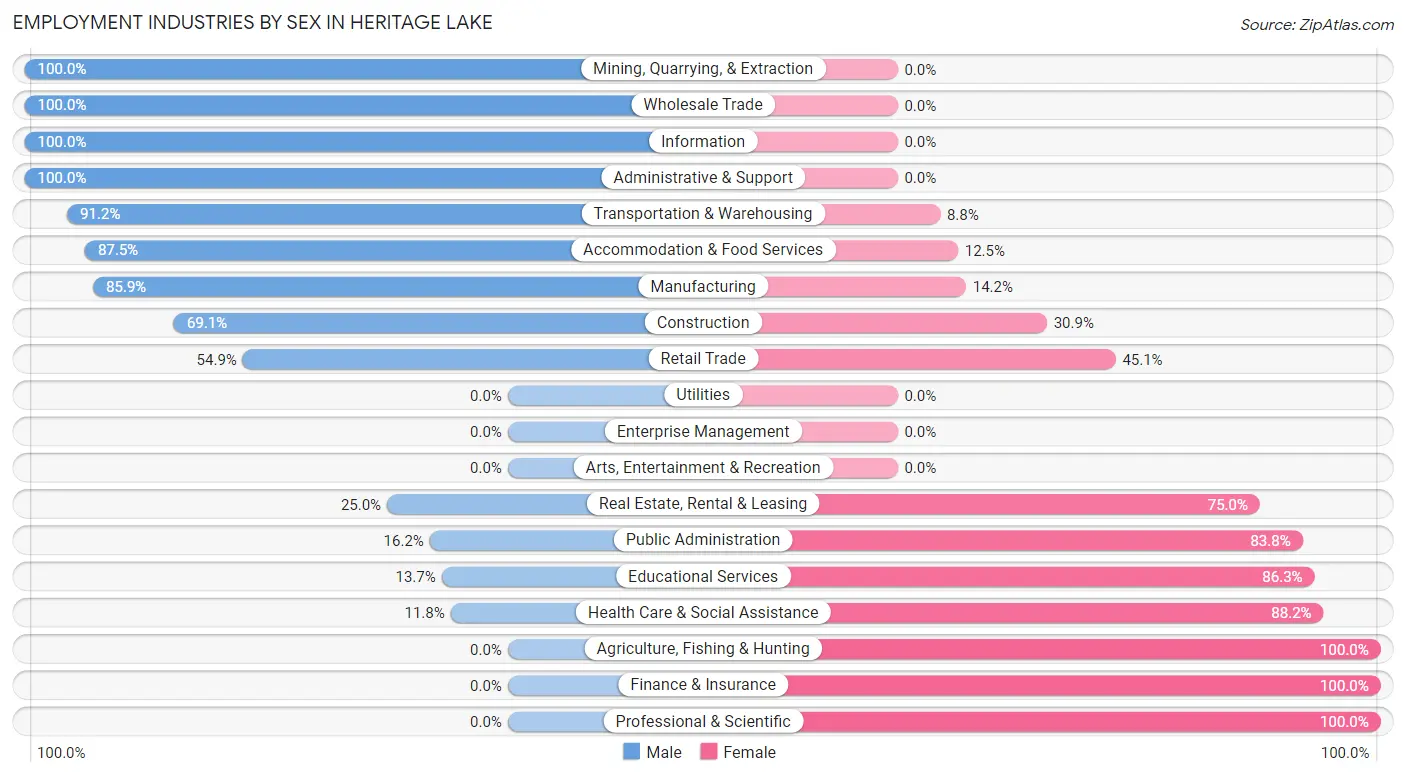
| Industry | Male | Female |
| Agriculture, Fishing & Hunting | 0 (0.0%) | 17 (100.0%) |
| Mining, Quarrying, & Extraction | 8 (100.0%) | 0 (0.0%) |
| Construction | 76 (69.1%) | 34 (30.9%) |
| Manufacturing | 352 (85.9%) | 58 (14.1%) |
| Wholesale Trade | 55 (100.0%) | 0 (0.0%) |
| Retail Trade | 62 (54.9%) | 51 (45.1%) |
| Transportation & Warehousing | 114 (91.2%) | 11 (8.8%) |
| Utilities | 0 (0.0%) | 0 (0.0%) |
| Information | 24 (100.0%) | 0 (0.0%) |
| Finance & Insurance | 0 (0.0%) | 61 (100.0%) |
| Real Estate, Rental & Leasing | 8 (25.0%) | 24 (75.0%) |
| Professional & Scientific | 0 (0.0%) | 7 (100.0%) |
| Enterprise Management | 0 (0.0%) | 0 (0.0%) |
| Administrative & Support | 46 (100.0%) | 0 (0.0%) |
| Educational Services | 10 (13.7%) | 63 (86.3%) |
| Health Care & Social Assistance | 33 (11.8%) | 246 (88.2%) |
| Arts, Entertainment & Recreation | 0 (0.0%) | 0 (0.0%) |
| Accommodation & Food Services | 35 (87.5%) | 5 (12.5%) |
| Public Administration | 16 (16.2%) | 83 (83.8%) |
| Total | 858 (54.0%) | 732 (46.0%) |
Education in Heritage Lake
School Enrollment in Heritage Lake
The most common levels of schooling among the 587 students in Heritage Lake are college / undergraduate (201 | 34.2%), middle school (188 | 32.0%), and elementary school (169 | 28.8%).
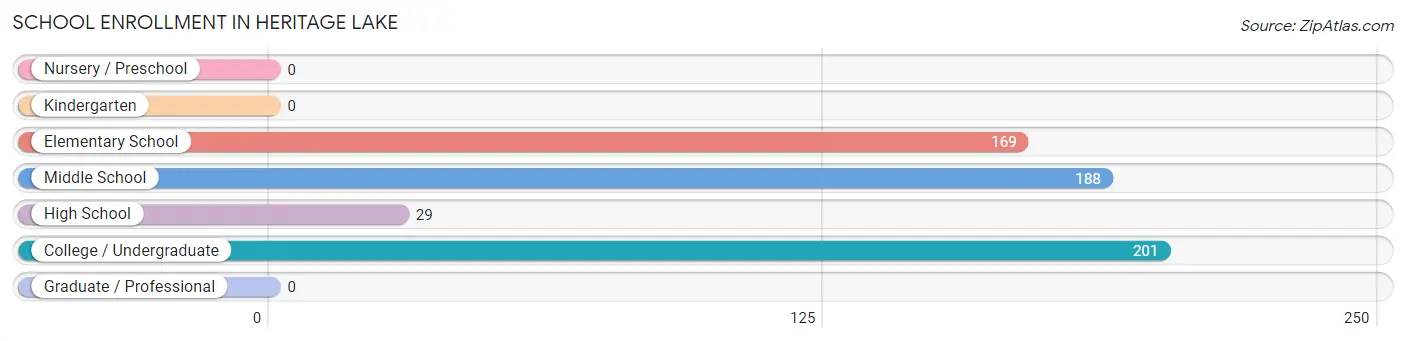
| School Level | # Students | % Students |
| Nursery / Preschool | 0 | 0.0% |
| Kindergarten | 0 | 0.0% |
| Elementary School | 169 | 28.8% |
| Middle School | 188 | 32.0% |
| High School | 29 | 4.9% |
| College / Undergraduate | 201 | 34.2% |
| Graduate / Professional | 0 | 0.0% |
| Total | 587 | 100.0% |
School Enrollment by Age by Funding Source in Heritage Lake
Out of a total of 587 students who are enrolled in schools in Heritage Lake, 19 (3.2%) attend a private institution, while the remaining 568 (96.8%) are enrolled in public schools. The age group of 35 years and over has the highest likelihood of being enrolled in private schools, with 13 (72.2% in the age bracket) enrolled. Conversely, the age group of 5 to 9 year old has the lowest likelihood of being enrolled in a private school, with 132 (100.0% in the age bracket) attending a public institution.
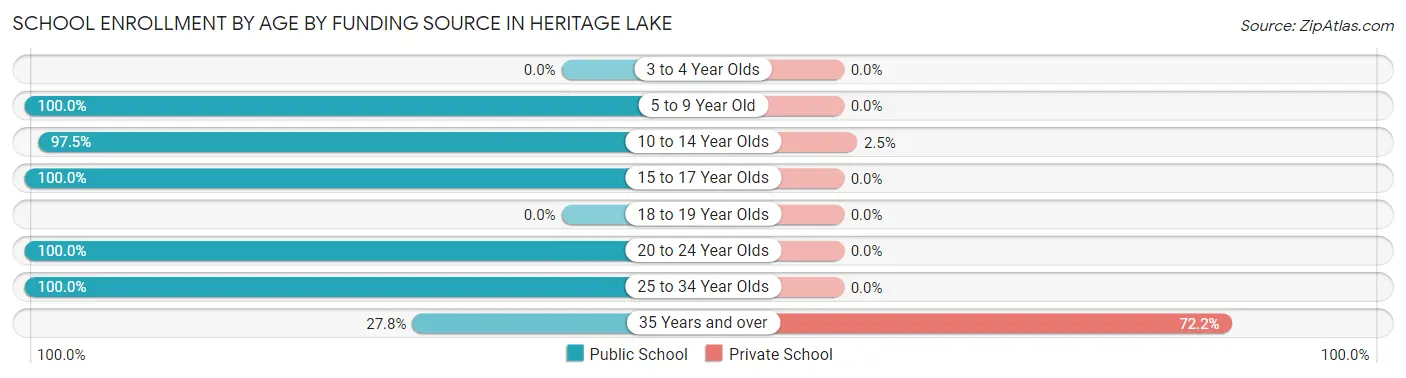
| Age Bracket | Public School | Private School |
| 3 to 4 Year Olds | 0 (0.0%) | 0 (0.0%) |
| 5 to 9 Year Old | 132 (100.0%) | 0 (0.0%) |
| 10 to 14 Year Olds | 236 (97.5%) | 6 (2.5%) |
| 15 to 17 Year Olds | 12 (100.0%) | 0 (0.0%) |
| 18 to 19 Year Olds | 0 (0.0%) | 0 (0.0%) |
| 20 to 24 Year Olds | 92 (100.0%) | 0 (0.0%) |
| 25 to 34 Year Olds | 91 (100.0%) | 0 (0.0%) |
| 35 Years and over | 5 (27.8%) | 13 (72.2%) |
| Total | 568 (96.8%) | 19 (3.2%) |
Educational Attainment by Field of Study in Heritage Lake
Education (122 | 23.4%), arts & humanities (96 | 18.4%), science & technology (91 | 17.4%), business (74 | 14.2%), and bio, nature & agricultural (42 | 8.1%) are the most common fields of study among 522 individuals in Heritage Lake who have obtained a bachelor's degree or higher.
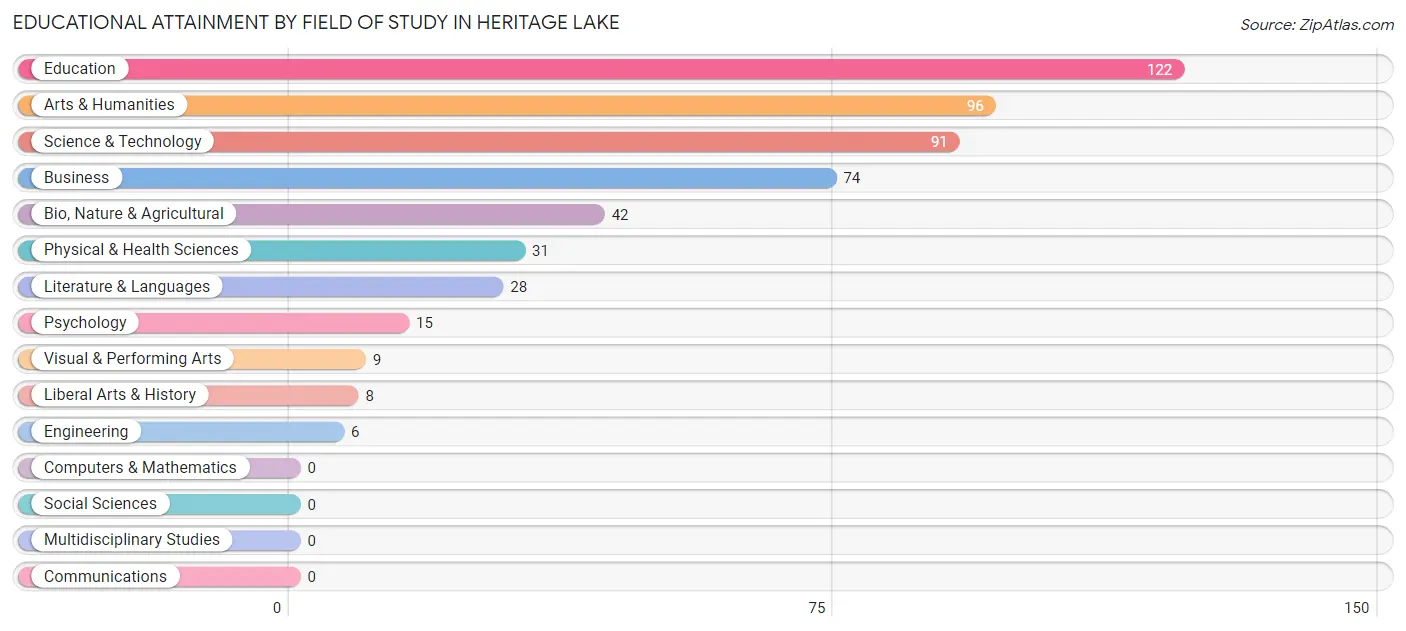
| Field of Study | # Graduates | % Graduates |
| Computers & Mathematics | 0 | 0.0% |
| Bio, Nature & Agricultural | 42 | 8.1% |
| Physical & Health Sciences | 31 | 5.9% |
| Psychology | 15 | 2.9% |
| Social Sciences | 0 | 0.0% |
| Engineering | 6 | 1.1% |
| Multidisciplinary Studies | 0 | 0.0% |
| Science & Technology | 91 | 17.4% |
| Business | 74 | 14.2% |
| Education | 122 | 23.4% |
| Literature & Languages | 28 | 5.4% |
| Liberal Arts & History | 8 | 1.5% |
| Visual & Performing Arts | 9 | 1.7% |
| Communications | 0 | 0.0% |
| Arts & Humanities | 96 | 18.4% |
| Total | 522 | 100.0% |
Transportation & Commute in Heritage Lake
Vehicle Availability by Sex in Heritage Lake
The most prevalent vehicle ownership categories in Heritage Lake are males with 2 vehicles (486, accounting for 57.5%) and females with 2 vehicles (426, making up 66.4%).
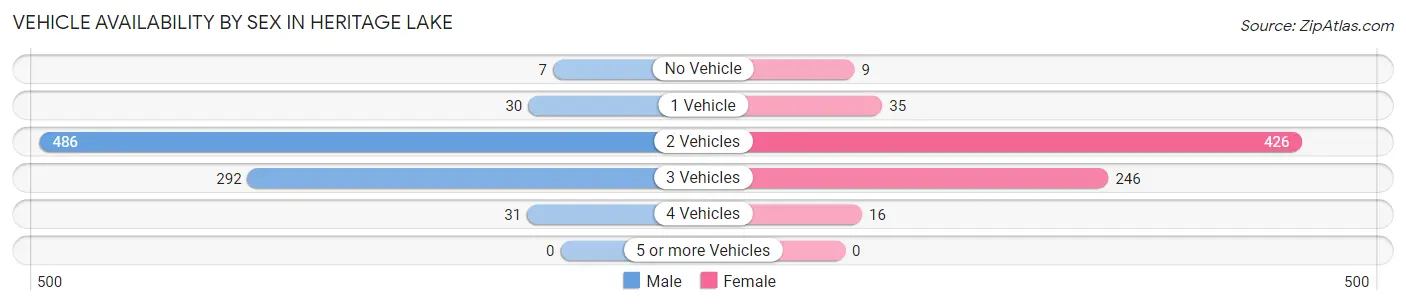
| Vehicles Available | Male | Female |
| No Vehicle | 7 (0.8%) | 9 (1.2%) |
| 1 Vehicle | 30 (3.5%) | 35 (4.8%) |
| 2 Vehicles | 486 (57.5%) | 426 (58.2%) |
| 3 Vehicles | 292 (34.5%) | 246 (33.6%) |
| 4 Vehicles | 31 (3.7%) | 16 (2.2%) |
| 5 or more Vehicles | 0 (0.0%) | 0 (0.0%) |
| Total | 846 (100.0%) | 732 (100.0%) |
Commute Time in Heritage Lake
The most frequently occuring commute durations in Heritage Lake are 20 to 24 minutes (401 commuters, 26.4%), 30 to 34 minutes (272 commuters, 17.9%), and 60 to 89 minutes (229 commuters, 15.1%).
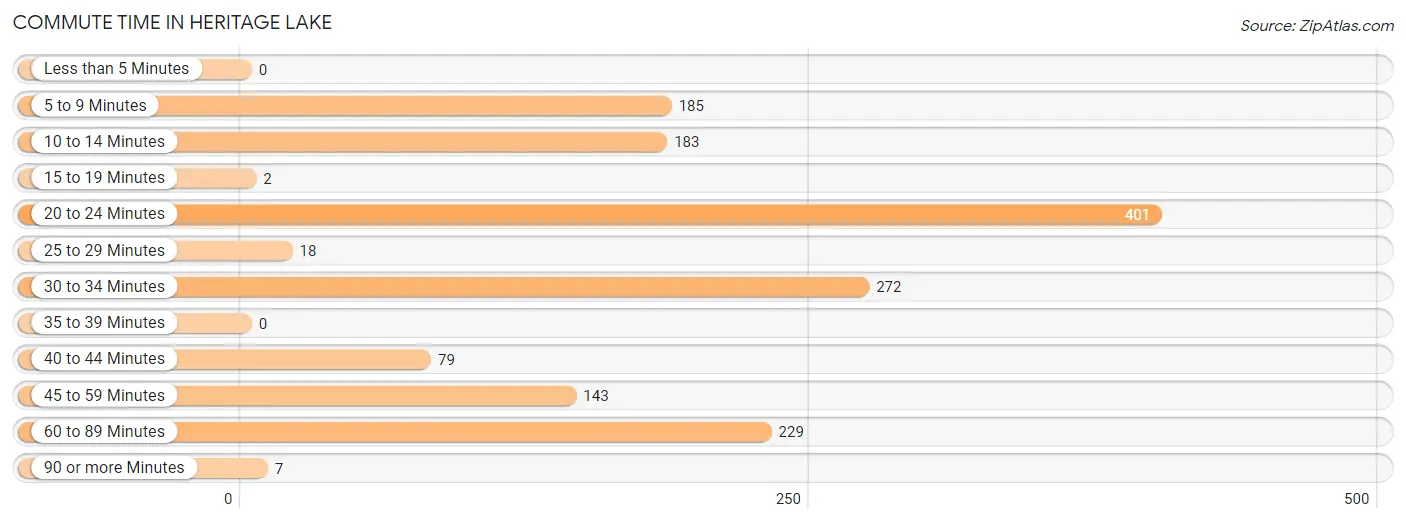
| Commute Time | # Commuters | % Commuters |
| Less than 5 Minutes | 0 | 0.0% |
| 5 to 9 Minutes | 185 | 12.2% |
| 10 to 14 Minutes | 183 | 12.0% |
| 15 to 19 Minutes | 2 | 0.1% |
| 20 to 24 Minutes | 401 | 26.4% |
| 25 to 29 Minutes | 18 | 1.2% |
| 30 to 34 Minutes | 272 | 17.9% |
| 35 to 39 Minutes | 0 | 0.0% |
| 40 to 44 Minutes | 79 | 5.2% |
| 45 to 59 Minutes | 143 | 9.4% |
| 60 to 89 Minutes | 229 | 15.1% |
| 90 or more Minutes | 7 | 0.5% |
Commute Time by Sex in Heritage Lake
The most common commute times in Heritage Lake are 20 to 24 minutes (188 commuters, 22.6%) for males and 20 to 24 minutes (213 commuters, 31.0%) for females.
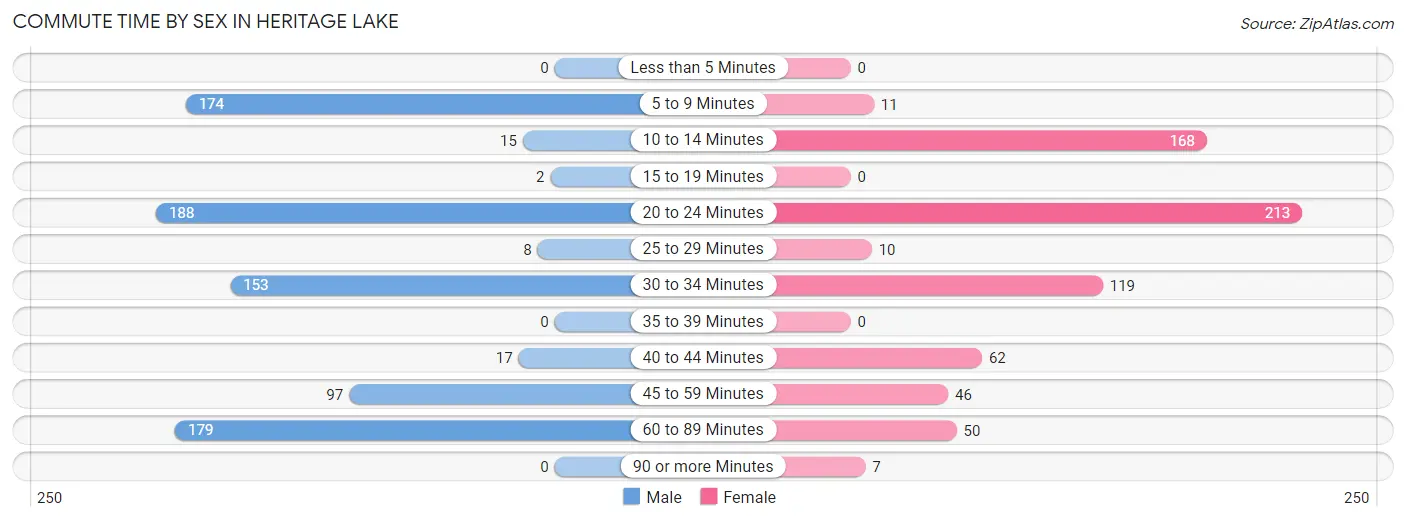
| Commute Time | Male | Female |
| Less than 5 Minutes | 0 (0.0%) | 0 (0.0%) |
| 5 to 9 Minutes | 174 (20.9%) | 11 (1.6%) |
| 10 to 14 Minutes | 15 (1.8%) | 168 (24.5%) |
| 15 to 19 Minutes | 2 (0.2%) | 0 (0.0%) |
| 20 to 24 Minutes | 188 (22.6%) | 213 (31.0%) |
| 25 to 29 Minutes | 8 (1.0%) | 10 (1.5%) |
| 30 to 34 Minutes | 153 (18.4%) | 119 (17.3%) |
| 35 to 39 Minutes | 0 (0.0%) | 0 (0.0%) |
| 40 to 44 Minutes | 17 (2.0%) | 62 (9.0%) |
| 45 to 59 Minutes | 97 (11.6%) | 46 (6.7%) |
| 60 to 89 Minutes | 179 (21.5%) | 50 (7.3%) |
| 90 or more Minutes | 0 (0.0%) | 7 (1.0%) |
Time of Departure to Work by Sex in Heritage Lake
The most frequent times of departure to work in Heritage Lake are 9:00 AM to 9:59 AM (149, 17.9%) for males and 12:00 PM to 3:59 PM (123, 17.9%) for females.
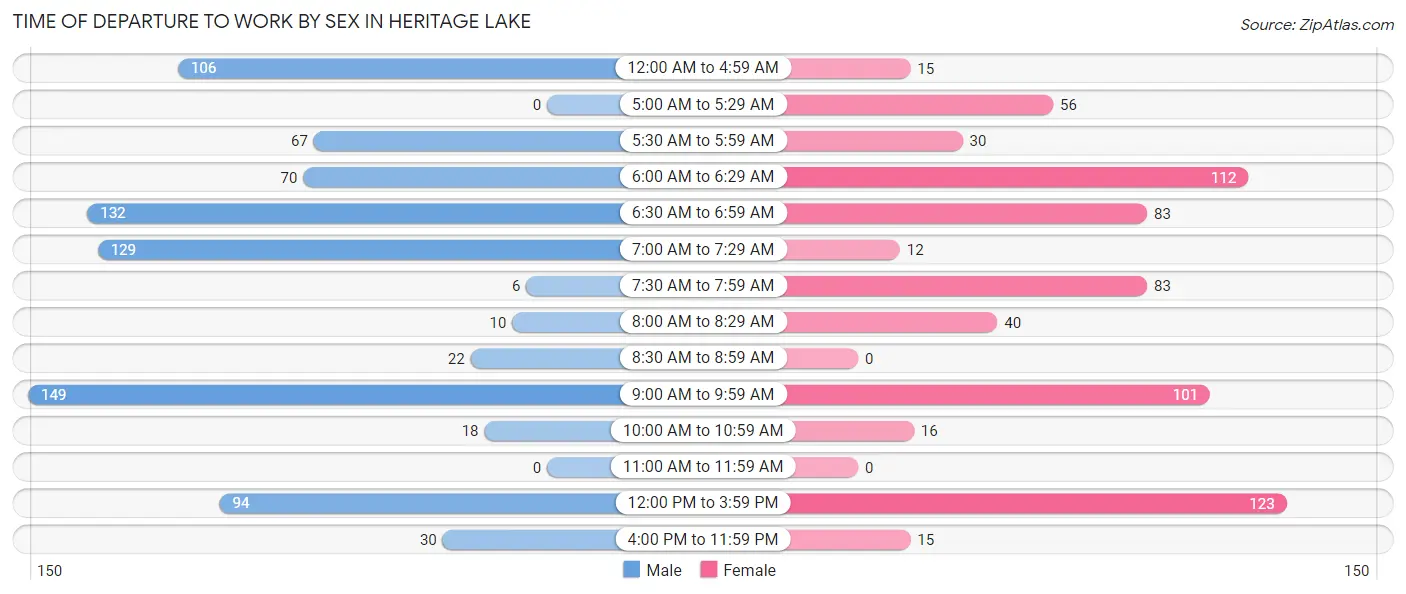
| Time of Departure | Male | Female |
| 12:00 AM to 4:59 AM | 106 (12.7%) | 15 (2.2%) |
| 5:00 AM to 5:29 AM | 0 (0.0%) | 56 (8.2%) |
| 5:30 AM to 5:59 AM | 67 (8.0%) | 30 (4.4%) |
| 6:00 AM to 6:29 AM | 70 (8.4%) | 112 (16.3%) |
| 6:30 AM to 6:59 AM | 132 (15.9%) | 83 (12.1%) |
| 7:00 AM to 7:29 AM | 129 (15.5%) | 12 (1.8%) |
| 7:30 AM to 7:59 AM | 6 (0.7%) | 83 (12.1%) |
| 8:00 AM to 8:29 AM | 10 (1.2%) | 40 (5.8%) |
| 8:30 AM to 8:59 AM | 22 (2.6%) | 0 (0.0%) |
| 9:00 AM to 9:59 AM | 149 (17.9%) | 101 (14.7%) |
| 10:00 AM to 10:59 AM | 18 (2.2%) | 16 (2.3%) |
| 11:00 AM to 11:59 AM | 0 (0.0%) | 0 (0.0%) |
| 12:00 PM to 3:59 PM | 94 (11.3%) | 123 (17.9%) |
| 4:00 PM to 11:59 PM | 30 (3.6%) | 15 (2.2%) |
| Total | 833 (100.0%) | 686 (100.0%) |
Housing Occupancy in Heritage Lake
Occupancy by Ownership in Heritage Lake
Of the total 1,297 dwellings in Heritage Lake, owner-occupied units account for 1,205 (92.9%), while renter-occupied units make up 92 (7.1%).
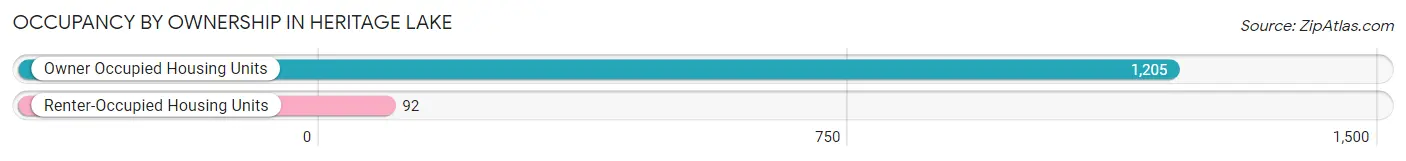
| Occupancy | # Housing Units | % Housing Units |
| Owner Occupied Housing Units | 1,205 | 92.9% |
| Renter-Occupied Housing Units | 92 | 7.1% |
| Total Occupied Housing Units | 1,297 | 100.0% |
Occupancy by Household Size in Heritage Lake
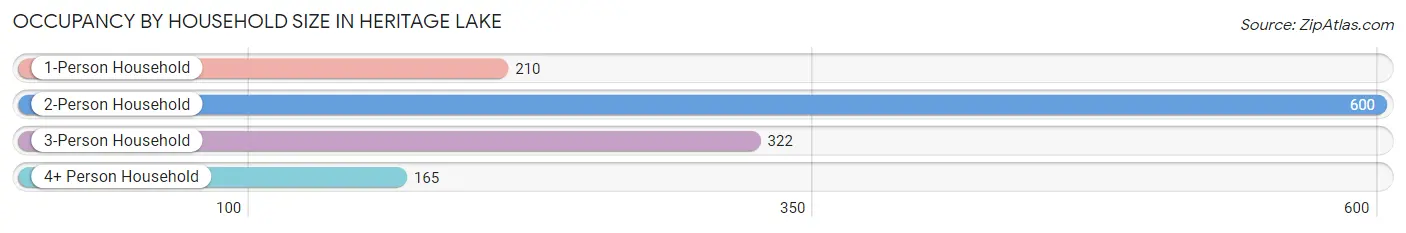
| Household Size | # Housing Units | % Housing Units |
| 1-Person Household | 210 | 16.2% |
| 2-Person Household | 600 | 46.3% |
| 3-Person Household | 322 | 24.8% |
| 4+ Person Household | 165 | 12.7% |
| Total Housing Units | 1,297 | 100.0% |
Occupancy by Ownership by Household Size in Heritage Lake
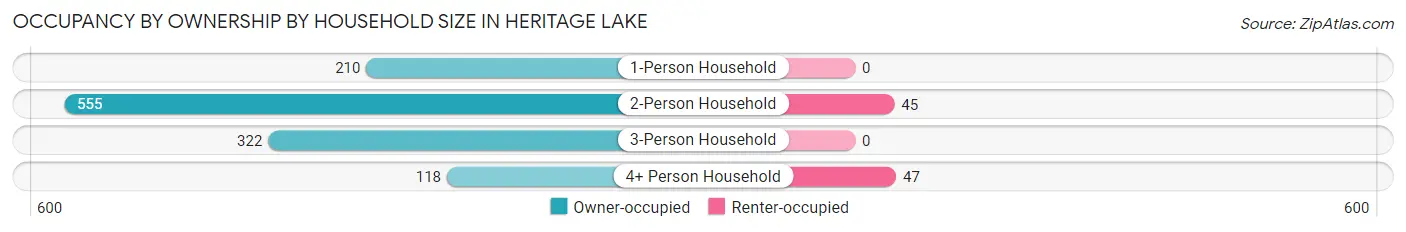
| Household Size | Owner-occupied | Renter-occupied |
| 1-Person Household | 210 (100.0%) | 0 (0.0%) |
| 2-Person Household | 555 (92.5%) | 45 (7.5%) |
| 3-Person Household | 322 (100.0%) | 0 (0.0%) |
| 4+ Person Household | 118 (71.5%) | 47 (28.5%) |
| Total Housing Units | 1,205 (92.9%) | 92 (7.1%) |
Occupancy by Educational Attainment in Heritage Lake
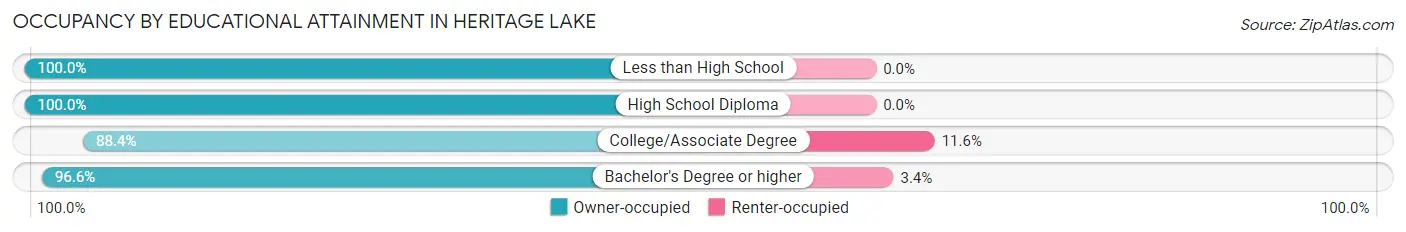
| Household Size | Owner-occupied | Renter-occupied |
| Less than High School | 86 (100.0%) | 0 (0.0%) |
| High School Diploma | 173 (100.0%) | 0 (0.0%) |
| College/Associate Degree | 609 (88.4%) | 80 (11.6%) |
| Bachelor's Degree or higher | 337 (96.6%) | 12 (3.4%) |
Occupancy by Age of Householder in Heritage Lake
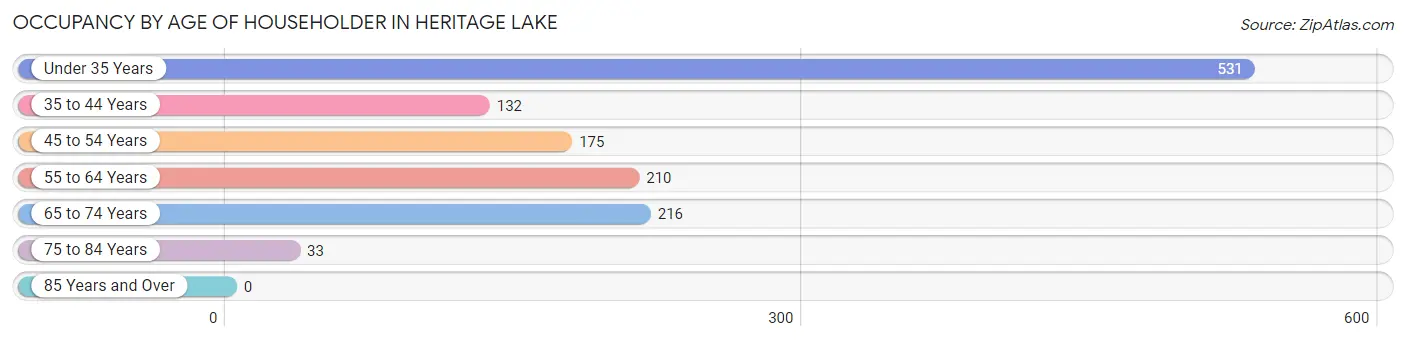
| Age Bracket | # Households | % Households |
| Under 35 Years | 531 | 40.9% |
| 35 to 44 Years | 132 | 10.2% |
| 45 to 54 Years | 175 | 13.5% |
| 55 to 64 Years | 210 | 16.2% |
| 65 to 74 Years | 216 | 16.7% |
| 75 to 84 Years | 33 | 2.5% |
| 85 Years and Over | 0 | 0.0% |
| Total | 1,297 | 100.0% |
Housing Finances in Heritage Lake
Median Income by Occupancy in Heritage Lake
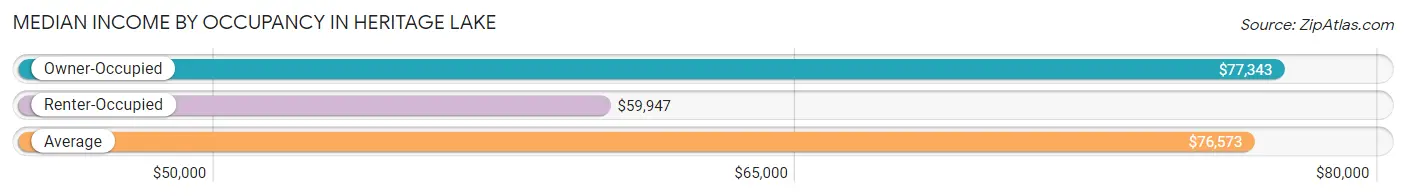
| Occupancy Type | # Households | Median Income |
| Owner-Occupied | 1,205 (92.9%) | $77,343 |
| Renter-Occupied | 92 (7.1%) | $59,947 |
| Average | 1,297 (100.0%) | $76,573 |
Occupancy by Householder Income Bracket in Heritage Lake

| Income Bracket | Owner-occupied | Renter-occupied |
| Less than $5,000 | 81 (6.7%) | 0 (0.0%) |
| $5,000 to $9,999 | 0 (0.0%) | 0 (0.0%) |
| $10,000 to $14,999 | 42 (3.5%) | 0 (0.0%) |
| $15,000 to $19,999 | 6 (0.5%) | 0 (0.0%) |
| $20,000 to $24,999 | 50 (4.2%) | 0 (0.0%) |
| $25,000 to $34,999 | 15 (1.2%) | 0 (0.0%) |
| $35,000 to $49,999 | 49 (4.1%) | 0 (0.0%) |
| $50,000 to $74,999 | 233 (19.3%) | 80 (87.0%) |
| $75,000 to $99,999 | 339 (28.1%) | 12 (13.0%) |
| $100,000 to $149,999 | 275 (22.8%) | 0 (0.0%) |
| $150,000 or more | 115 (9.5%) | 0 (0.0%) |
| Total | 1,205 (100.0%) | 92 (100.0%) |
Monthly Housing Cost Tiers in Heritage Lake
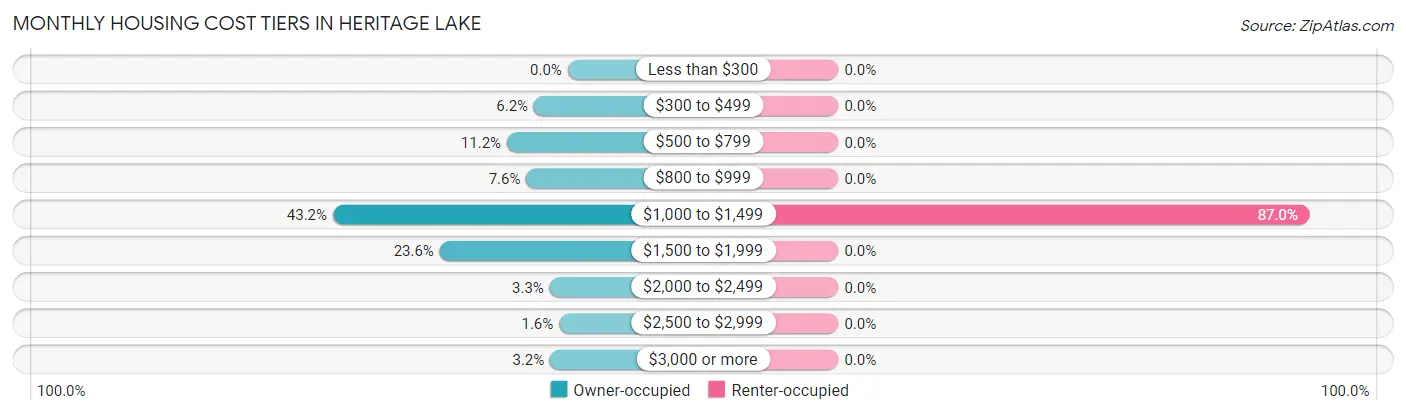
| Monthly Cost | Owner-occupied | Renter-occupied |
| Less than $300 | 0 (0.0%) | 0 (0.0%) |
| $300 to $499 | 75 (6.2%) | 0 (0.0%) |
| $500 to $799 | 135 (11.2%) | 0 (0.0%) |
| $800 to $999 | 92 (7.6%) | 0 (0.0%) |
| $1,000 to $1,499 | 521 (43.2%) | 80 (87.0%) |
| $1,500 to $1,999 | 284 (23.6%) | 0 (0.0%) |
| $2,000 to $2,499 | 40 (3.3%) | 0 (0.0%) |
| $2,500 to $2,999 | 19 (1.6%) | 0 (0.0%) |
| $3,000 or more | 39 (3.2%) | 0 (0.0%) |
| Total | 1,205 (100.0%) | 92 (100.0%) |
Physical Housing Characteristics in Heritage Lake
Housing Structures in Heritage Lake

| Structure Type | # Housing Units | % Housing Units |
| Single Unit, Detached | 1,297 | 100.0% |
| Single Unit, Attached | 0 | 0.0% |
| 2 Unit Apartments | 0 | 0.0% |
| 3 or 4 Unit Apartments | 0 | 0.0% |
| 5 to 9 Unit Apartments | 0 | 0.0% |
| 10 or more Apartments | 0 | 0.0% |
| Mobile Home / Other | 0 | 0.0% |
| Total | 1,297 | 100.0% |
Housing Structures by Occupancy in Heritage Lake
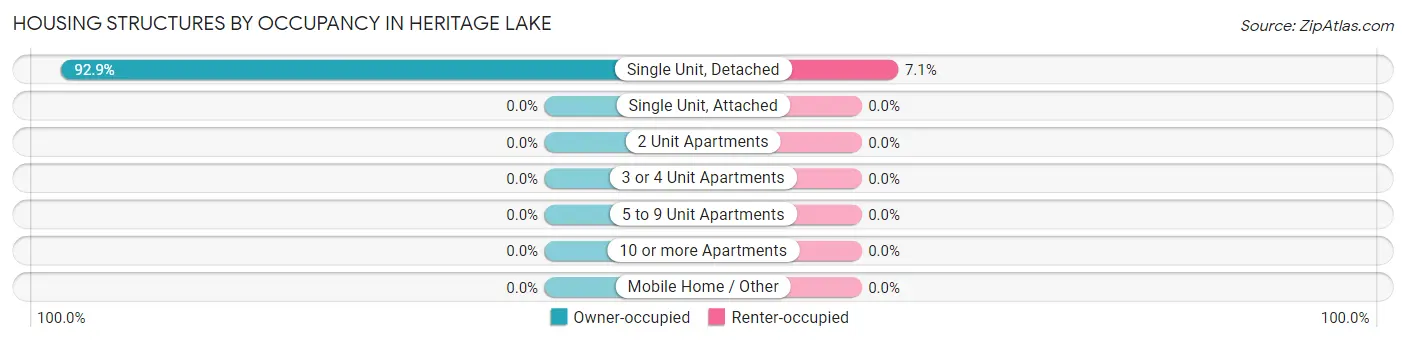
| Structure Type | Owner-occupied | Renter-occupied |
| Single Unit, Detached | 1,205 (92.9%) | 92 (7.1%) |
| Single Unit, Attached | 0 (0.0%) | 0 (0.0%) |
| 2 Unit Apartments | 0 (0.0%) | 0 (0.0%) |
| 3 or 4 Unit Apartments | 0 (0.0%) | 0 (0.0%) |
| 5 to 9 Unit Apartments | 0 (0.0%) | 0 (0.0%) |
| 10 or more Apartments | 0 (0.0%) | 0 (0.0%) |
| Mobile Home / Other | 0 (0.0%) | 0 (0.0%) |
| Total | 1,205 (92.9%) | 92 (7.1%) |
Housing Structures by Number of Rooms in Heritage Lake
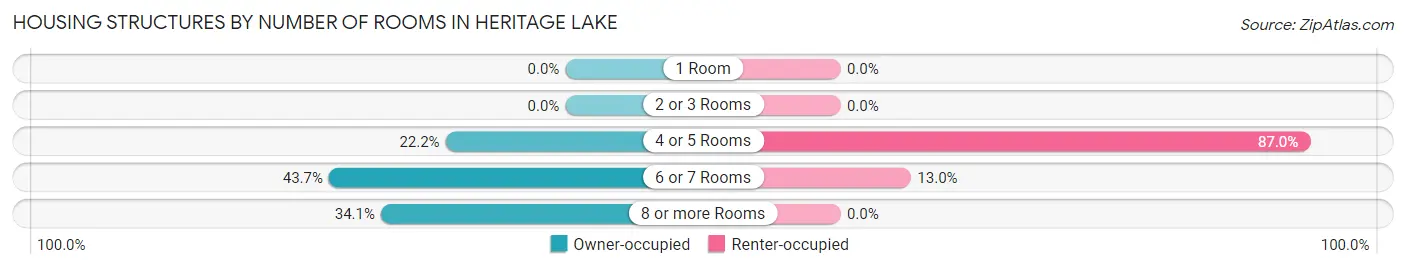
| Number of Rooms | Owner-occupied | Renter-occupied |
| 1 Room | 0 (0.0%) | 0 (0.0%) |
| 2 or 3 Rooms | 0 (0.0%) | 0 (0.0%) |
| 4 or 5 Rooms | 267 (22.2%) | 80 (87.0%) |
| 6 or 7 Rooms | 527 (43.7%) | 12 (13.0%) |
| 8 or more Rooms | 411 (34.1%) | 0 (0.0%) |
| Total | 1,205 (100.0%) | 92 (100.0%) |
Housing Structure by Heating Type in Heritage Lake
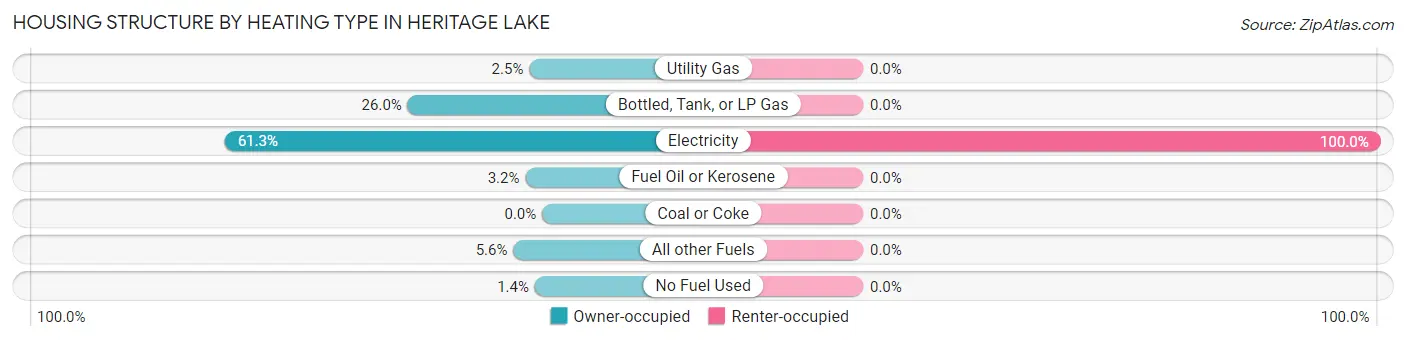
| Heating Type | Owner-occupied | Renter-occupied |
| Utility Gas | 30 (2.5%) | 0 (0.0%) |
| Bottled, Tank, or LP Gas | 313 (26.0%) | 0 (0.0%) |
| Electricity | 739 (61.3%) | 92 (100.0%) |
| Fuel Oil or Kerosene | 39 (3.2%) | 0 (0.0%) |
| Coal or Coke | 0 (0.0%) | 0 (0.0%) |
| All other Fuels | 67 (5.6%) | 0 (0.0%) |
| No Fuel Used | 17 (1.4%) | 0 (0.0%) |
| Total | 1,205 (100.0%) | 92 (100.0%) |
Household Vehicle Usage in Heritage Lake
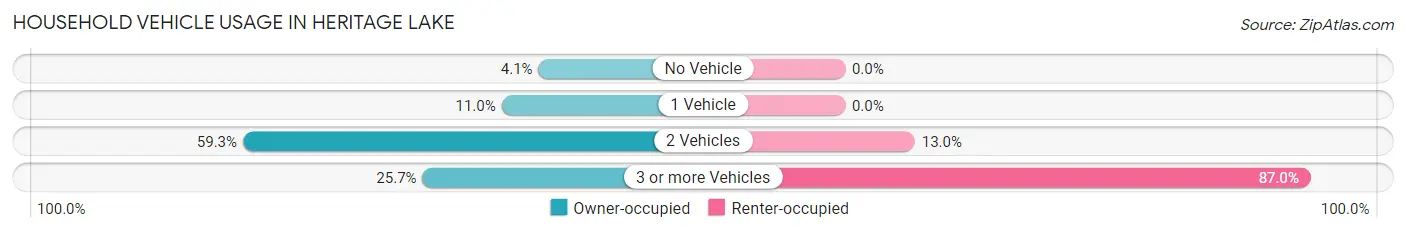
| Vehicles per Household | Owner-occupied | Renter-occupied |
| No Vehicle | 49 (4.1%) | 0 (0.0%) |
| 1 Vehicle | 132 (11.0%) | 0 (0.0%) |
| 2 Vehicles | 714 (59.3%) | 12 (13.0%) |
| 3 or more Vehicles | 310 (25.7%) | 80 (87.0%) |
| Total | 1,205 (100.0%) | 92 (100.0%) |
Real Estate & Mortgages in Heritage Lake
Real Estate and Mortgage Overview in Heritage Lake
| Characteristic | Without Mortgage | With Mortgage |
| Housing Units | 204 | 1,001 |
| Median Property Value | $447,700 | $214,800 |
| Median Household Income | $78,393 | $62 |
| Monthly Housing Costs | $570 | $39 |
| Real Estate Taxes | $2,057 | $15 |
Property Value by Mortgage Status in Heritage Lake
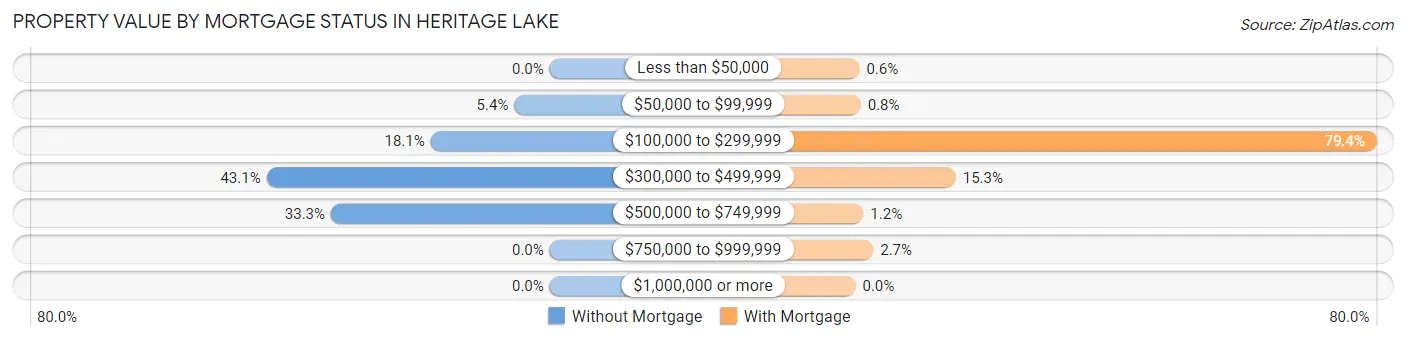
| Property Value | Without Mortgage | With Mortgage |
| Less than $50,000 | 0 (0.0%) | 6 (0.6%) |
| $50,000 to $99,999 | 11 (5.4%) | 8 (0.8%) |
| $100,000 to $299,999 | 37 (18.1%) | 795 (79.4%) |
| $300,000 to $499,999 | 88 (43.1%) | 153 (15.3%) |
| $500,000 to $749,999 | 68 (33.3%) | 12 (1.2%) |
| $750,000 to $999,999 | 0 (0.0%) | 27 (2.7%) |
| $1,000,000 or more | 0 (0.0%) | 0 (0.0%) |
| Total | 204 (100.0%) | 1,001 (100.0%) |
Household Income by Mortgage Status in Heritage Lake
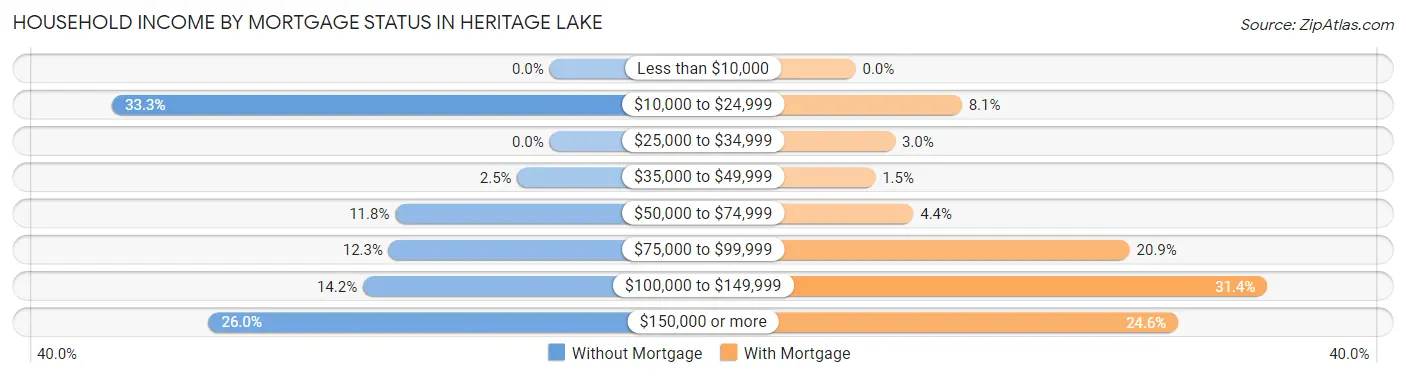
| Household Income | Without Mortgage | With Mortgage |
| Less than $10,000 | 0 (0.0%) | 0 (0.0%) |
| $10,000 to $24,999 | 68 (33.3%) | 81 (8.1%) |
| $25,000 to $34,999 | 0 (0.0%) | 30 (3.0%) |
| $35,000 to $49,999 | 5 (2.5%) | 15 (1.5%) |
| $50,000 to $74,999 | 24 (11.8%) | 44 (4.4%) |
| $75,000 to $99,999 | 25 (12.2%) | 209 (20.9%) |
| $100,000 to $149,999 | 29 (14.2%) | 314 (31.4%) |
| $150,000 or more | 53 (26.0%) | 246 (24.6%) |
| Total | 204 (100.0%) | 1,001 (100.0%) |
Property Value to Household Income Ratio in Heritage Lake
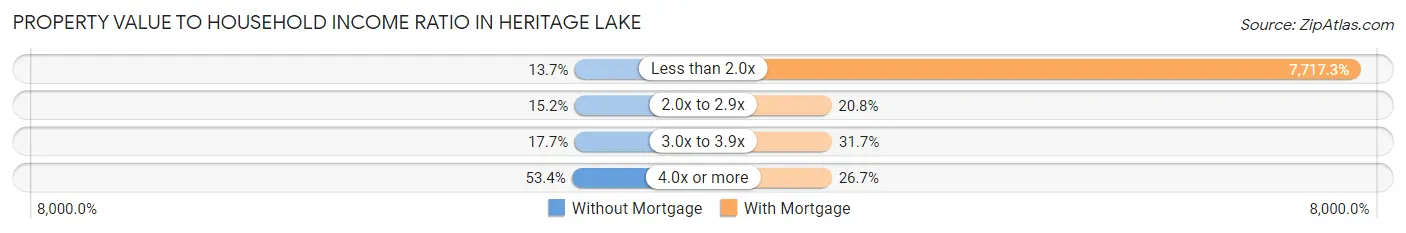
| Value-to-Income Ratio | Without Mortgage | With Mortgage |
| Less than 2.0x | 28 (13.7%) | 77,250 (7,717.3%) |
| 2.0x to 2.9x | 31 (15.2%) | 208 (20.8%) |
| 3.0x to 3.9x | 36 (17.6%) | 317 (31.7%) |
| 4.0x or more | 109 (53.4%) | 267 (26.7%) |
| Total | 204 (100.0%) | 1,001 (100.0%) |
Real Estate Taxes by Mortgage Status in Heritage Lake
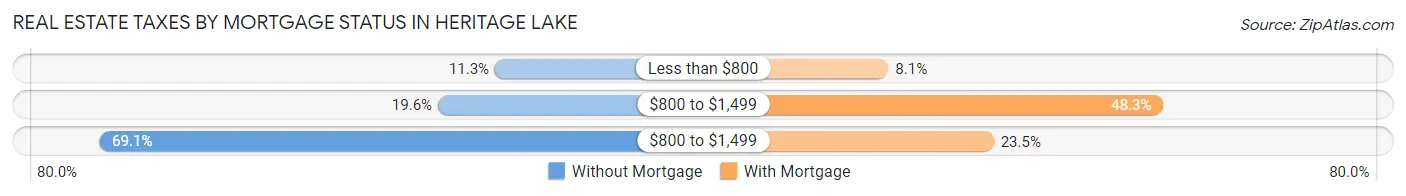
| Property Taxes | Without Mortgage | With Mortgage |
| Less than $800 | 23 (11.3%) | 81 (8.1%) |
| $800 to $1,499 | 40 (19.6%) | 483 (48.2%) |
| $800 to $1,499 | 141 (69.1%) | 235 (23.5%) |
| Total | 204 (100.0%) | 1,001 (100.0%) |
Health & Disability in Heritage Lake
Health Insurance Coverage by Age in Heritage Lake
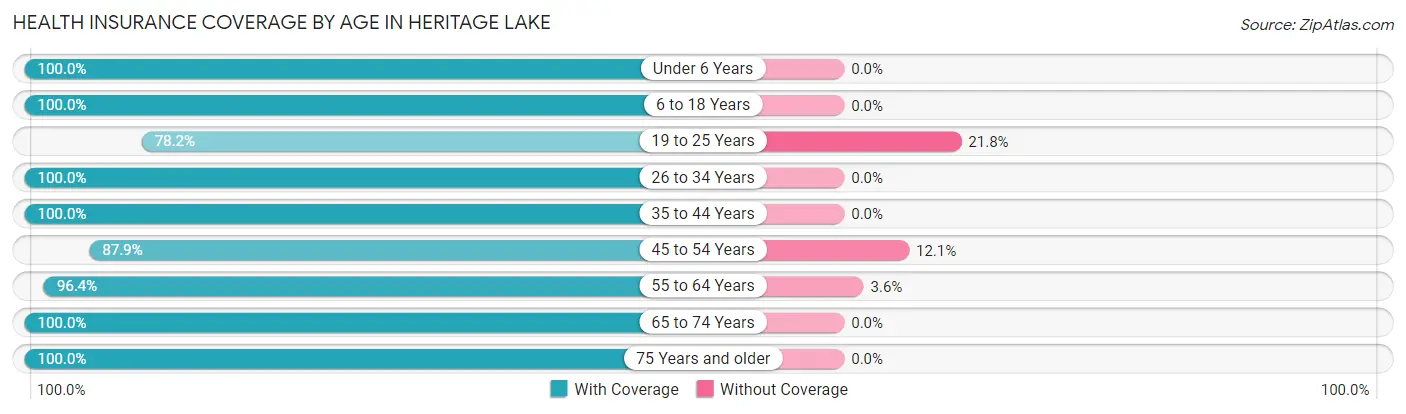
| Age Bracket | With Coverage | Without Coverage |
| Under 6 Years | 127 (100.0%) | 0 (0.0%) |
| 6 to 18 Years | 404 (100.0%) | 0 (0.0%) |
| 19 to 25 Years | 161 (78.2%) | 45 (21.8%) |
| 26 to 34 Years | 768 (100.0%) | 0 (0.0%) |
| 35 to 44 Years | 281 (100.0%) | 0 (0.0%) |
| 45 to 54 Years | 233 (87.9%) | 32 (12.1%) |
| 55 to 64 Years | 348 (96.4%) | 13 (3.6%) |
| 65 to 74 Years | 280 (100.0%) | 0 (0.0%) |
| 75 Years and older | 78 (100.0%) | 0 (0.0%) |
| Total | 2,680 (96.8%) | 90 (3.3%) |
Health Insurance Coverage by Citizenship Status in Heritage Lake
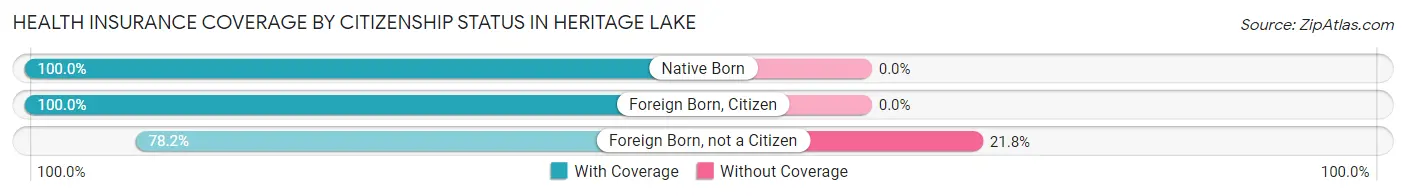
| Citizenship Status | With Coverage | Without Coverage |
| Native Born | 127 (100.0%) | 0 (0.0%) |
| Foreign Born, Citizen | 404 (100.0%) | 0 (0.0%) |
| Foreign Born, not a Citizen | 161 (78.2%) | 45 (21.8%) |
Health Insurance Coverage by Household Income in Heritage Lake
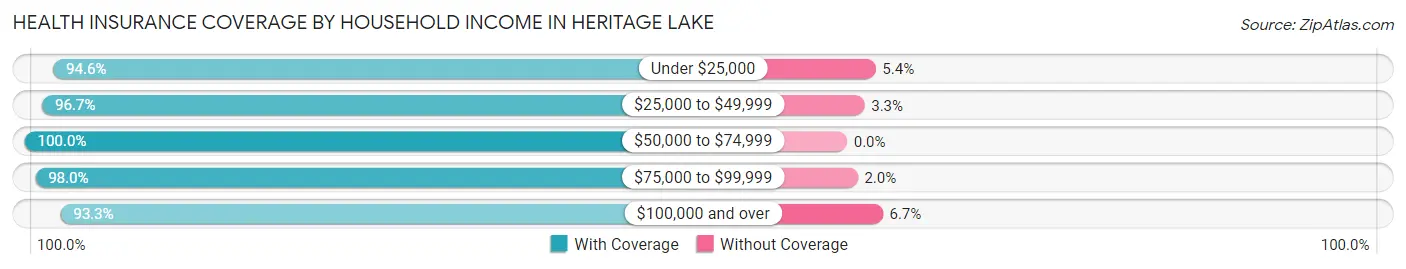
| Household Income | With Coverage | Without Coverage |
| Under $25,000 | 265 (94.6%) | 15 (5.4%) |
| $25,000 to $49,999 | 118 (96.7%) | 4 (3.3%) |
| $50,000 to $74,999 | 713 (100.0%) | 0 (0.0%) |
| $75,000 to $99,999 | 832 (98.0%) | 17 (2.0%) |
| $100,000 and over | 752 (93.3%) | 54 (6.7%) |
Public vs Private Health Insurance Coverage by Age in Heritage Lake
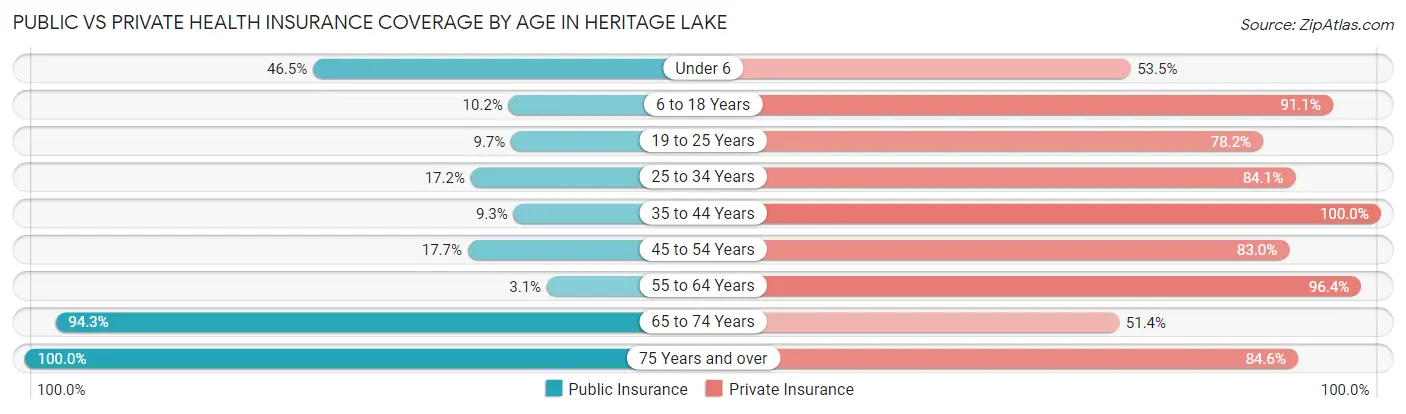
| Age Bracket | Public Insurance | Private Insurance |
| Under 6 | 59 (46.5%) | 68 (53.5%) |
| 6 to 18 Years | 41 (10.2%) | 368 (91.1%) |
| 19 to 25 Years | 20 (9.7%) | 161 (78.2%) |
| 25 to 34 Years | 132 (17.2%) | 646 (84.1%) |
| 35 to 44 Years | 26 (9.2%) | 281 (100.0%) |
| 45 to 54 Years | 47 (17.7%) | 220 (83.0%) |
| 55 to 64 Years | 11 (3.0%) | 348 (96.4%) |
| 65 to 74 Years | 264 (94.3%) | 144 (51.4%) |
| 75 Years and over | 78 (100.0%) | 66 (84.6%) |
| Total | 678 (24.5%) | 2,302 (83.1%) |
Disability Status by Sex by Age in Heritage Lake
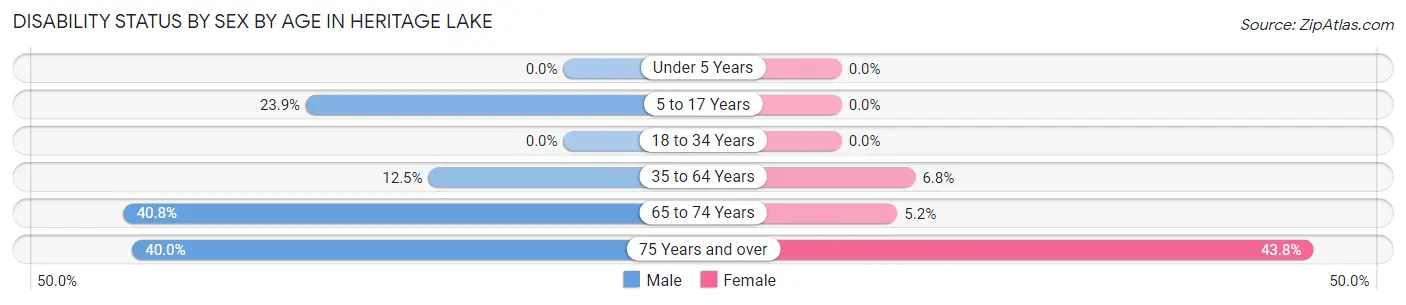
| Age Bracket | Male | Female |
| Under 5 Years | 0 (0.0%) | 0 (0.0%) |
| 5 to 17 Years | 54 (23.9%) | 0 (0.0%) |
| 18 to 34 Years | 0 (0.0%) | 0 (0.0%) |
| 35 to 64 Years | 55 (12.5%) | 32 (6.8%) |
| 65 to 74 Years | 51 (40.8%) | 8 (5.2%) |
| 75 Years and over | 12 (40.0%) | 21 (43.8%) |
Disability Class by Sex by Age in Heritage Lake
Disability Class: Hearing Difficulty

| Age Bracket | Male | Female |
| Under 5 Years | 0 (0.0%) | 0 (0.0%) |
| 5 to 17 Years | 0 (0.0%) | 0 (0.0%) |
| 18 to 34 Years | 0 (0.0%) | 0 (0.0%) |
| 35 to 64 Years | 0 (0.0%) | 19 (4.1%) |
| 65 to 74 Years | 16 (12.8%) | 8 (5.2%) |
| 75 Years and over | 12 (40.0%) | 8 (16.7%) |
Disability Class: Vision Difficulty
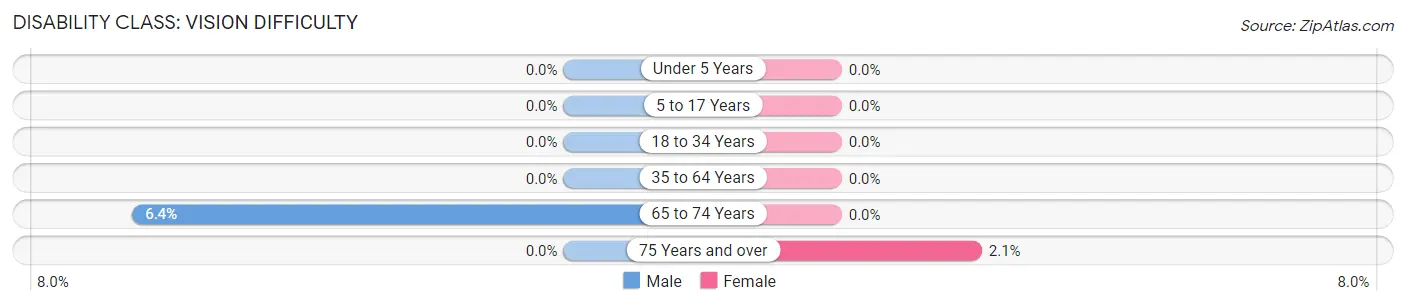
| Age Bracket | Male | Female |
| Under 5 Years | 0 (0.0%) | 0 (0.0%) |
| 5 to 17 Years | 0 (0.0%) | 0 (0.0%) |
| 18 to 34 Years | 0 (0.0%) | 0 (0.0%) |
| 35 to 64 Years | 0 (0.0%) | 0 (0.0%) |
| 65 to 74 Years | 8 (6.4%) | 0 (0.0%) |
| 75 Years and over | 0 (0.0%) | 1 (2.1%) |
Disability Class: Cognitive Difficulty

| Age Bracket | Male | Female |
| 5 to 17 Years | 54 (23.9%) | 0 (0.0%) |
| 18 to 34 Years | 0 (0.0%) | 0 (0.0%) |
| 35 to 64 Years | 0 (0.0%) | 24 (5.1%) |
| 65 to 74 Years | 0 (0.0%) | 0 (0.0%) |
| 75 Years and over | 0 (0.0%) | 0 (0.0%) |
Disability Class: Ambulatory Difficulty
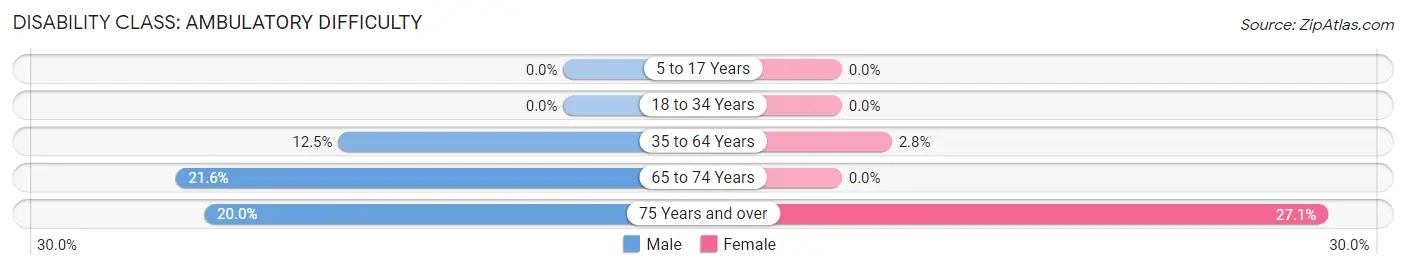
| Age Bracket | Male | Female |
| 5 to 17 Years | 0 (0.0%) | 0 (0.0%) |
| 18 to 34 Years | 0 (0.0%) | 0 (0.0%) |
| 35 to 64 Years | 55 (12.5%) | 13 (2.8%) |
| 65 to 74 Years | 27 (21.6%) | 0 (0.0%) |
| 75 Years and over | 6 (20.0%) | 13 (27.1%) |
Disability Class: Self-Care Difficulty

| Age Bracket | Male | Female |
| 5 to 17 Years | 0 (0.0%) | 0 (0.0%) |
| 18 to 34 Years | 0 (0.0%) | 0 (0.0%) |
| 35 to 64 Years | 9 (2.1%) | 0 (0.0%) |
| 65 to 74 Years | 27 (21.6%) | 0 (0.0%) |
| 75 Years and over | 0 (0.0%) | 0 (0.0%) |
Technology Access in Heritage Lake
Computing Device Access in Heritage Lake
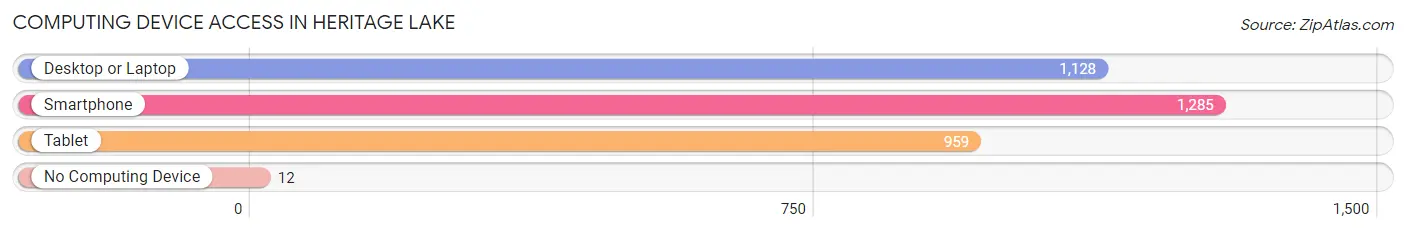
| Device Type | # Households | % Households |
| Desktop or Laptop | 1,128 | 87.0% |
| Smartphone | 1,285 | 99.1% |
| Tablet | 959 | 73.9% |
| No Computing Device | 12 | 0.9% |
| Total | 1,297 | 100.0% |
Internet Access in Heritage Lake
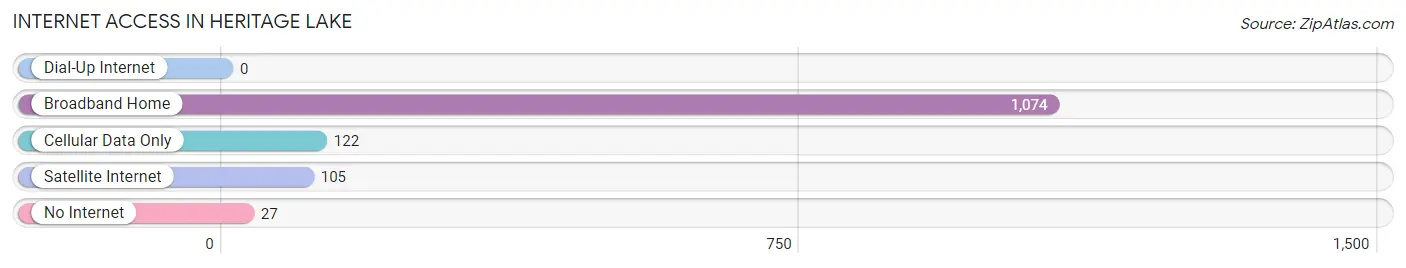
| Internet Type | # Households | % Households |
| Dial-Up Internet | 0 | 0.0% |
| Broadband Home | 1,074 | 82.8% |
| Cellular Data Only | 122 | 9.4% |
| Satellite Internet | 105 | 8.1% |
| No Internet | 27 | 2.1% |
| Total | 1,297 | 100.0% |
Heritage Lake Summary
Heritage Lake is a census-designated place located in Putnam County, Indiana, United States. It is part of the Terre Haute Metropolitan Statistical Area. As of the 2010 census, the population of Heritage Lake was 1,845.
Geography
Heritage Lake is located at 39°45'25"N 86°45'45"W (39.756944, -86.762500). It has an elevation of 690 feet (210 m).
The area is located in the western part of Putnam County, approximately 10 miles (16 km) west of Greencastle and 8 miles (13 km) east of Cloverdale. It is bordered by the towns of Bainbridge, Fillmore, and Reelsville.
History
Heritage Lake was originally known as "Heritage Hill" and was settled in the early 1800s. The area was primarily used for farming and was home to a few small businesses.
In the late 1960s, the area was developed into a recreational lake and residential community. The lake was created by damming the Big Walnut Creek and was named Heritage Lake. The lake is now a popular destination for fishing, boating, and other recreational activities.
Economy
Heritage Lake is primarily a residential community, but it does have a few businesses. These include a convenience store, a restaurant, and a few other small businesses.
The area is also home to a number of farms which produce corn soybeans and other crops
Demographics
As of the 2010 census, the population of Heritage Lake was 1,845. The racial makeup of the area was 97.3% White, 0.7% African American, 0.2% Native American, 0.3% Asian, 0.2% from other races, and 1.5% from two or more races. Hispanic or Latino of any race were 1.2% of the population.
The median household income in Heritage Lake was $50,938, and the median family income was $56,250. The per capita income was $21,945. About 8.3% of families and 10.2% of the population were below the poverty line, including 14.2% of those under age 18 and 5.2% of those age 65 or over.
Conclusion
Heritage Lake is a small residential community located in Putnam County, Indiana. It is home to a few businesses and farms, and is a popular destination for fishing and other recreational activities. The population of Heritage Lake is primarily white, with a median household income of $50,938.
Common Questions
What is the Total Population of Heritage Lake?
Total Population of Heritage Lake is 2,770.
What is the Total Male Population of Heritage Lake?
Total Male Population of Heritage Lake is 1,338.
What is the Total Female Population of Heritage Lake?
Total Female Population of Heritage Lake is 1,432.
What is the Ratio of Males per 100 Females in Heritage Lake?
There are 93.44 Males per 100 Females in Heritage Lake.
What is the Ratio of Females per 100 Males in Heritage Lake?
There are 107.03 Females per 100 Males in Heritage Lake.
What is the Median Population Age in Heritage Lake?
Median Population Age in Heritage Lake is 33.8 Years.
What is the Average Family Size in Heritage Lake
Average Family Size in Heritage Lake is 2.2 People.
What is the Average Household Size in Heritage Lake
Average Household Size in Heritage Lake is 2.1 People.
What is Per Capita Income in Heritage Lake?
Per Capita income in Heritage Lake is $38,793.
What is the Median Family Income in Heritage Lake?
Median Family Income in Heritage Lake is $74,242.
What is the Median Household income in Heritage Lake?
Median Household Income in Heritage Lake is $76,573.
What is Income or Wage Gap in Heritage Lake?
Income or Wage Gap in Heritage Lake is 57.8%.
Women in Heritage Lake earn 42.2 cents for every dollar earned by a man.
What is Inequality or Gini Index in Heritage Lake?
Inequality or Gini Index in Heritage Lake is 0.34.
How Large is the Labor Force in Heritage Lake?
There are 1,666 People in the Labor Forcein in Heritage Lake.
What is the Percentage of People in the Labor Force in Heritage Lake?
73.5% of People are in the Labor Force in Heritage Lake.
What is the Unemployment Rate in Heritage Lake?
Unemployment Rate in Heritage Lake is 4.5%.