New Richmond, IN
New Richmond Map
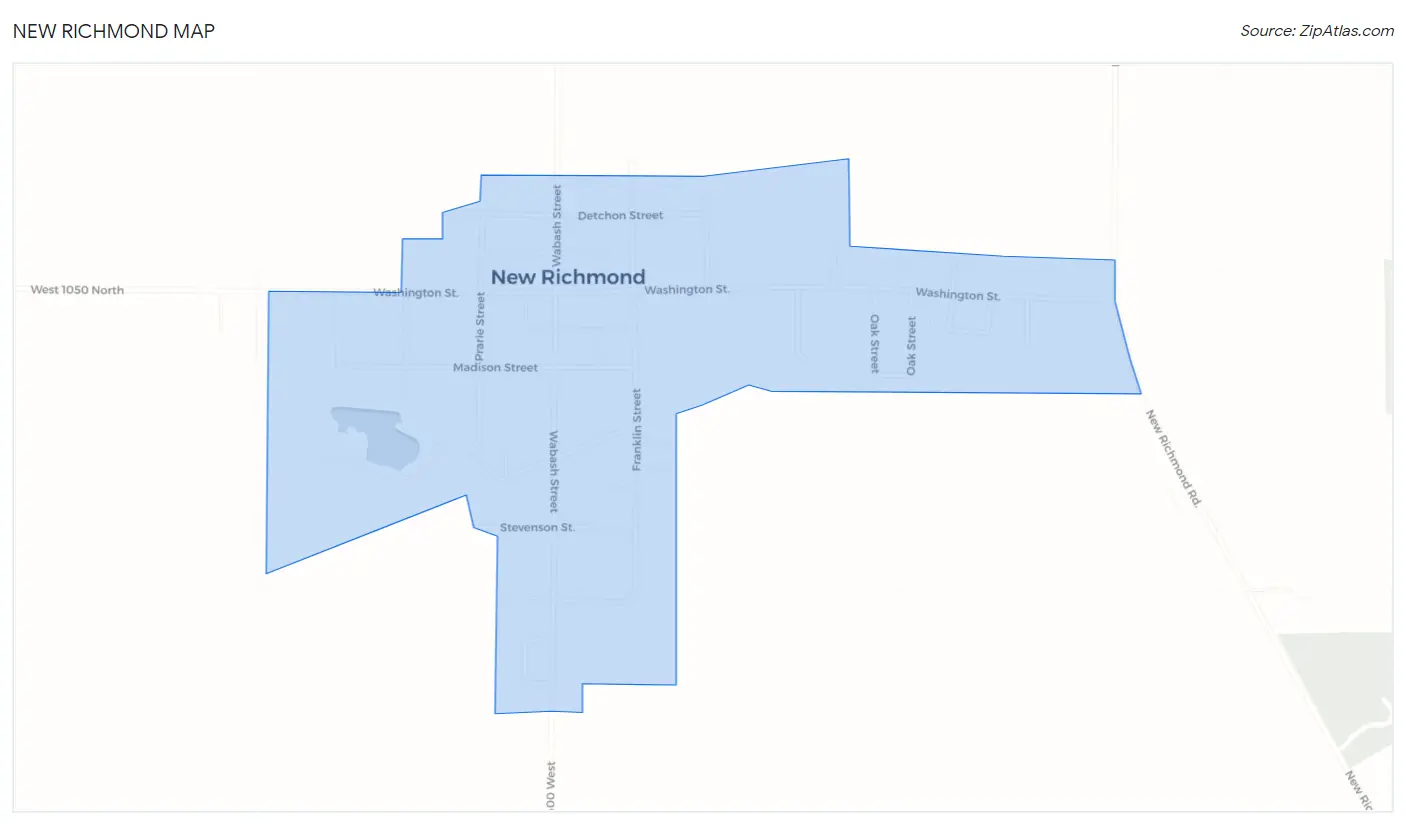
New Richmond Overview
407
TOTAL POPULATION
196
MALE POPULATION
211
FEMALE POPULATION
92.89
MALES / 100 FEMALES
107.65
FEMALES / 100 MALES
37.5
MEDIAN AGE
3.2
AVG FAMILY SIZE
2.6
AVG HOUSEHOLD SIZE
$23,911
PER CAPITA INCOME
$76,143
AVG FAMILY INCOME
$75,750
AVG HOUSEHOLD INCOME
9.2%
WAGE / INCOME GAP [ % ]
90.8¢/ $1
WAGE / INCOME GAP [ $ ]
0.26
INEQUALITY / GINI INDEX
175
LABOR FORCE [ PEOPLE ]
55.2%
PERCENT IN LABOR FORCE
4.6%
UNEMPLOYMENT RATE
New Richmond Zip Codes
New Richmond Area Codes
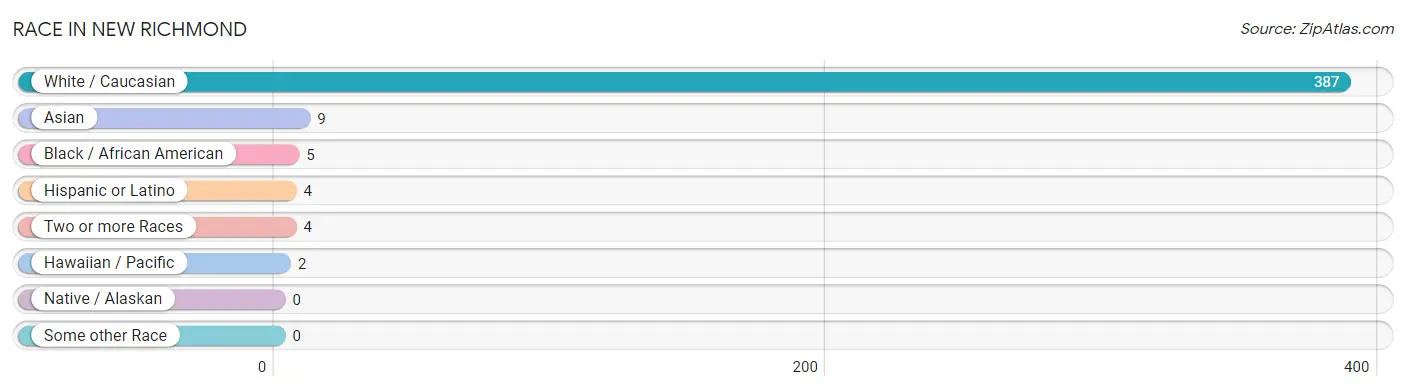
Race in New Richmond
The most populous races in New Richmond are White / Caucasian (387 | 95.1%), Asian (9 | 2.2%), and Black / African American (5 | 1.2%).
| Race | # Population | % Population |
| Asian | 9 | 2.2% |
| Black / African American | 5 | 1.2% |
| Hawaiian / Pacific | 2 | 0.5% |
| Hispanic or Latino | 4 | 1.0% |
| Native / Alaskan | 0 | 0.0% |
| White / Caucasian | 387 | 95.1% |
| Two or more Races | 4 | 1.0% |
| Some other Race | 0 | 0.0% |
| Total | 407 | 100.0% |
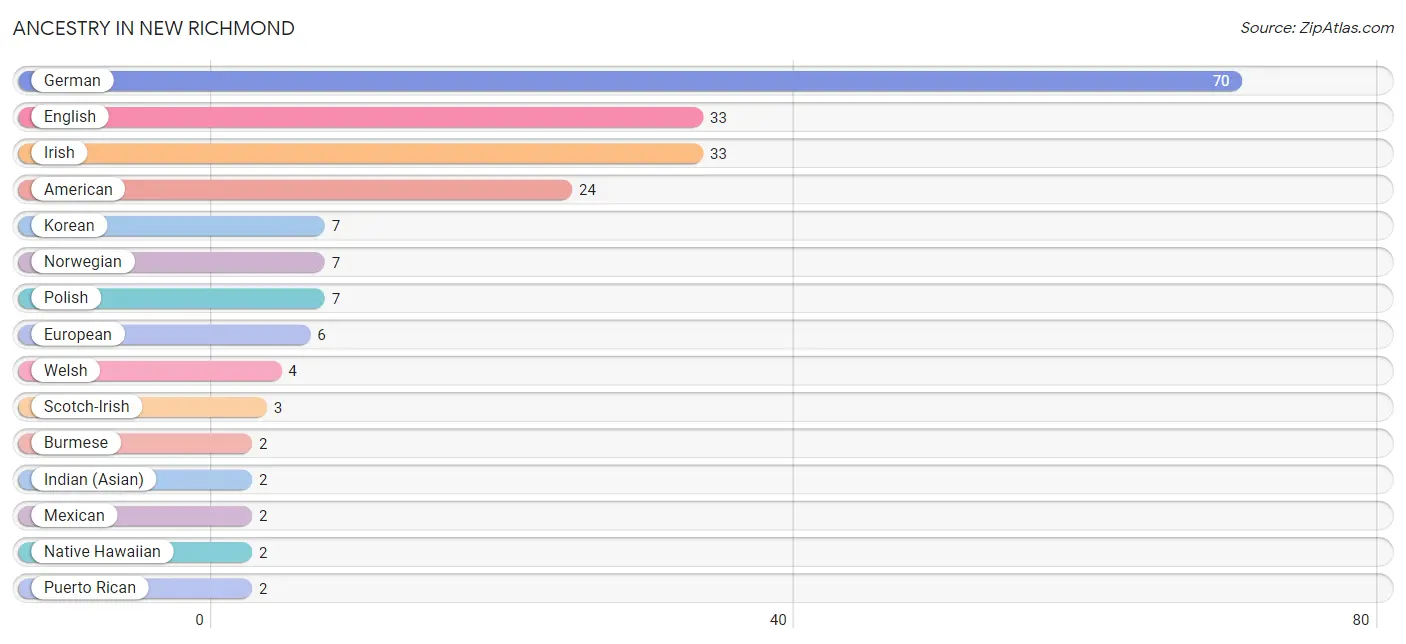
Ancestry in New Richmond
The most populous ancestries reported in New Richmond are German (70 | 17.2%), English (33 | 8.1%), Irish (33 | 8.1%), American (24 | 5.9%), and Korean (7 | 1.7%), together accounting for 41.0% of all New Richmond residents.
| Ancestry | # Population | % Population |
| American | 24 | 5.9% |
| Austrian | 1 | 0.3% |
| Burmese | 2 | 0.5% |
| English | 33 | 8.1% |
| European | 6 | 1.5% |
| French Canadian | 1 | 0.3% |
| German | 70 | 17.2% |
| Indian (Asian) | 2 | 0.5% |
| Irish | 33 | 8.1% |
| Italian | 1 | 0.3% |
| Korean | 7 | 1.7% |
| Mexican | 2 | 0.5% |
| Native Hawaiian | 2 | 0.5% |
| Norwegian | 7 | 1.7% |
| Polish | 7 | 1.7% |
| Puerto Rican | 2 | 0.5% |
| Scotch-Irish | 3 | 0.7% |
| Scottish | 2 | 0.5% |
| Swedish | 2 | 0.5% |
| Welsh | 4 | 1.0% | View All 20 Rows |
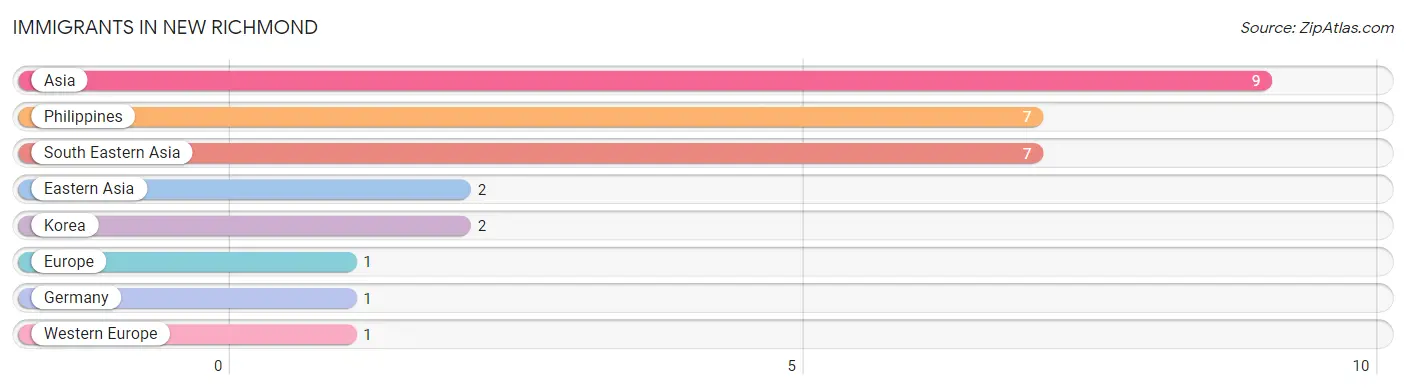
Immigrants in New Richmond
The most numerous immigrant groups reported in New Richmond came from Asia (9 | 2.2%), Philippines (7 | 1.7%), South Eastern Asia (7 | 1.7%), Eastern Asia (2 | 0.5%), and Korea (2 | 0.5%), together accounting for 6.6% of all New Richmond residents.
| Immigration Origin | # Population | % Population |
| Asia | 9 | 2.2% |
| Eastern Asia | 2 | 0.5% |
| Europe | 1 | 0.3% |
| Germany | 1 | 0.3% |
| Korea | 2 | 0.5% |
| Philippines | 7 | 1.7% |
| South Eastern Asia | 7 | 1.7% |
| Western Europe | 1 | 0.3% | View All 8 Rows |
Sex and Age in New Richmond
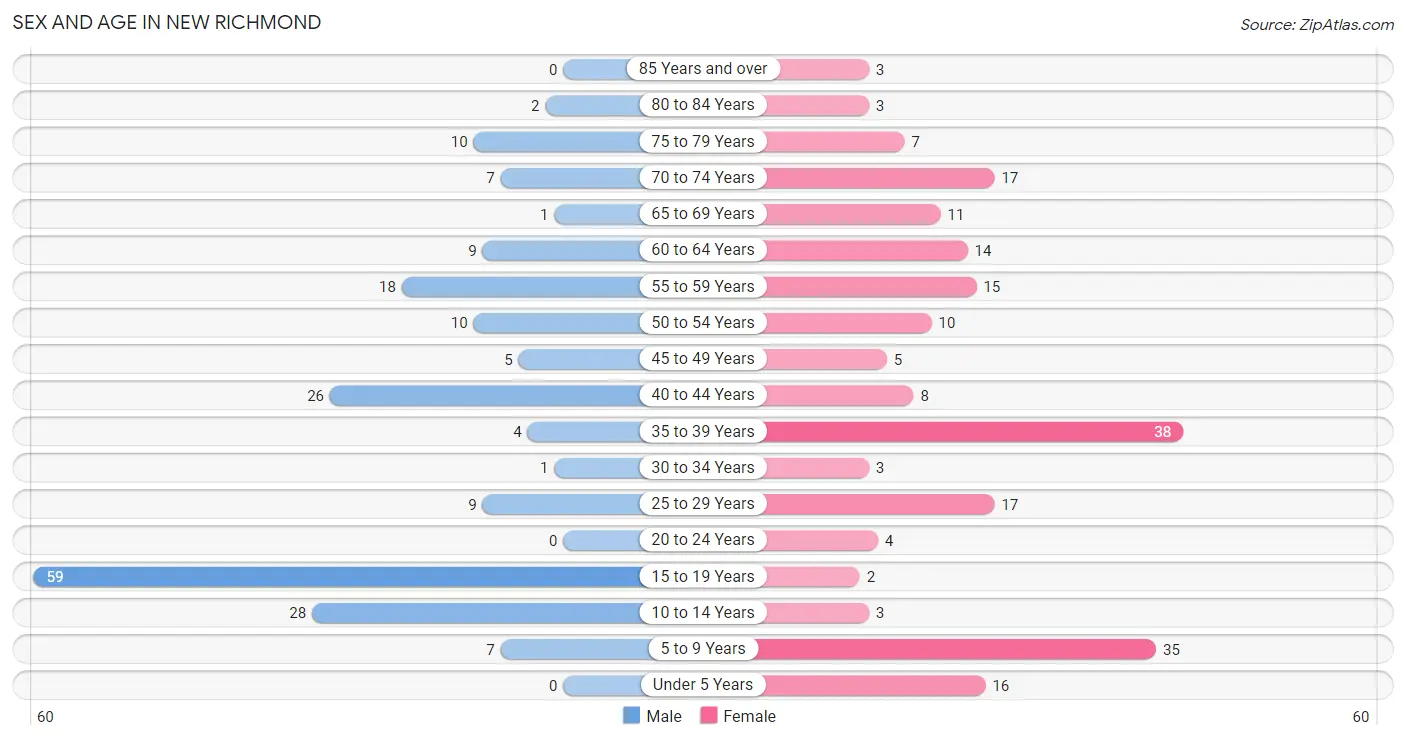
Sex and Age in New Richmond
The most populous age groups in New Richmond are 15 to 19 Years (59 | 30.1%) for men and 35 to 39 Years (38 | 18.0%) for women.
| Age Bracket | Male | Female |
| Under 5 Years | 0 (0.0%) | 16 (7.6%) |
| 5 to 9 Years | 7 (3.6%) | 35 (16.6%) |
| 10 to 14 Years | 28 (14.3%) | 3 (1.4%) |
| 15 to 19 Years | 59 (30.1%) | 2 (0.9%) |
| 20 to 24 Years | 0 (0.0%) | 4 (1.9%) |
| 25 to 29 Years | 9 (4.6%) | 17 (8.1%) |
| 30 to 34 Years | 1 (0.5%) | 3 (1.4%) |
| 35 to 39 Years | 4 (2.0%) | 38 (18.0%) |
| 40 to 44 Years | 26 (13.3%) | 8 (3.8%) |
| 45 to 49 Years | 5 (2.5%) | 5 (2.4%) |
| 50 to 54 Years | 10 (5.1%) | 10 (4.7%) |
| 55 to 59 Years | 18 (9.2%) | 15 (7.1%) |
| 60 to 64 Years | 9 (4.6%) | 14 (6.6%) |
| 65 to 69 Years | 1 (0.5%) | 11 (5.2%) |
| 70 to 74 Years | 7 (3.6%) | 17 (8.1%) |
| 75 to 79 Years | 10 (5.1%) | 7 (3.3%) |
| 80 to 84 Years | 2 (1.0%) | 3 (1.4%) |
| 85 Years and over | 0 (0.0%) | 3 (1.4%) |
| Total | 196 (100.0%) | 211 (100.0%) |
Families and Households in New Richmond
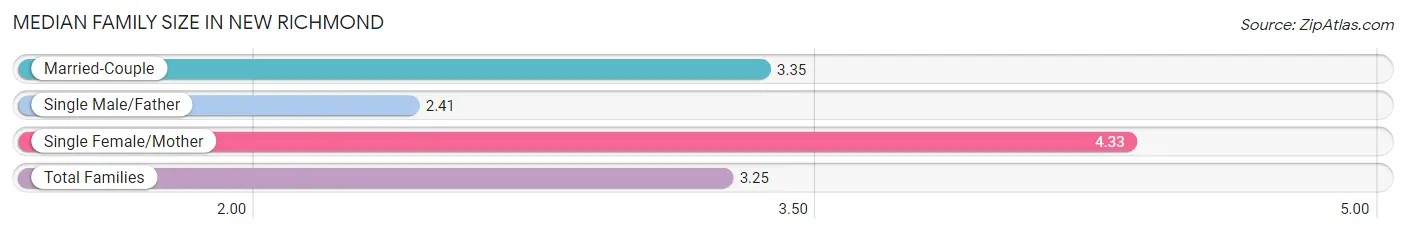
Median Family Size in New Richmond
The median family size in New Richmond is 3.25 persons per family, with single female/mother families (6 | 5.7%) accounting for the largest median family size of 4.33 persons per family. On the other hand, single male/father families (17 | 16.0%) represent the smallest median family size with 2.41 persons per family.
| Family Type | # Families | Family Size |
| Married-Couple | 83 (78.3%) | 3.35 |
| Single Male/Father | 17 (16.0%) | 2.41 |
| Single Female/Mother | 6 (5.7%) | 4.33 |
| Total Families | 106 (100.0%) | 3.25 |
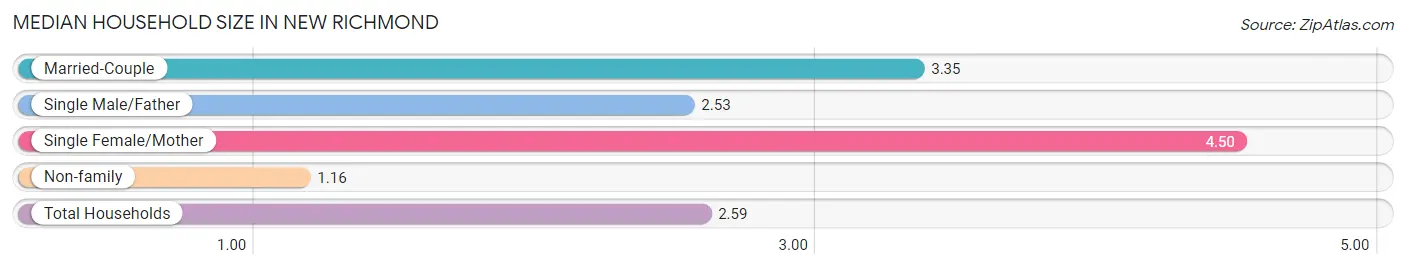
Median Household Size in New Richmond
The median household size in New Richmond is 2.59 persons per household, with single female/mother households (6 | 3.8%) accounting for the largest median household size of 4.5 persons per household. non-family households (51 | 32.5%) represent the smallest median household size with 1.16 persons per household.
| Household Type | # Households | Household Size |
| Married-Couple | 83 (52.9%) | 3.35 |
| Single Male/Father | 17 (10.8%) | 2.53 |
| Single Female/Mother | 6 (3.8%) | 4.50 |
| Non-family | 51 (32.5%) | 1.16 |
| Total Households | 157 (100.0%) | 2.59 |
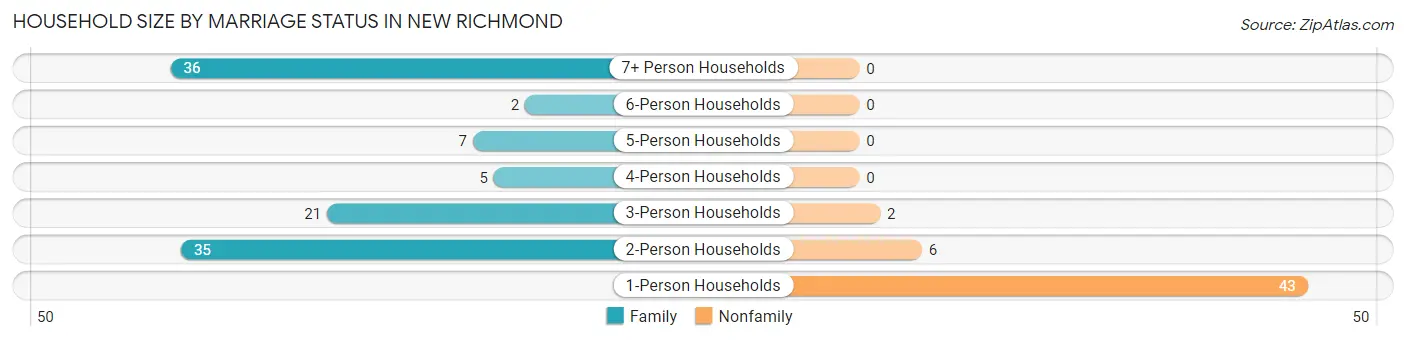
Household Size by Marriage Status in New Richmond
Out of a total of 157 households in New Richmond, 106 (67.5%) are family households, while 51 (32.5%) are nonfamily households. The most numerous type of family households are 7+ person households, comprising 36, and the most common type of nonfamily households are 1-person households, comprising 43.
| Household Size | Family Households | Nonfamily Households |
| 1-Person Households | - | 43 (27.4%) |
| 2-Person Households | 35 (22.3%) | 6 (3.8%) |
| 3-Person Households | 21 (13.4%) | 2 (1.3%) |
| 4-Person Households | 5 (3.2%) | 0 (0.0%) |
| 5-Person Households | 7 (4.5%) | 0 (0.0%) |
| 6-Person Households | 2 (1.3%) | 0 (0.0%) |
| 7+ Person Households | 36 (22.9%) | 0 (0.0%) |
| Total | 106 (67.5%) | 51 (32.5%) |
Female Fertility in New Richmond
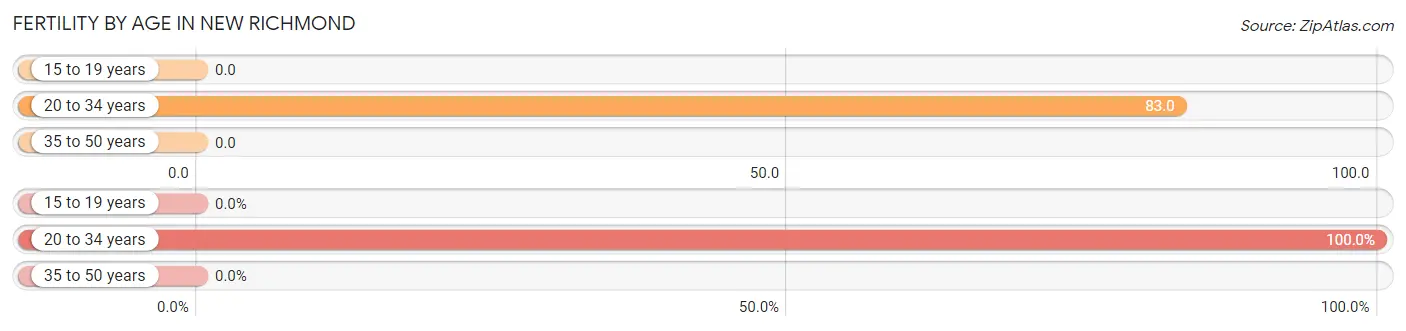
Fertility by Age in New Richmond
Average fertility rate in New Richmond is 26.0 births per 1,000 women. Women in the age bracket of 20 to 34 years have the highest fertility rate with 83.0 births per 1,000 women. Women in the age bracket of 20 to 34 years acount for 100.0% of all women with births.
| Age Bracket | Women with Births | Births / 1,000 Women |
| 15 to 19 years | 0 (0.0%) | 0.0 |
| 20 to 34 years | 2 (100.0%) | 83.0 |
| 35 to 50 years | 0 (0.0%) | 0.0 |
| Total | 2 (100.0%) | 26.0 |
Fertility by Age by Marriage Status in New Richmond
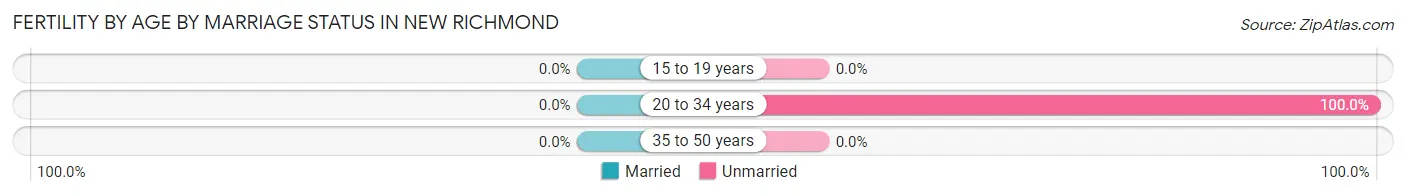
| Age Bracket | Married | Unmarried |
| 15 to 19 years | 0 (0.0%) | 0 (0.0%) |
| 20 to 34 years | 0 (0.0%) | 2 (100.0%) |
| 35 to 50 years | 0 (0.0%) | 0 (0.0%) |
| Total | 0 (0.0%) | 2 (100.0%) |
Fertility by Education in New Richmond
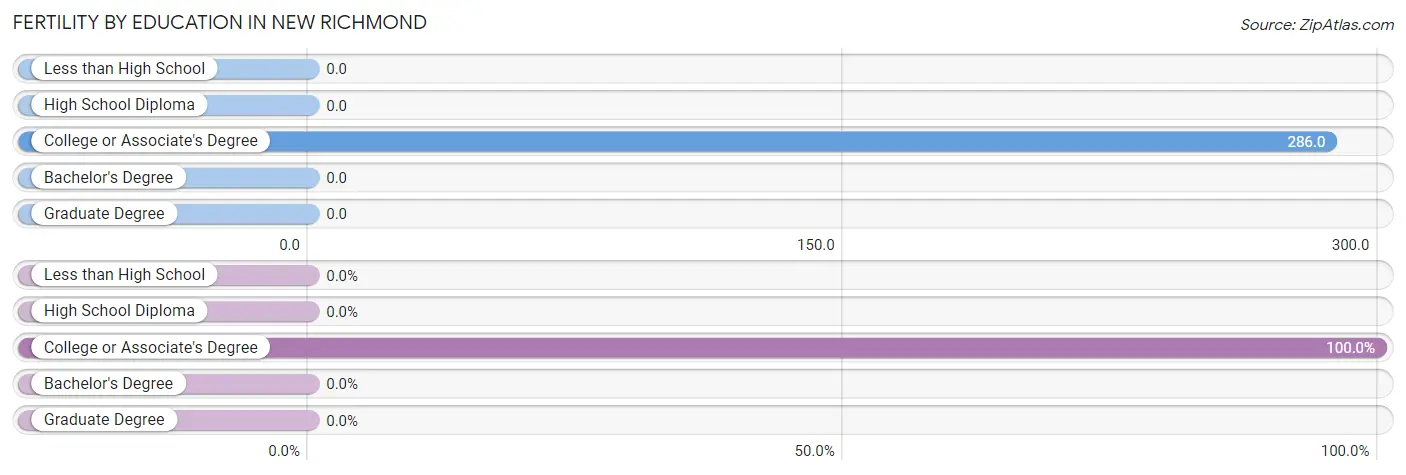
| Educational Attainment | Women with Births | Births / 1,000 Women |
| Less than High School | 0 (0.0%) | 0.0 |
| High School Diploma | 0 (0.0%) | 0.0 |
| College or Associate's Degree | 2 (100.0%) | 286.0 |
| Bachelor's Degree | 0 (0.0%) | 0.0 |
| Graduate Degree | 0 (0.0%) | 0.0 |
| Total | 2 (100.0%) | 26.0 |
Fertility by Education by Marriage Status in New Richmond
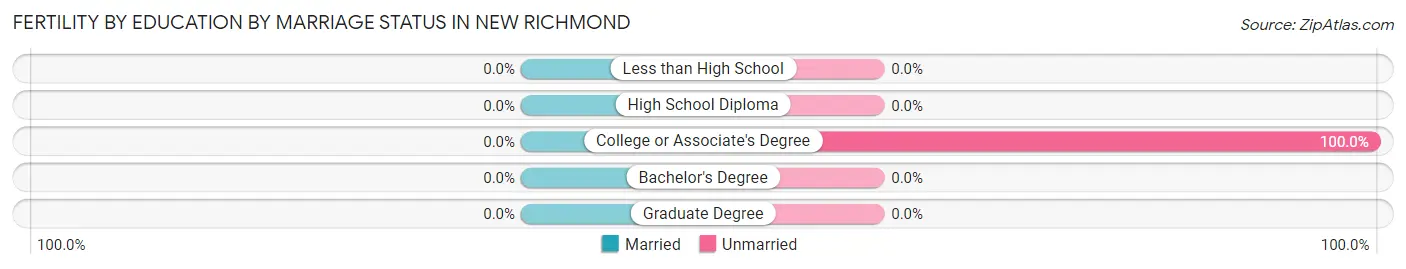
| Educational Attainment | Married | Unmarried |
| Less than High School | 0 (0.0%) | 0 (0.0%) |
| High School Diploma | 0 (0.0%) | 0 (0.0%) |
| College or Associate's Degree | 0 (0.0%) | 2 (100.0%) |
| Bachelor's Degree | 0 (0.0%) | 0 (0.0%) |
| Graduate Degree | 0 (0.0%) | 0 (0.0%) |
| Total | 0 (0.0%) | 2 (100.0%) |
Income in New Richmond
Income Overview in New Richmond
Per Capita Income in New Richmond is $23,911, while median incomes of families and households are $76,143 and $75,750 respectively.
| Characteristic | Number | Measure |
| Per Capita Income | 407 | $23,911 |
| Median Family Income | 106 | $76,143 |
| Mean Family Income | 106 | $76,285 |
| Median Household Income | 157 | $75,750 |
| Mean Household Income | 157 | $69,805 |
| Income Deficit | 106 | $0 |
| Wage / Income Gap (%) | 407 | 9.16% |
| Wage / Income Gap ($) | 407 | 90.84¢ per $1 |
| Gini / Inequality Index | 407 | 0.26 |
Earnings by Sex in New Richmond
Average Earnings in New Richmond are $40,625, $38,750 for men and $42,656 for women, a difference of 9.2%.
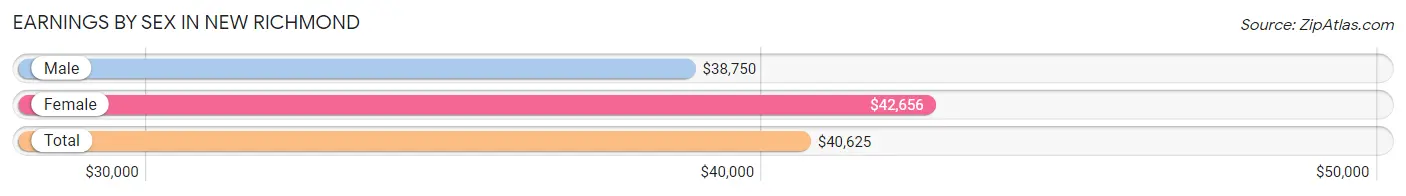
| Sex | Number | Average Earnings |
| Male | 131 (66.2%) | $38,750 |
| Female | 67 (33.8%) | $42,656 |
| Total | 198 (100.0%) | $40,625 |
Earnings by Sex by Income Bracket in New Richmond
The most common earnings brackets in New Richmond are $17,500 to $19,999 for men (28 | 21.4%) and $65,000 to $74,999 for women (12 | 17.9%).
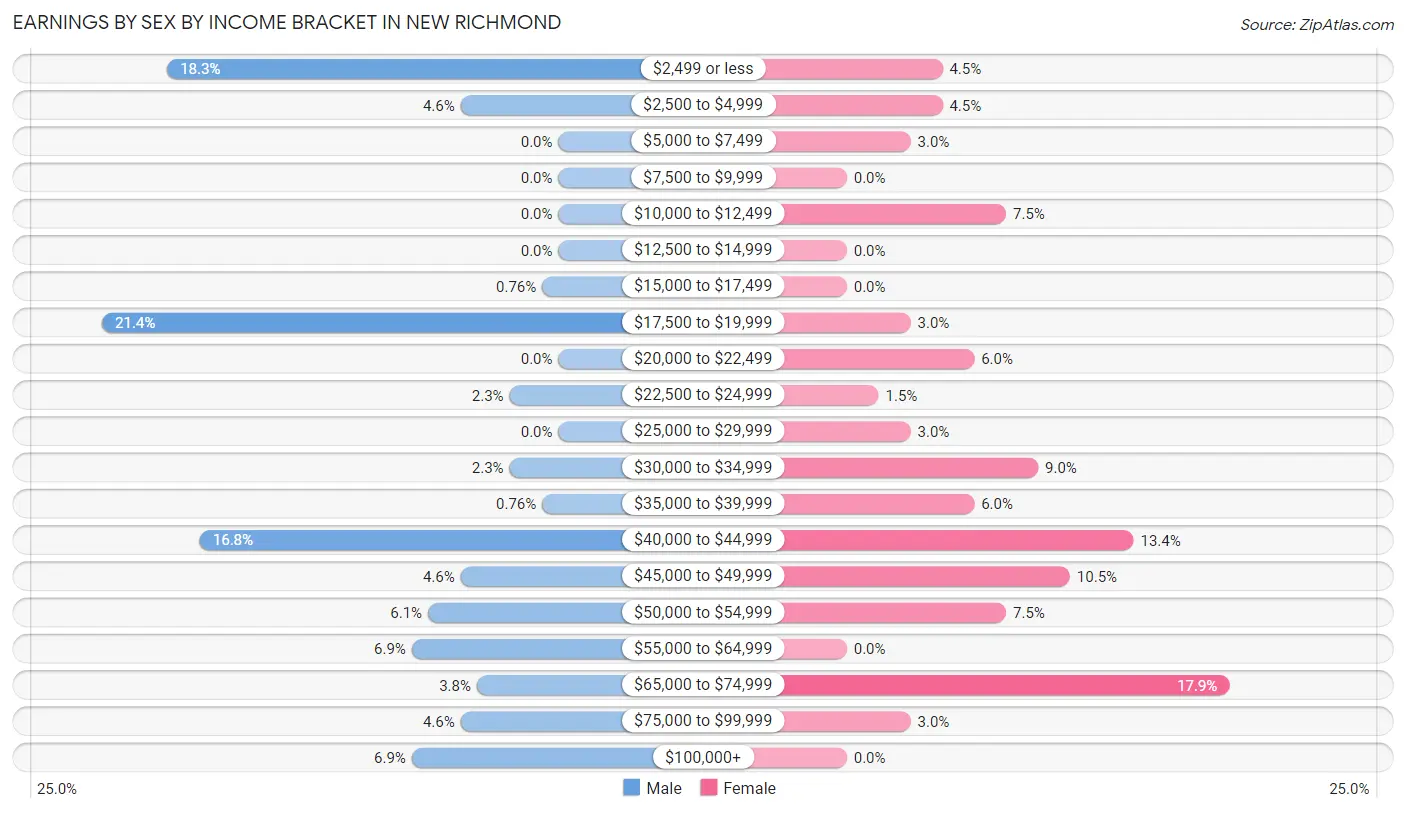
| Income | Male | Female |
| $2,499 or less | 24 (18.3%) | 3 (4.5%) |
| $2,500 to $4,999 | 6 (4.6%) | 3 (4.5%) |
| $5,000 to $7,499 | 0 (0.0%) | 2 (3.0%) |
| $7,500 to $9,999 | 0 (0.0%) | 0 (0.0%) |
| $10,000 to $12,499 | 0 (0.0%) | 5 (7.5%) |
| $12,500 to $14,999 | 0 (0.0%) | 0 (0.0%) |
| $15,000 to $17,499 | 1 (0.8%) | 0 (0.0%) |
| $17,500 to $19,999 | 28 (21.4%) | 2 (3.0%) |
| $20,000 to $22,499 | 0 (0.0%) | 4 (6.0%) |
| $22,500 to $24,999 | 3 (2.3%) | 1 (1.5%) |
| $25,000 to $29,999 | 0 (0.0%) | 2 (3.0%) |
| $30,000 to $34,999 | 3 (2.3%) | 6 (9.0%) |
| $35,000 to $39,999 | 1 (0.8%) | 4 (6.0%) |
| $40,000 to $44,999 | 22 (16.8%) | 9 (13.4%) |
| $45,000 to $49,999 | 6 (4.6%) | 7 (10.4%) |
| $50,000 to $54,999 | 8 (6.1%) | 5 (7.5%) |
| $55,000 to $64,999 | 9 (6.9%) | 0 (0.0%) |
| $65,000 to $74,999 | 5 (3.8%) | 12 (17.9%) |
| $75,000 to $99,999 | 6 (4.6%) | 2 (3.0%) |
| $100,000+ | 9 (6.9%) | 0 (0.0%) |
| Total | 131 (100.0%) | 67 (100.0%) |
Earnings by Sex by Educational Attainment in New Richmond
Average earnings in New Richmond are $47,292 for men and $43,594 for women, a difference of 7.8%. Men with an educational attainment of high school diploma enjoy the highest average annual earnings of $52,708, while those with college or associate's degree education earn the least with $47,500. Women with an educational attainment of bachelor's degree earn the most with the average annual earnings of $45,500, while those with college or associate's degree education have the smallest earnings of $28,750.
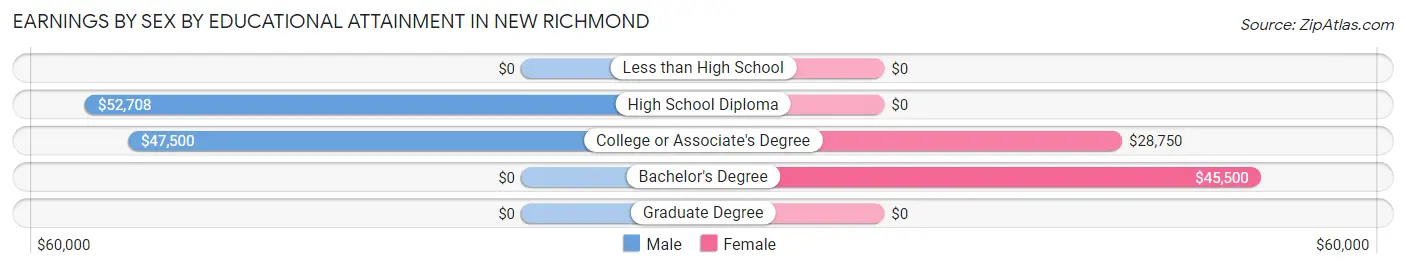
| Educational Attainment | Male Income | Female Income |
| Less than High School | - | - |
| High School Diploma | $52,708 | $0 |
| College or Associate's Degree | $47,500 | $28,750 |
| Bachelor's Degree | - | - |
| Graduate Degree | - | - |
| Total | $47,292 | $43,594 |
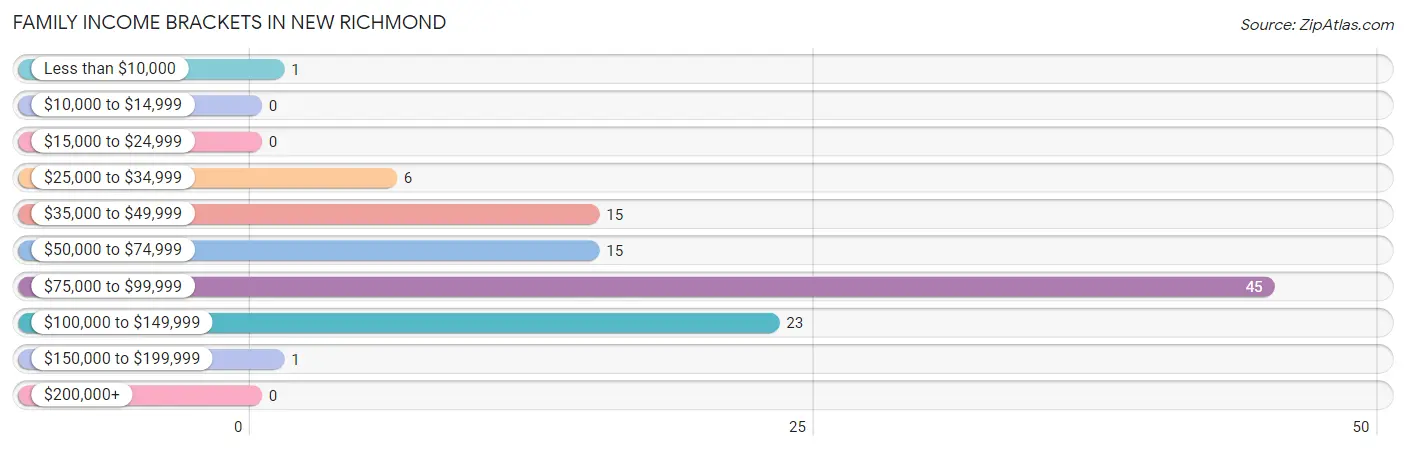
Family Income in New Richmond
Family Income Brackets in New Richmond
According to the New Richmond family income data, there are 45 families falling into the $75,000 to $99,999 income range, which is the most common income bracket and makes up 42.4% of all families.
| Income Bracket | # Families | % Families |
| Less than $10,000 | 1 | 0.9% |
| $10,000 to $14,999 | 0 | 0.0% |
| $15,000 to $24,999 | 0 | 0.0% |
| $25,000 to $34,999 | 6 | 5.7% |
| $35,000 to $49,999 | 15 | 14.2% |
| $50,000 to $74,999 | 15 | 14.2% |
| $75,000 to $99,999 | 45 | 42.5% |
| $100,000 to $149,999 | 23 | 21.7% |
| $150,000 to $199,999 | 1 | 0.9% |
| $200,000+ | 0 | 0.0% |
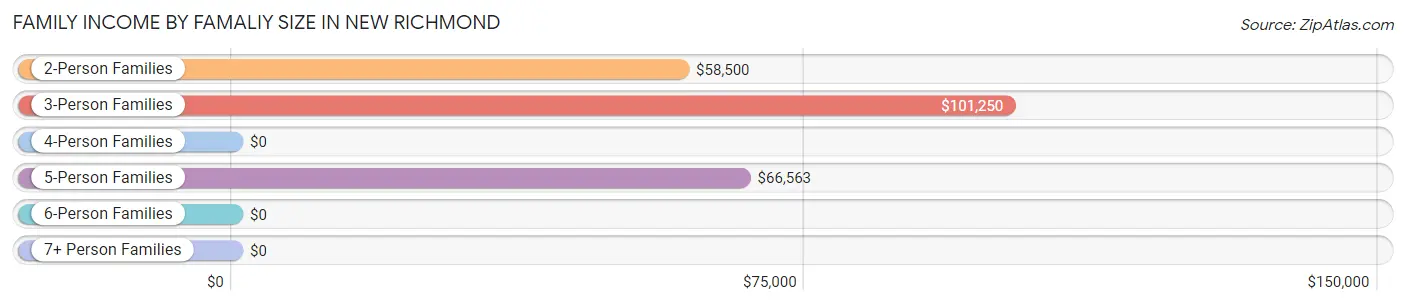
Family Income by Famaliy Size in New Richmond
3-person families (20 | 18.9%) account for the highest median family income in New Richmond with $101,250 per family, while 3-person families (20 | 18.9%) have the highest median income of $33,750 per family member.
| Income Bracket | # Families | Median Income |
| 2-Person Families | 36 (34.0%) | $58,500 |
| 3-Person Families | 20 (18.9%) | $101,250 |
| 4-Person Families | 5 (4.7%) | $0 |
| 5-Person Families | 9 (8.5%) | $66,563 |
| 6-Person Families | 0 (0.0%) | $0 |
| 7+ Person Families | 36 (34.0%) | $0 |
| Total | 106 (100.0%) | $76,143 |
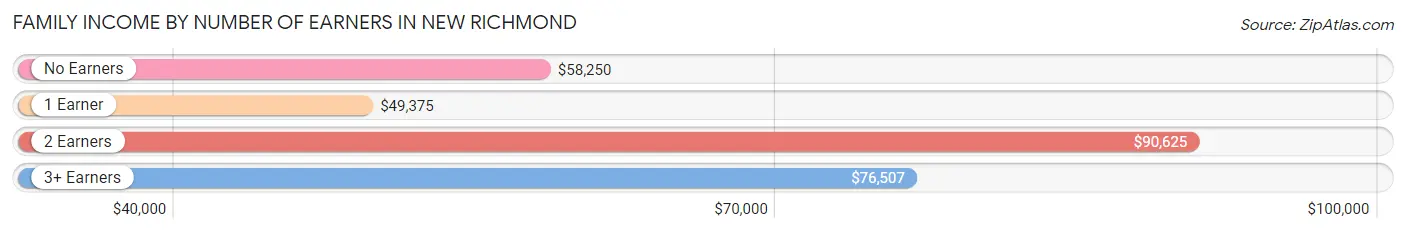
Family Income by Number of Earners in New Richmond
The median family income in New Richmond is $76,143, with families comprising 2 earners (27) having the highest median family income of $90,625, while families with 1 earner (27) have the lowest median family income of $49,375, accounting for 25.5% and 25.5% of families, respectively.
| Number of Earners | # Families | Median Income |
| No Earners | 11 (10.4%) | $58,250 |
| 1 Earner | 27 (25.5%) | $49,375 |
| 2 Earners | 27 (25.5%) | $90,625 |
| 3+ Earners | 41 (38.7%) | $76,507 |
| Total | 106 (100.0%) | $76,143 |
Household Income in New Richmond
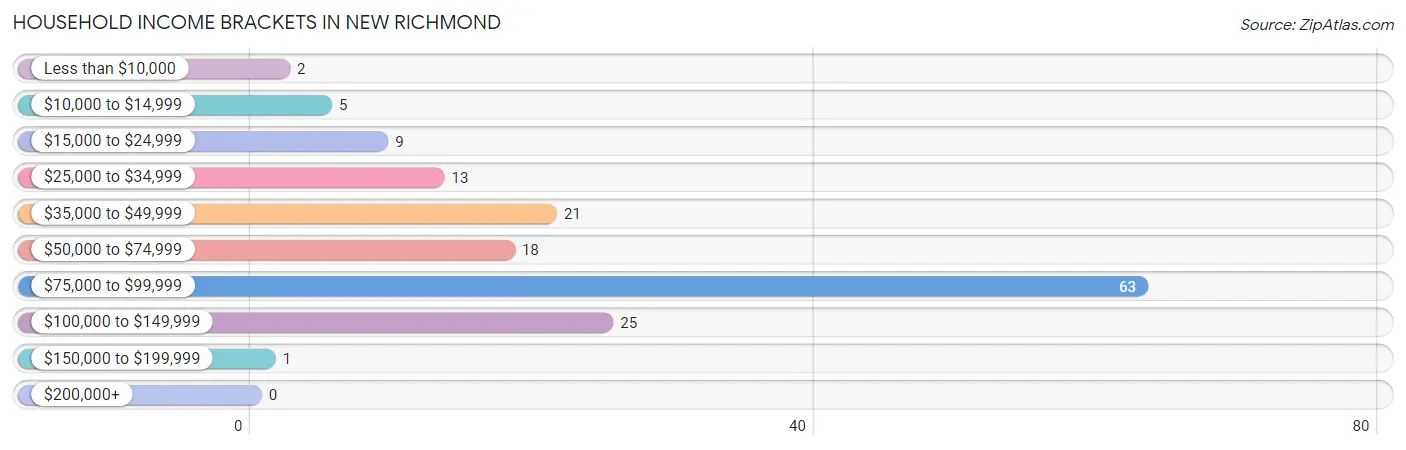
Household Income Brackets in New Richmond
With 63 households falling in the category, the $75,000 to $99,999 income range is the most frequent in New Richmond, accounting for 40.1% of all households.
| Income Bracket | # Households | % Households |
| Less than $10,000 | 2 | 1.3% |
| $10,000 to $14,999 | 5 | 3.2% |
| $15,000 to $24,999 | 9 | 5.7% |
| $25,000 to $34,999 | 13 | 8.3% |
| $35,000 to $49,999 | 21 | 13.4% |
| $50,000 to $74,999 | 18 | 11.5% |
| $75,000 to $99,999 | 63 | 40.1% |
| $100,000 to $149,999 | 25 | 15.9% |
| $150,000 to $199,999 | 1 | 0.6% |
| $200,000+ | 0 | 0.0% |
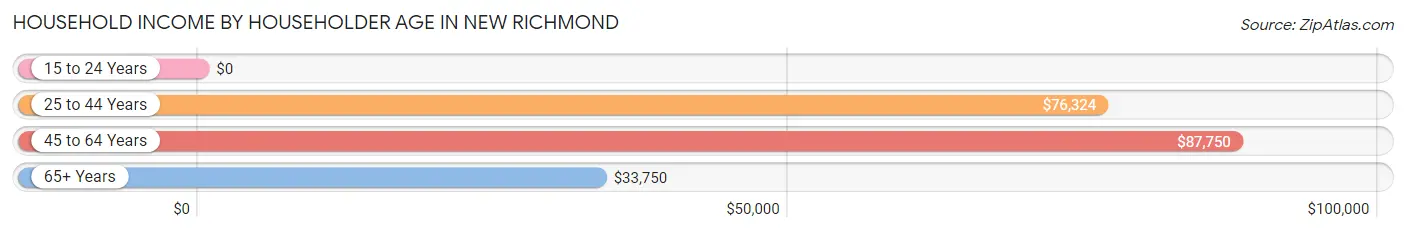
Household Income by Householder Age in New Richmond
The median household income in New Richmond is $75,750, with the highest median household income of $87,750 found in the 45 to 64 years age bracket for the primary householder. A total of 58 households (36.9%) fall into this category. Meanwhile, the 15 to 24 years age bracket for the primary householder has the lowest median household income of $0, with 1 households (0.6%) in this group.
| Income Bracket | # Households | Median Income |
| 15 to 24 Years | 1 (0.6%) | $0 |
| 25 to 44 Years | 62 (39.5%) | $76,324 |
| 45 to 64 Years | 58 (36.9%) | $87,750 |
| 65+ Years | 36 (22.9%) | $33,750 |
| Total | 157 (100.0%) | $75,750 |
Poverty in New Richmond
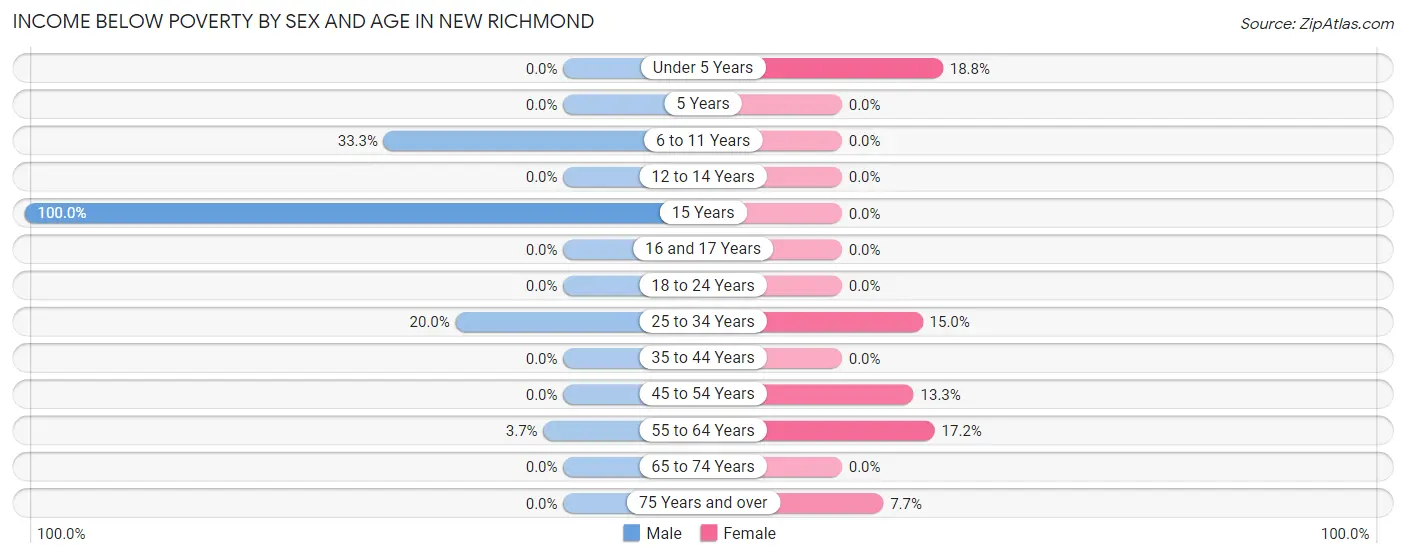
Income Below Poverty by Sex and Age in New Richmond
With 4.6% poverty level for males and 6.6% for females among the residents of New Richmond, 15 year old males and under 5 year old females are the most vulnerable to poverty, with 1 males (100.0%) and 3 females (18.8%) in their respective age groups living below the poverty level.
| Age Bracket | Male | Female |
| Under 5 Years | 0 (0.0%) | 3 (18.8%) |
| 5 Years | 0 (0.0%) | 0 (0.0%) |
| 6 to 11 Years | 5 (33.3%) | 0 (0.0%) |
| 12 to 14 Years | 0 (0.0%) | 0 (0.0%) |
| 15 Years | 1 (100.0%) | 0 (0.0%) |
| 16 and 17 Years | 0 (0.0%) | 0 (0.0%) |
| 18 to 24 Years | 0 (0.0%) | 0 (0.0%) |
| 25 to 34 Years | 2 (20.0%) | 3 (15.0%) |
| 35 to 44 Years | 0 (0.0%) | 0 (0.0%) |
| 45 to 54 Years | 0 (0.0%) | 2 (13.3%) |
| 55 to 64 Years | 1 (3.7%) | 5 (17.2%) |
| 65 to 74 Years | 0 (0.0%) | 0 (0.0%) |
| 75 Years and over | 0 (0.0%) | 1 (7.7%) |
| Total | 9 (4.6%) | 14 (6.6%) |
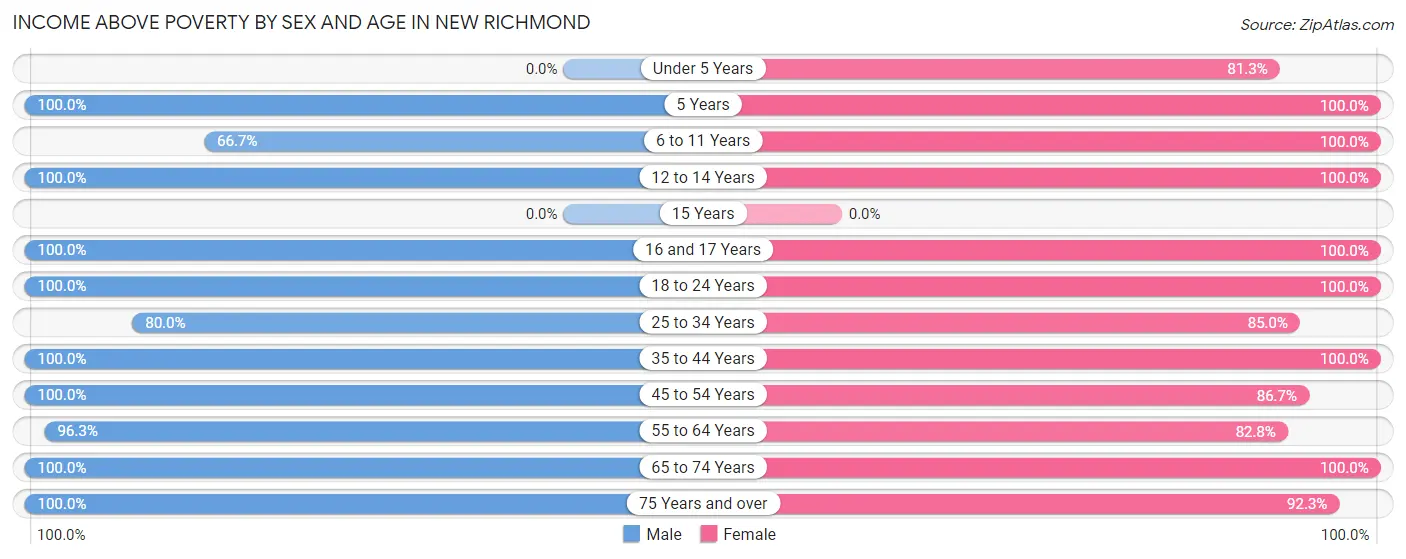
Income Above Poverty by Sex and Age in New Richmond
According to the poverty statistics in New Richmond, males aged 5 years and females aged 5 years are the age groups that are most secure financially, with 100.0% of males and 100.0% of females in these age groups living above the poverty line.
| Age Bracket | Male | Female |
| Under 5 Years | 0 (0.0%) | 13 (81.2%) |
| 5 Years | 1 (100.0%) | 1 (100.0%) |
| 6 to 11 Years | 10 (66.7%) | 34 (100.0%) |
| 12 to 14 Years | 19 (100.0%) | 3 (100.0%) |
| 15 Years | 0 (0.0%) | 0 (0.0%) |
| 16 and 17 Years | 26 (100.0%) | 1 (100.0%) |
| 18 to 24 Years | 32 (100.0%) | 5 (100.0%) |
| 25 to 34 Years | 8 (80.0%) | 17 (85.0%) |
| 35 to 44 Years | 30 (100.0%) | 46 (100.0%) |
| 45 to 54 Years | 15 (100.0%) | 13 (86.7%) |
| 55 to 64 Years | 26 (96.3%) | 24 (82.8%) |
| 65 to 74 Years | 8 (100.0%) | 28 (100.0%) |
| 75 Years and over | 12 (100.0%) | 12 (92.3%) |
| Total | 187 (95.4%) | 197 (93.4%) |
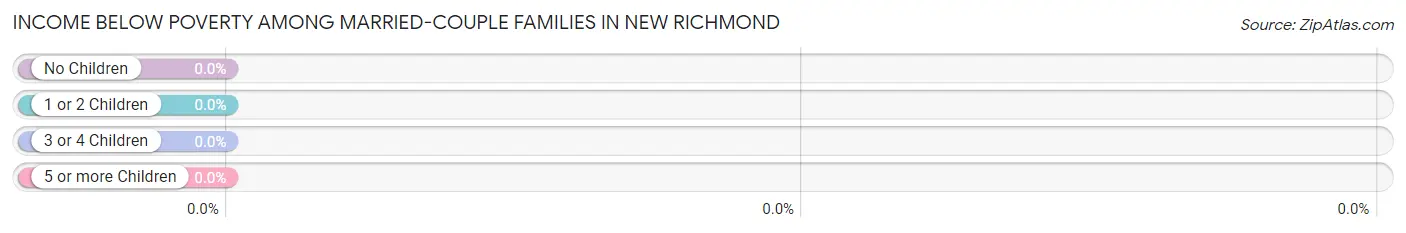
Income Below Poverty Among Married-Couple Families in New Richmond
| Children | Above Poverty | Below Poverty |
| No Children | 30 (100.0%) | 0 (0.0%) |
| 1 or 2 Children | 12 (100.0%) | 0 (0.0%) |
| 3 or 4 Children | 41 (100.0%) | 0 (0.0%) |
| 5 or more Children | 0 (0.0%) | 0 (0.0%) |
| Total | 83 (100.0%) | 0 (0.0%) |
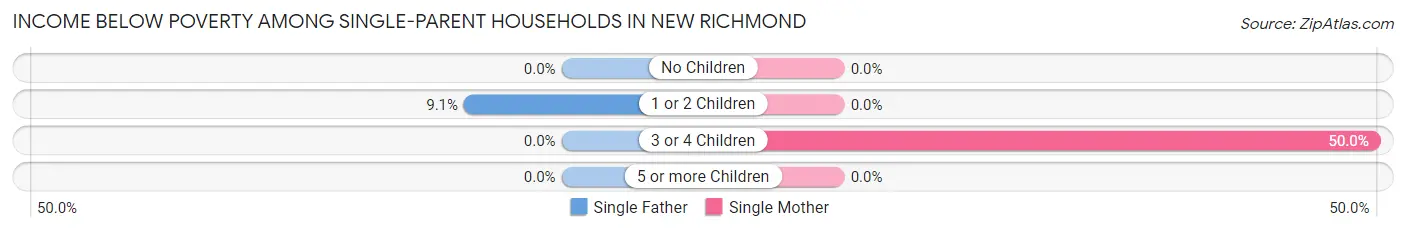
Income Below Poverty Among Single-Parent Households in New Richmond
According to the poverty data in New Richmond, 5.9% or 1 single-father households and 33.3% or 2 single-mother households are living below the poverty line. Among single-father households, those with 1 or 2 children have the highest poverty rate, with 1 households (9.1%) experiencing poverty. Likewise, among single-mother households, those with 3 or 4 children have the highest poverty rate, with 2 households (50.0%) falling below the poverty line.
| Children | Single Father | Single Mother |
| No Children | 0 (0.0%) | 0 (0.0%) |
| 1 or 2 Children | 1 (9.1%) | 0 (0.0%) |
| 3 or 4 Children | 0 (0.0%) | 2 (50.0%) |
| 5 or more Children | 0 (0.0%) | 0 (0.0%) |
| Total | 1 (5.9%) | 2 (33.3%) |
Income Below Poverty Among Married-Couple vs Single-Parent Households in New Richmond
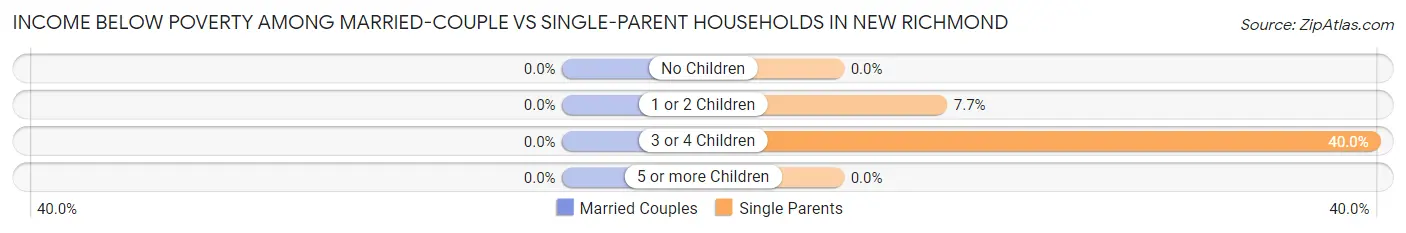
| Children | Married-Couple Families | Single-Parent Households |
| No Children | 0 (0.0%) | 0 (0.0%) |
| 1 or 2 Children | 0 (0.0%) | 1 (7.7%) |
| 3 or 4 Children | 0 (0.0%) | 2 (40.0%) |
| 5 or more Children | 0 (0.0%) | 0 (0.0%) |
| Total | 0 (0.0%) | 3 (13.0%) |
Employment Characteristics in New Richmond
Employment by Class of Employer in New Richmond
Among the 148 employed individuals in New Richmond, private company employees (123 | 83.1%), not-for-profit organizations (8 | 5.4%), and self-employed (incorporated) (6 | 4.1%) make up the most common classes of employment.
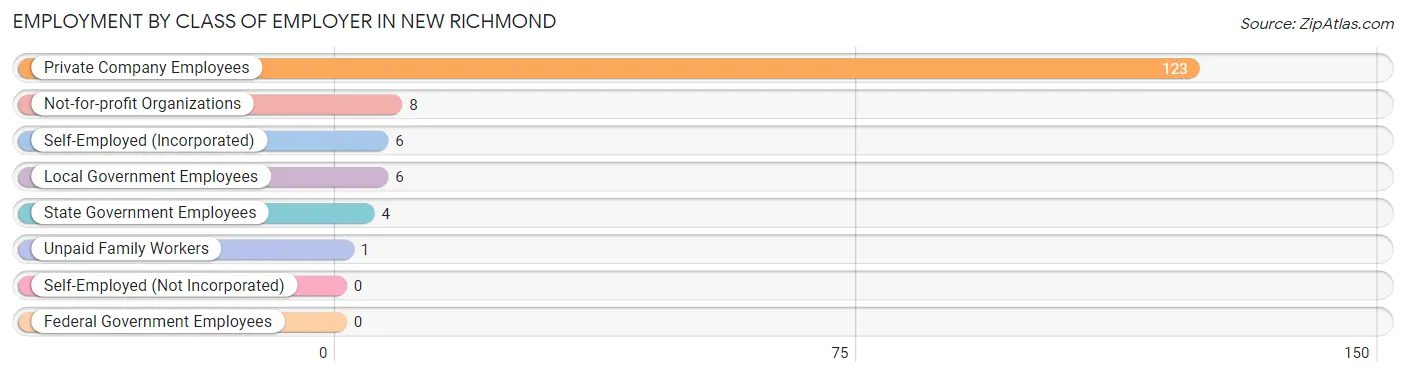
| Employer Class | # Employees | % Employees |
| Private Company Employees | 123 | 83.1% |
| Self-Employed (Incorporated) | 6 | 4.1% |
| Self-Employed (Not Incorporated) | 0 | 0.0% |
| Not-for-profit Organizations | 8 | 5.4% |
| Local Government Employees | 6 | 4.1% |
| State Government Employees | 4 | 2.7% |
| Federal Government Employees | 0 | 0.0% |
| Unpaid Family Workers | 1 | 0.7% |
| Total | 148 | 100.0% |
Employment Status by Age in New Richmond
According to the labor force statistics for New Richmond, out of the total population over 16 years of age (317), 55.2% or 175 individuals are in the labor force, with 4.6% or 8 of them unemployed. The age group with the highest labor force participation rate is 20 to 24 years, with 100.0% or 4 individuals in the labor force. Within the labor force, the 30 to 34 years age range has the highest percentage of unemployed individuals, with 33.3% or 1 of them being unemployed.
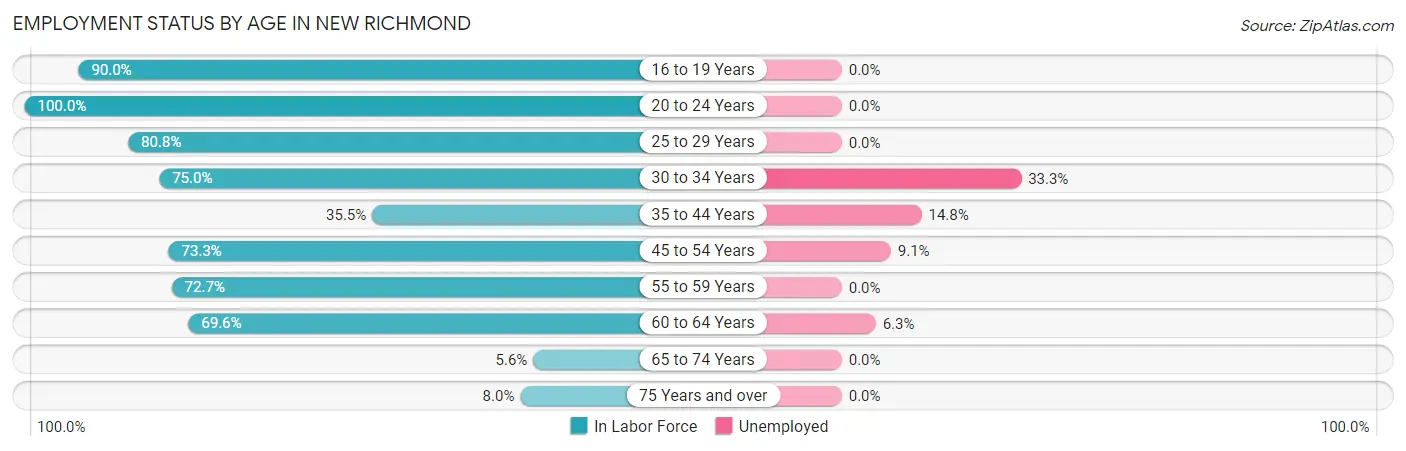
| Age Bracket | In Labor Force | Unemployed |
| 16 to 19 Years | 54 (90.0%) | 0 (0.0%) |
| 20 to 24 Years | 4 (100.0%) | 0 (0.0%) |
| 25 to 29 Years | 21 (80.8%) | 0 (0.0%) |
| 30 to 34 Years | 3 (75.0%) | 1 (33.3%) |
| 35 to 44 Years | 27 (35.5%) | 4 (14.8%) |
| 45 to 54 Years | 22 (73.3%) | 2 (9.1%) |
| 55 to 59 Years | 24 (72.7%) | 0 (0.0%) |
| 60 to 64 Years | 16 (69.6%) | 1 (6.3%) |
| 65 to 74 Years | 2 (5.6%) | 0 (0.0%) |
| 75 Years and over | 2 (8.0%) | 0 (0.0%) |
| Total | 175 (55.2%) | 8 (4.6%) |
Employment Status by Educational Attainment in New Richmond
According to labor force statistics for New Richmond, 58.9% of individuals (113) out of the total population between 25 and 64 years of age (192) are in the labor force, with 7.1% or 8 of them being unemployed. The group with the highest labor force participation rate are those with the educational attainment of bachelor's degree or higher, with 85.2% or 23 individuals in the labor force. Within the labor force, individuals with less than high school education have the highest percentage of unemployment, with 28.6% or 2 of them being unemployed.
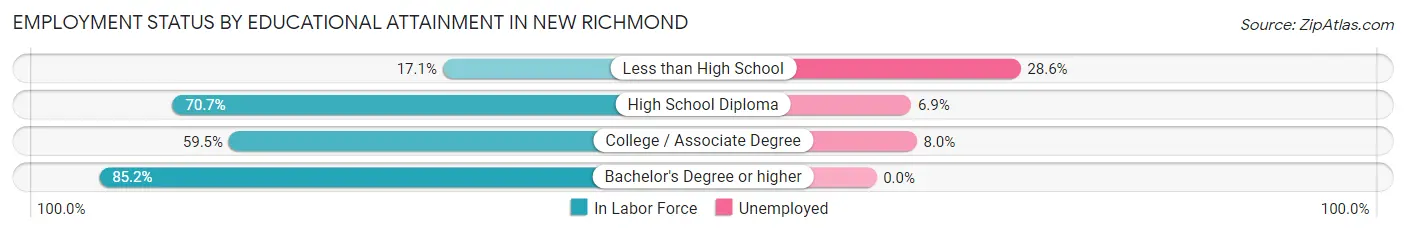
| Educational Attainment | In Labor Force | Unemployed |
| Less than High School | 7 (17.1%) | 12 (28.6%) |
| High School Diploma | 58 (70.7%) | 6 (6.9%) |
| College / Associate Degree | 25 (59.5%) | 3 (8.0%) |
| Bachelor's Degree or higher | 23 (85.2%) | 0 (0.0%) |
| Total | 113 (58.9%) | 14 (7.1%) |
Employment Occupations by Sex in New Richmond
Management, Business, Science and Arts Occupations
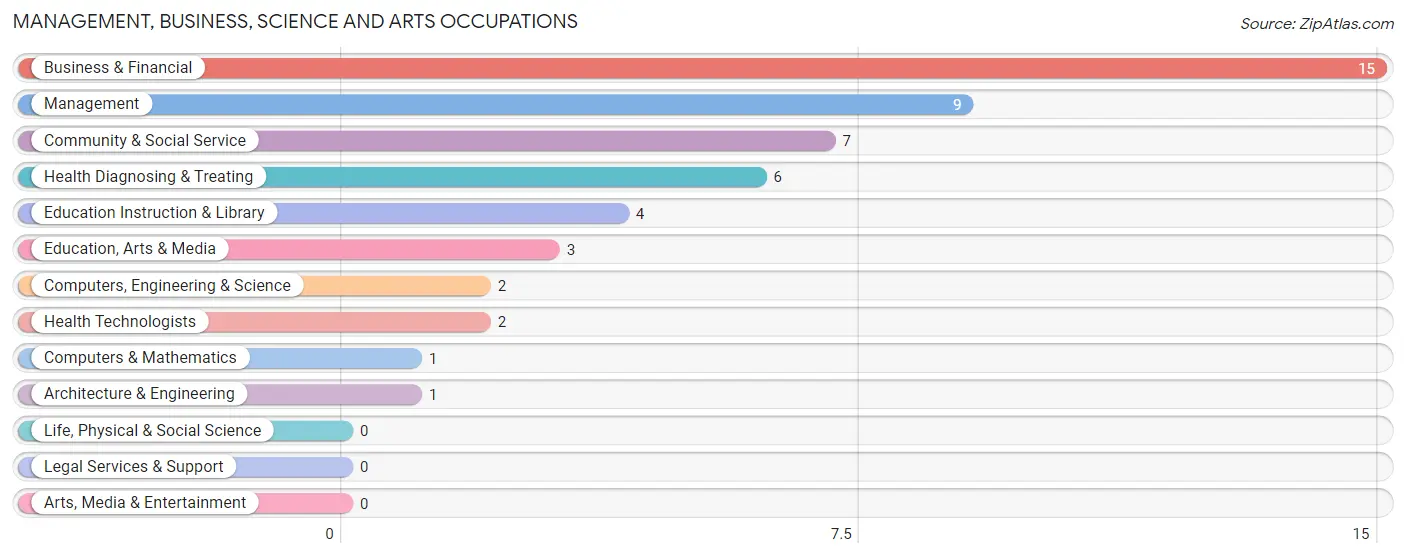
The most common Management, Business, Science and Arts occupations in New Richmond are Business & Financial (15 | 9.0%), Management (9 | 5.4%), Community & Social Service (7 | 4.2%), Health Diagnosing & Treating (6 | 3.6%), and Education Instruction & Library (4 | 2.4%).
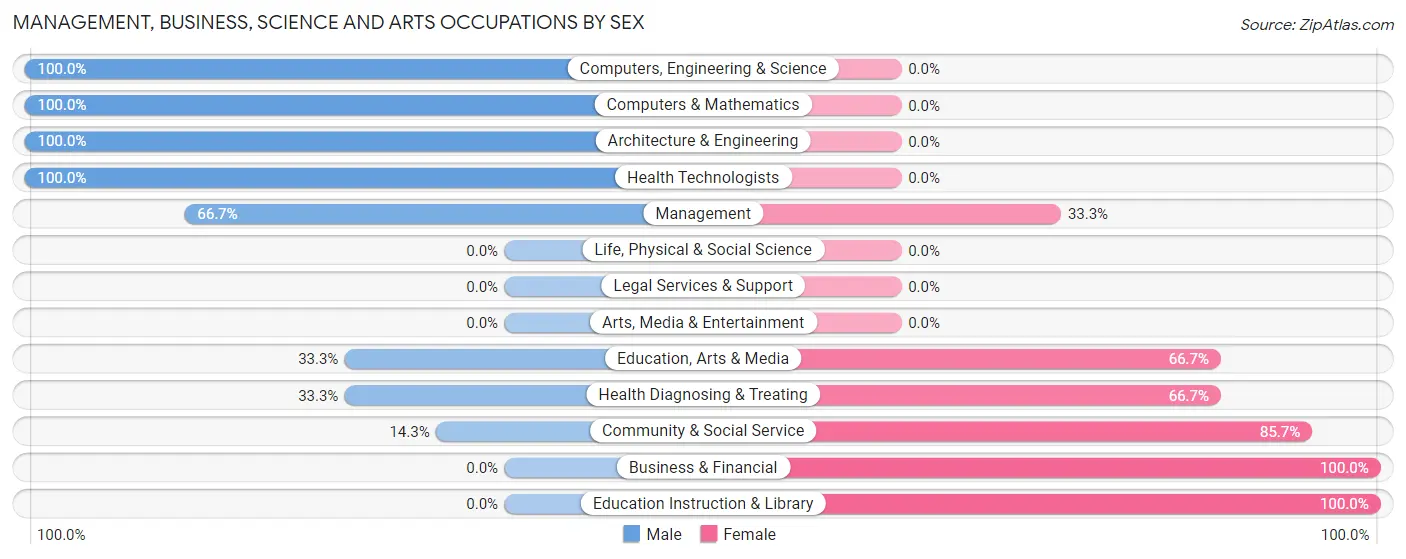
Management, Business, Science and Arts Occupations by Sex
Within the Management, Business, Science and Arts occupations in New Richmond, the most male-oriented occupations are Computers, Engineering & Science (100.0%), Computers & Mathematics (100.0%), and Architecture & Engineering (100.0%), while the most female-oriented occupations are Business & Financial (100.0%), Education Instruction & Library (100.0%), and Community & Social Service (85.7%).
| Occupation | Male | Female |
| Management | 6 (66.7%) | 3 (33.3%) |
| Business & Financial | 0 (0.0%) | 15 (100.0%) |
| Computers, Engineering & Science | 2 (100.0%) | 0 (0.0%) |
| Computers & Mathematics | 1 (100.0%) | 0 (0.0%) |
| Architecture & Engineering | 1 (100.0%) | 0 (0.0%) |
| Life, Physical & Social Science | 0 (0.0%) | 0 (0.0%) |
| Community & Social Service | 1 (14.3%) | 6 (85.7%) |
| Education, Arts & Media | 1 (33.3%) | 2 (66.7%) |
| Legal Services & Support | 0 (0.0%) | 0 (0.0%) |
| Education Instruction & Library | 0 (0.0%) | 4 (100.0%) |
| Arts, Media & Entertainment | 0 (0.0%) | 0 (0.0%) |
| Health Diagnosing & Treating | 2 (33.3%) | 4 (66.7%) |
| Health Technologists | 2 (100.0%) | 0 (0.0%) |
| Total (Category) | 11 (28.2%) | 28 (71.8%) |
| Total (Overall) | 110 (65.9%) | 57 (34.1%) |
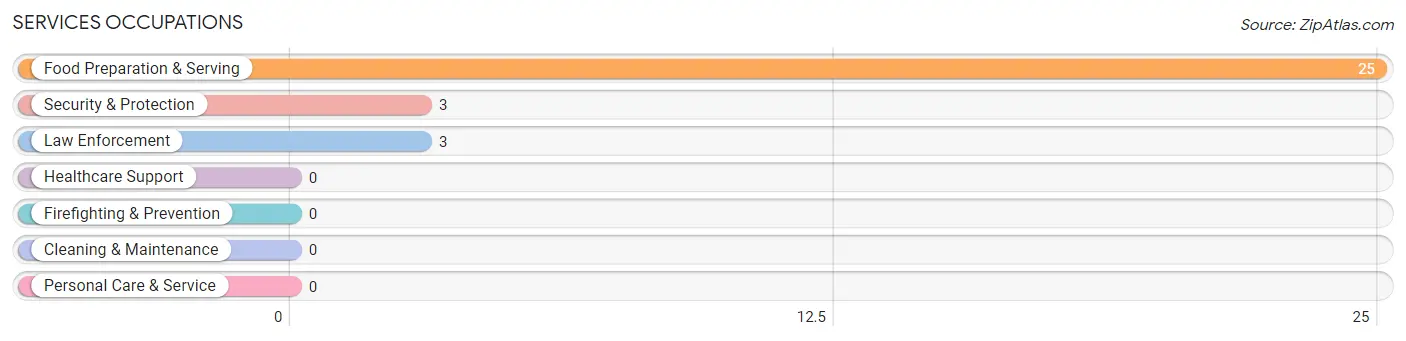
Services Occupations
The most common Services occupations in New Richmond are Food Preparation & Serving (25 | 15.0%), Security & Protection (3 | 1.8%), and Law Enforcement (3 | 1.8%).
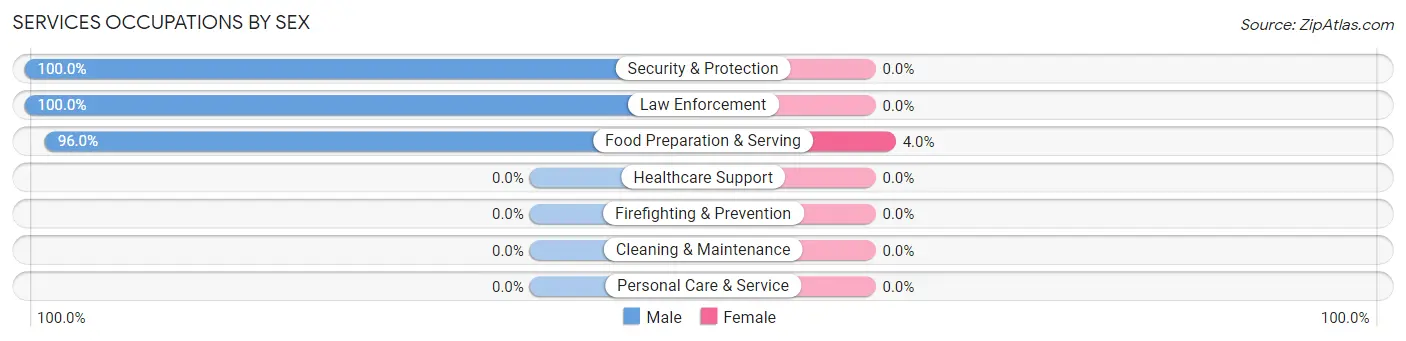
Services Occupations by Sex
| Occupation | Male | Female |
| Healthcare Support | 0 (0.0%) | 0 (0.0%) |
| Security & Protection | 3 (100.0%) | 0 (0.0%) |
| Firefighting & Prevention | 0 (0.0%) | 0 (0.0%) |
| Law Enforcement | 3 (100.0%) | 0 (0.0%) |
| Food Preparation & Serving | 24 (96.0%) | 1 (4.0%) |
| Cleaning & Maintenance | 0 (0.0%) | 0 (0.0%) |
| Personal Care & Service | 0 (0.0%) | 0 (0.0%) |
| Total (Category) | 27 (96.4%) | 1 (3.6%) |
| Total (Overall) | 110 (65.9%) | 57 (34.1%) |
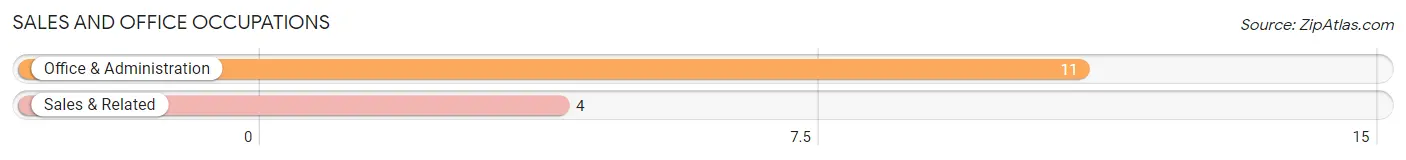
Sales and Office Occupations
The most common Sales and Office occupations in New Richmond are Office & Administration (11 | 6.6%), and Sales & Related (4 | 2.4%).
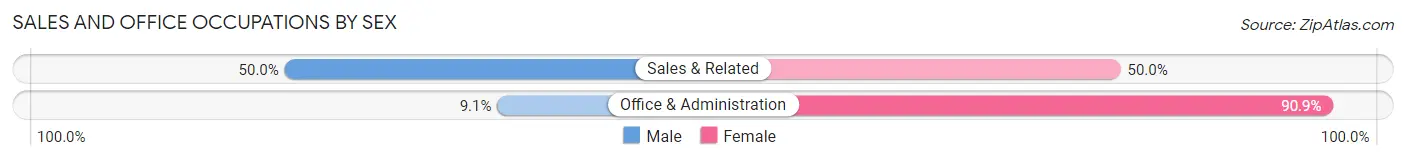
Sales and Office Occupations by Sex
| Occupation | Male | Female |
| Sales & Related | 2 (50.0%) | 2 (50.0%) |
| Office & Administration | 1 (9.1%) | 10 (90.9%) |
| Total (Category) | 3 (20.0%) | 12 (80.0%) |
| Total (Overall) | 110 (65.9%) | 57 (34.1%) |
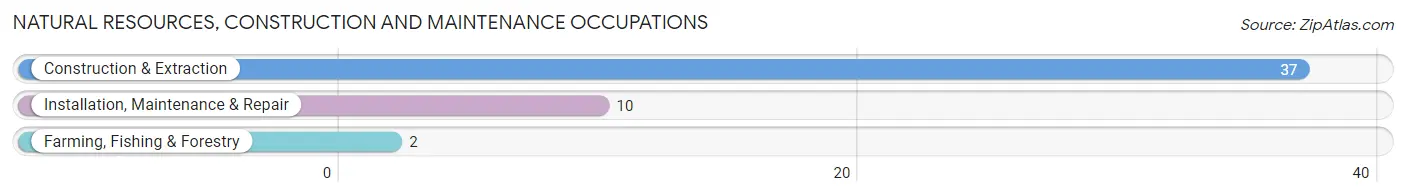
Natural Resources, Construction and Maintenance Occupations
The most common Natural Resources, Construction and Maintenance occupations in New Richmond are Construction & Extraction (37 | 22.2%), Installation, Maintenance & Repair (10 | 6.0%), and Farming, Fishing & Forestry (2 | 1.2%).
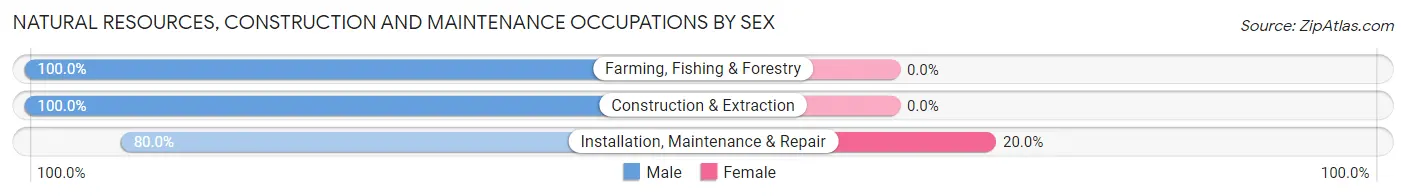
Natural Resources, Construction and Maintenance Occupations by Sex
| Occupation | Male | Female |
| Farming, Fishing & Forestry | 2 (100.0%) | 0 (0.0%) |
| Construction & Extraction | 37 (100.0%) | 0 (0.0%) |
| Installation, Maintenance & Repair | 8 (80.0%) | 2 (20.0%) |
| Total (Category) | 47 (95.9%) | 2 (4.1%) |
| Total (Overall) | 110 (65.9%) | 57 (34.1%) |
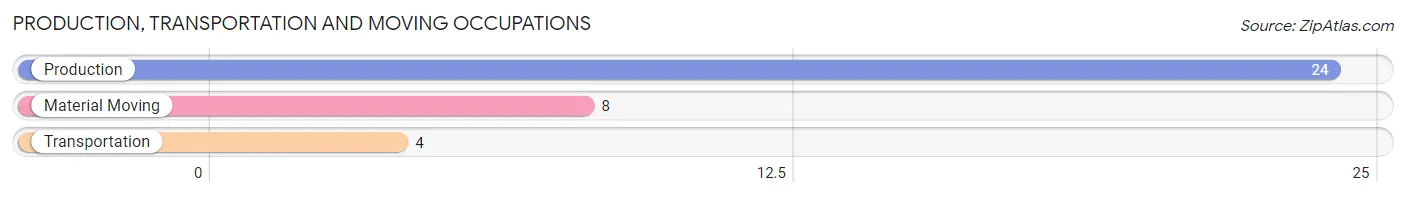
Production, Transportation and Moving Occupations
The most common Production, Transportation and Moving occupations in New Richmond are Production (24 | 14.4%), Material Moving (8 | 4.8%), and Transportation (4 | 2.4%).
Production, Transportation and Moving Occupations by Sex
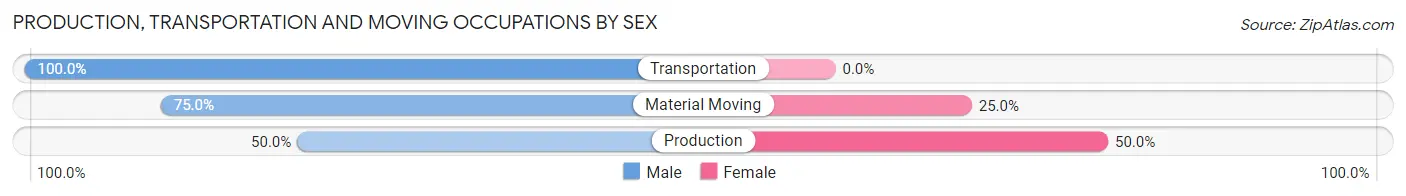
| Occupation | Male | Female |
| Production | 12 (50.0%) | 12 (50.0%) |
| Transportation | 4 (100.0%) | 0 (0.0%) |
| Material Moving | 6 (75.0%) | 2 (25.0%) |
| Total (Category) | 22 (61.1%) | 14 (38.9%) |
| Total (Overall) | 110 (65.9%) | 57 (34.1%) |
Employment Industries by Sex in New Richmond
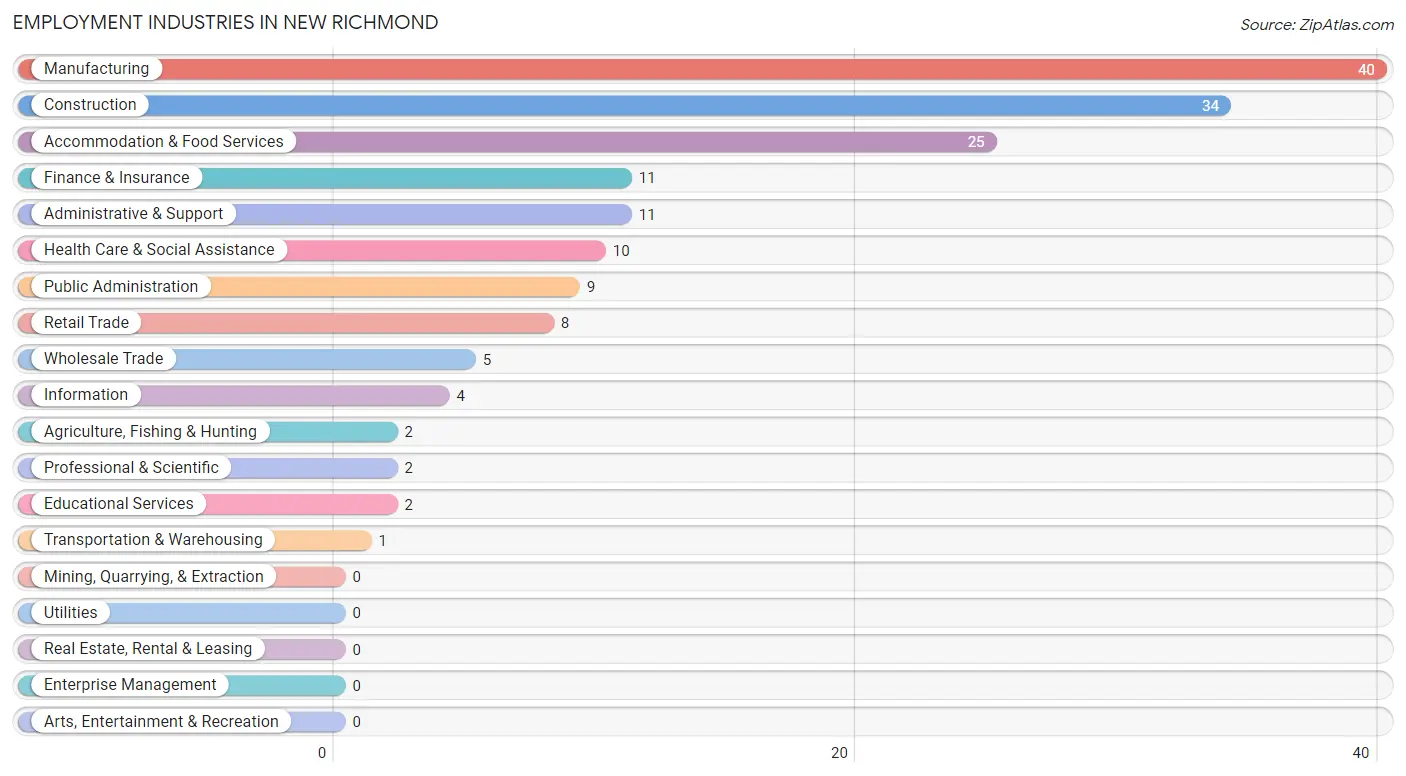
Employment Industries in New Richmond
The major employment industries in New Richmond include Manufacturing (40 | 23.9%), Construction (34 | 20.4%), Accommodation & Food Services (25 | 15.0%), Finance & Insurance (11 | 6.6%), and Administrative & Support (11 | 6.6%).
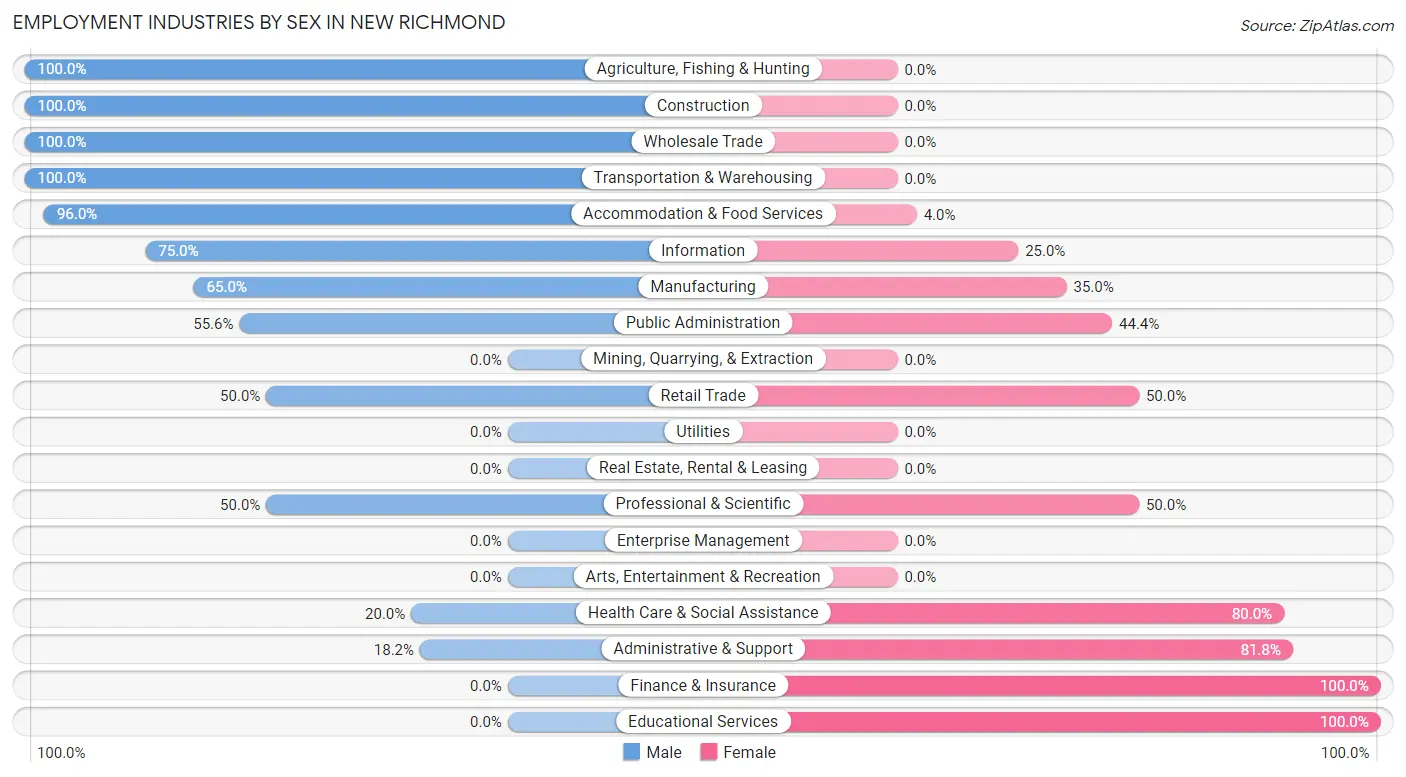
Employment Industries by Sex in New Richmond
The New Richmond industries that see more men than women are Agriculture, Fishing & Hunting (100.0%), Construction (100.0%), and Wholesale Trade (100.0%), whereas the industries that tend to have a higher number of women are Finance & Insurance (100.0%), Educational Services (100.0%), and Administrative & Support (81.8%).
| Industry | Male | Female |
| Agriculture, Fishing & Hunting | 2 (100.0%) | 0 (0.0%) |
| Mining, Quarrying, & Extraction | 0 (0.0%) | 0 (0.0%) |
| Construction | 34 (100.0%) | 0 (0.0%) |
| Manufacturing | 26 (65.0%) | 14 (35.0%) |
| Wholesale Trade | 5 (100.0%) | 0 (0.0%) |
| Retail Trade | 4 (50.0%) | 4 (50.0%) |
| Transportation & Warehousing | 1 (100.0%) | 0 (0.0%) |
| Utilities | 0 (0.0%) | 0 (0.0%) |
| Information | 3 (75.0%) | 1 (25.0%) |
| Finance & Insurance | 0 (0.0%) | 11 (100.0%) |
| Real Estate, Rental & Leasing | 0 (0.0%) | 0 (0.0%) |
| Professional & Scientific | 1 (50.0%) | 1 (50.0%) |
| Enterprise Management | 0 (0.0%) | 0 (0.0%) |
| Administrative & Support | 2 (18.2%) | 9 (81.8%) |
| Educational Services | 0 (0.0%) | 2 (100.0%) |
| Health Care & Social Assistance | 2 (20.0%) | 8 (80.0%) |
| Arts, Entertainment & Recreation | 0 (0.0%) | 0 (0.0%) |
| Accommodation & Food Services | 24 (96.0%) | 1 (4.0%) |
| Public Administration | 5 (55.6%) | 4 (44.4%) |
| Total | 110 (65.9%) | 57 (34.1%) |
Education in New Richmond
School Enrollment in New Richmond
The most common levels of schooling among the 107 students in New Richmond are elementary school (40 | 37.4%), middle school (30 | 28.0%), and high school (28 | 26.2%).
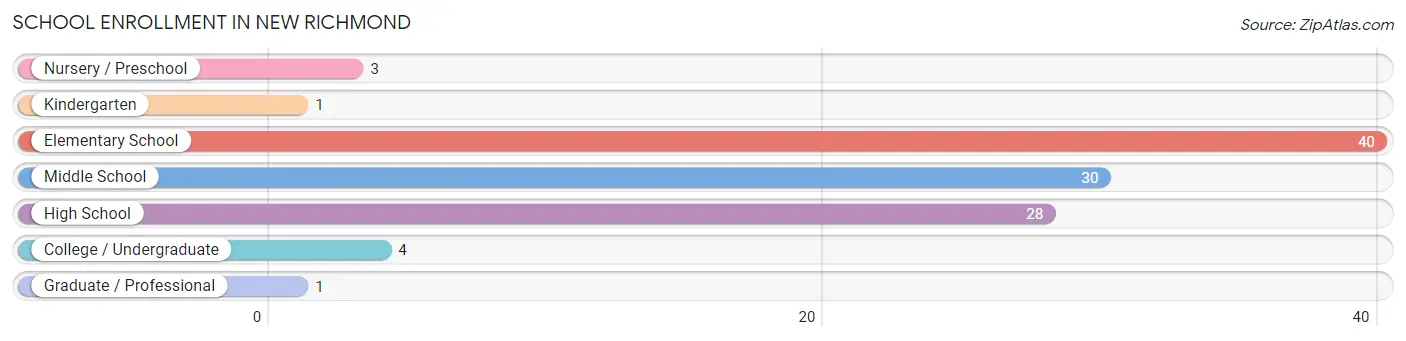
| School Level | # Students | % Students |
| Nursery / Preschool | 3 | 2.8% |
| Kindergarten | 1 | 0.9% |
| Elementary School | 40 | 37.4% |
| Middle School | 30 | 28.0% |
| High School | 28 | 26.2% |
| College / Undergraduate | 4 | 3.7% |
| Graduate / Professional | 1 | 0.9% |
| Total | 107 | 100.0% |
School Enrollment by Age by Funding Source in New Richmond
Out of a total of 107 students who are enrolled in schools in New Richmond, 10 (9.3%) attend a private institution, while the remaining 97 (90.7%) are enrolled in public schools. The age group of 10 to 14 year olds has the highest likelihood of being enrolled in private schools, with 6 (19.4% in the age bracket) enrolled. Conversely, the age group of 3 to 4 year olds has the lowest likelihood of being enrolled in a private school, with 1 (100.0% in the age bracket) attending a public institution.
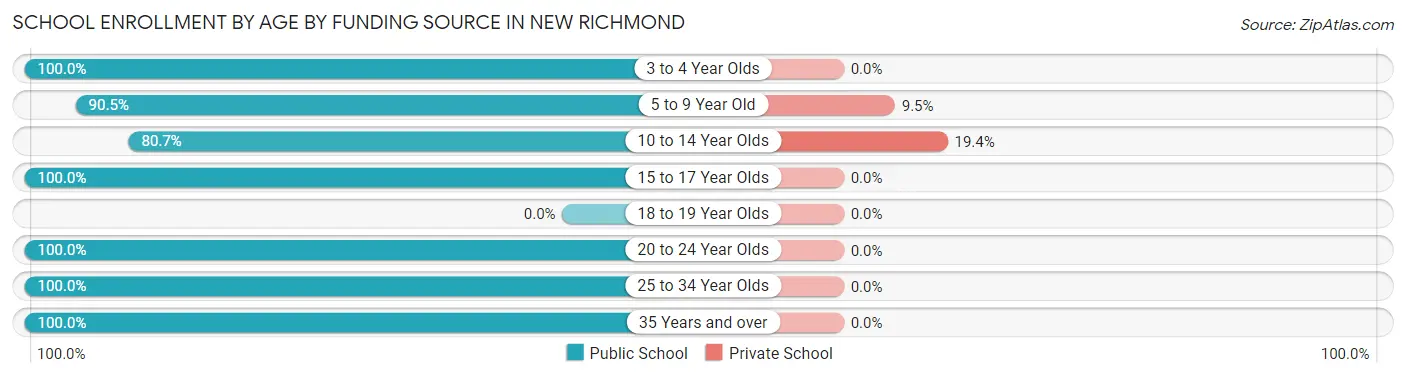
| Age Bracket | Public School | Private School |
| 3 to 4 Year Olds | 1 (100.0%) | 0 (0.0%) |
| 5 to 9 Year Old | 38 (90.5%) | 4 (9.5%) |
| 10 to 14 Year Olds | 25 (80.6%) | 6 (19.4%) |
| 15 to 17 Year Olds | 28 (100.0%) | 0 (0.0%) |
| 18 to 19 Year Olds | 0 (0.0%) | 0 (0.0%) |
| 20 to 24 Year Olds | 2 (100.0%) | 0 (0.0%) |
| 25 to 34 Year Olds | 2 (100.0%) | 0 (0.0%) |
| 35 Years and over | 1 (100.0%) | 0 (0.0%) |
| Total | 97 (90.7%) | 10 (9.3%) |
Educational Attainment by Field of Study in New Richmond
Business (12 | 38.7%), education (9 | 29.0%), bio, nature & agricultural (3 | 9.7%), liberal arts & history (3 | 9.7%), and arts & humanities (3 | 9.7%) are the most common fields of study among 31 individuals in New Richmond who have obtained a bachelor's degree or higher.
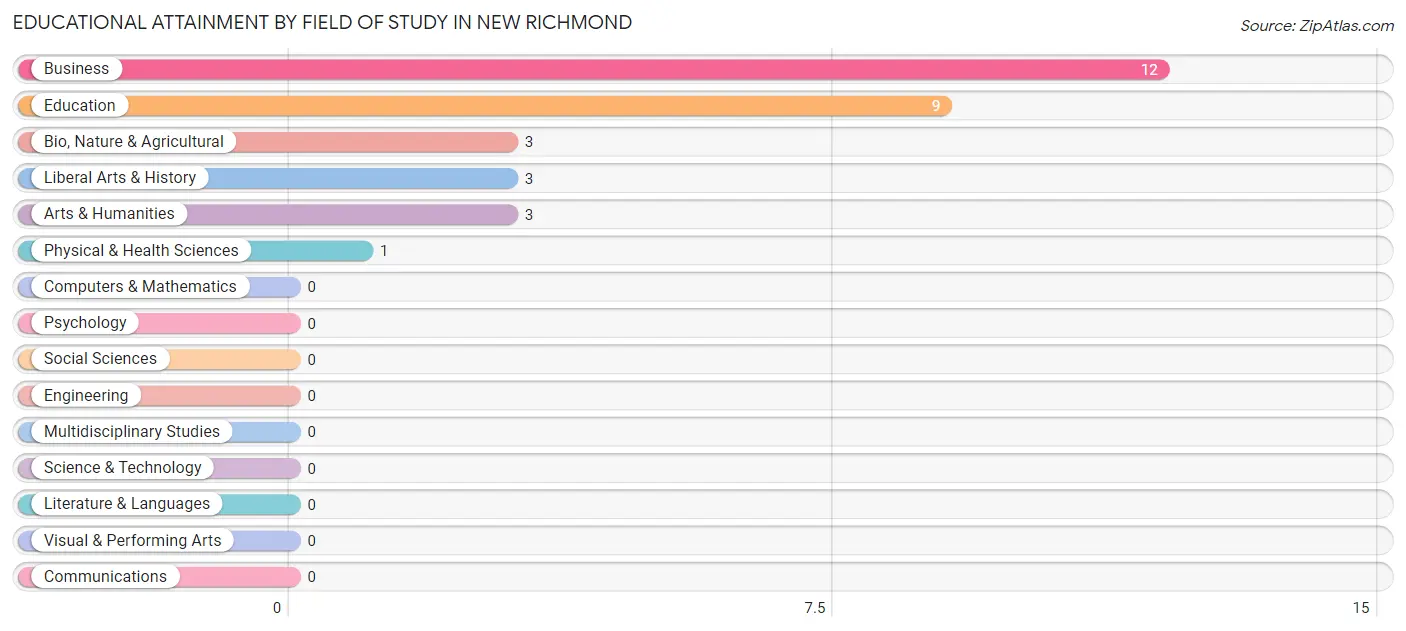
| Field of Study | # Graduates | % Graduates |
| Computers & Mathematics | 0 | 0.0% |
| Bio, Nature & Agricultural | 3 | 9.7% |
| Physical & Health Sciences | 1 | 3.2% |
| Psychology | 0 | 0.0% |
| Social Sciences | 0 | 0.0% |
| Engineering | 0 | 0.0% |
| Multidisciplinary Studies | 0 | 0.0% |
| Science & Technology | 0 | 0.0% |
| Business | 12 | 38.7% |
| Education | 9 | 29.0% |
| Literature & Languages | 0 | 0.0% |
| Liberal Arts & History | 3 | 9.7% |
| Visual & Performing Arts | 0 | 0.0% |
| Communications | 0 | 0.0% |
| Arts & Humanities | 3 | 9.7% |
| Total | 31 | 100.0% |
Transportation & Commute in New Richmond
Vehicle Availability by Sex in New Richmond
The most prevalent vehicle ownership categories in New Richmond are males with 3 vehicles (66, accounting for 71.0%) and females with 3 vehicles (24, making up 120.0%).

| Vehicles Available | Male | Female |
| No Vehicle | 0 (0.0%) | 0 (0.0%) |
| 1 Vehicle | 1 (1.1%) | 15 (27.3%) |
| 2 Vehicles | 17 (18.3%) | 4 (7.3%) |
| 3 Vehicles | 66 (71.0%) | 24 (43.6%) |
| 4 Vehicles | 4 (4.3%) | 6 (10.9%) |
| 5 or more Vehicles | 5 (5.4%) | 6 (10.9%) |
| Total | 93 (100.0%) | 55 (100.0%) |
Commute Time in New Richmond
The most frequently occuring commute durations in New Richmond are 35 to 39 minutes (42 commuters, 29.8%), 20 to 24 minutes (18 commuters, 12.8%), and 25 to 29 minutes (14 commuters, 9.9%).
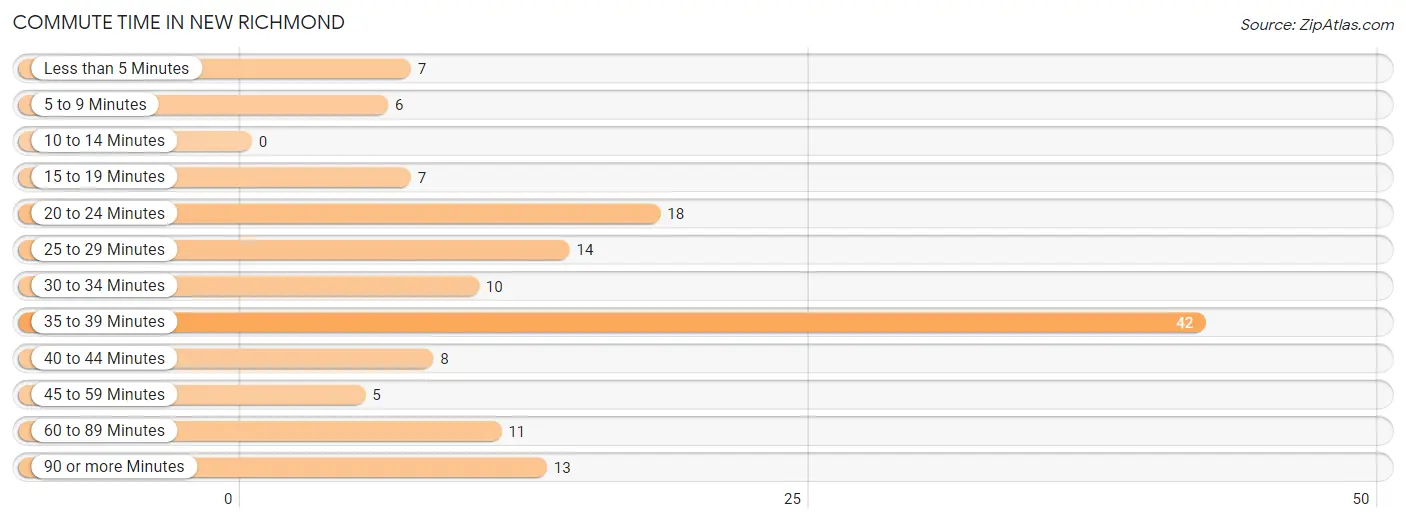
| Commute Time | # Commuters | % Commuters |
| Less than 5 Minutes | 7 | 5.0% |
| 5 to 9 Minutes | 6 | 4.3% |
| 10 to 14 Minutes | 0 | 0.0% |
| 15 to 19 Minutes | 7 | 5.0% |
| 20 to 24 Minutes | 18 | 12.8% |
| 25 to 29 Minutes | 14 | 9.9% |
| 30 to 34 Minutes | 10 | 7.1% |
| 35 to 39 Minutes | 42 | 29.8% |
| 40 to 44 Minutes | 8 | 5.7% |
| 45 to 59 Minutes | 5 | 3.5% |
| 60 to 89 Minutes | 11 | 7.8% |
| 90 or more Minutes | 13 | 9.2% |
Commute Time by Sex in New Richmond
The most common commute times in New Richmond are 35 to 39 minutes (36 commuters, 40.9%) for males and 90 or more minutes (13 commuters, 24.5%) for females.
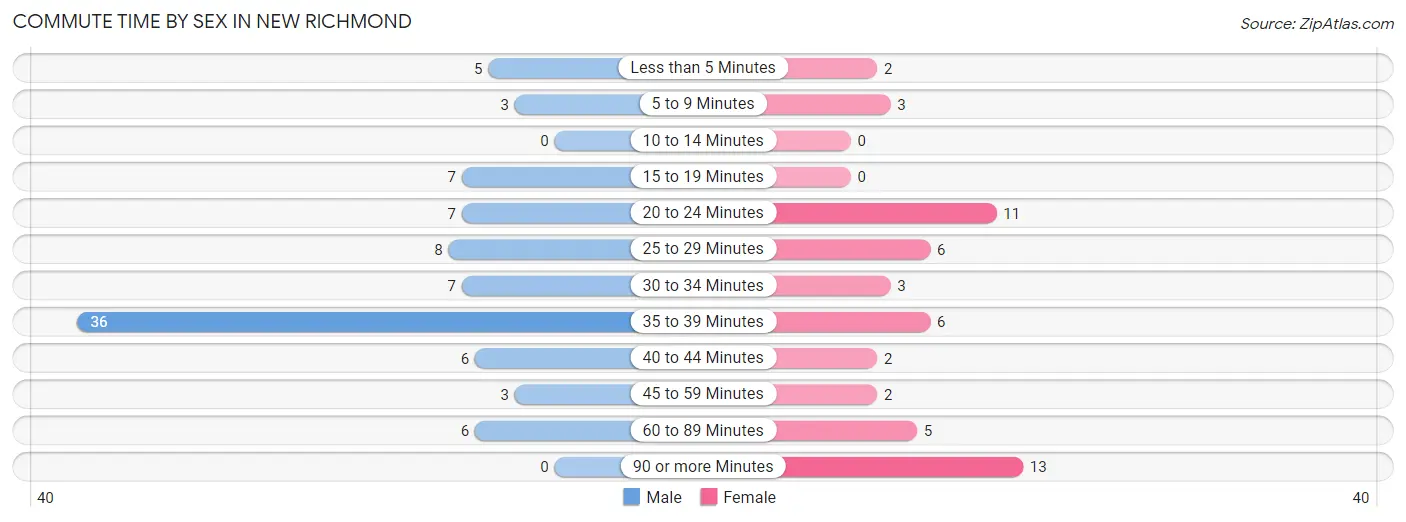
| Commute Time | Male | Female |
| Less than 5 Minutes | 5 (5.7%) | 2 (3.8%) |
| 5 to 9 Minutes | 3 (3.4%) | 3 (5.7%) |
| 10 to 14 Minutes | 0 (0.0%) | 0 (0.0%) |
| 15 to 19 Minutes | 7 (8.0%) | 0 (0.0%) |
| 20 to 24 Minutes | 7 (8.0%) | 11 (20.7%) |
| 25 to 29 Minutes | 8 (9.1%) | 6 (11.3%) |
| 30 to 34 Minutes | 7 (8.0%) | 3 (5.7%) |
| 35 to 39 Minutes | 36 (40.9%) | 6 (11.3%) |
| 40 to 44 Minutes | 6 (6.8%) | 2 (3.8%) |
| 45 to 59 Minutes | 3 (3.4%) | 2 (3.8%) |
| 60 to 89 Minutes | 6 (6.8%) | 5 (9.4%) |
| 90 or more Minutes | 0 (0.0%) | 13 (24.5%) |
Time of Departure to Work by Sex in New Richmond
The most frequent times of departure to work in New Richmond are 5:00 AM to 5:29 AM (34, 38.6%) for males and 7:30 AM to 7:59 AM (12, 22.6%) for females.
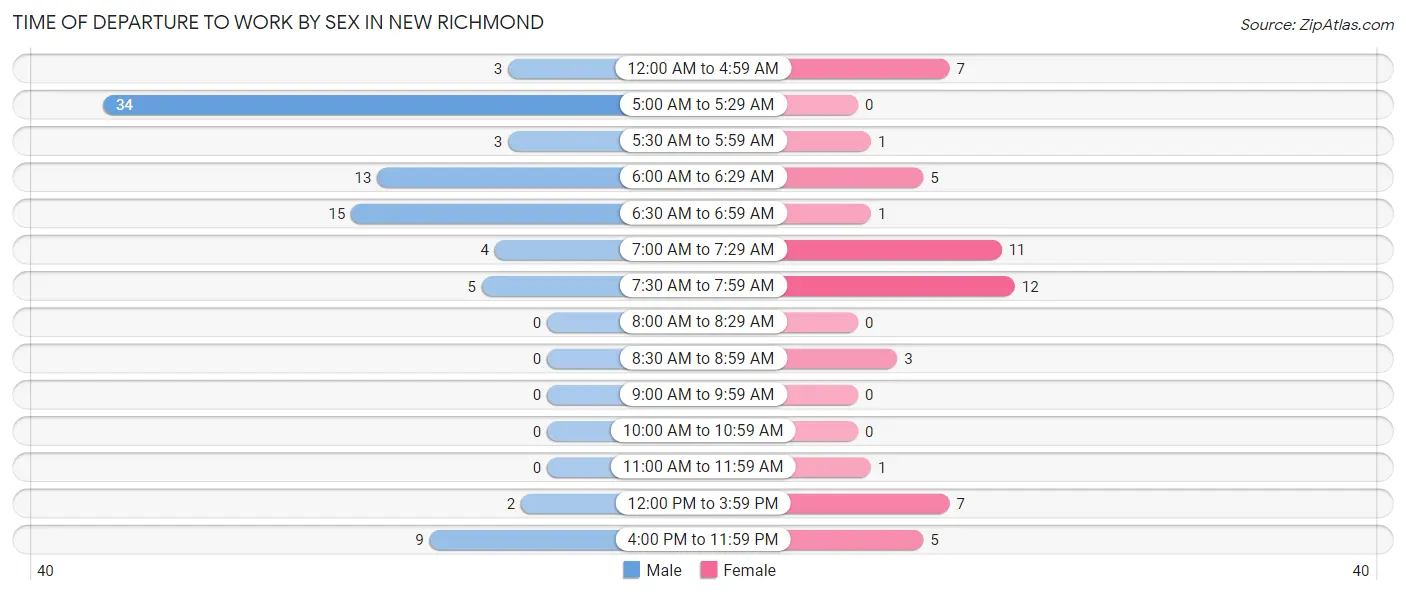
| Time of Departure | Male | Female |
| 12:00 AM to 4:59 AM | 3 (3.4%) | 7 (13.2%) |
| 5:00 AM to 5:29 AM | 34 (38.6%) | 0 (0.0%) |
| 5:30 AM to 5:59 AM | 3 (3.4%) | 1 (1.9%) |
| 6:00 AM to 6:29 AM | 13 (14.8%) | 5 (9.4%) |
| 6:30 AM to 6:59 AM | 15 (17.1%) | 1 (1.9%) |
| 7:00 AM to 7:29 AM | 4 (4.5%) | 11 (20.7%) |
| 7:30 AM to 7:59 AM | 5 (5.7%) | 12 (22.6%) |
| 8:00 AM to 8:29 AM | 0 (0.0%) | 0 (0.0%) |
| 8:30 AM to 8:59 AM | 0 (0.0%) | 3 (5.7%) |
| 9:00 AM to 9:59 AM | 0 (0.0%) | 0 (0.0%) |
| 10:00 AM to 10:59 AM | 0 (0.0%) | 0 (0.0%) |
| 11:00 AM to 11:59 AM | 0 (0.0%) | 1 (1.9%) |
| 12:00 PM to 3:59 PM | 2 (2.3%) | 7 (13.2%) |
| 4:00 PM to 11:59 PM | 9 (10.2%) | 5 (9.4%) |
| Total | 88 (100.0%) | 53 (100.0%) |
Housing Occupancy in New Richmond
Occupancy by Ownership in New Richmond
Of the total 157 dwellings in New Richmond, owner-occupied units account for 148 (94.3%), while renter-occupied units make up 9 (5.7%).
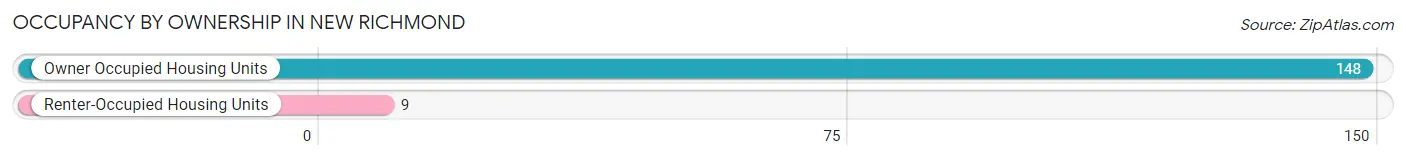
| Occupancy | # Housing Units | % Housing Units |
| Owner Occupied Housing Units | 148 | 94.3% |
| Renter-Occupied Housing Units | 9 | 5.7% |
| Total Occupied Housing Units | 157 | 100.0% |
Occupancy by Household Size in New Richmond
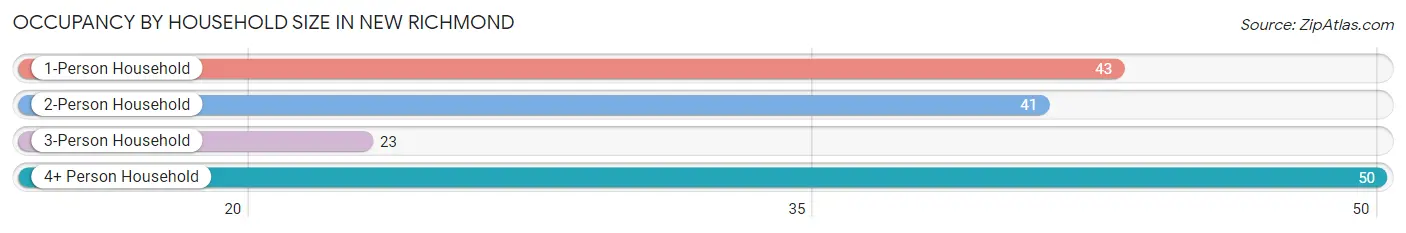
| Household Size | # Housing Units | % Housing Units |
| 1-Person Household | 43 | 27.4% |
| 2-Person Household | 41 | 26.1% |
| 3-Person Household | 23 | 14.6% |
| 4+ Person Household | 50 | 31.9% |
| Total Housing Units | 157 | 100.0% |
Occupancy by Ownership by Household Size in New Richmond
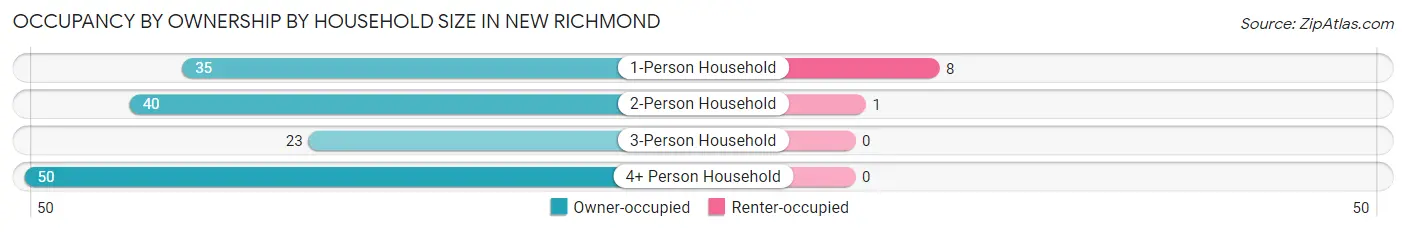
| Household Size | Owner-occupied | Renter-occupied |
| 1-Person Household | 35 (81.4%) | 8 (18.6%) |
| 2-Person Household | 40 (97.6%) | 1 (2.4%) |
| 3-Person Household | 23 (100.0%) | 0 (0.0%) |
| 4+ Person Household | 50 (100.0%) | 0 (0.0%) |
| Total Housing Units | 148 (94.3%) | 9 (5.7%) |
Occupancy by Educational Attainment in New Richmond
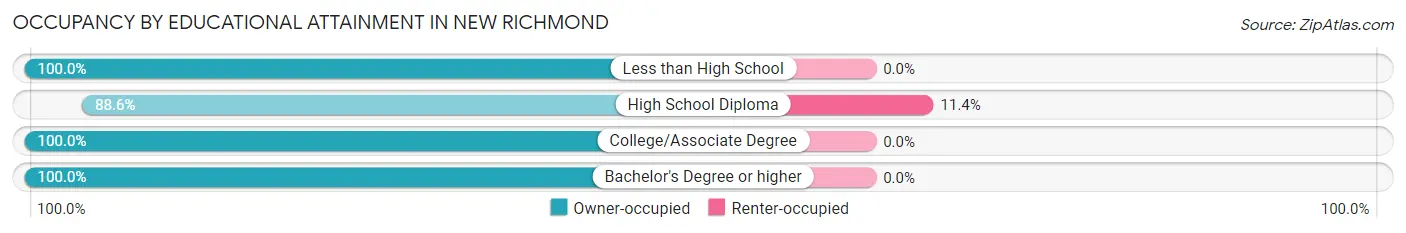
| Household Size | Owner-occupied | Renter-occupied |
| Less than High School | 41 (100.0%) | 0 (0.0%) |
| High School Diploma | 70 (88.6%) | 9 (11.4%) |
| College/Associate Degree | 25 (100.0%) | 0 (0.0%) |
| Bachelor's Degree or higher | 12 (100.0%) | 0 (0.0%) |
Occupancy by Age of Householder in New Richmond
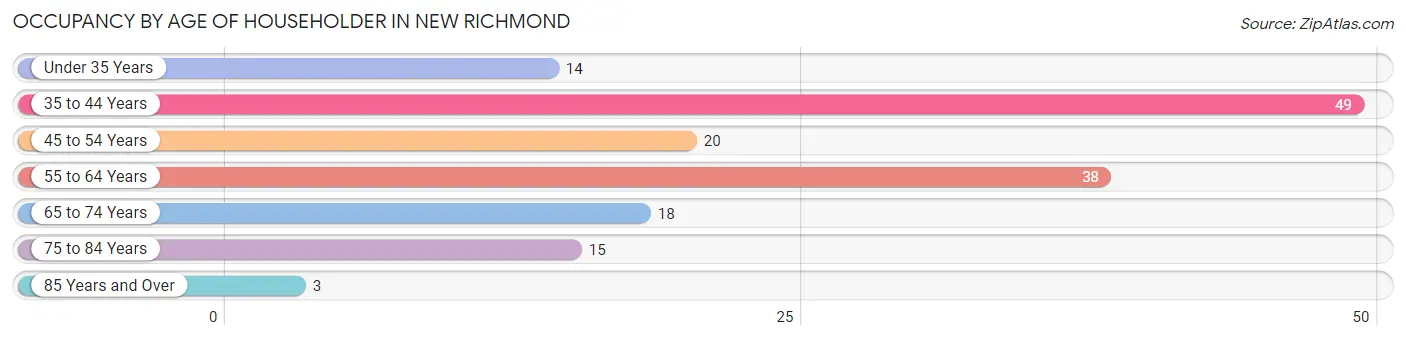
| Age Bracket | # Households | % Households |
| Under 35 Years | 14 | 8.9% |
| 35 to 44 Years | 49 | 31.2% |
| 45 to 54 Years | 20 | 12.7% |
| 55 to 64 Years | 38 | 24.2% |
| 65 to 74 Years | 18 | 11.5% |
| 75 to 84 Years | 15 | 9.6% |
| 85 Years and Over | 3 | 1.9% |
| Total | 157 | 100.0% |
Housing Finances in New Richmond
Median Income by Occupancy in New Richmond
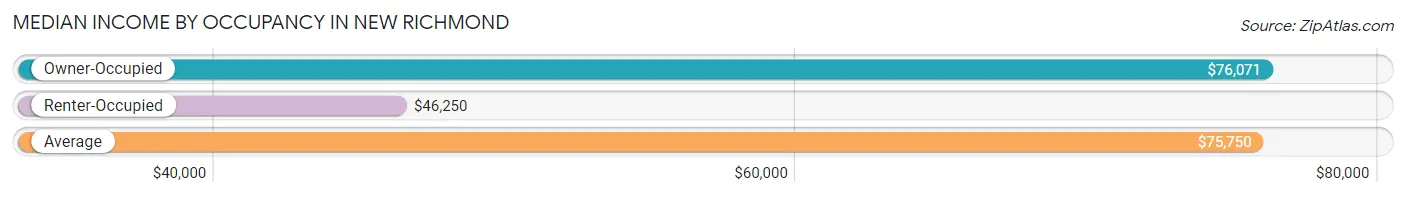
| Occupancy Type | # Households | Median Income |
| Owner-Occupied | 148 (94.3%) | $76,071 |
| Renter-Occupied | 9 (5.7%) | $46,250 |
| Average | 157 (100.0%) | $75,750 |
Occupancy by Householder Income Bracket in New Richmond
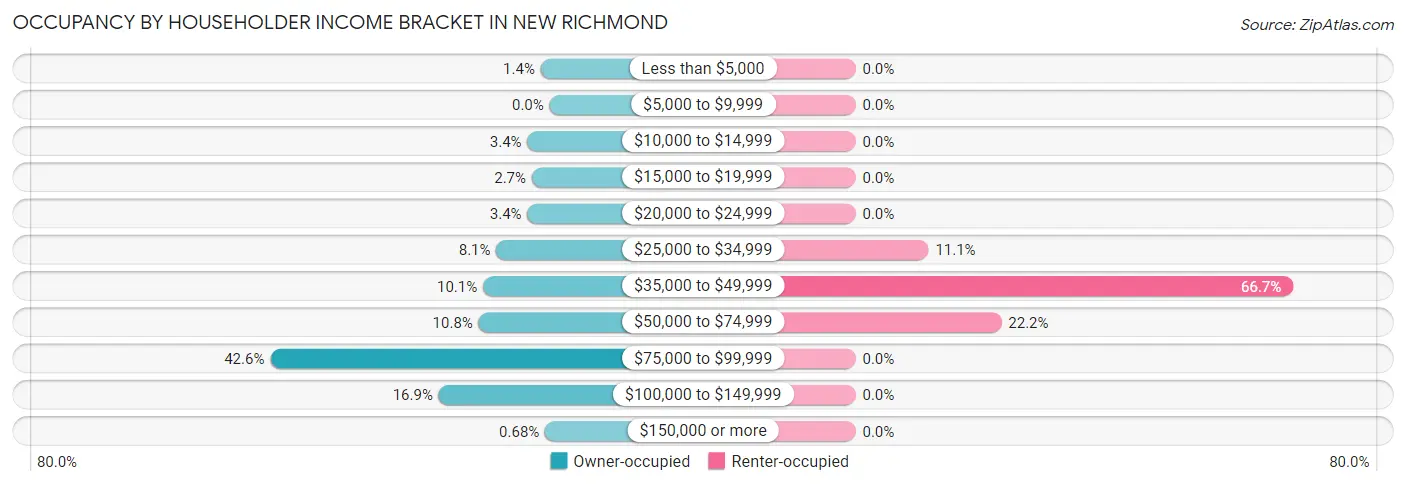
| Income Bracket | Owner-occupied | Renter-occupied |
| Less than $5,000 | 2 (1.3%) | 0 (0.0%) |
| $5,000 to $9,999 | 0 (0.0%) | 0 (0.0%) |
| $10,000 to $14,999 | 5 (3.4%) | 0 (0.0%) |
| $15,000 to $19,999 | 4 (2.7%) | 0 (0.0%) |
| $20,000 to $24,999 | 5 (3.4%) | 0 (0.0%) |
| $25,000 to $34,999 | 12 (8.1%) | 1 (11.1%) |
| $35,000 to $49,999 | 15 (10.1%) | 6 (66.7%) |
| $50,000 to $74,999 | 16 (10.8%) | 2 (22.2%) |
| $75,000 to $99,999 | 63 (42.6%) | 0 (0.0%) |
| $100,000 to $149,999 | 25 (16.9%) | 0 (0.0%) |
| $150,000 or more | 1 (0.7%) | 0 (0.0%) |
| Total | 148 (100.0%) | 9 (100.0%) |
Monthly Housing Cost Tiers in New Richmond
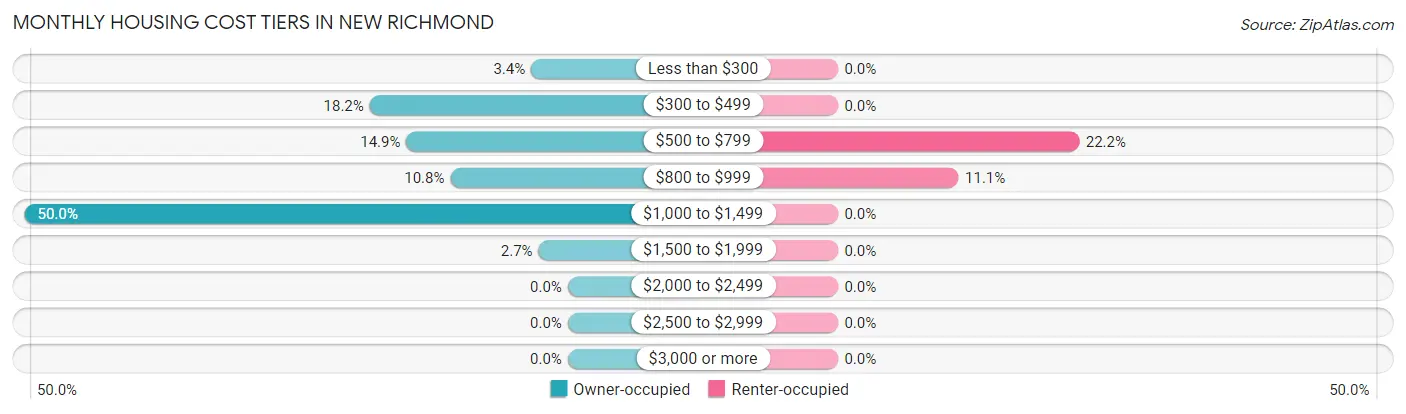
| Monthly Cost | Owner-occupied | Renter-occupied |
| Less than $300 | 5 (3.4%) | 0 (0.0%) |
| $300 to $499 | 27 (18.2%) | 0 (0.0%) |
| $500 to $799 | 22 (14.9%) | 2 (22.2%) |
| $800 to $999 | 16 (10.8%) | 1 (11.1%) |
| $1,000 to $1,499 | 74 (50.0%) | 0 (0.0%) |
| $1,500 to $1,999 | 4 (2.7%) | 0 (0.0%) |
| $2,000 to $2,499 | 0 (0.0%) | 0 (0.0%) |
| $2,500 to $2,999 | 0 (0.0%) | 0 (0.0%) |
| $3,000 or more | 0 (0.0%) | 0 (0.0%) |
| Total | 148 (100.0%) | 9 (100.0%) |
Physical Housing Characteristics in New Richmond
Housing Structures in New Richmond
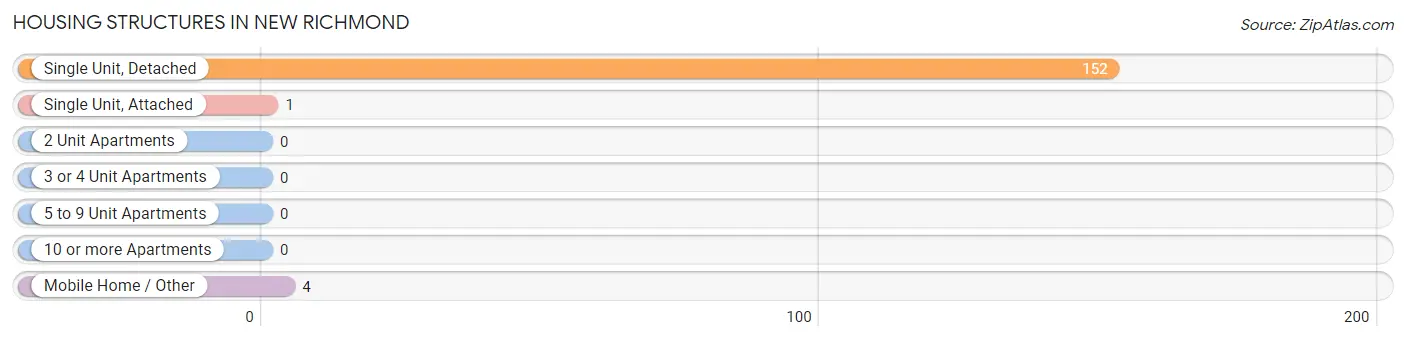
| Structure Type | # Housing Units | % Housing Units |
| Single Unit, Detached | 152 | 96.8% |
| Single Unit, Attached | 1 | 0.6% |
| 2 Unit Apartments | 0 | 0.0% |
| 3 or 4 Unit Apartments | 0 | 0.0% |
| 5 to 9 Unit Apartments | 0 | 0.0% |
| 10 or more Apartments | 0 | 0.0% |
| Mobile Home / Other | 4 | 2.5% |
| Total | 157 | 100.0% |
Housing Structures by Occupancy in New Richmond
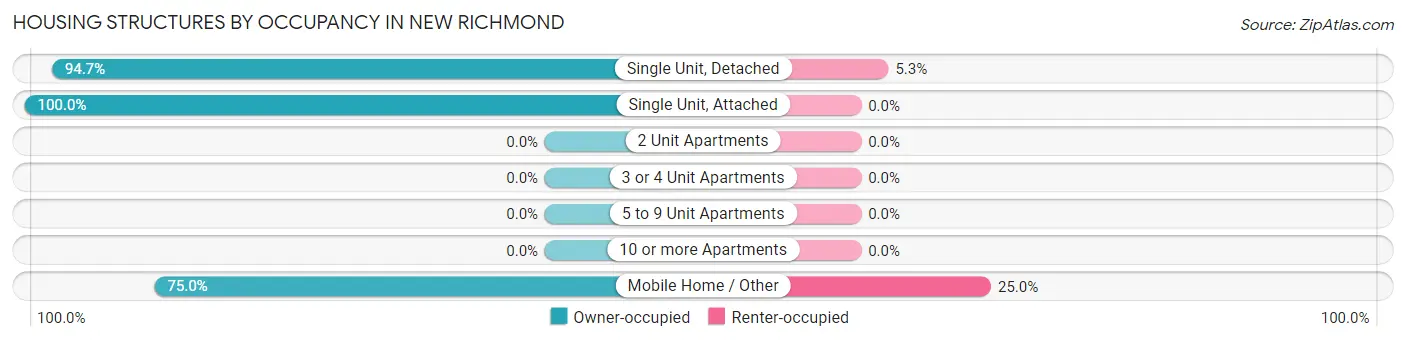
| Structure Type | Owner-occupied | Renter-occupied |
| Single Unit, Detached | 144 (94.7%) | 8 (5.3%) |
| Single Unit, Attached | 1 (100.0%) | 0 (0.0%) |
| 2 Unit Apartments | 0 (0.0%) | 0 (0.0%) |
| 3 or 4 Unit Apartments | 0 (0.0%) | 0 (0.0%) |
| 5 to 9 Unit Apartments | 0 (0.0%) | 0 (0.0%) |
| 10 or more Apartments | 0 (0.0%) | 0 (0.0%) |
| Mobile Home / Other | 3 (75.0%) | 1 (25.0%) |
| Total | 148 (94.3%) | 9 (5.7%) |
Housing Structures by Number of Rooms in New Richmond
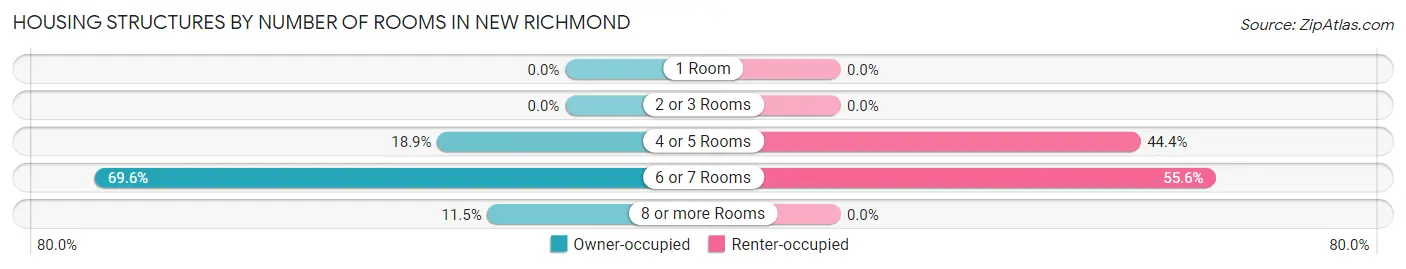
| Number of Rooms | Owner-occupied | Renter-occupied |
| 1 Room | 0 (0.0%) | 0 (0.0%) |
| 2 or 3 Rooms | 0 (0.0%) | 0 (0.0%) |
| 4 or 5 Rooms | 28 (18.9%) | 4 (44.4%) |
| 6 or 7 Rooms | 103 (69.6%) | 5 (55.6%) |
| 8 or more Rooms | 17 (11.5%) | 0 (0.0%) |
| Total | 148 (100.0%) | 9 (100.0%) |
Housing Structure by Heating Type in New Richmond
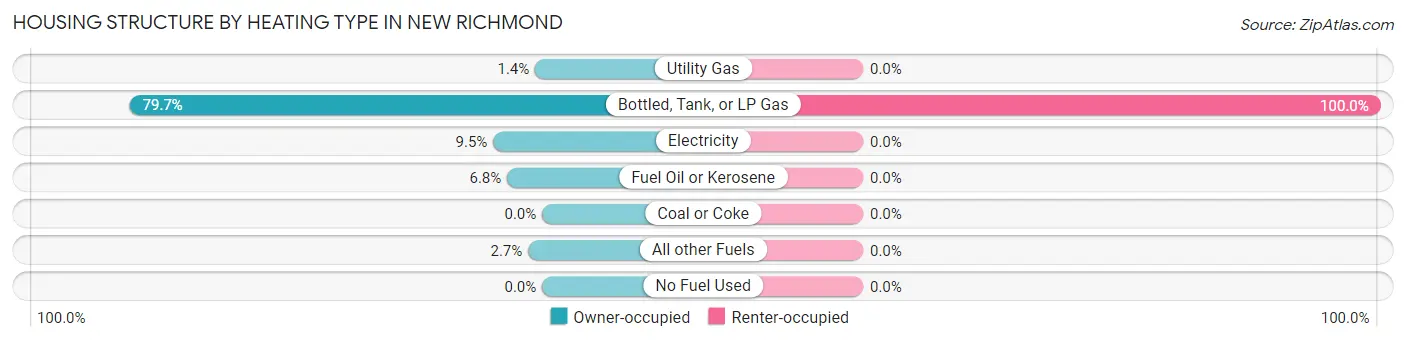
| Heating Type | Owner-occupied | Renter-occupied |
| Utility Gas | 2 (1.3%) | 0 (0.0%) |
| Bottled, Tank, or LP Gas | 118 (79.7%) | 9 (100.0%) |
| Electricity | 14 (9.5%) | 0 (0.0%) |
| Fuel Oil or Kerosene | 10 (6.8%) | 0 (0.0%) |
| Coal or Coke | 0 (0.0%) | 0 (0.0%) |
| All other Fuels | 4 (2.7%) | 0 (0.0%) |
| No Fuel Used | 0 (0.0%) | 0 (0.0%) |
| Total | 148 (100.0%) | 9 (100.0%) |
Household Vehicle Usage in New Richmond
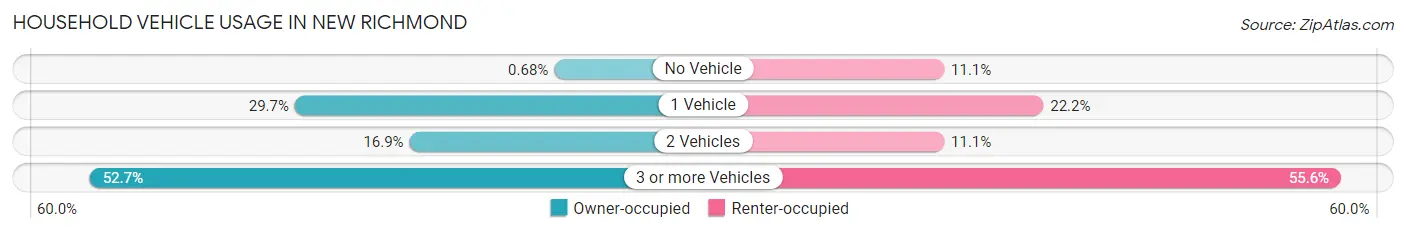
| Vehicles per Household | Owner-occupied | Renter-occupied |
| No Vehicle | 1 (0.7%) | 1 (11.1%) |
| 1 Vehicle | 44 (29.7%) | 2 (22.2%) |
| 2 Vehicles | 25 (16.9%) | 1 (11.1%) |
| 3 or more Vehicles | 78 (52.7%) | 5 (55.6%) |
| Total | 148 (100.0%) | 9 (100.0%) |
Real Estate & Mortgages in New Richmond
Real Estate and Mortgage Overview in New Richmond
| Characteristic | Without Mortgage | With Mortgage |
| Housing Units | 50 | 98 |
| Median Property Value | $85,000 | $70,000 |
| Median Household Income | - | - |
| Monthly Housing Costs | $467 | $0 |
| Real Estate Taxes | $254 | $3 |
Property Value by Mortgage Status in New Richmond
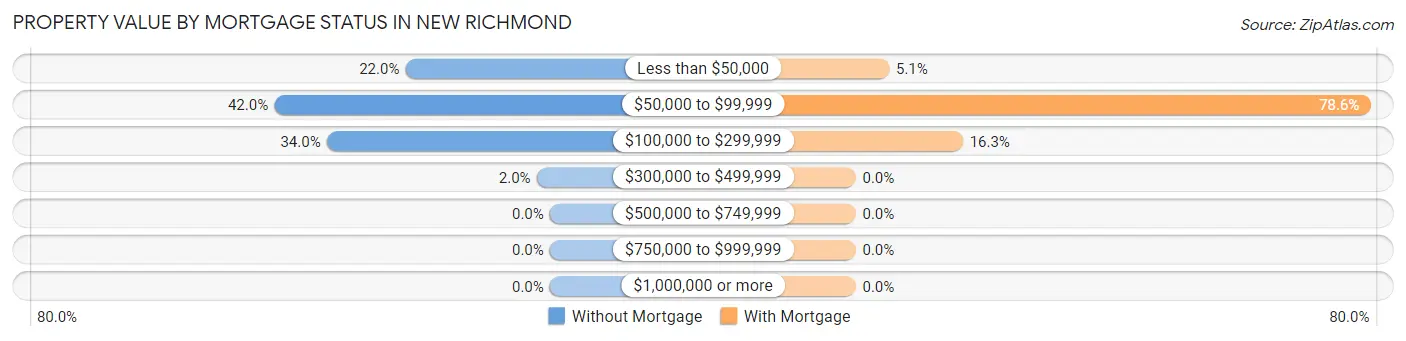
| Property Value | Without Mortgage | With Mortgage |
| Less than $50,000 | 11 (22.0%) | 5 (5.1%) |
| $50,000 to $99,999 | 21 (42.0%) | 77 (78.6%) |
| $100,000 to $299,999 | 17 (34.0%) | 16 (16.3%) |
| $300,000 to $499,999 | 1 (2.0%) | 0 (0.0%) |
| $500,000 to $749,999 | 0 (0.0%) | 0 (0.0%) |
| $750,000 to $999,999 | 0 (0.0%) | 0 (0.0%) |
| $1,000,000 or more | 0 (0.0%) | 0 (0.0%) |
| Total | 50 (100.0%) | 98 (100.0%) |
Household Income by Mortgage Status in New Richmond
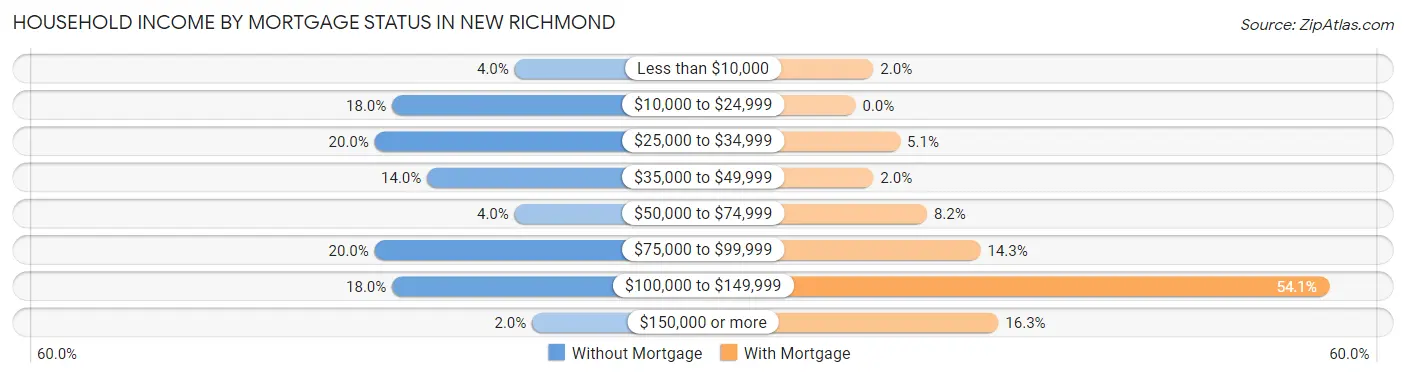
| Household Income | Without Mortgage | With Mortgage |
| Less than $10,000 | 2 (4.0%) | 2 (2.0%) |
| $10,000 to $24,999 | 9 (18.0%) | 0 (0.0%) |
| $25,000 to $34,999 | 10 (20.0%) | 5 (5.1%) |
| $35,000 to $49,999 | 7 (14.0%) | 2 (2.0%) |
| $50,000 to $74,999 | 2 (4.0%) | 8 (8.2%) |
| $75,000 to $99,999 | 10 (20.0%) | 14 (14.3%) |
| $100,000 to $149,999 | 9 (18.0%) | 53 (54.1%) |
| $150,000 or more | 1 (2.0%) | 16 (16.3%) |
| Total | 50 (100.0%) | 98 (100.0%) |
Property Value to Household Income Ratio in New Richmond
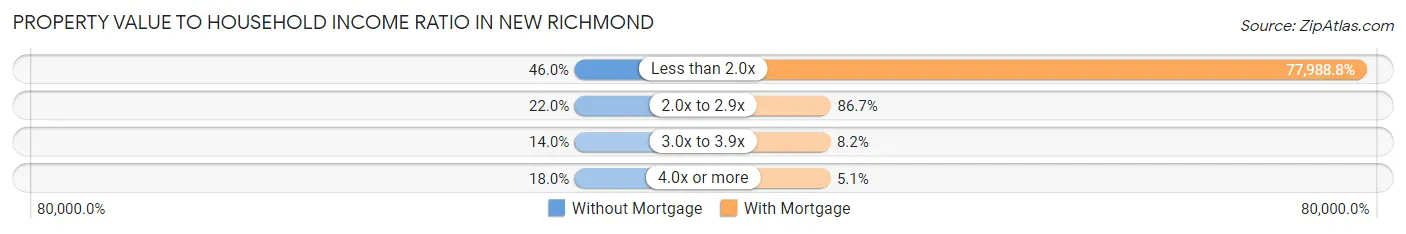
| Value-to-Income Ratio | Without Mortgage | With Mortgage |
| Less than 2.0x | 23 (46.0%) | 76,429 (77,988.8%) |
| 2.0x to 2.9x | 11 (22.0%) | 85 (86.7%) |
| 3.0x to 3.9x | 7 (14.0%) | 8 (8.2%) |
| 4.0x or more | 9 (18.0%) | 5 (5.1%) |
| Total | 50 (100.0%) | 98 (100.0%) |
Real Estate Taxes by Mortgage Status in New Richmond
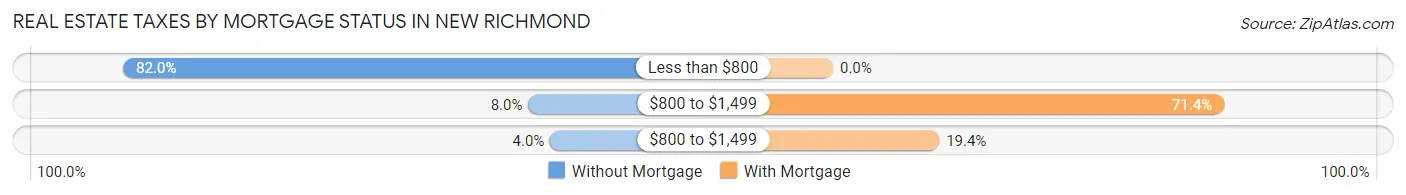
| Property Taxes | Without Mortgage | With Mortgage |
| Less than $800 | 41 (82.0%) | 0 (0.0%) |
| $800 to $1,499 | 4 (8.0%) | 70 (71.4%) |
| $800 to $1,499 | 2 (4.0%) | 19 (19.4%) |
| Total | 50 (100.0%) | 98 (100.0%) |
Health & Disability in New Richmond
Health Insurance Coverage by Age in New Richmond
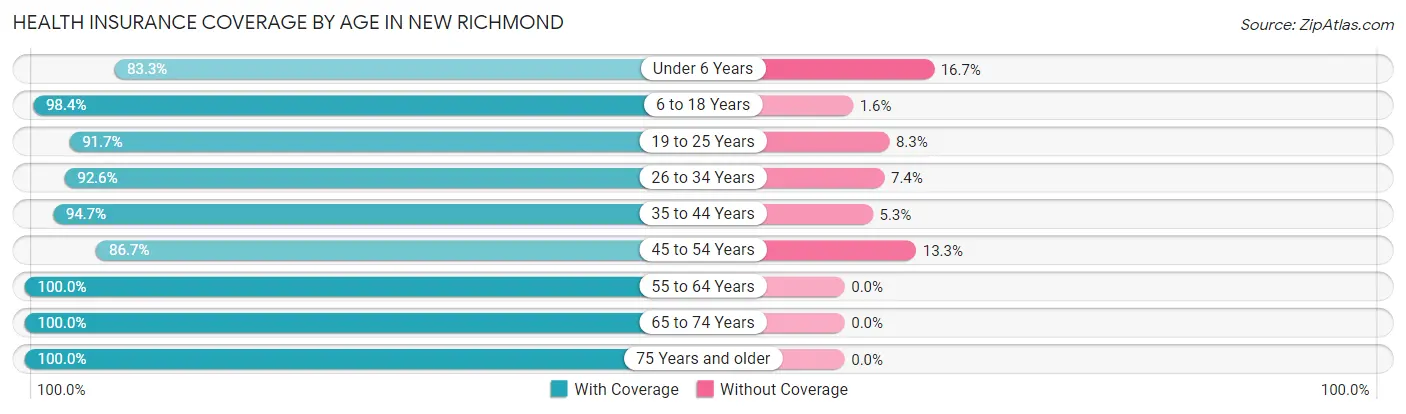
| Age Bracket | With Coverage | Without Coverage |
| Under 6 Years | 15 (83.3%) | 3 (16.7%) |
| 6 to 18 Years | 125 (98.4%) | 2 (1.6%) |
| 19 to 25 Years | 11 (91.7%) | 1 (8.3%) |
| 26 to 34 Years | 25 (92.6%) | 2 (7.4%) |
| 35 to 44 Years | 72 (94.7%) | 4 (5.3%) |
| 45 to 54 Years | 26 (86.7%) | 4 (13.3%) |
| 55 to 64 Years | 56 (100.0%) | 0 (0.0%) |
| 65 to 74 Years | 36 (100.0%) | 0 (0.0%) |
| 75 Years and older | 25 (100.0%) | 0 (0.0%) |
| Total | 391 (96.1%) | 16 (3.9%) |
Health Insurance Coverage by Citizenship Status in New Richmond
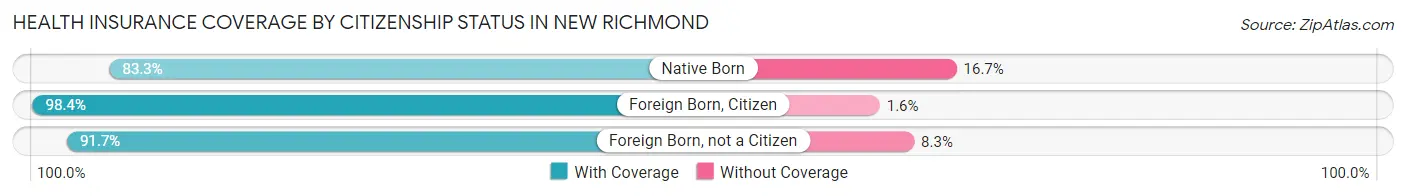
| Citizenship Status | With Coverage | Without Coverage |
| Native Born | 15 (83.3%) | 3 (16.7%) |
| Foreign Born, Citizen | 125 (98.4%) | 2 (1.6%) |
| Foreign Born, not a Citizen | 11 (91.7%) | 1 (8.3%) |
Health Insurance Coverage by Household Income in New Richmond
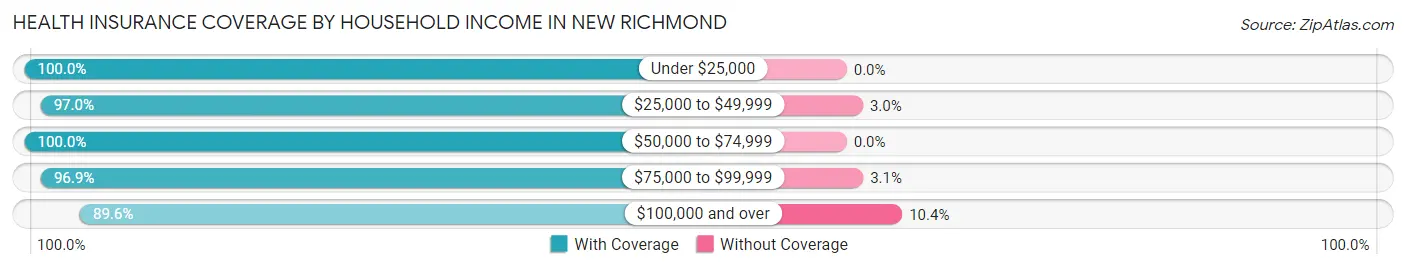
| Household Income | With Coverage | Without Coverage |
| Under $25,000 | 17 (100.0%) | 0 (0.0%) |
| $25,000 to $49,999 | 64 (97.0%) | 2 (3.0%) |
| $50,000 to $74,999 | 52 (100.0%) | 0 (0.0%) |
| $75,000 to $99,999 | 189 (96.9%) | 6 (3.1%) |
| $100,000 and over | 69 (89.6%) | 8 (10.4%) |
Public vs Private Health Insurance Coverage by Age in New Richmond
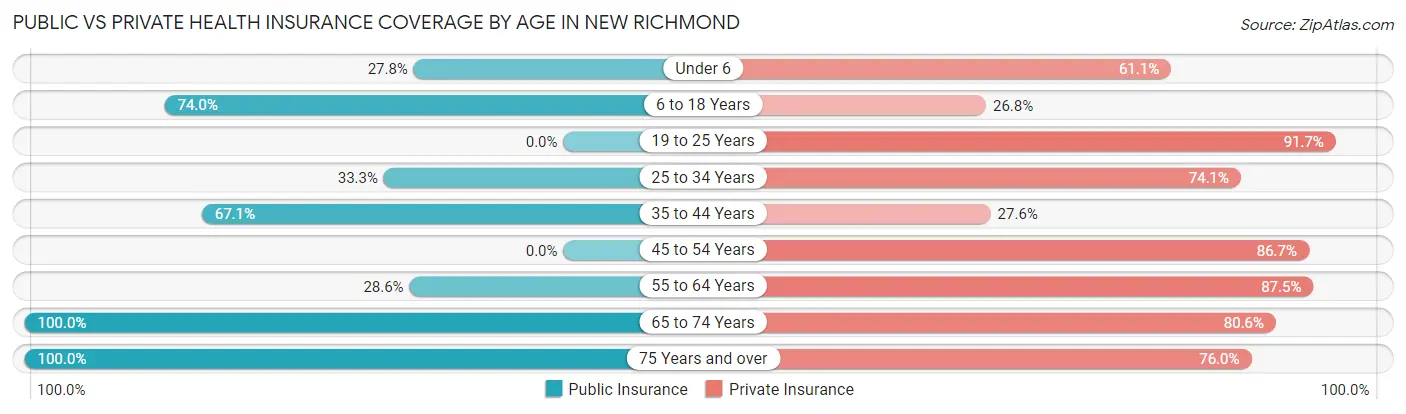
| Age Bracket | Public Insurance | Private Insurance |
| Under 6 | 5 (27.8%) | 11 (61.1%) |
| 6 to 18 Years | 94 (74.0%) | 34 (26.8%) |
| 19 to 25 Years | 0 (0.0%) | 11 (91.7%) |
| 25 to 34 Years | 9 (33.3%) | 20 (74.1%) |
| 35 to 44 Years | 51 (67.1%) | 21 (27.6%) |
| 45 to 54 Years | 0 (0.0%) | 26 (86.7%) |
| 55 to 64 Years | 16 (28.6%) | 49 (87.5%) |
| 65 to 74 Years | 36 (100.0%) | 29 (80.6%) |
| 75 Years and over | 25 (100.0%) | 19 (76.0%) |
| Total | 236 (58.0%) | 220 (54.0%) |
Disability Status by Sex by Age in New Richmond
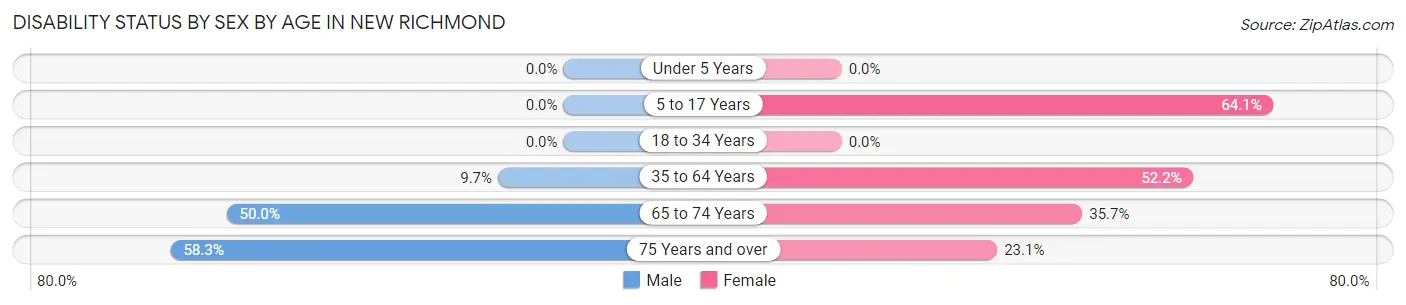
| Age Bracket | Male | Female |
| Under 5 Years | 0 (0.0%) | 0 (0.0%) |
| 5 to 17 Years | 0 (0.0%) | 25 (64.1%) |
| 18 to 34 Years | 0 (0.0%) | 0 (0.0%) |
| 35 to 64 Years | 7 (9.7%) | 47 (52.2%) |
| 65 to 74 Years | 4 (50.0%) | 10 (35.7%) |
| 75 Years and over | 7 (58.3%) | 3 (23.1%) |
Disability Class by Sex by Age in New Richmond
Disability Class: Hearing Difficulty
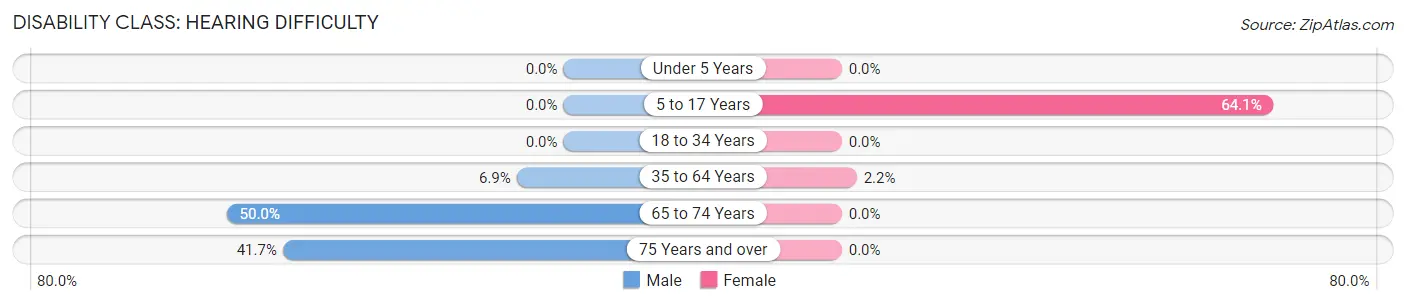
| Age Bracket | Male | Female |
| Under 5 Years | 0 (0.0%) | 0 (0.0%) |
| 5 to 17 Years | 0 (0.0%) | 25 (64.1%) |
| 18 to 34 Years | 0 (0.0%) | 0 (0.0%) |
| 35 to 64 Years | 5 (6.9%) | 2 (2.2%) |
| 65 to 74 Years | 4 (50.0%) | 0 (0.0%) |
| 75 Years and over | 5 (41.7%) | 0 (0.0%) |
Disability Class: Vision Difficulty

| Age Bracket | Male | Female |
| Under 5 Years | 0 (0.0%) | 0 (0.0%) |
| 5 to 17 Years | 0 (0.0%) | 0 (0.0%) |
| 18 to 34 Years | 0 (0.0%) | 0 (0.0%) |
| 35 to 64 Years | 0 (0.0%) | 0 (0.0%) |
| 65 to 74 Years | 0 (0.0%) | 2 (7.1%) |
| 75 Years and over | 0 (0.0%) | 0 (0.0%) |
Disability Class: Cognitive Difficulty
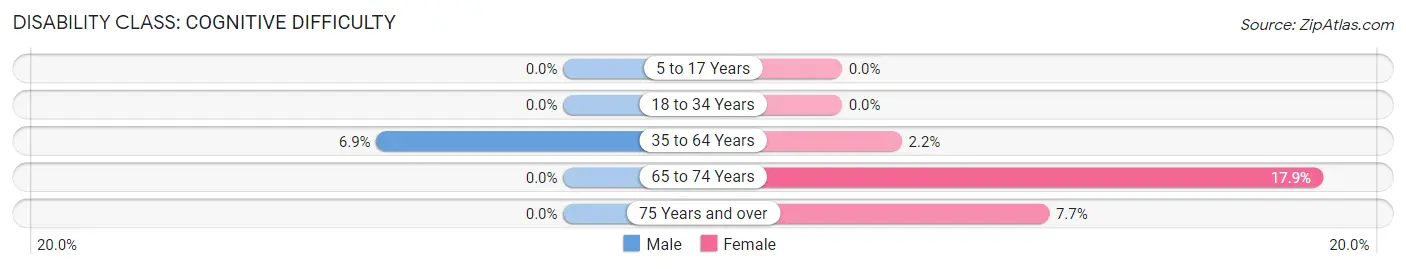
| Age Bracket | Male | Female |
| 5 to 17 Years | 0 (0.0%) | 0 (0.0%) |
| 18 to 34 Years | 0 (0.0%) | 0 (0.0%) |
| 35 to 64 Years | 5 (6.9%) | 2 (2.2%) |
| 65 to 74 Years | 0 (0.0%) | 5 (17.9%) |
| 75 Years and over | 0 (0.0%) | 1 (7.7%) |
Disability Class: Ambulatory Difficulty
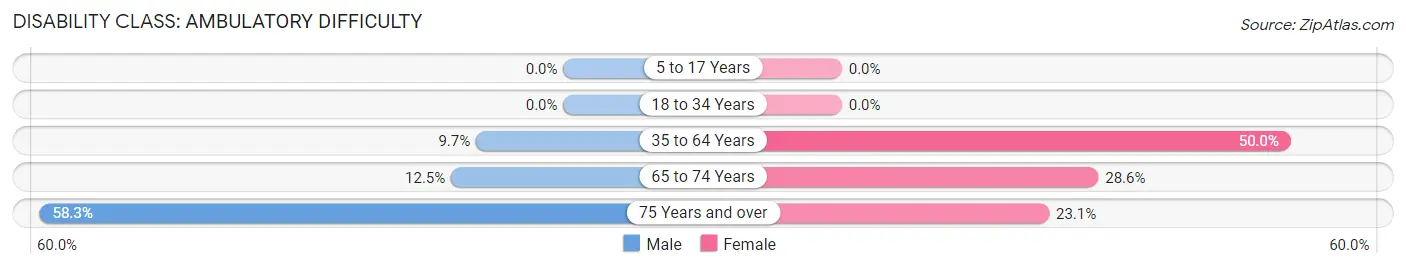
| Age Bracket | Male | Female |
| 5 to 17 Years | 0 (0.0%) | 0 (0.0%) |
| 18 to 34 Years | 0 (0.0%) | 0 (0.0%) |
| 35 to 64 Years | 7 (9.7%) | 45 (50.0%) |
| 65 to 74 Years | 1 (12.5%) | 8 (28.6%) |
| 75 Years and over | 7 (58.3%) | 3 (23.1%) |
Disability Class: Self-Care Difficulty
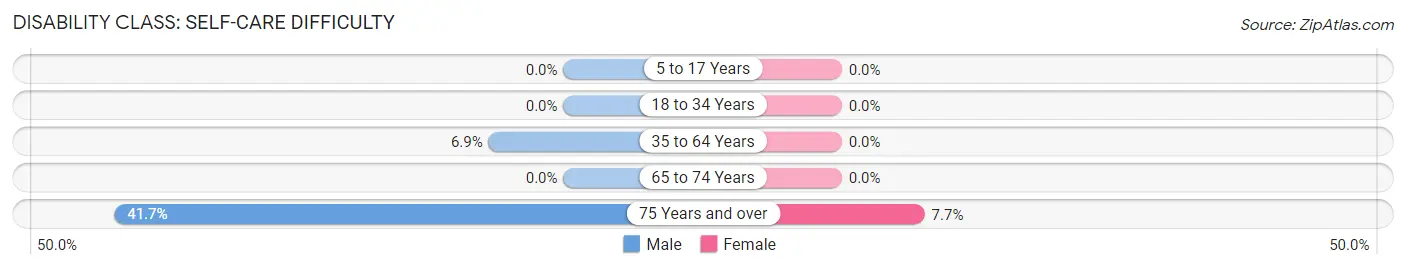
| Age Bracket | Male | Female |
| 5 to 17 Years | 0 (0.0%) | 0 (0.0%) |
| 18 to 34 Years | 0 (0.0%) | 0 (0.0%) |
| 35 to 64 Years | 5 (6.9%) | 0 (0.0%) |
| 65 to 74 Years | 0 (0.0%) | 0 (0.0%) |
| 75 Years and over | 5 (41.7%) | 1 (7.7%) |
Technology Access in New Richmond
Computing Device Access in New Richmond
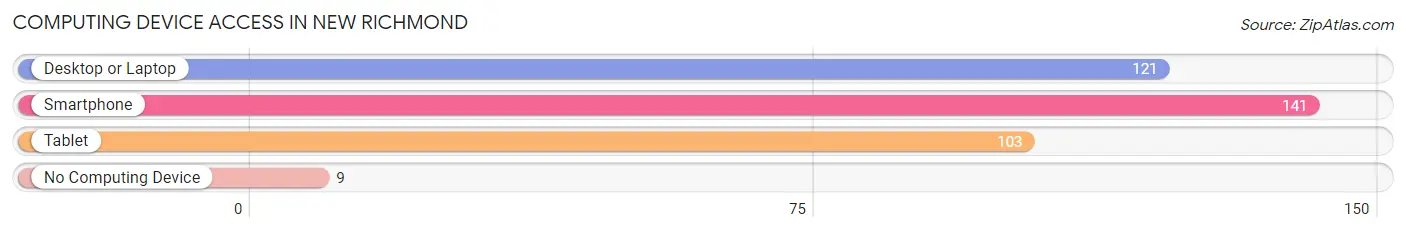
| Device Type | # Households | % Households |
| Desktop or Laptop | 121 | 77.1% |
| Smartphone | 141 | 89.8% |
| Tablet | 103 | 65.6% |
| No Computing Device | 9 | 5.7% |
| Total | 157 | 100.0% |
Internet Access in New Richmond
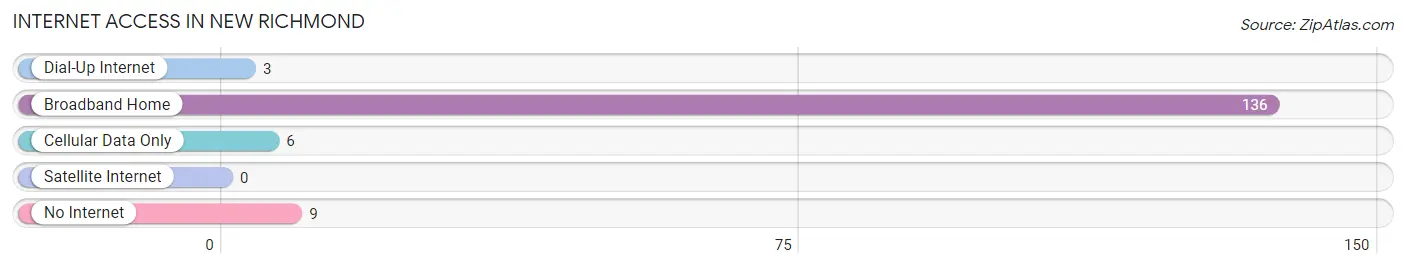
| Internet Type | # Households | % Households |
| Dial-Up Internet | 3 | 1.9% |
| Broadband Home | 136 | 86.6% |
| Cellular Data Only | 6 | 3.8% |
| Satellite Internet | 0 | 0.0% |
| No Internet | 9 | 5.7% |
| Total | 157 | 100.0% |
New Richmond Summary
Richmond, Indiana is a city located in Wayne County, Indiana, United States. It is the county seat of Wayne County and is located along the Whitewater River. The population was estimated to be 8,631 in 2019.
History
The area that is now Richmond was first settled in 1806 by Quaker families from North Carolina. The town was originally called Smithville, but was renamed Richmond in 1818 in honor of the town's founder, John Smith. The town was officially incorporated in 1819.
In the early 19th century, Richmond was a major stop on the Underground Railroad, with many Quaker families providing shelter and assistance to escaped slaves. During the Civil War, Richmond was a major center of Union activity, and the town was the site of several major battles.
In the late 19th century, Richmond became an important industrial center, with several major factories located in the city. The city was also home to several major railroads, including the Pennsylvania Railroad and the Baltimore and Ohio Railroad.
Geography
Richmond is located in east-central Indiana, about 50 miles east of Indianapolis. The city is situated along the Whitewater River, which flows through the city from north to south. The city is located in a hilly region, with several small hills and ridges in the area.
The city has a total area of 8.7 square miles, of which 8.6 square miles is land and 0.1 square miles is water.
Economy
Richmond's economy is largely based on manufacturing and healthcare. The city is home to several major manufacturing companies, including Honda Manufacturing of Indiana, which produces automobiles and engines, and Belden, which produces electrical and electronic components.
The city is also home to several major healthcare providers, including Reid Health, which operates a hospital and several clinics in the city.
Demographics
As of the 2010 census, the population of Richmond was 36,812. The racial makeup of the city was 87.3% White, 8.2% African American, 0.4% Native American, 0.9% Asian, 0.1% Pacific Islander, 1.2% from other races, and 2.0% from two or more races. Hispanic or Latino of any race were 3.2% of the population.
The median income for a household in the city was $37,945, and the median income for a family was $45,945. The per capita income for the city was $19,945. About 14.3% of families and 17.7% of the population were below the poverty line, including 25.3% of those under age 18 and 8.7% of those age 65 or over.
Common Questions
What is the Total Population of New Richmond?
Total Population of New Richmond is 407.
What is the Total Male Population of New Richmond?
Total Male Population of New Richmond is 196.
What is the Total Female Population of New Richmond?
Total Female Population of New Richmond is 211.
What is the Ratio of Males per 100 Females in New Richmond?
There are 92.89 Males per 100 Females in New Richmond.
What is the Ratio of Females per 100 Males in New Richmond?
There are 107.65 Females per 100 Males in New Richmond.
What is the Median Population Age in New Richmond?
Median Population Age in New Richmond is 37.5 Years.
What is the Average Family Size in New Richmond
Average Family Size in New Richmond is 3.2 People.
What is the Average Household Size in New Richmond
Average Household Size in New Richmond is 2.6 People.
What is Per Capita Income in New Richmond?
Per Capita income in New Richmond is $23,911.
What is the Median Family Income in New Richmond?
Median Family Income in New Richmond is $76,143.
What is the Median Household income in New Richmond?
Median Household Income in New Richmond is $75,750.
What is Income or Wage Gap in New Richmond?
Income or Wage Gap in New Richmond is 9.2%.
Women in New Richmond earn 90.8 cents for every dollar earned by a man.
What is Inequality or Gini Index in New Richmond?
Inequality or Gini Index in New Richmond is 0.26.
How Large is the Labor Force in New Richmond?
There are 175 People in the Labor Forcein in New Richmond.
What is the Percentage of People in the Labor Force in New Richmond?
55.2% of People are in the Labor Force in New Richmond.
What is the Unemployment Rate in New Richmond?
Unemployment Rate in New Richmond is 4.6%.