Warren Park, IN
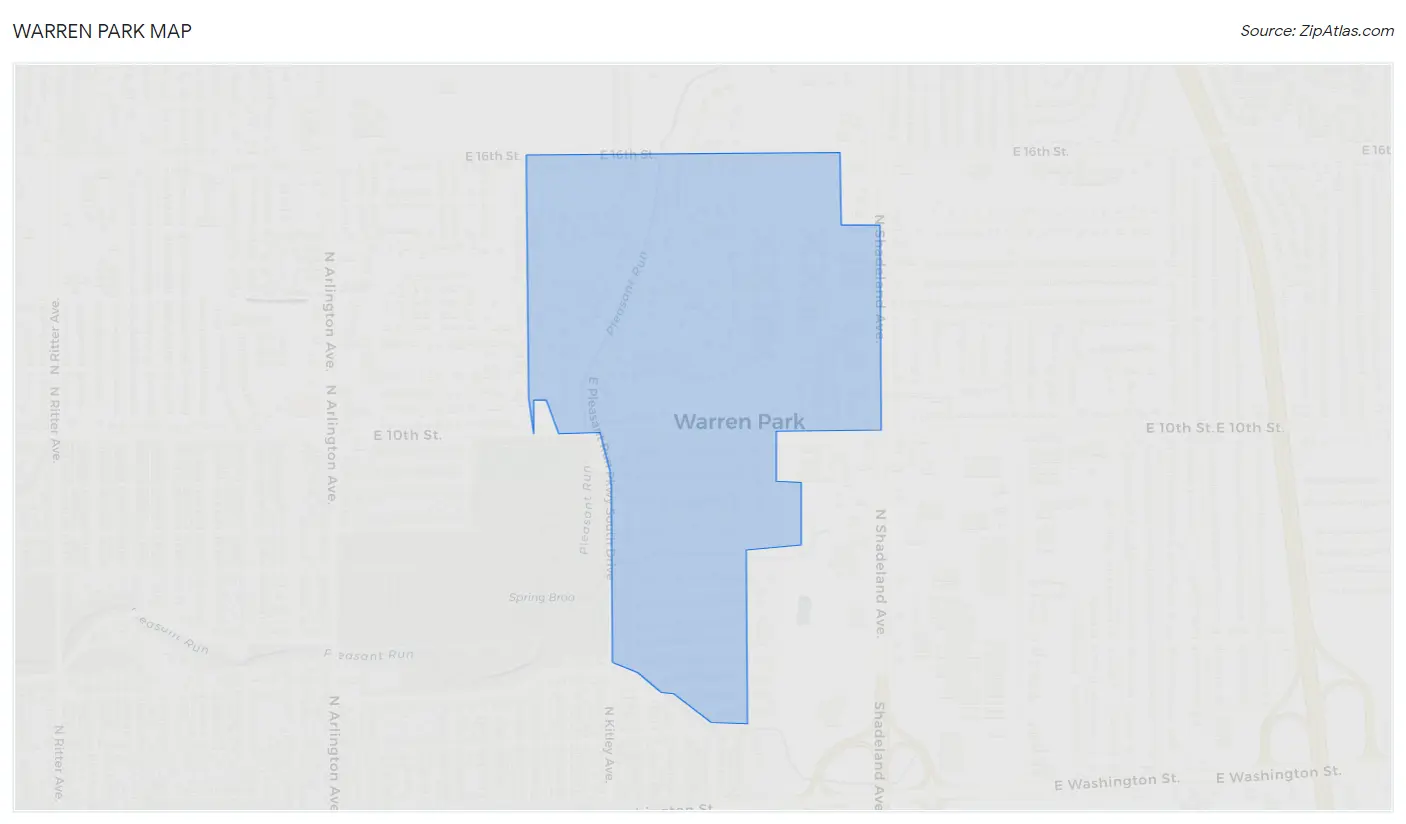
Warren Park Map
Warren Park Overview
1,475
TOTAL POPULATION
542
MALE POPULATION
933
FEMALE POPULATION
58.09
MALES / 100 FEMALES
172.14
FEMALES / 100 MALES
54.3
MEDIAN AGE
2.8
AVG FAMILY SIZE
1.7
AVG HOUSEHOLD SIZE
$50,166
PER CAPITA INCOME
$66,635
AVG FAMILY INCOME
$38,944
AVG HOUSEHOLD INCOME
9.1%
WAGE / INCOME GAP [ % ]
90.9¢/ $1
WAGE / INCOME GAP [ $ ]
0.62
INEQUALITY / GINI INDEX
640
LABOR FORCE [ PEOPLE ]
51.8%
PERCENT IN LABOR FORCE
3.3%
UNEMPLOYMENT RATE
Warren Park Area Codes
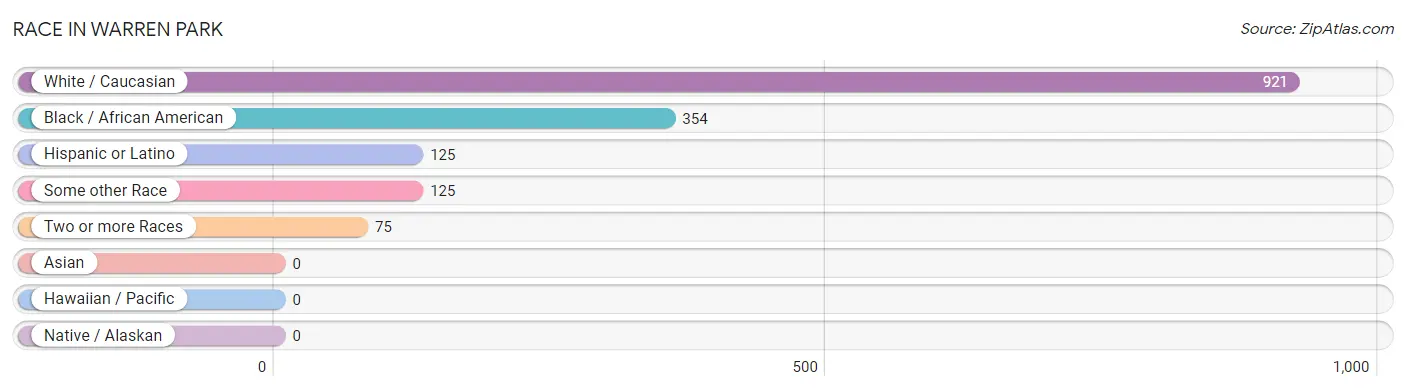
Race in Warren Park
The most populous races in Warren Park are White / Caucasian (921 | 62.4%), Black / African American (354 | 24.0%), and Hispanic or Latino (125 | 8.5%).
| Race | # Population | % Population |
| Asian | 0 | 0.0% |
| Black / African American | 354 | 24.0% |
| Hawaiian / Pacific | 0 | 0.0% |
| Hispanic or Latino | 125 | 8.5% |
| Native / Alaskan | 0 | 0.0% |
| White / Caucasian | 921 | 62.4% |
| Two or more Races | 75 | 5.1% |
| Some other Race | 125 | 8.5% |
| Total | 1,475 | 100.0% |
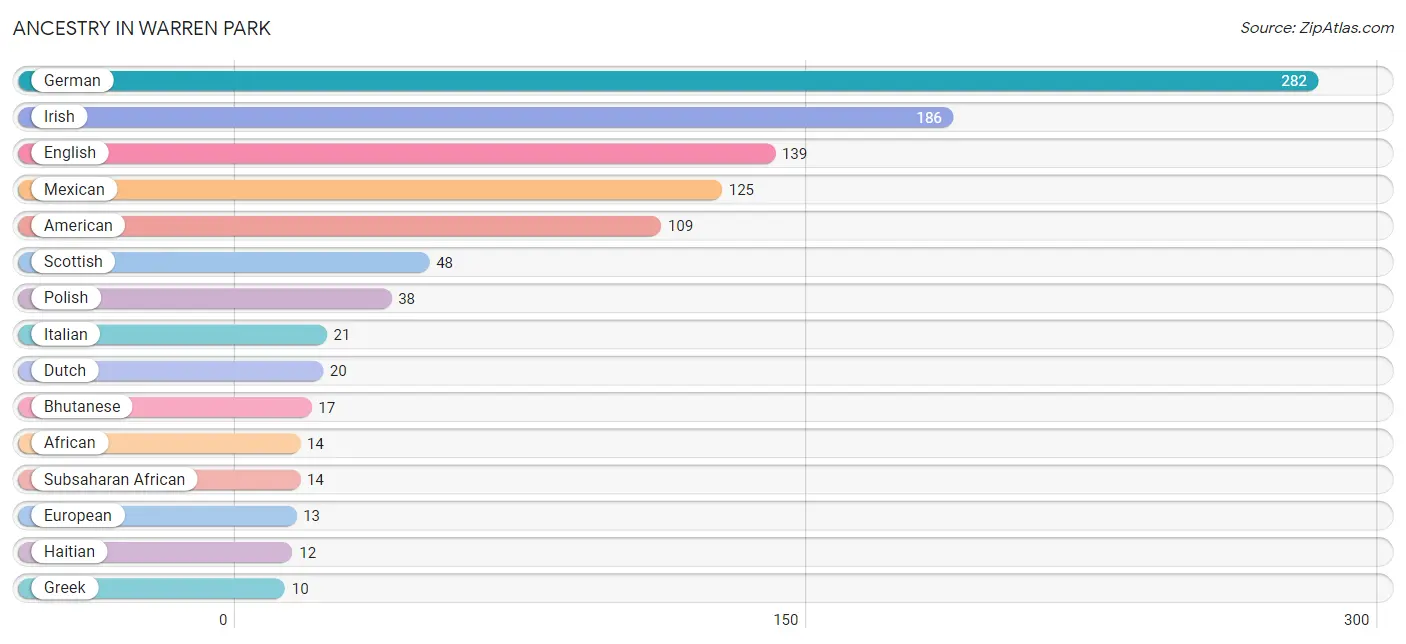
Ancestry in Warren Park
The most populous ancestries reported in Warren Park are German (282 | 19.1%), Irish (186 | 12.6%), English (139 | 9.4%), Mexican (125 | 8.5%), and American (109 | 7.4%), together accounting for 57.0% of all Warren Park residents.
| Ancestry | # Population | % Population |
| African | 14 | 0.9% |
| American | 109 | 7.4% |
| Bhutanese | 17 | 1.1% |
| Cherokee | 6 | 0.4% |
| Czech | 4 | 0.3% |
| Dutch | 20 | 1.4% |
| Eastern European | 4 | 0.3% |
| English | 139 | 9.4% |
| European | 13 | 0.9% |
| French | 9 | 0.6% |
| French Canadian | 5 | 0.3% |
| German | 282 | 19.1% |
| Greek | 10 | 0.7% |
| Haitian | 12 | 0.8% |
| Hungarian | 7 | 0.5% |
| Irish | 186 | 12.6% |
| Italian | 21 | 1.4% |
| Mexican | 125 | 8.5% |
| Polish | 38 | 2.6% |
| Scotch-Irish | 7 | 0.5% |
| Scottish | 48 | 3.3% |
| Subsaharan African | 14 | 0.9% | View All 22 Rows |
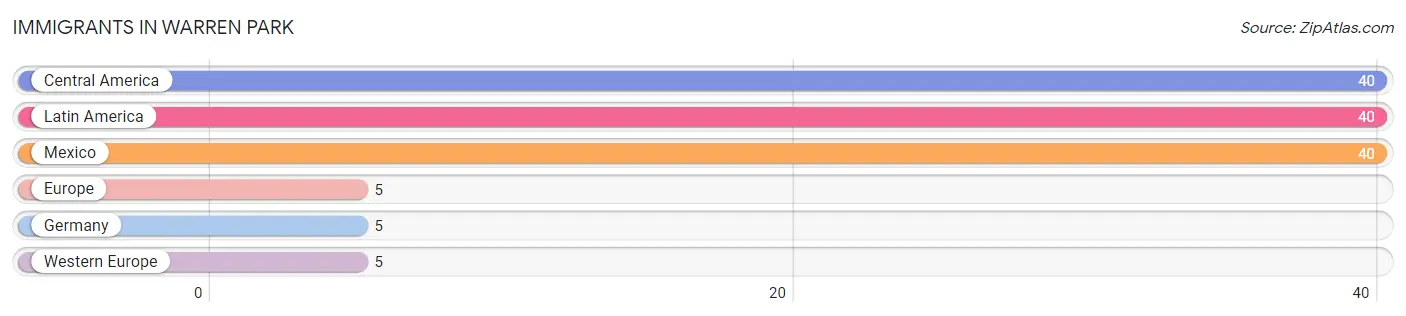
Immigrants in Warren Park
The most numerous immigrant groups reported in Warren Park came from Central America (40 | 2.7%), Latin America (40 | 2.7%), Mexico (40 | 2.7%), Europe (5 | 0.3%), and Germany (5 | 0.3%), together accounting for 8.8% of all Warren Park residents.
| Immigration Origin | # Population | % Population |
| Central America | 40 | 2.7% |
| Europe | 5 | 0.3% |
| Germany | 5 | 0.3% |
| Latin America | 40 | 2.7% |
| Mexico | 40 | 2.7% |
| Western Europe | 5 | 0.3% | View All 6 Rows |
Sex and Age in Warren Park
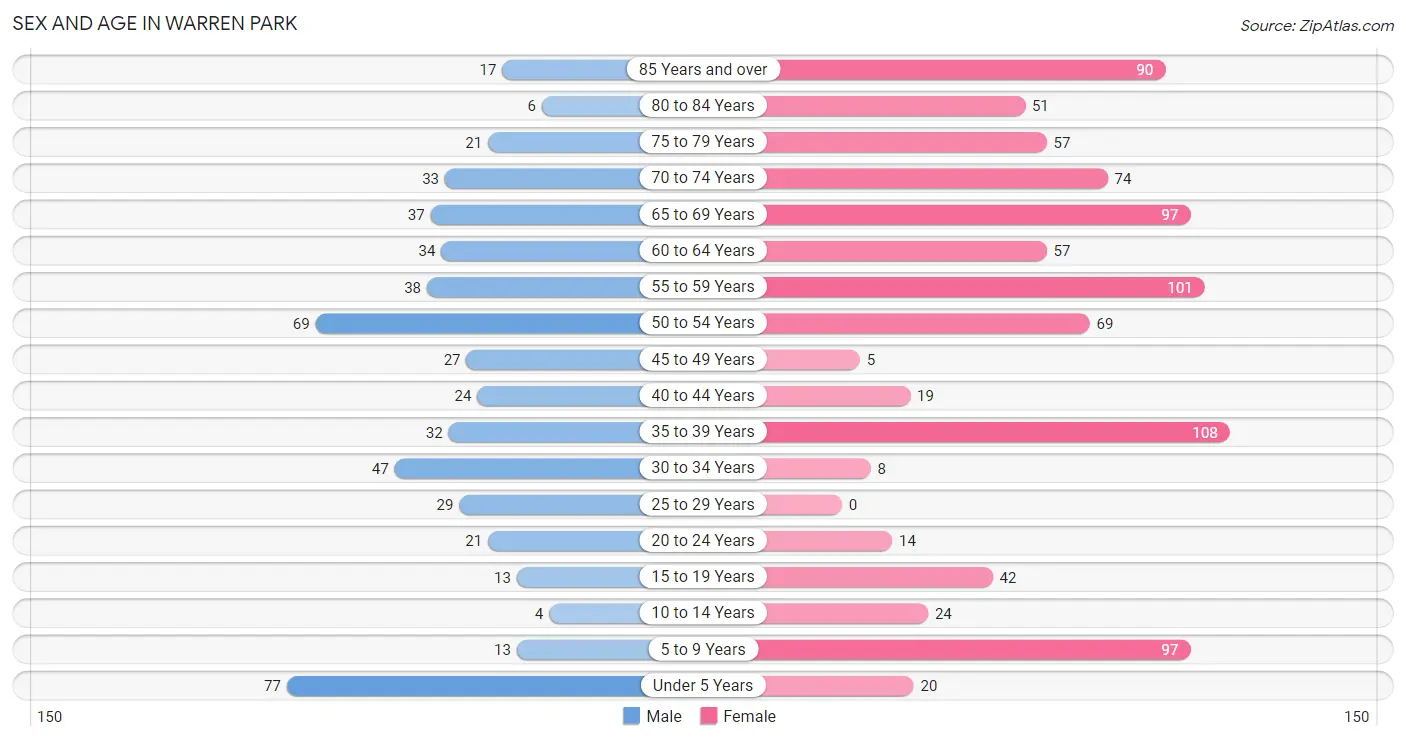
Sex and Age in Warren Park
The most populous age groups in Warren Park are Under 5 Years (77 | 14.2%) for men and 35 to 39 Years (108 | 11.6%) for women.
| Age Bracket | Male | Female |
| Under 5 Years | 77 (14.2%) | 20 (2.1%) |
| 5 to 9 Years | 13 (2.4%) | 97 (10.4%) |
| 10 to 14 Years | 4 (0.7%) | 24 (2.6%) |
| 15 to 19 Years | 13 (2.4%) | 42 (4.5%) |
| 20 to 24 Years | 21 (3.9%) | 14 (1.5%) |
| 25 to 29 Years | 29 (5.3%) | 0 (0.0%) |
| 30 to 34 Years | 47 (8.7%) | 8 (0.9%) |
| 35 to 39 Years | 32 (5.9%) | 108 (11.6%) |
| 40 to 44 Years | 24 (4.4%) | 19 (2.0%) |
| 45 to 49 Years | 27 (5.0%) | 5 (0.5%) |
| 50 to 54 Years | 69 (12.7%) | 69 (7.4%) |
| 55 to 59 Years | 38 (7.0%) | 101 (10.8%) |
| 60 to 64 Years | 34 (6.3%) | 57 (6.1%) |
| 65 to 69 Years | 37 (6.8%) | 97 (10.4%) |
| 70 to 74 Years | 33 (6.1%) | 74 (7.9%) |
| 75 to 79 Years | 21 (3.9%) | 57 (6.1%) |
| 80 to 84 Years | 6 (1.1%) | 51 (5.5%) |
| 85 Years and over | 17 (3.1%) | 90 (9.7%) |
| Total | 542 (100.0%) | 933 (100.0%) |
Families and Households in Warren Park
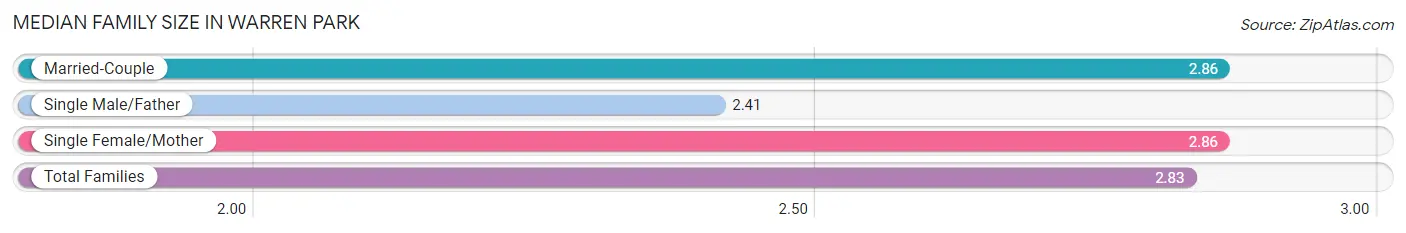
Median Family Size in Warren Park
The median family size in Warren Park is 2.83 persons per family, with married-couple families (169 | 55.8%) accounting for the largest median family size of 2.86 persons per family. On the other hand, single male/father families (17 | 5.6%) represent the smallest median family size with 2.41 persons per family.
| Family Type | # Families | Family Size |
| Married-Couple | 169 (55.8%) | 2.86 |
| Single Male/Father | 17 (5.6%) | 2.41 |
| Single Female/Mother | 117 (38.6%) | 2.86 |
| Total Families | 303 (100.0%) | 2.83 |
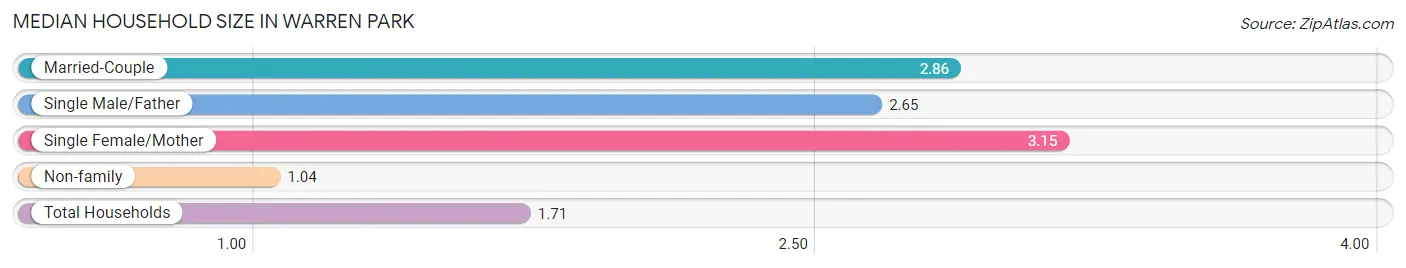
Median Household Size in Warren Park
The median household size in Warren Park is 1.71 persons per household, with single female/mother households (117 | 13.6%) accounting for the largest median household size of 3.15 persons per household. non-family households (559 | 64.8%) represent the smallest median household size with 1.04 persons per household.
| Household Type | # Households | Household Size |
| Married-Couple | 169 (19.6%) | 2.86 |
| Single Male/Father | 17 (2.0%) | 2.65 |
| Single Female/Mother | 117 (13.6%) | 3.15 |
| Non-family | 559 (64.8%) | 1.04 |
| Total Households | 862 (100.0%) | 1.71 |
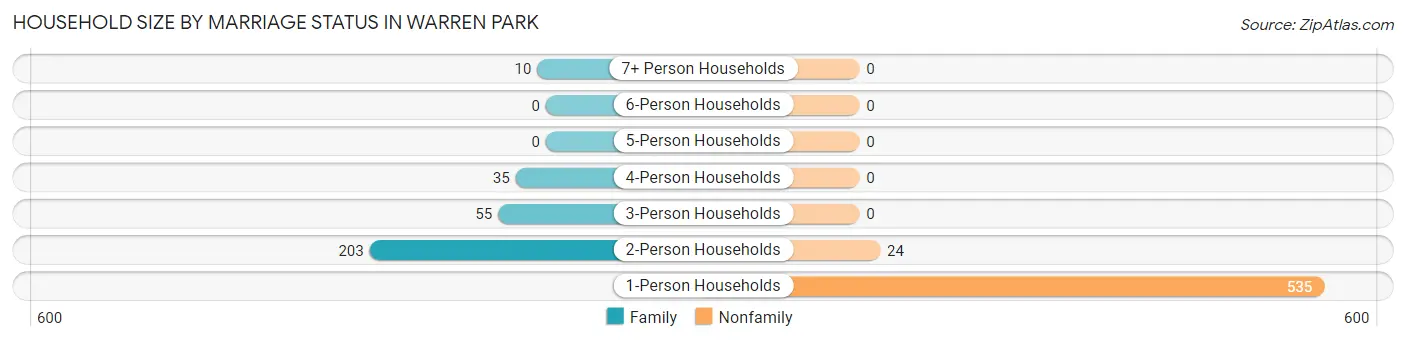
Household Size by Marriage Status in Warren Park
Out of a total of 862 households in Warren Park, 303 (35.1%) are family households, while 559 (64.8%) are nonfamily households. The most numerous type of family households are 2-person households, comprising 203, and the most common type of nonfamily households are 1-person households, comprising 535.
| Household Size | Family Households | Nonfamily Households |
| 1-Person Households | - | 535 (62.1%) |
| 2-Person Households | 203 (23.5%) | 24 (2.8%) |
| 3-Person Households | 55 (6.4%) | 0 (0.0%) |
| 4-Person Households | 35 (4.1%) | 0 (0.0%) |
| 5-Person Households | 0 (0.0%) | 0 (0.0%) |
| 6-Person Households | 0 (0.0%) | 0 (0.0%) |
| 7+ Person Households | 10 (1.2%) | 0 (0.0%) |
| Total | 303 (35.1%) | 559 (64.8%) |
Female Fertility in Warren Park
Fertility by Age in Warren Park
Average fertility rate in Warren Park is 97.0 births per 1,000 women. Women in the age bracket of 35 to 50 years have the highest fertility rate with 144.0 births per 1,000 women. Women in the age bracket of 35 to 50 years acount for 100.0% of all women with births.
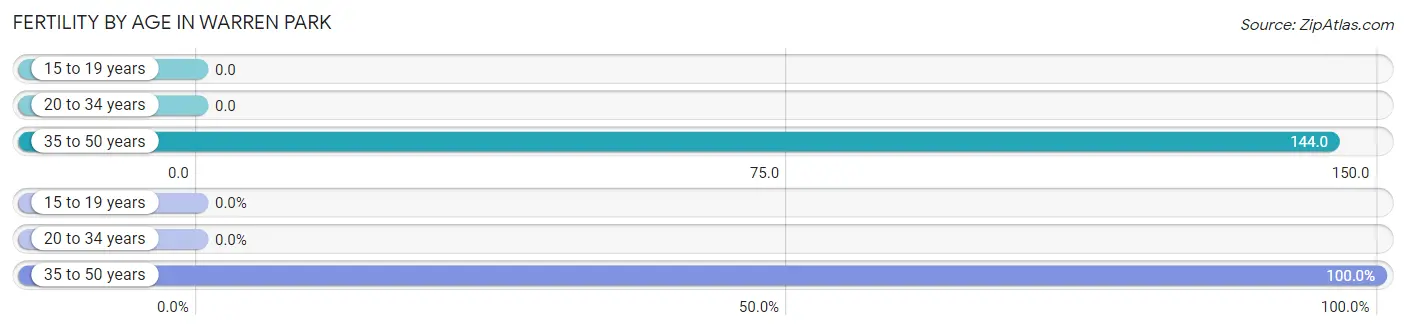
| Age Bracket | Women with Births | Births / 1,000 Women |
| 15 to 19 years | 0 (0.0%) | 0.0 |
| 20 to 34 years | 0 (0.0%) | 0.0 |
| 35 to 50 years | 19 (100.0%) | 144.0 |
| Total | 19 (100.0%) | 97.0 |
Fertility by Age by Marriage Status in Warren Park
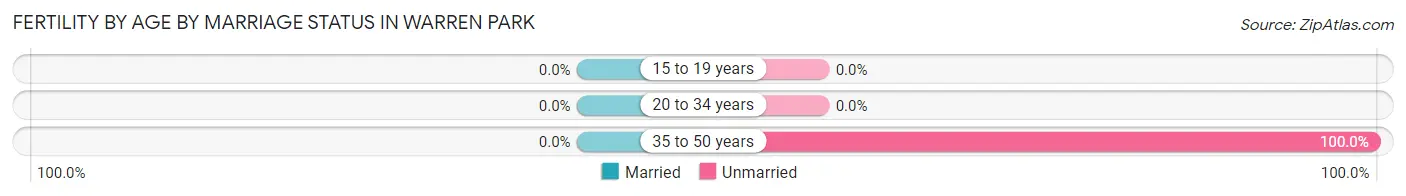
| Age Bracket | Married | Unmarried |
| 15 to 19 years | 0 (0.0%) | 0 (0.0%) |
| 20 to 34 years | 0 (0.0%) | 0 (0.0%) |
| 35 to 50 years | 0 (0.0%) | 19 (100.0%) |
| Total | 0 (0.0%) | 19 (100.0%) |
Fertility by Education in Warren Park
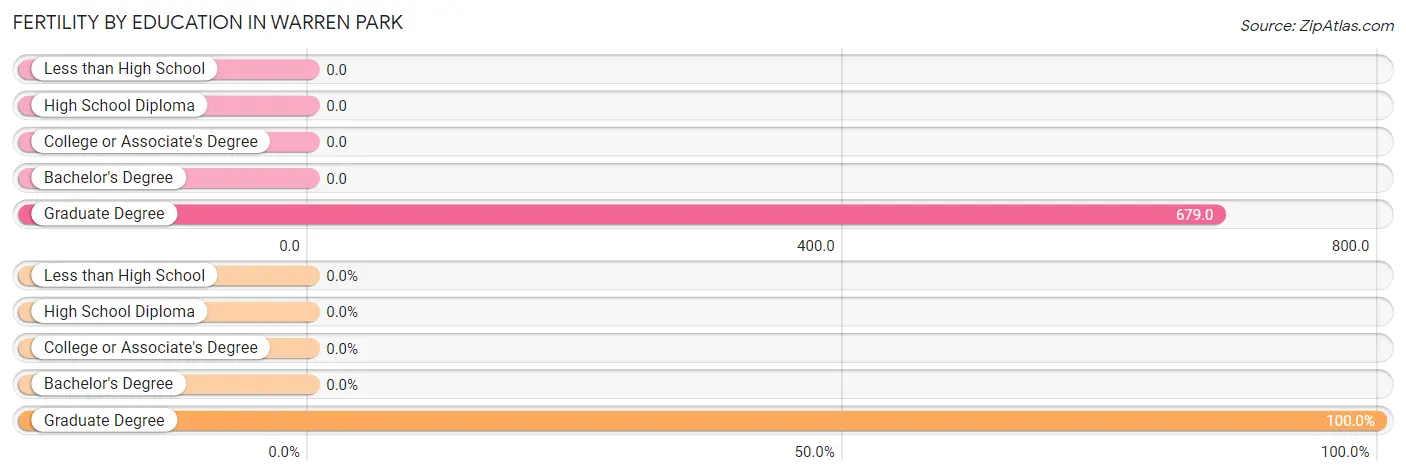
| Educational Attainment | Women with Births | Births / 1,000 Women |
| Less than High School | 0 (0.0%) | 0.0 |
| High School Diploma | 0 (0.0%) | 0.0 |
| College or Associate's Degree | 0 (0.0%) | 0.0 |
| Bachelor's Degree | 0 (0.0%) | 0.0 |
| Graduate Degree | 19 (100.0%) | 679.0 |
| Total | 19 (100.0%) | 97.0 |
Fertility by Education by Marriage Status in Warren Park
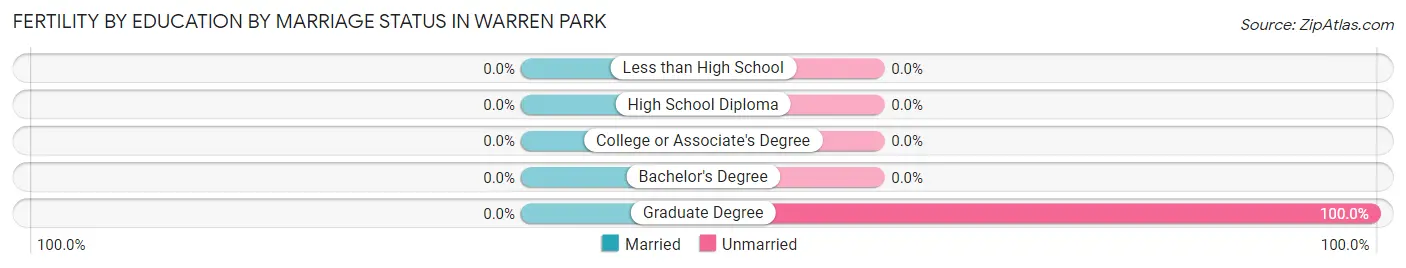
| Educational Attainment | Married | Unmarried |
| Less than High School | 0 (0.0%) | 0 (0.0%) |
| High School Diploma | 0 (0.0%) | 0 (0.0%) |
| College or Associate's Degree | 0 (0.0%) | 0 (0.0%) |
| Bachelor's Degree | 0 (0.0%) | 0 (0.0%) |
| Graduate Degree | 0 (0.0%) | 19 (100.0%) |
| Total | 0 (0.0%) | 19 (100.0%) |
Income in Warren Park
Income Overview in Warren Park
Per Capita Income in Warren Park is $50,166, while median incomes of families and households are $66,635 and $38,944 respectively.
| Characteristic | Number | Measure |
| Per Capita Income | 1,475 | $50,166 |
| Median Family Income | 303 | $66,635 |
| Mean Family Income | 303 | $157,466 |
| Median Household Income | 862 | $38,944 |
| Mean Household Income | 862 | $84,843 |
| Income Deficit | 303 | $0 |
| Wage / Income Gap (%) | 1,475 | 9.06% |
| Wage / Income Gap ($) | 1,475 | 90.94¢ per $1 |
| Gini / Inequality Index | 1,475 | 0.62 |
Earnings by Sex in Warren Park
Average Earnings in Warren Park are $36,058, $34,417 for men and $37,845 for women, a difference of 9.1%.
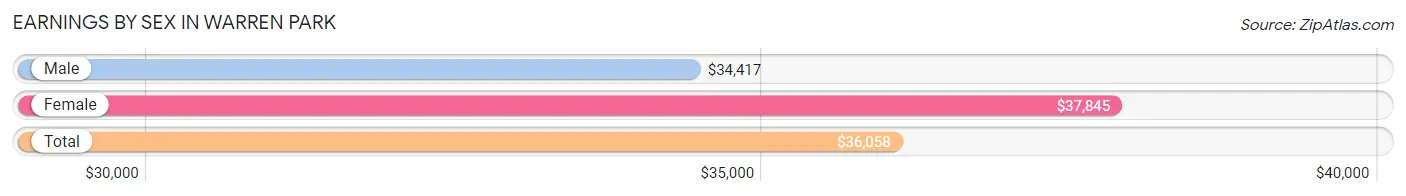
| Sex | Number | Average Earnings |
| Male | 309 (46.6%) | $34,417 |
| Female | 354 (53.4%) | $37,845 |
| Total | 663 (100.0%) | $36,058 |
Earnings by Sex by Income Bracket in Warren Park
The most common earnings brackets in Warren Park are $100,000+ for men (47 | 15.2%) and $100,000+ for women (46 | 13.0%).
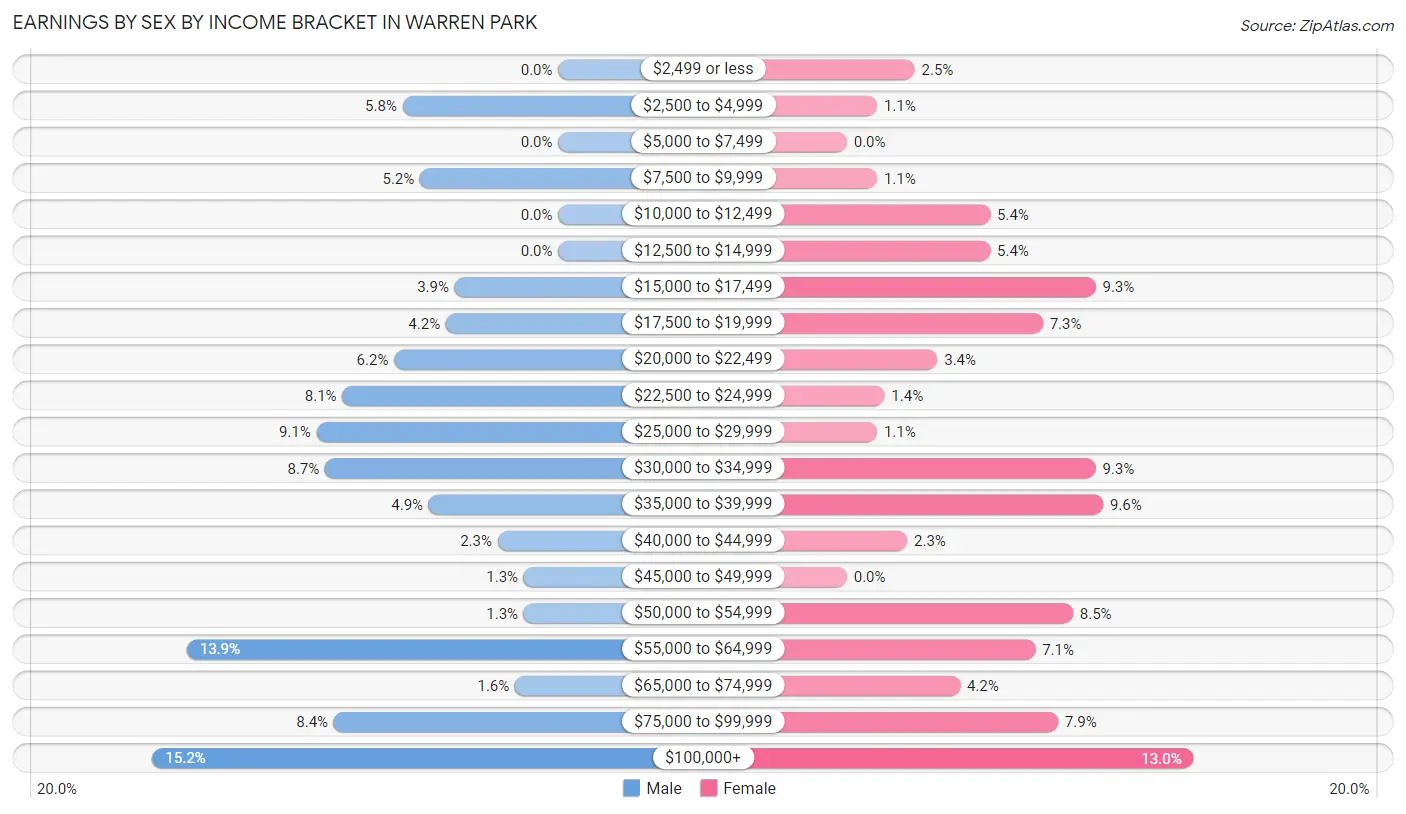
| Income | Male | Female |
| $2,499 or less | 0 (0.0%) | 9 (2.5%) |
| $2,500 to $4,999 | 18 (5.8%) | 4 (1.1%) |
| $5,000 to $7,499 | 0 (0.0%) | 0 (0.0%) |
| $7,500 to $9,999 | 16 (5.2%) | 4 (1.1%) |
| $10,000 to $12,499 | 0 (0.0%) | 19 (5.4%) |
| $12,500 to $14,999 | 0 (0.0%) | 19 (5.4%) |
| $15,000 to $17,499 | 12 (3.9%) | 33 (9.3%) |
| $17,500 to $19,999 | 13 (4.2%) | 26 (7.3%) |
| $20,000 to $22,499 | 19 (6.1%) | 12 (3.4%) |
| $22,500 to $24,999 | 25 (8.1%) | 5 (1.4%) |
| $25,000 to $29,999 | 28 (9.1%) | 4 (1.1%) |
| $30,000 to $34,999 | 27 (8.7%) | 33 (9.3%) |
| $35,000 to $39,999 | 15 (4.9%) | 34 (9.6%) |
| $40,000 to $44,999 | 7 (2.3%) | 8 (2.3%) |
| $45,000 to $49,999 | 4 (1.3%) | 0 (0.0%) |
| $50,000 to $54,999 | 4 (1.3%) | 30 (8.5%) |
| $55,000 to $64,999 | 43 (13.9%) | 25 (7.1%) |
| $65,000 to $74,999 | 5 (1.6%) | 15 (4.2%) |
| $75,000 to $99,999 | 26 (8.4%) | 28 (7.9%) |
| $100,000+ | 47 (15.2%) | 46 (13.0%) |
| Total | 309 (100.0%) | 354 (100.0%) |
Earnings by Sex by Educational Attainment in Warren Park
Average earnings in Warren Park are $37,188 for men and $38,879 for women, a difference of 4.3%. Men with an educational attainment of bachelor's degree enjoy the highest average annual earnings of $140,688, while those with college or associate's degree education earn the least with $26,023. Women with an educational attainment of graduate degree earn the most with the average annual earnings of $57,961, while those with less than high school education have the smallest earnings of $16,071.
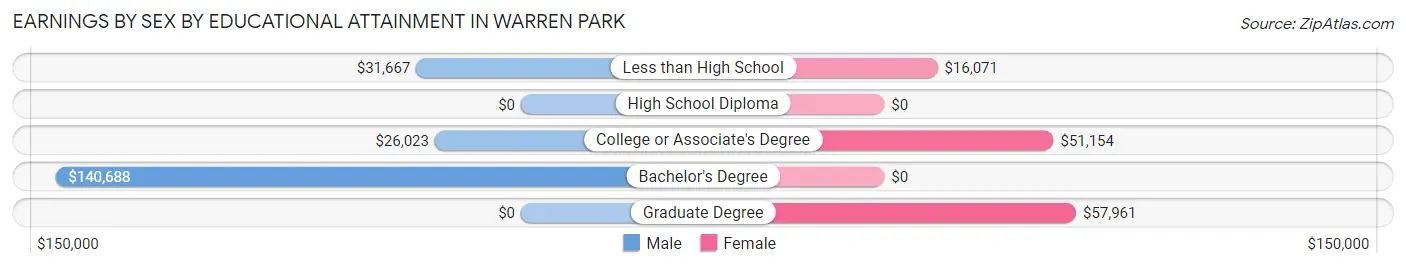
| Educational Attainment | Male Income | Female Income |
| Less than High School | $31,667 | $16,071 |
| High School Diploma | - | - |
| College or Associate's Degree | $26,023 | $51,154 |
| Bachelor's Degree | $140,688 | $0 |
| Graduate Degree | - | - |
| Total | $37,188 | $38,879 |
Family Income in Warren Park
Family Income Brackets in Warren Park
According to the Warren Park family income data, there are 70 families falling into the $35,000 to $49,999 income range, which is the most common income bracket and makes up 23.1% of all families.
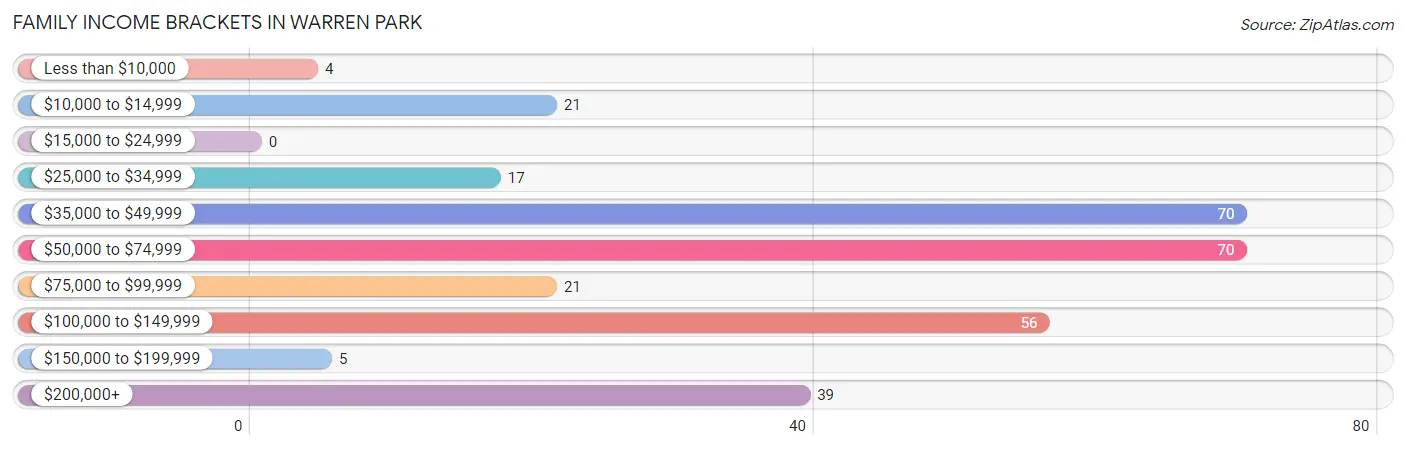
| Income Bracket | # Families | % Families |
| Less than $10,000 | 4 | 1.3% |
| $10,000 to $14,999 | 21 | 6.9% |
| $15,000 to $24,999 | 0 | 0.0% |
| $25,000 to $34,999 | 17 | 5.6% |
| $35,000 to $49,999 | 70 | 23.1% |
| $50,000 to $74,999 | 70 | 23.1% |
| $75,000 to $99,999 | 21 | 6.9% |
| $100,000 to $149,999 | 56 | 18.5% |
| $150,000 to $199,999 | 5 | 1.7% |
| $200,000+ | 39 | 12.9% |
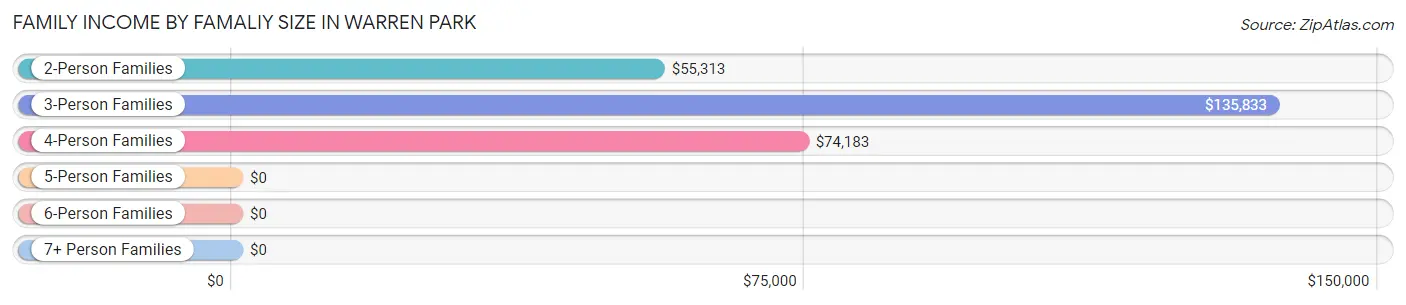
Family Income by Famaliy Size in Warren Park
3-person families (32 | 10.6%) account for the highest median family income in Warren Park with $135,833 per family, while 3-person families (32 | 10.6%) have the highest median income of $45,278 per family member.
| Income Bracket | # Families | Median Income |
| 2-Person Families | 226 (74.6%) | $55,313 |
| 3-Person Families | 32 (10.6%) | $135,833 |
| 4-Person Families | 35 (11.6%) | $74,183 |
| 5-Person Families | 0 (0.0%) | $0 |
| 6-Person Families | 0 (0.0%) | $0 |
| 7+ Person Families | 10 (3.3%) | $0 |
| Total | 303 (100.0%) | $66,635 |
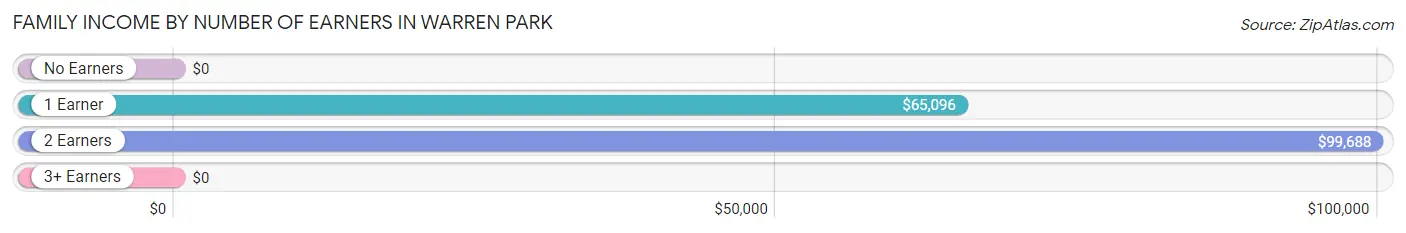
Family Income by Number of Earners in Warren Park
| Number of Earners | # Families | Median Income |
| No Earners | 47 (15.5%) | $0 |
| 1 Earner | 117 (38.6%) | $65,096 |
| 2 Earners | 125 (41.2%) | $99,688 |
| 3+ Earners | 14 (4.6%) | $0 |
| Total | 303 (100.0%) | $66,635 |
Household Income in Warren Park
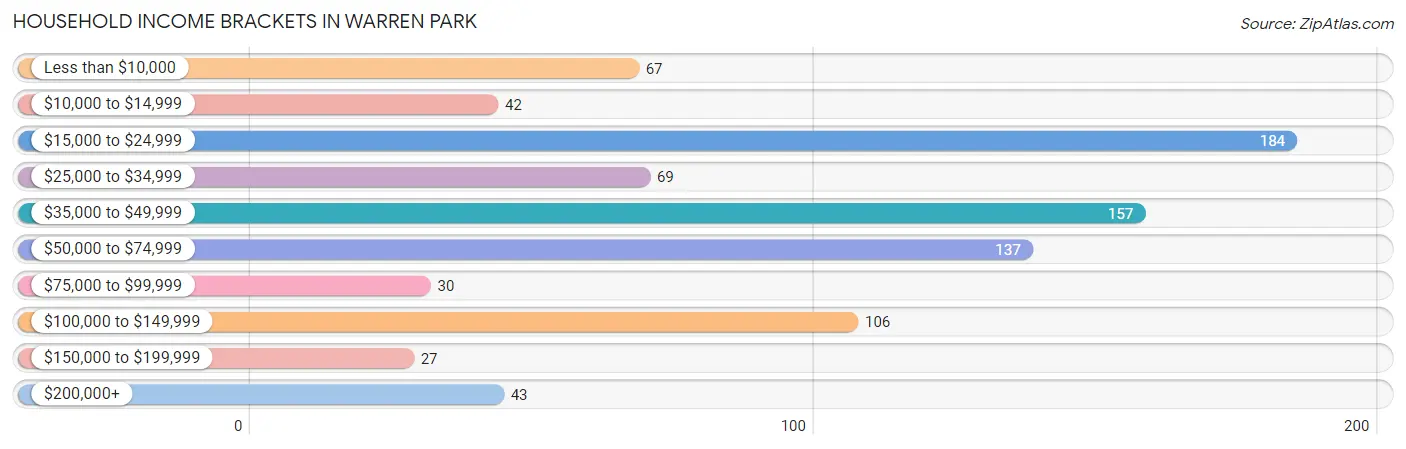
Household Income Brackets in Warren Park
With 184 households falling in the category, the $15,000 to $24,999 income range is the most frequent in Warren Park, accounting for 21.3% of all households. In contrast, only 27 households (3.1%) fall into the $150,000 to $199,999 income bracket, making it the least populous group.
| Income Bracket | # Households | % Households |
| Less than $10,000 | 67 | 7.8% |
| $10,000 to $14,999 | 42 | 4.9% |
| $15,000 to $24,999 | 184 | 21.3% |
| $25,000 to $34,999 | 69 | 8.0% |
| $35,000 to $49,999 | 157 | 18.2% |
| $50,000 to $74,999 | 137 | 15.9% |
| $75,000 to $99,999 | 30 | 3.5% |
| $100,000 to $149,999 | 106 | 12.3% |
| $150,000 to $199,999 | 27 | 3.1% |
| $200,000+ | 43 | 5.0% |
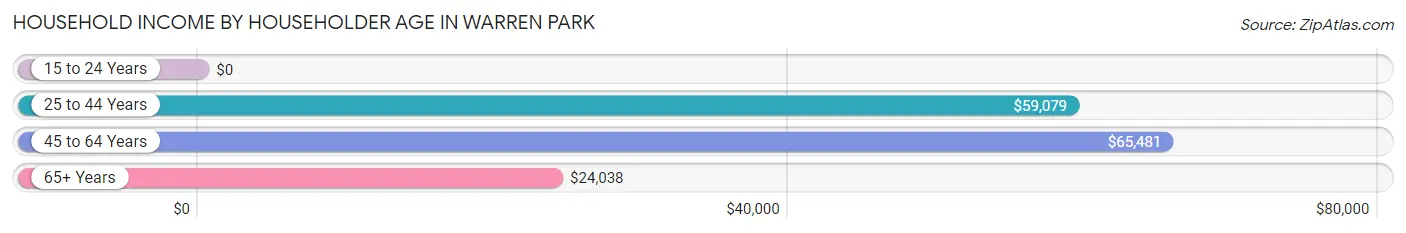
Household Income by Householder Age in Warren Park
The median household income in Warren Park is $38,944, with the highest median household income of $65,481 found in the 45 to 64 years age bracket for the primary householder. A total of 253 households (29.3%) fall into this category. Meanwhile, the 15 to 24 years age bracket for the primary householder has the lowest median household income of $0, with 21 households (2.4%) in this group.
| Income Bracket | # Households | Median Income |
| 15 to 24 Years | 21 (2.4%) | $0 |
| 25 to 44 Years | 182 (21.1%) | $59,079 |
| 45 to 64 Years | 253 (29.3%) | $65,481 |
| 65+ Years | 406 (47.1%) | $24,038 |
| Total | 862 (100.0%) | $38,944 |
Poverty in Warren Park
Income Below Poverty by Sex and Age in Warren Park
With 8.7% poverty level for males and 12.0% for females among the residents of Warren Park, 16 and 17 year old males and 6 to 11 year old females are the most vulnerable to poverty, with 13 males (100.0%) and 5 females (50.0%) in their respective age groups living below the poverty level.
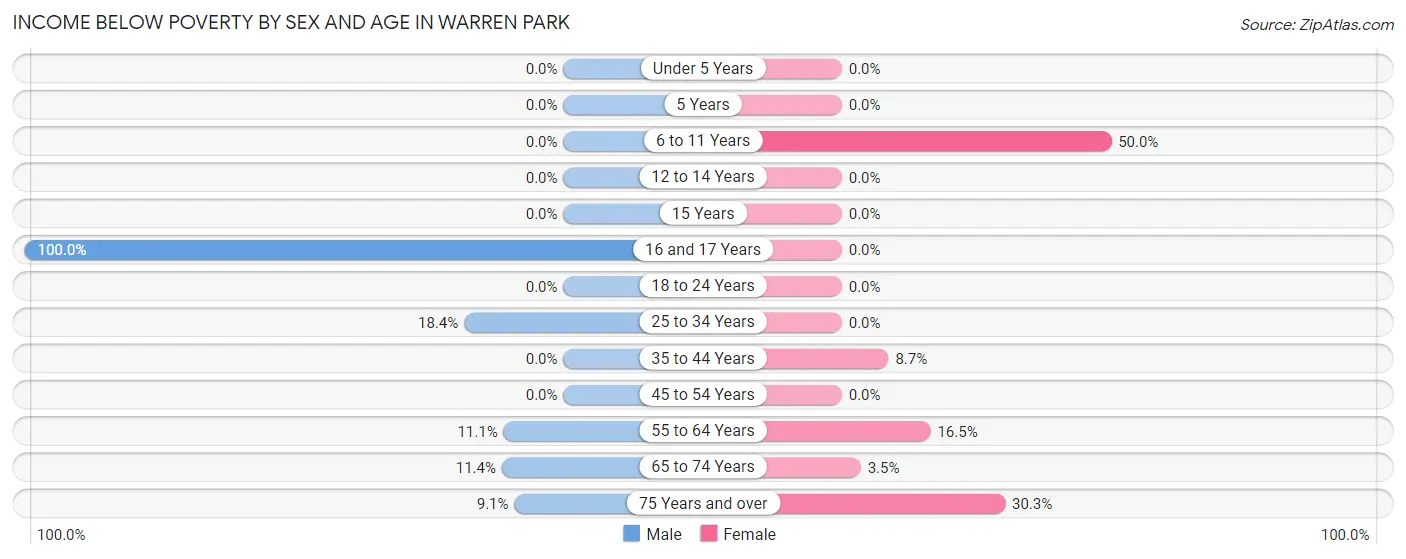
| Age Bracket | Male | Female |
| Under 5 Years | 0 (0.0%) | 0 (0.0%) |
| 5 Years | 0 (0.0%) | 0 (0.0%) |
| 6 to 11 Years | 0 (0.0%) | 5 (50.0%) |
| 12 to 14 Years | 0 (0.0%) | 0 (0.0%) |
| 15 Years | 0 (0.0%) | 0 (0.0%) |
| 16 and 17 Years | 13 (100.0%) | 0 (0.0%) |
| 18 to 24 Years | 0 (0.0%) | 0 (0.0%) |
| 25 to 34 Years | 14 (18.4%) | 0 (0.0%) |
| 35 to 44 Years | 0 (0.0%) | 11 (8.7%) |
| 45 to 54 Years | 0 (0.0%) | 0 (0.0%) |
| 55 to 64 Years | 8 (11.1%) | 26 (16.5%) |
| 65 to 74 Years | 8 (11.4%) | 6 (3.5%) |
| 75 Years and over | 4 (9.1%) | 60 (30.3%) |
| Total | 47 (8.7%) | 108 (12.0%) |
Income Above Poverty by Sex and Age in Warren Park
According to the poverty statistics in Warren Park, males aged under 5 years and females aged under 5 years are the age groups that are most secure financially, with 100.0% of males and 100.0% of females in these age groups living above the poverty line.
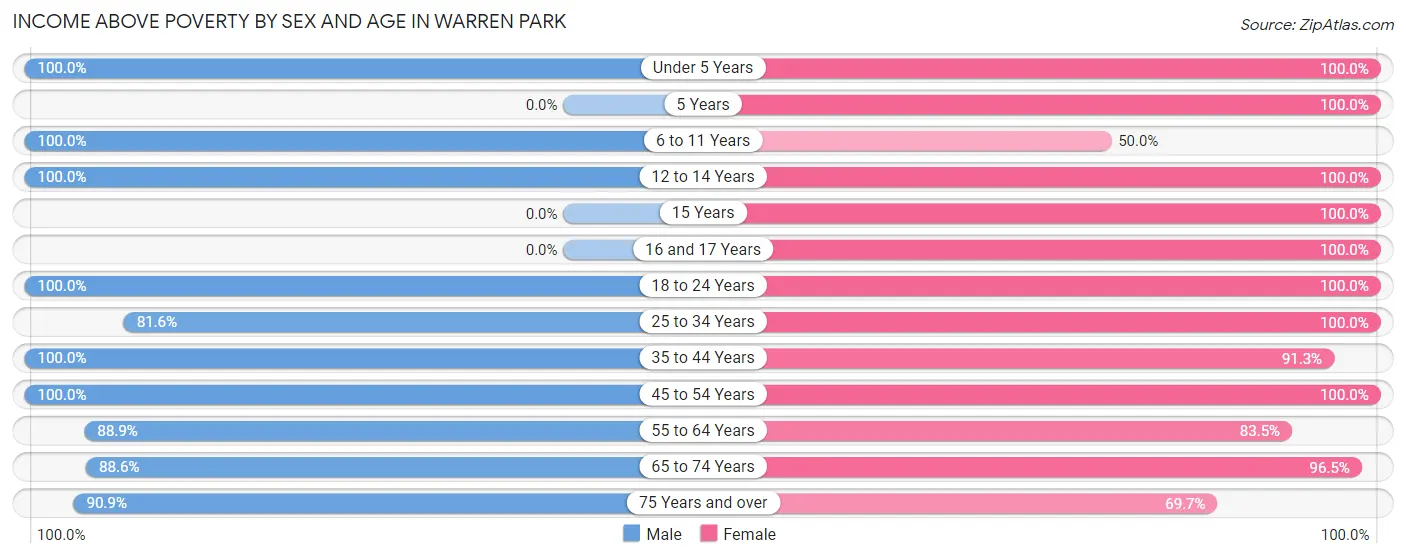
| Age Bracket | Male | Female |
| Under 5 Years | 77 (100.0%) | 20 (100.0%) |
| 5 Years | 0 (0.0%) | 59 (100.0%) |
| 6 to 11 Years | 13 (100.0%) | 5 (50.0%) |
| 12 to 14 Years | 4 (100.0%) | 19 (100.0%) |
| 15 Years | 0 (0.0%) | 5 (100.0%) |
| 16 and 17 Years | 0 (0.0%) | 15 (100.0%) |
| 18 to 24 Years | 21 (100.0%) | 36 (100.0%) |
| 25 to 34 Years | 62 (81.6%) | 8 (100.0%) |
| 35 to 44 Years | 56 (100.0%) | 116 (91.3%) |
| 45 to 54 Years | 96 (100.0%) | 74 (100.0%) |
| 55 to 64 Years | 64 (88.9%) | 132 (83.5%) |
| 65 to 74 Years | 62 (88.6%) | 165 (96.5%) |
| 75 Years and over | 40 (90.9%) | 138 (69.7%) |
| Total | 495 (91.3%) | 792 (88.0%) |
Income Below Poverty Among Married-Couple Families in Warren Park
The poverty statistics for married-couple families in Warren Park show that 2.4% or 4 of the total 169 families live below the poverty line. Families with no children have the highest poverty rate of 2.9%, comprising of 4 families. On the other hand, families with 1 or 2 children have the lowest poverty rate of 0.0%, which includes 0 families.
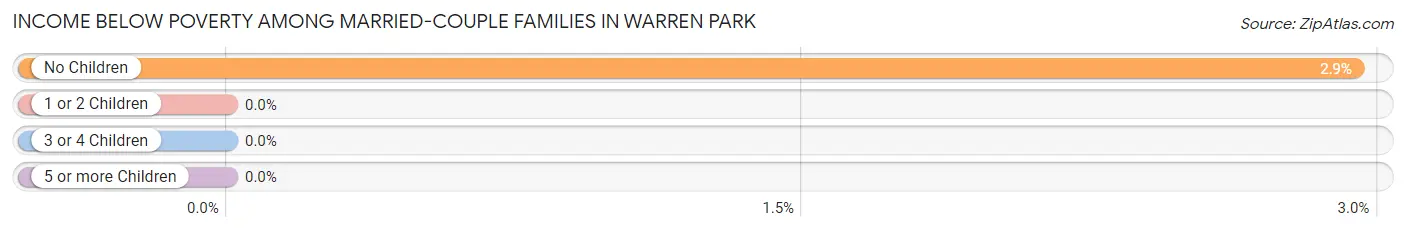
| Children | Above Poverty | Below Poverty |
| No Children | 132 (97.1%) | 4 (2.9%) |
| 1 or 2 Children | 23 (100.0%) | 0 (0.0%) |
| 3 or 4 Children | 10 (100.0%) | 0 (0.0%) |
| 5 or more Children | 0 (0.0%) | 0 (0.0%) |
| Total | 165 (97.6%) | 4 (2.4%) |
Income Below Poverty Among Single-Parent Households in Warren Park
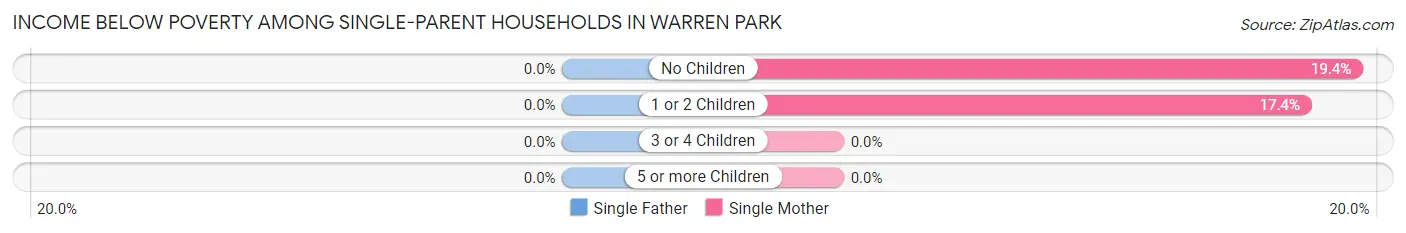
| Children | Single Father | Single Mother |
| No Children | 0 (0.0%) | 6 (19.4%) |
| 1 or 2 Children | 0 (0.0%) | 15 (17.4%) |
| 3 or 4 Children | 0 (0.0%) | 0 (0.0%) |
| 5 or more Children | 0 (0.0%) | 0 (0.0%) |
| Total | 0 (0.0%) | 21 (17.9%) |
Income Below Poverty Among Married-Couple vs Single-Parent Households in Warren Park
The poverty data for Warren Park shows that 4 of the married-couple family households (2.4%) and 21 of the single-parent households (15.7%) are living below the poverty level. Within the married-couple family households, those with no children have the highest poverty rate, with 4 households (2.9%) falling below the poverty line. Among the single-parent households, those with 1 or 2 children have the highest poverty rate, with 15 household (17.4%) living below poverty.
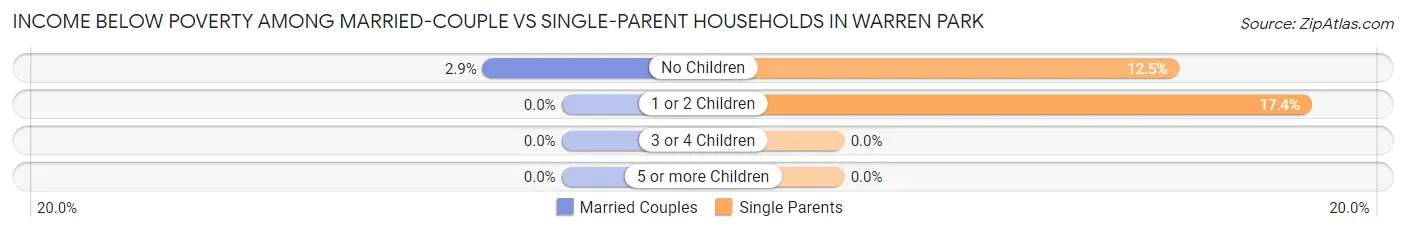
| Children | Married-Couple Families | Single-Parent Households |
| No Children | 4 (2.9%) | 6 (12.5%) |
| 1 or 2 Children | 0 (0.0%) | 15 (17.4%) |
| 3 or 4 Children | 0 (0.0%) | 0 (0.0%) |
| 5 or more Children | 0 (0.0%) | 0 (0.0%) |
| Total | 4 (2.4%) | 21 (15.7%) |
Employment Characteristics in Warren Park
Employment by Class of Employer in Warren Park
Among the 619 employed individuals in Warren Park, private company employees (460 | 74.3%), not-for-profit organizations (49 | 7.9%), and self-employed (not incorporated) (40 | 6.5%) make up the most common classes of employment.
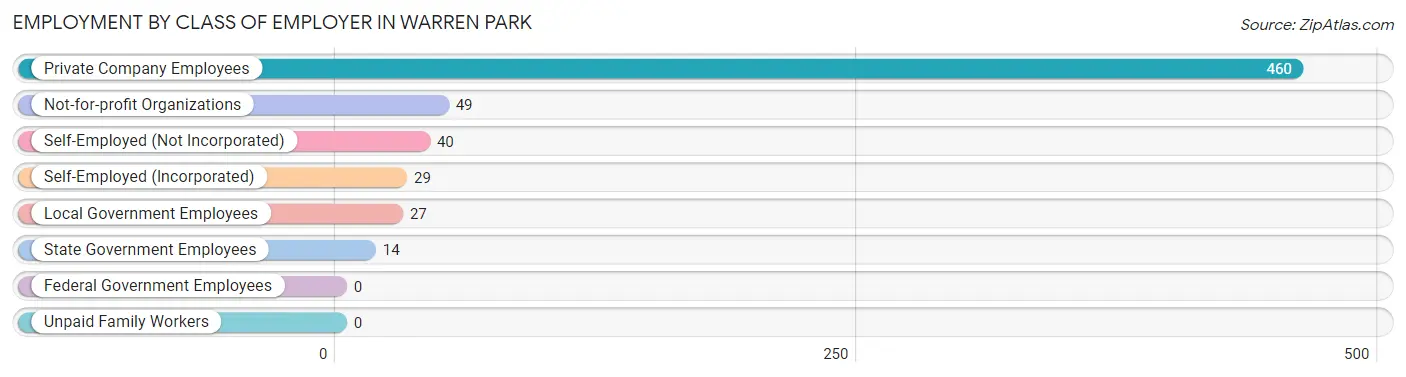
| Employer Class | # Employees | % Employees |
| Private Company Employees | 460 | 74.3% |
| Self-Employed (Incorporated) | 29 | 4.7% |
| Self-Employed (Not Incorporated) | 40 | 6.5% |
| Not-for-profit Organizations | 49 | 7.9% |
| Local Government Employees | 27 | 4.4% |
| State Government Employees | 14 | 2.3% |
| Federal Government Employees | 0 | 0.0% |
| Unpaid Family Workers | 0 | 0.0% |
| Total | 619 | 100.0% |
Employment Status by Age in Warren Park
According to the labor force statistics for Warren Park, out of the total population over 16 years of age (1,235), 51.8% or 640 individuals are in the labor force, with 3.3% or 21 of them unemployed. The age group with the highest labor force participation rate is 20 to 24 years, with 100.0% or 35 individuals in the labor force. Within the labor force, the 30 to 34 years age range has the highest percentage of unemployed individuals, with 31.7% or 13 of them being unemployed.
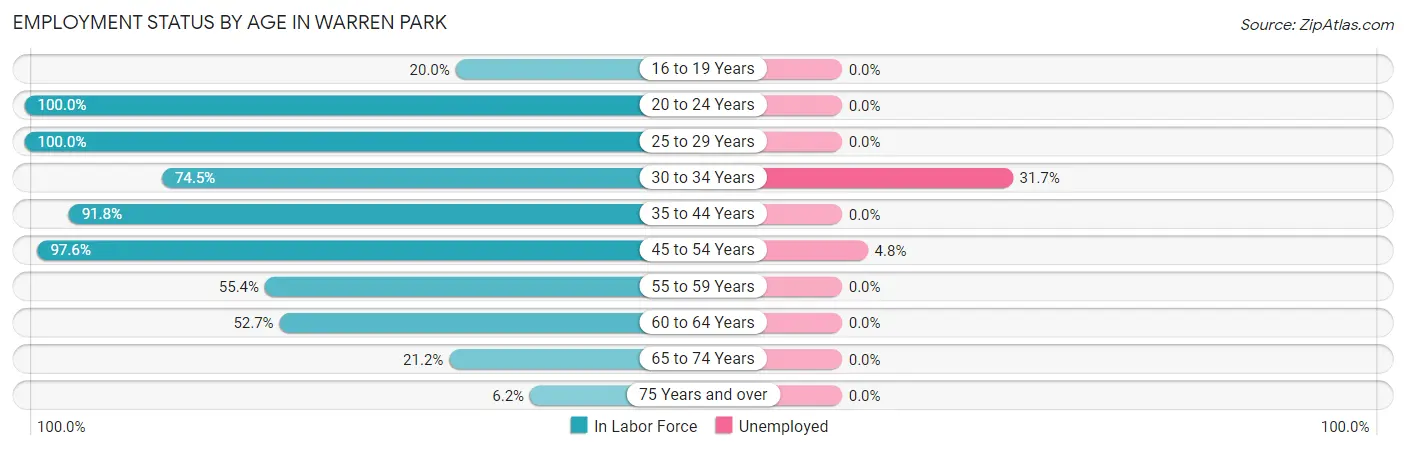
| Age Bracket | In Labor Force | Unemployed |
| 16 to 19 Years | 10 (20.0%) | 0 (0.0%) |
| 20 to 24 Years | 35 (100.0%) | 0 (0.0%) |
| 25 to 29 Years | 29 (100.0%) | 0 (0.0%) |
| 30 to 34 Years | 41 (74.5%) | 13 (31.7%) |
| 35 to 44 Years | 168 (91.8%) | 0 (0.0%) |
| 45 to 54 Years | 166 (97.6%) | 8 (4.8%) |
| 55 to 59 Years | 77 (55.4%) | 0 (0.0%) |
| 60 to 64 Years | 48 (52.7%) | 0 (0.0%) |
| 65 to 74 Years | 51 (21.2%) | 0 (0.0%) |
| 75 Years and over | 15 (6.2%) | 0 (0.0%) |
| Total | 640 (51.8%) | 21 (3.3%) |
Employment Status by Educational Attainment in Warren Park
According to labor force statistics for Warren Park, 79.3% of individuals (529) out of the total population between 25 and 64 years of age (667) are in the labor force, with 4.0% or 21 of them being unemployed. The group with the highest labor force participation rate are those with the educational attainment of bachelor's degree or higher, with 94.7% or 143 individuals in the labor force. Within the labor force, individuals with college / associate degree education have the highest percentage of unemployment, with 9.0% or 17 of them being unemployed.
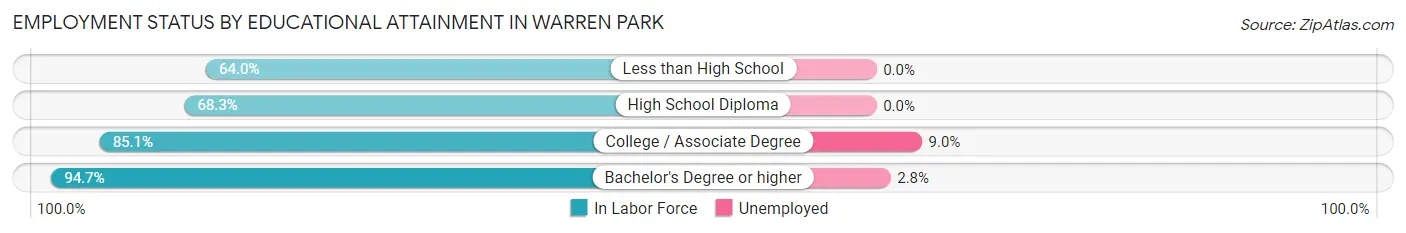
| Educational Attainment | In Labor Force | Unemployed |
| Less than High School | 57 (64.0%) | 0 (0.0%) |
| High School Diploma | 140 (68.3%) | 0 (0.0%) |
| College / Associate Degree | 189 (85.1%) | 20 (9.0%) |
| Bachelor's Degree or higher | 143 (94.7%) | 4 (2.8%) |
| Total | 529 (79.3%) | 27 (4.0%) |
Employment Occupations by Sex in Warren Park
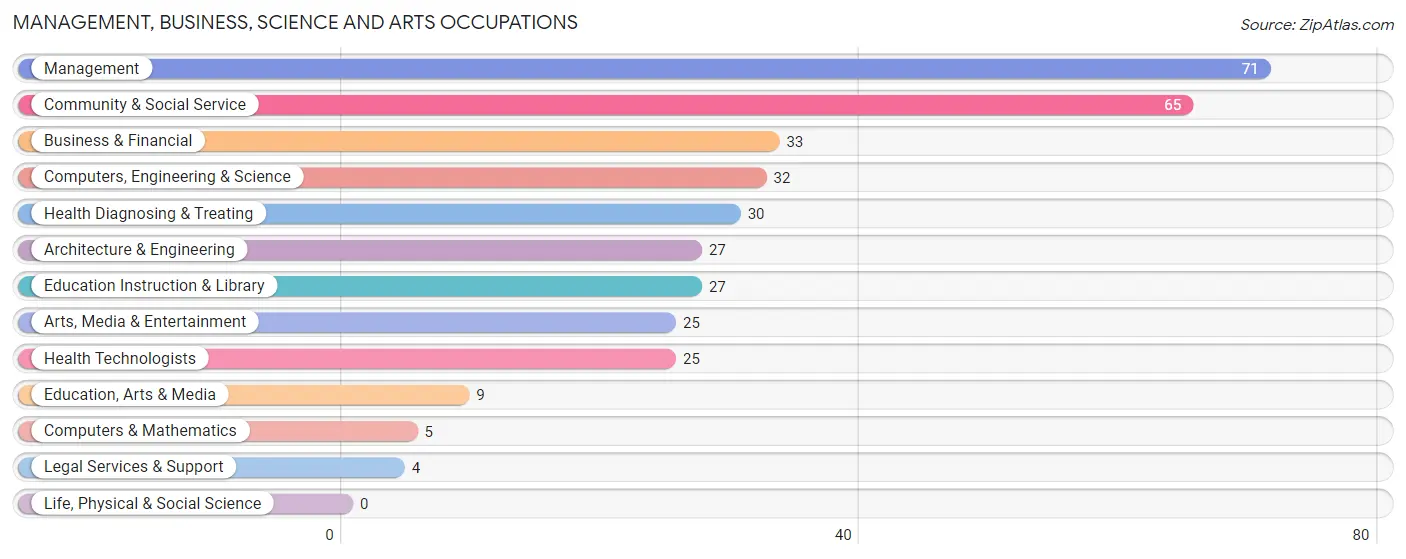
Management, Business, Science and Arts Occupations
The most common Management, Business, Science and Arts occupations in Warren Park are Management (71 | 11.5%), Community & Social Service (65 | 10.5%), Business & Financial (33 | 5.3%), Computers, Engineering & Science (32 | 5.2%), and Health Diagnosing & Treating (30 | 4.9%).
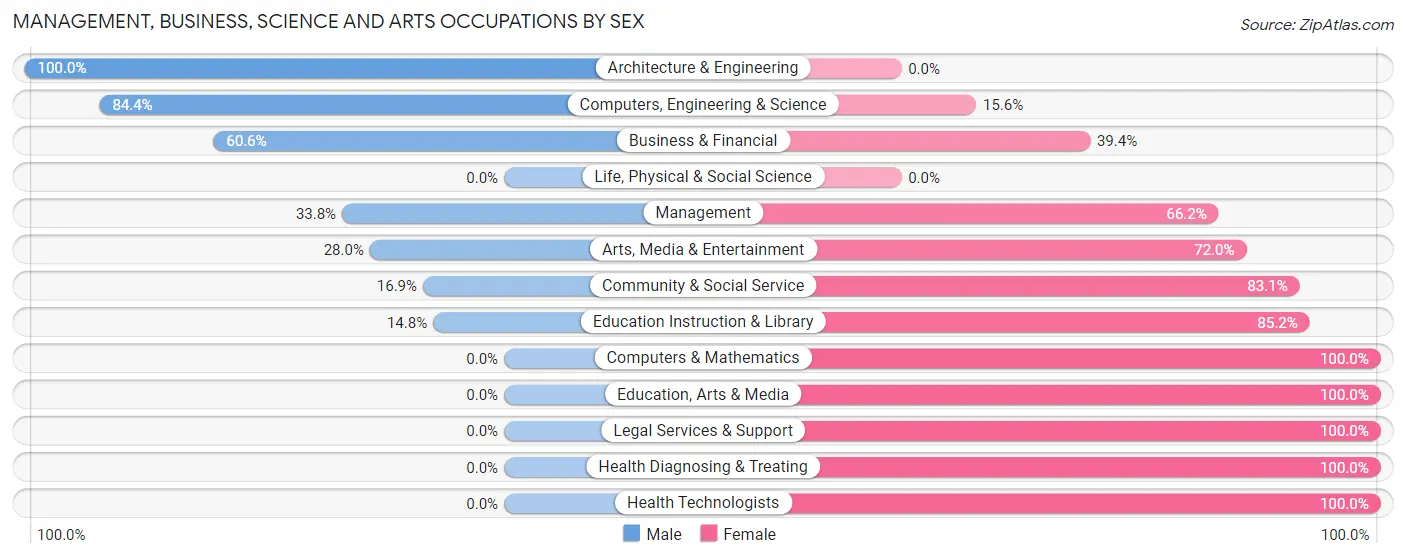
Management, Business, Science and Arts Occupations by Sex
Within the Management, Business, Science and Arts occupations in Warren Park, the most male-oriented occupations are Architecture & Engineering (100.0%), Computers, Engineering & Science (84.4%), and Business & Financial (60.6%), while the most female-oriented occupations are Computers & Mathematics (100.0%), Education, Arts & Media (100.0%), and Legal Services & Support (100.0%).
| Occupation | Male | Female |
| Management | 24 (33.8%) | 47 (66.2%) |
| Business & Financial | 20 (60.6%) | 13 (39.4%) |
| Computers, Engineering & Science | 27 (84.4%) | 5 (15.6%) |
| Computers & Mathematics | 0 (0.0%) | 5 (100.0%) |
| Architecture & Engineering | 27 (100.0%) | 0 (0.0%) |
| Life, Physical & Social Science | 0 (0.0%) | 0 (0.0%) |
| Community & Social Service | 11 (16.9%) | 54 (83.1%) |
| Education, Arts & Media | 0 (0.0%) | 9 (100.0%) |
| Legal Services & Support | 0 (0.0%) | 4 (100.0%) |
| Education Instruction & Library | 4 (14.8%) | 23 (85.2%) |
| Arts, Media & Entertainment | 7 (28.0%) | 18 (72.0%) |
| Health Diagnosing & Treating | 0 (0.0%) | 30 (100.0%) |
| Health Technologists | 0 (0.0%) | 25 (100.0%) |
| Total (Category) | 82 (35.5%) | 149 (64.5%) |
| Total (Overall) | 295 (47.7%) | 324 (52.3%) |
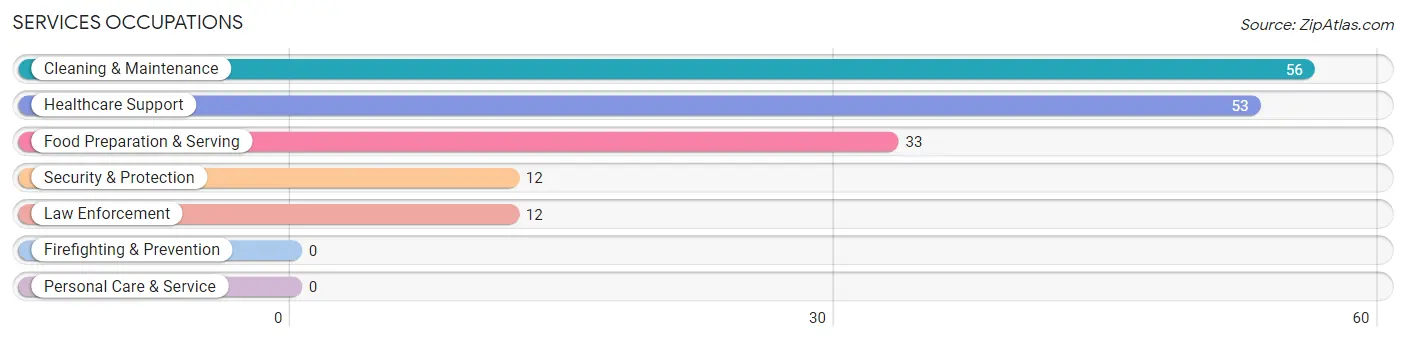
Services Occupations
The most common Services occupations in Warren Park are Cleaning & Maintenance (56 | 9.0%), Healthcare Support (53 | 8.6%), Food Preparation & Serving (33 | 5.3%), Security & Protection (12 | 1.9%), and Law Enforcement (12 | 1.9%).
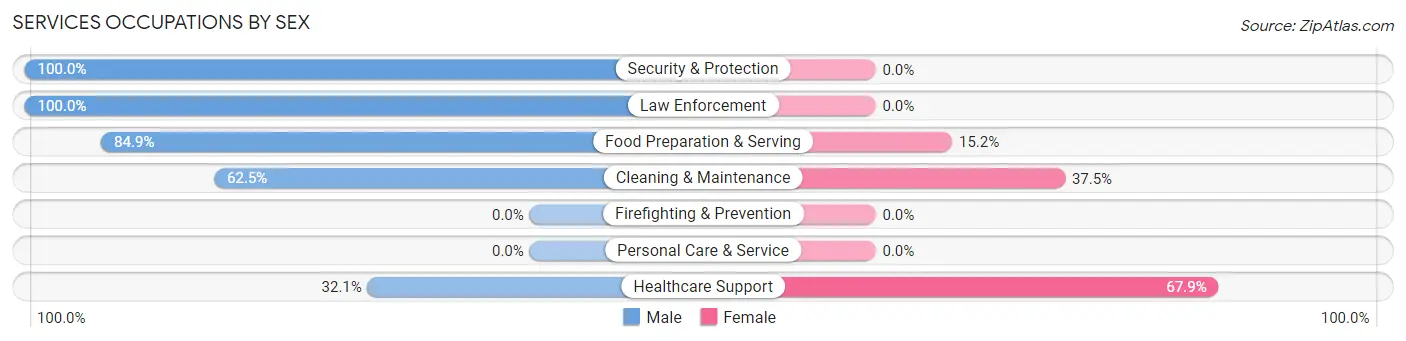
Services Occupations by Sex
Within the Services occupations in Warren Park, the most male-oriented occupations are Security & Protection (100.0%), Law Enforcement (100.0%), and Food Preparation & Serving (84.9%), while the most female-oriented occupations are Healthcare Support (67.9%), Cleaning & Maintenance (37.5%), and Food Preparation & Serving (15.1%).
| Occupation | Male | Female |
| Healthcare Support | 17 (32.1%) | 36 (67.9%) |
| Security & Protection | 12 (100.0%) | 0 (0.0%) |
| Firefighting & Prevention | 0 (0.0%) | 0 (0.0%) |
| Law Enforcement | 12 (100.0%) | 0 (0.0%) |
| Food Preparation & Serving | 28 (84.9%) | 5 (15.1%) |
| Cleaning & Maintenance | 35 (62.5%) | 21 (37.5%) |
| Personal Care & Service | 0 (0.0%) | 0 (0.0%) |
| Total (Category) | 92 (59.7%) | 62 (40.3%) |
| Total (Overall) | 295 (47.7%) | 324 (52.3%) |
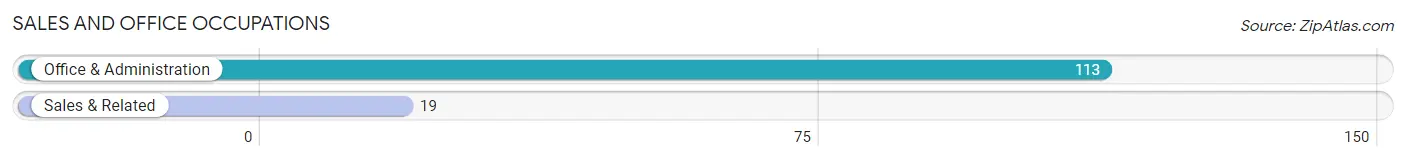
Sales and Office Occupations
The most common Sales and Office occupations in Warren Park are Office & Administration (113 | 18.3%), and Sales & Related (19 | 3.1%).
Sales and Office Occupations by Sex
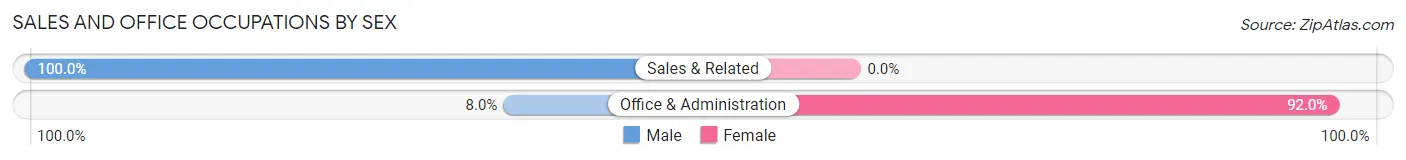
| Occupation | Male | Female |
| Sales & Related | 19 (100.0%) | 0 (0.0%) |
| Office & Administration | 9 (8.0%) | 104 (92.0%) |
| Total (Category) | 28 (21.2%) | 104 (78.8%) |
| Total (Overall) | 295 (47.7%) | 324 (52.3%) |
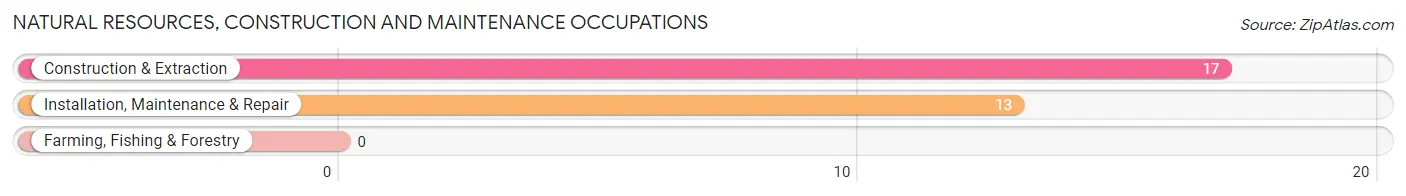
Natural Resources, Construction and Maintenance Occupations
The most common Natural Resources, Construction and Maintenance occupations in Warren Park are Construction & Extraction (17 | 2.8%), and Installation, Maintenance & Repair (13 | 2.1%).
Natural Resources, Construction and Maintenance Occupations by Sex
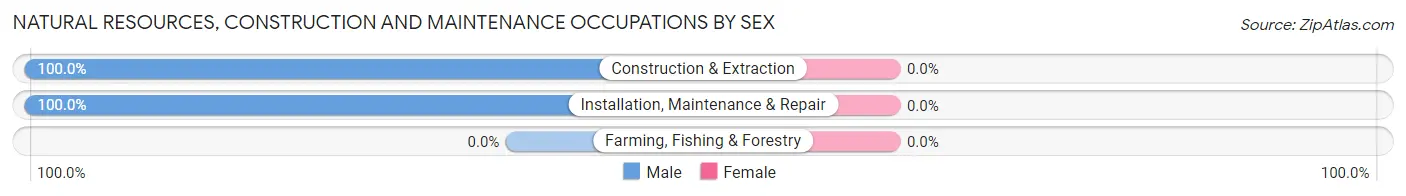
| Occupation | Male | Female |
| Farming, Fishing & Forestry | 0 (0.0%) | 0 (0.0%) |
| Construction & Extraction | 17 (100.0%) | 0 (0.0%) |
| Installation, Maintenance & Repair | 13 (100.0%) | 0 (0.0%) |
| Total (Category) | 30 (100.0%) | 0 (0.0%) |
| Total (Overall) | 295 (47.7%) | 324 (52.3%) |
Production, Transportation and Moving Occupations
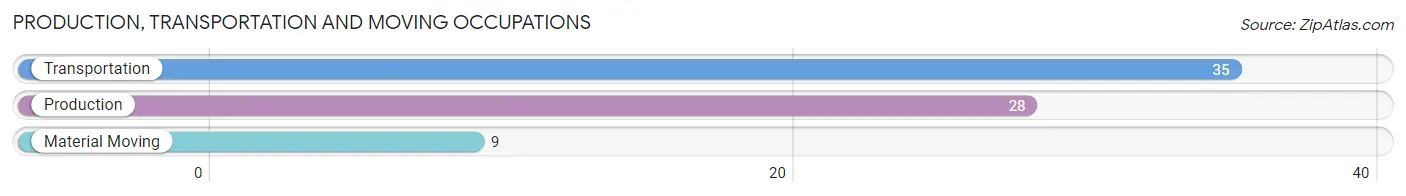
The most common Production, Transportation and Moving occupations in Warren Park are Transportation (35 | 5.7%), Production (28 | 4.5%), and Material Moving (9 | 1.5%).
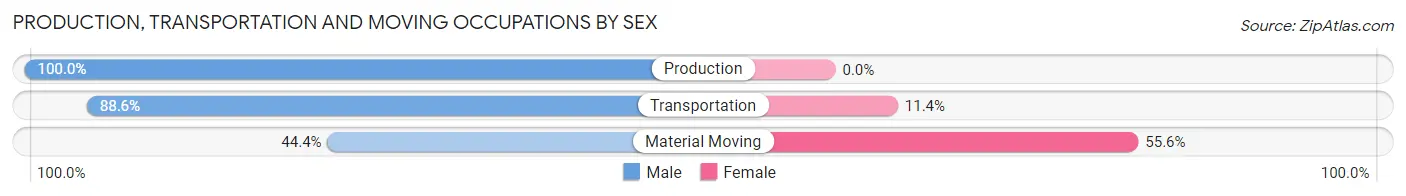
Production, Transportation and Moving Occupations by Sex
| Occupation | Male | Female |
| Production | 28 (100.0%) | 0 (0.0%) |
| Transportation | 31 (88.6%) | 4 (11.4%) |
| Material Moving | 4 (44.4%) | 5 (55.6%) |
| Total (Category) | 63 (87.5%) | 9 (12.5%) |
| Total (Overall) | 295 (47.7%) | 324 (52.3%) |
Employment Industries by Sex in Warren Park
Employment Industries in Warren Park
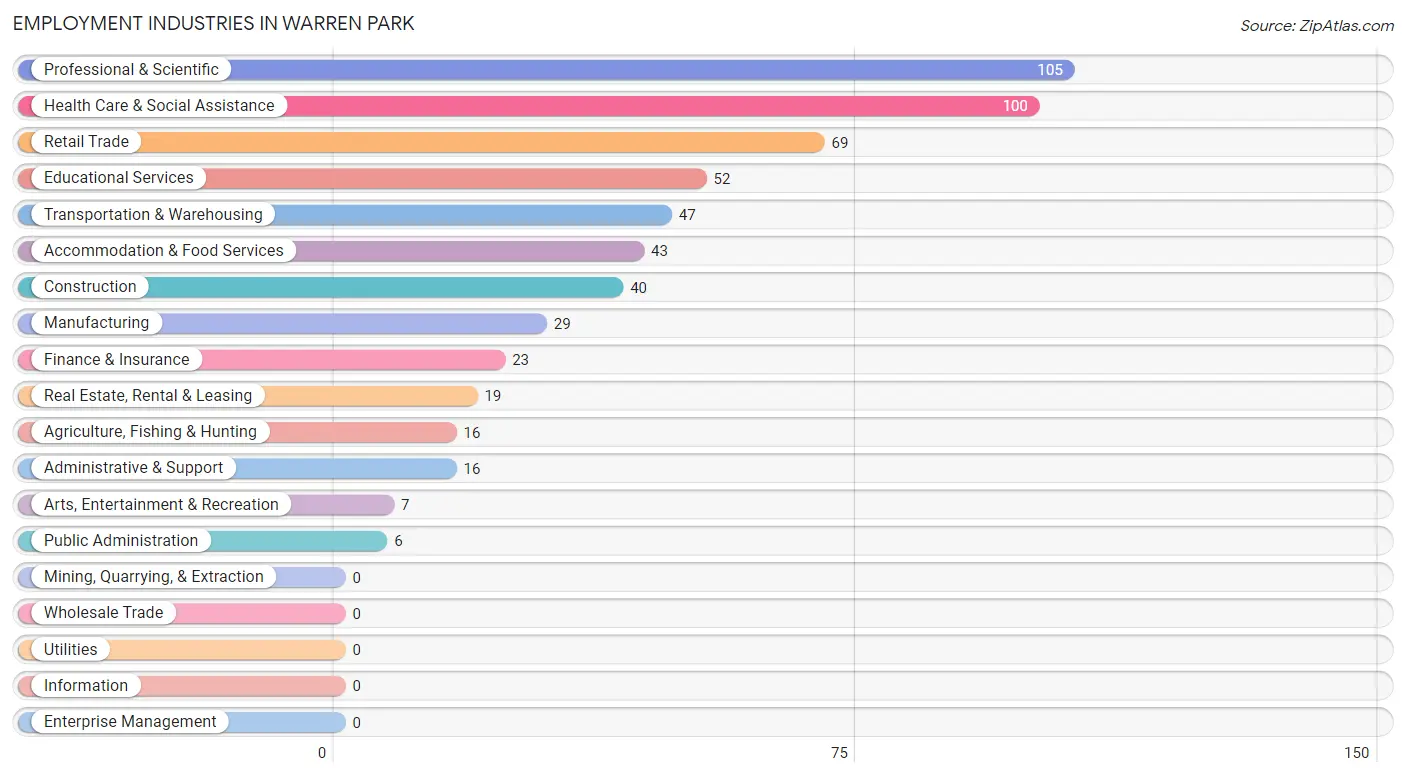
The major employment industries in Warren Park include Professional & Scientific (105 | 17.0%), Health Care & Social Assistance (100 | 16.2%), Retail Trade (69 | 11.2%), Educational Services (52 | 8.4%), and Transportation & Warehousing (47 | 7.6%).
Employment Industries by Sex in Warren Park
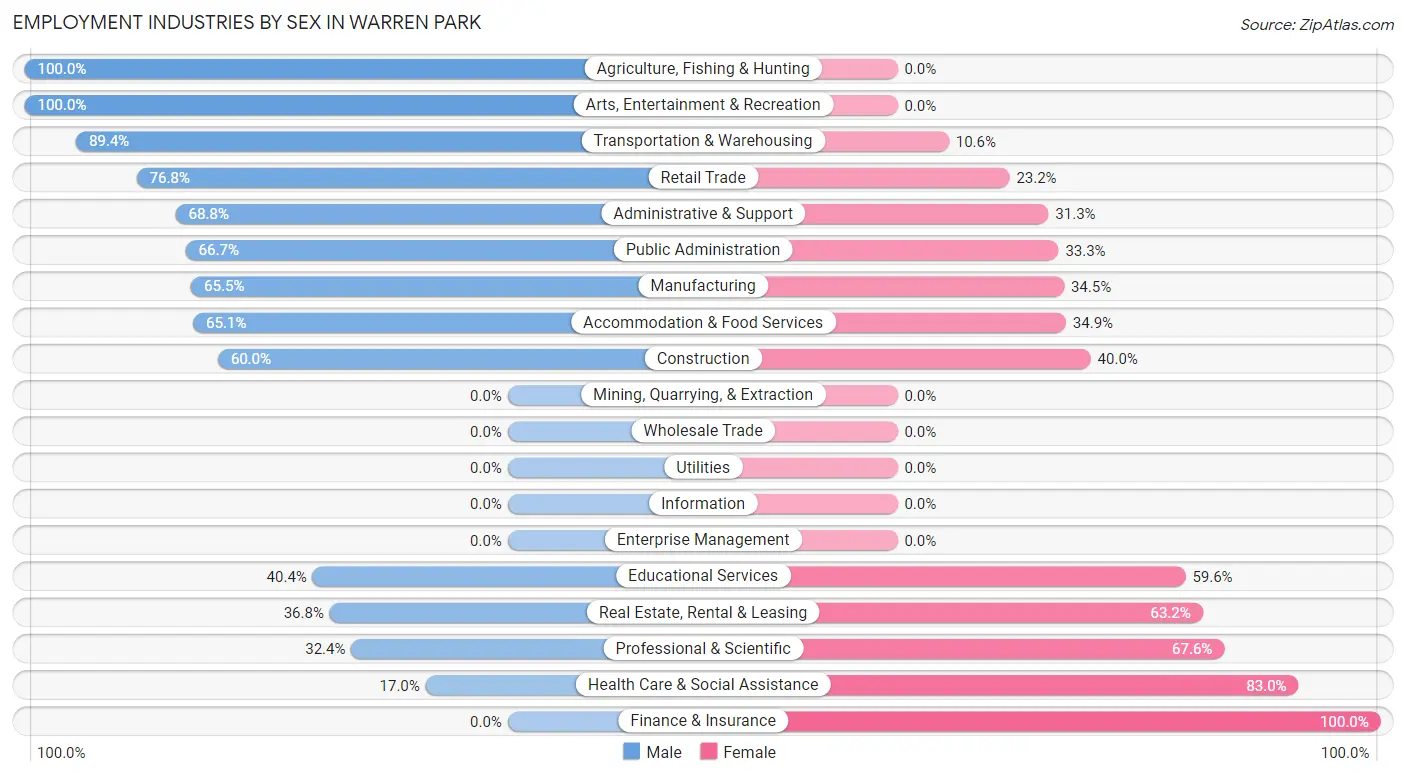
The Warren Park industries that see more men than women are Agriculture, Fishing & Hunting (100.0%), Arts, Entertainment & Recreation (100.0%), and Transportation & Warehousing (89.4%), whereas the industries that tend to have a higher number of women are Finance & Insurance (100.0%), Health Care & Social Assistance (83.0%), and Professional & Scientific (67.6%).
| Industry | Male | Female |
| Agriculture, Fishing & Hunting | 16 (100.0%) | 0 (0.0%) |
| Mining, Quarrying, & Extraction | 0 (0.0%) | 0 (0.0%) |
| Construction | 24 (60.0%) | 16 (40.0%) |
| Manufacturing | 19 (65.5%) | 10 (34.5%) |
| Wholesale Trade | 0 (0.0%) | 0 (0.0%) |
| Retail Trade | 53 (76.8%) | 16 (23.2%) |
| Transportation & Warehousing | 42 (89.4%) | 5 (10.6%) |
| Utilities | 0 (0.0%) | 0 (0.0%) |
| Information | 0 (0.0%) | 0 (0.0%) |
| Finance & Insurance | 0 (0.0%) | 23 (100.0%) |
| Real Estate, Rental & Leasing | 7 (36.8%) | 12 (63.2%) |
| Professional & Scientific | 34 (32.4%) | 71 (67.6%) |
| Enterprise Management | 0 (0.0%) | 0 (0.0%) |
| Administrative & Support | 11 (68.8%) | 5 (31.2%) |
| Educational Services | 21 (40.4%) | 31 (59.6%) |
| Health Care & Social Assistance | 17 (17.0%) | 83 (83.0%) |
| Arts, Entertainment & Recreation | 7 (100.0%) | 0 (0.0%) |
| Accommodation & Food Services | 28 (65.1%) | 15 (34.9%) |
| Public Administration | 4 (66.7%) | 2 (33.3%) |
| Total | 295 (47.7%) | 324 (52.3%) |
Education in Warren Park
School Enrollment in Warren Park
The most common levels of schooling among the 200 students in Warren Park are elementary school (51 | 25.5%), high school (45 | 22.5%), and college / undergraduate (41 | 20.5%).
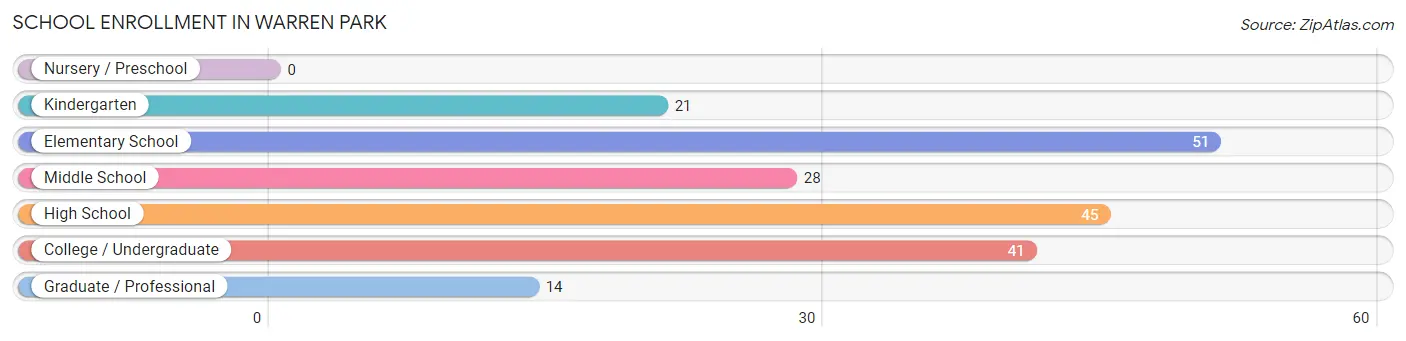
| School Level | # Students | % Students |
| Nursery / Preschool | 0 | 0.0% |
| Kindergarten | 21 | 10.5% |
| Elementary School | 51 | 25.5% |
| Middle School | 28 | 14.0% |
| High School | 45 | 22.5% |
| College / Undergraduate | 41 | 20.5% |
| Graduate / Professional | 14 | 7.0% |
| Total | 200 | 100.0% |
School Enrollment by Age by Funding Source in Warren Park
Out of a total of 200 students who are enrolled in schools in Warren Park, 23 (11.5%) attend a private institution, while the remaining 177 (88.5%) are enrolled in public schools. The age group of 10 to 14 year olds has the highest likelihood of being enrolled in private schools, with 9 (32.1% in the age bracket) enrolled. Conversely, the age group of 18 to 19 year olds has the lowest likelihood of being enrolled in a private school, with 22 (100.0% in the age bracket) attending a public institution.
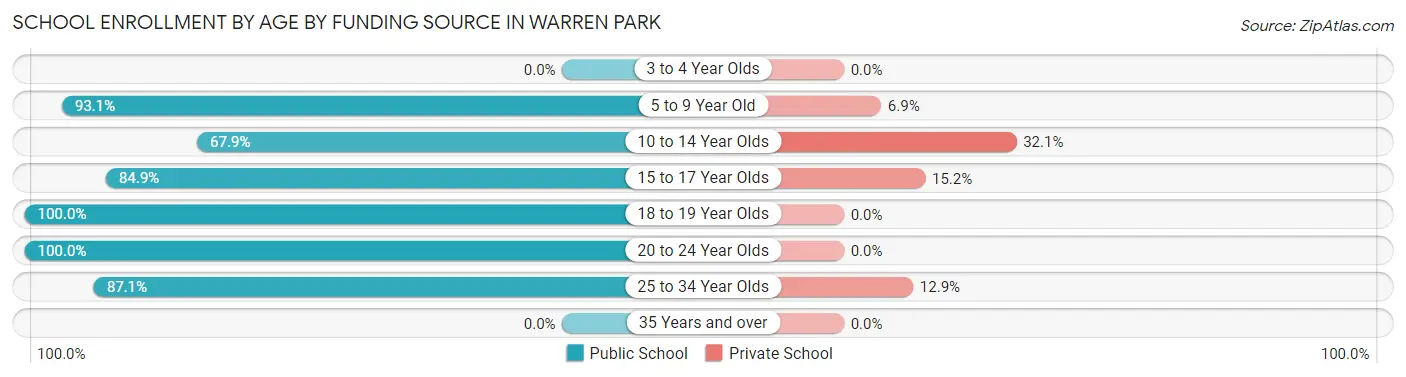
| Age Bracket | Public School | Private School |
| 3 to 4 Year Olds | 0 (0.0%) | 0 (0.0%) |
| 5 to 9 Year Old | 67 (93.1%) | 5 (6.9%) |
| 10 to 14 Year Olds | 19 (67.9%) | 9 (32.1%) |
| 15 to 17 Year Olds | 28 (84.9%) | 5 (15.1%) |
| 18 to 19 Year Olds | 22 (100.0%) | 0 (0.0%) |
| 20 to 24 Year Olds | 14 (100.0%) | 0 (0.0%) |
| 25 to 34 Year Olds | 27 (87.1%) | 4 (12.9%) |
| 35 Years and over | 0 (0.0%) | 0 (0.0%) |
| Total | 177 (88.5%) | 23 (11.5%) |
Educational Attainment by Field of Study in Warren Park
Education (50 | 23.5%), business (35 | 16.4%), science & technology (30 | 14.1%), psychology (28 | 13.2%), and communications (16 | 7.5%) are the most common fields of study among 213 individuals in Warren Park who have obtained a bachelor's degree or higher.
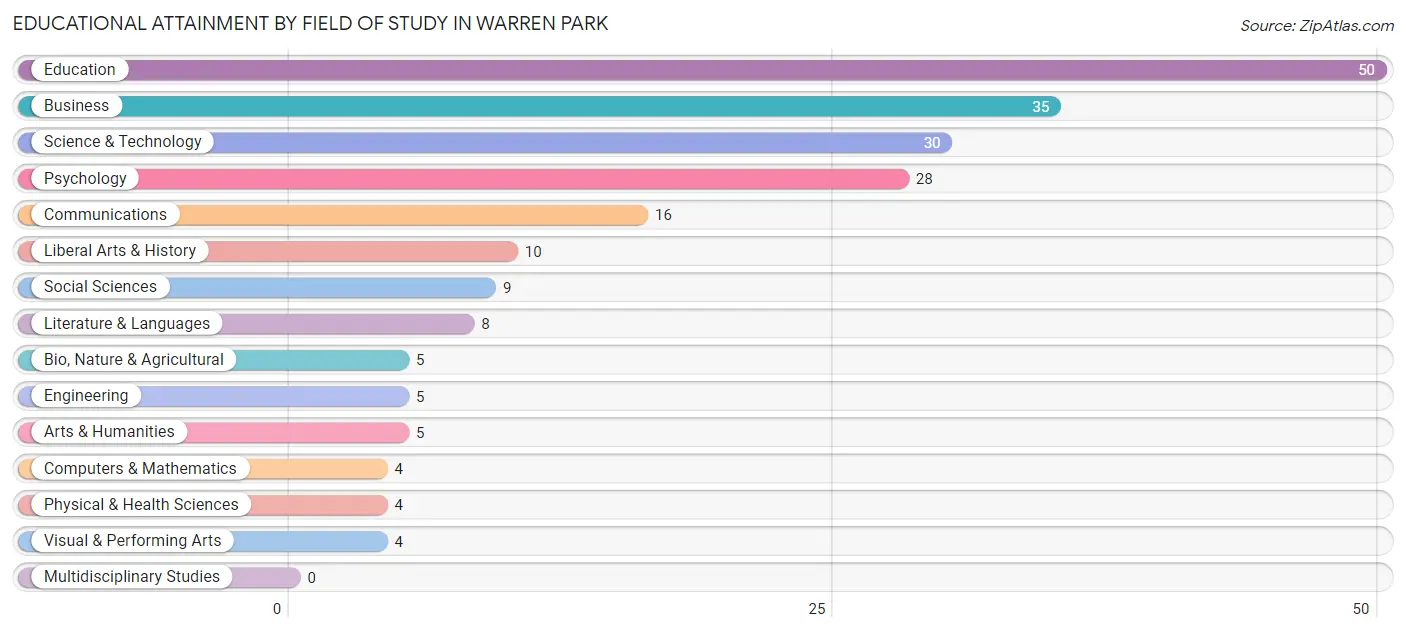
| Field of Study | # Graduates | % Graduates |
| Computers & Mathematics | 4 | 1.9% |
| Bio, Nature & Agricultural | 5 | 2.4% |
| Physical & Health Sciences | 4 | 1.9% |
| Psychology | 28 | 13.2% |
| Social Sciences | 9 | 4.2% |
| Engineering | 5 | 2.4% |
| Multidisciplinary Studies | 0 | 0.0% |
| Science & Technology | 30 | 14.1% |
| Business | 35 | 16.4% |
| Education | 50 | 23.5% |
| Literature & Languages | 8 | 3.8% |
| Liberal Arts & History | 10 | 4.7% |
| Visual & Performing Arts | 4 | 1.9% |
| Communications | 16 | 7.5% |
| Arts & Humanities | 5 | 2.4% |
| Total | 213 | 100.0% |
Transportation & Commute in Warren Park
Vehicle Availability by Sex in Warren Park
The most prevalent vehicle ownership categories in Warren Park are males with 1 vehicle (96, accounting for 32.5%) and females with 1 vehicle (167, making up 29.6%).
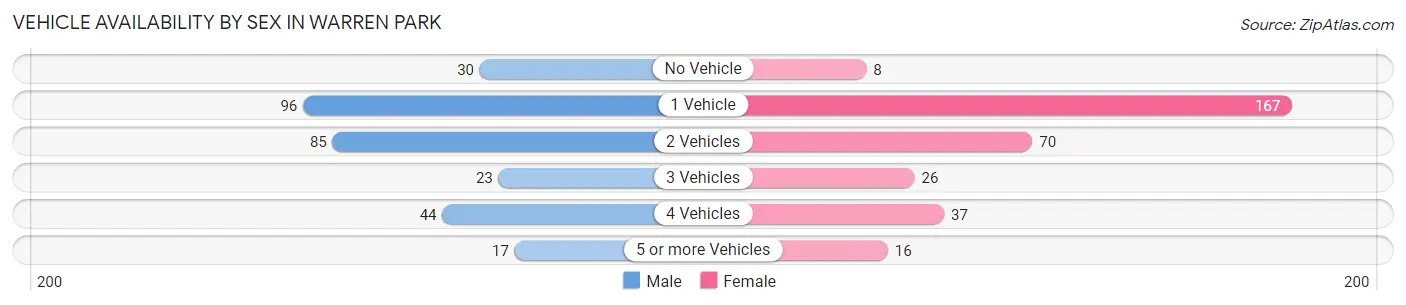
| Vehicles Available | Male | Female |
| No Vehicle | 30 (10.2%) | 8 (2.5%) |
| 1 Vehicle | 96 (32.5%) | 167 (51.5%) |
| 2 Vehicles | 85 (28.8%) | 70 (21.6%) |
| 3 Vehicles | 23 (7.8%) | 26 (8.0%) |
| 4 Vehicles | 44 (14.9%) | 37 (11.4%) |
| 5 or more Vehicles | 17 (5.8%) | 16 (4.9%) |
| Total | 295 (100.0%) | 324 (100.0%) |
Commute Time in Warren Park
The most frequently occuring commute durations in Warren Park are 30 to 34 minutes (143 commuters, 25.4%), 25 to 29 minutes (84 commuters, 14.9%), and 20 to 24 minutes (78 commuters, 13.9%).
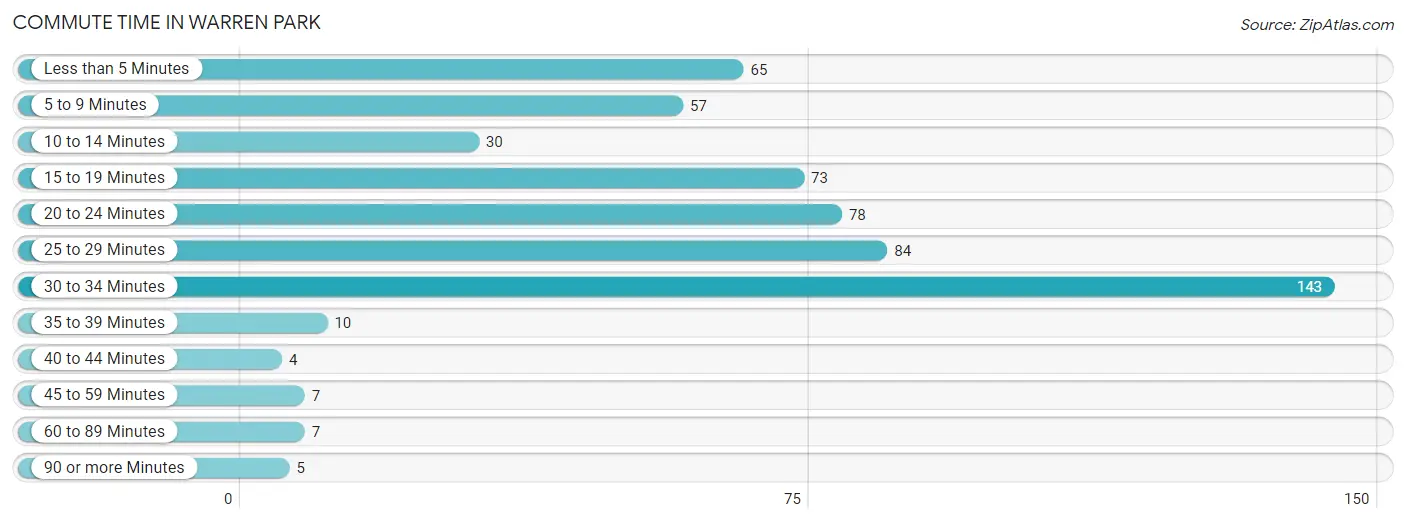
| Commute Time | # Commuters | % Commuters |
| Less than 5 Minutes | 65 | 11.6% |
| 5 to 9 Minutes | 57 | 10.1% |
| 10 to 14 Minutes | 30 | 5.3% |
| 15 to 19 Minutes | 73 | 13.0% |
| 20 to 24 Minutes | 78 | 13.9% |
| 25 to 29 Minutes | 84 | 14.9% |
| 30 to 34 Minutes | 143 | 25.4% |
| 35 to 39 Minutes | 10 | 1.8% |
| 40 to 44 Minutes | 4 | 0.7% |
| 45 to 59 Minutes | 7 | 1.2% |
| 60 to 89 Minutes | 7 | 1.2% |
| 90 or more Minutes | 5 | 0.9% |
Commute Time by Sex in Warren Park
The most common commute times in Warren Park are 30 to 34 minutes (69 commuters, 25.9%) for males and 30 to 34 minutes (74 commuters, 24.9%) for females.
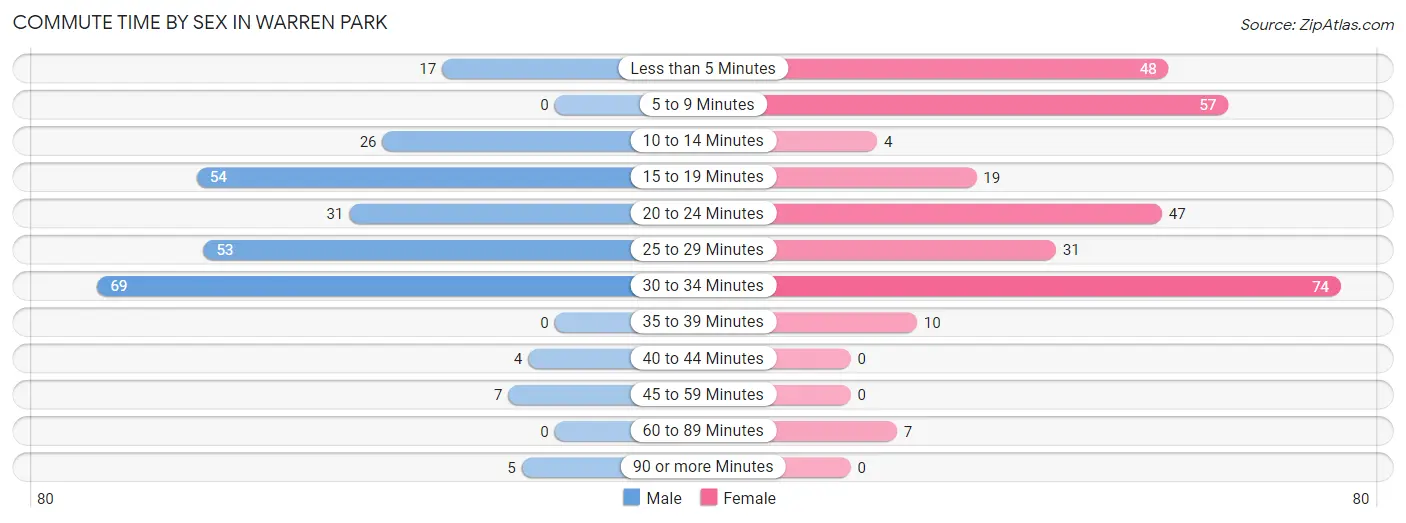
| Commute Time | Male | Female |
| Less than 5 Minutes | 17 (6.4%) | 48 (16.2%) |
| 5 to 9 Minutes | 0 (0.0%) | 57 (19.2%) |
| 10 to 14 Minutes | 26 (9.8%) | 4 (1.3%) |
| 15 to 19 Minutes | 54 (20.3%) | 19 (6.4%) |
| 20 to 24 Minutes | 31 (11.7%) | 47 (15.8%) |
| 25 to 29 Minutes | 53 (19.9%) | 31 (10.4%) |
| 30 to 34 Minutes | 69 (25.9%) | 74 (24.9%) |
| 35 to 39 Minutes | 0 (0.0%) | 10 (3.4%) |
| 40 to 44 Minutes | 4 (1.5%) | 0 (0.0%) |
| 45 to 59 Minutes | 7 (2.6%) | 0 (0.0%) |
| 60 to 89 Minutes | 0 (0.0%) | 7 (2.4%) |
| 90 or more Minutes | 5 (1.9%) | 0 (0.0%) |
Time of Departure to Work by Sex in Warren Park
The most frequent times of departure to work in Warren Park are 6:30 AM to 6:59 AM (59, 22.2%) for males and 6:30 AM to 6:59 AM (59, 19.9%) for females.
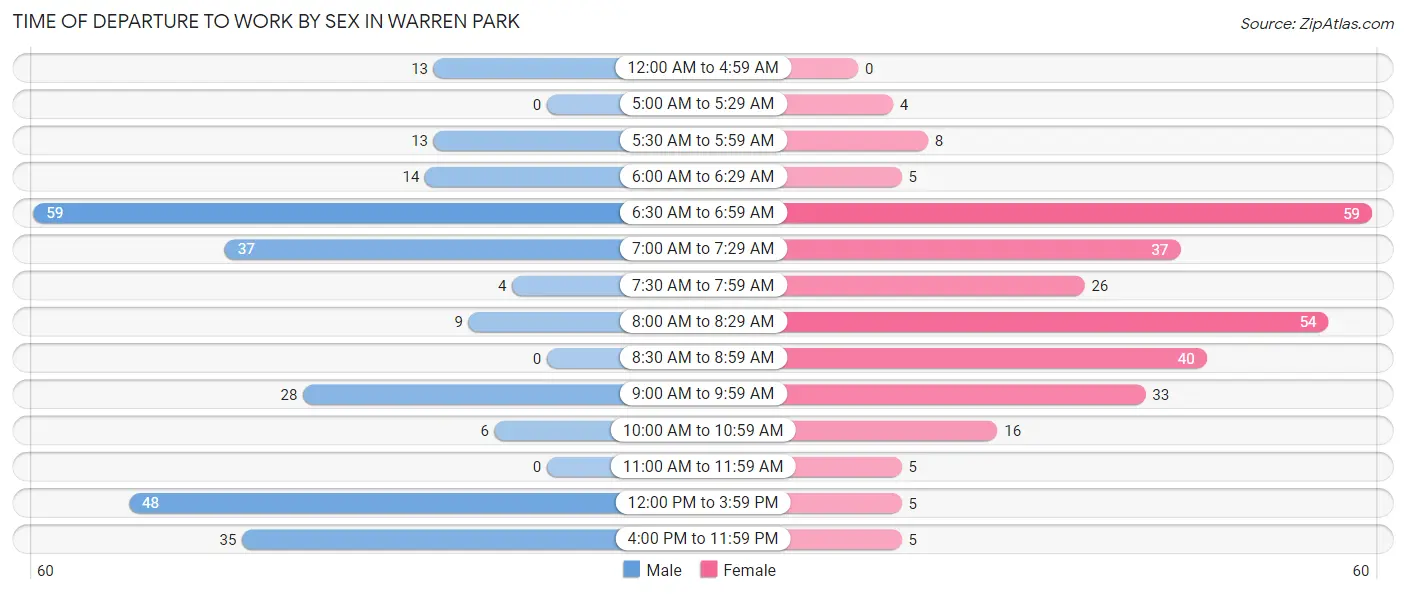
| Time of Departure | Male | Female |
| 12:00 AM to 4:59 AM | 13 (4.9%) | 0 (0.0%) |
| 5:00 AM to 5:29 AM | 0 (0.0%) | 4 (1.3%) |
| 5:30 AM to 5:59 AM | 13 (4.9%) | 8 (2.7%) |
| 6:00 AM to 6:29 AM | 14 (5.3%) | 5 (1.7%) |
| 6:30 AM to 6:59 AM | 59 (22.2%) | 59 (19.9%) |
| 7:00 AM to 7:29 AM | 37 (13.9%) | 37 (12.5%) |
| 7:30 AM to 7:59 AM | 4 (1.5%) | 26 (8.7%) |
| 8:00 AM to 8:29 AM | 9 (3.4%) | 54 (18.2%) |
| 8:30 AM to 8:59 AM | 0 (0.0%) | 40 (13.5%) |
| 9:00 AM to 9:59 AM | 28 (10.5%) | 33 (11.1%) |
| 10:00 AM to 10:59 AM | 6 (2.3%) | 16 (5.4%) |
| 11:00 AM to 11:59 AM | 0 (0.0%) | 5 (1.7%) |
| 12:00 PM to 3:59 PM | 48 (18.0%) | 5 (1.7%) |
| 4:00 PM to 11:59 PM | 35 (13.2%) | 5 (1.7%) |
| Total | 266 (100.0%) | 297 (100.0%) |
Housing Occupancy in Warren Park
Occupancy by Ownership in Warren Park
Of the total 862 dwellings in Warren Park, owner-occupied units account for 290 (33.6%), while renter-occupied units make up 572 (66.4%).
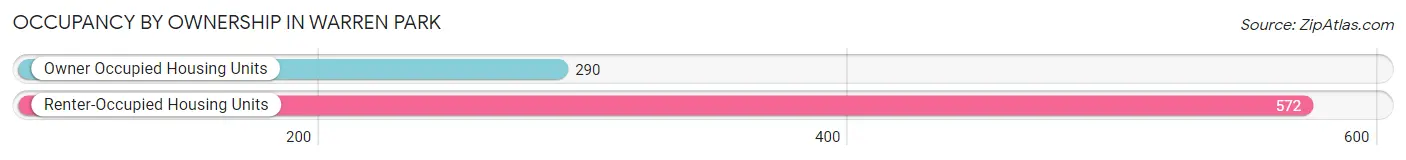
| Occupancy | # Housing Units | % Housing Units |
| Owner Occupied Housing Units | 290 | 33.6% |
| Renter-Occupied Housing Units | 572 | 66.4% |
| Total Occupied Housing Units | 862 | 100.0% |
Occupancy by Household Size in Warren Park
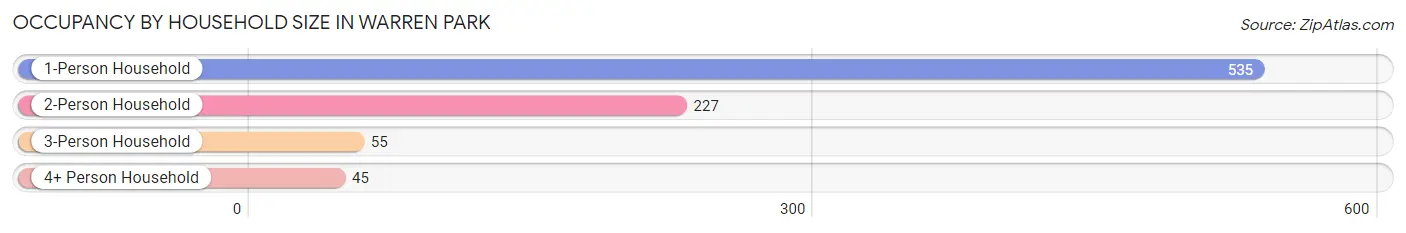
| Household Size | # Housing Units | % Housing Units |
| 1-Person Household | 535 | 62.1% |
| 2-Person Household | 227 | 26.3% |
| 3-Person Household | 55 | 6.4% |
| 4+ Person Household | 45 | 5.2% |
| Total Housing Units | 862 | 100.0% |
Occupancy by Ownership by Household Size in Warren Park
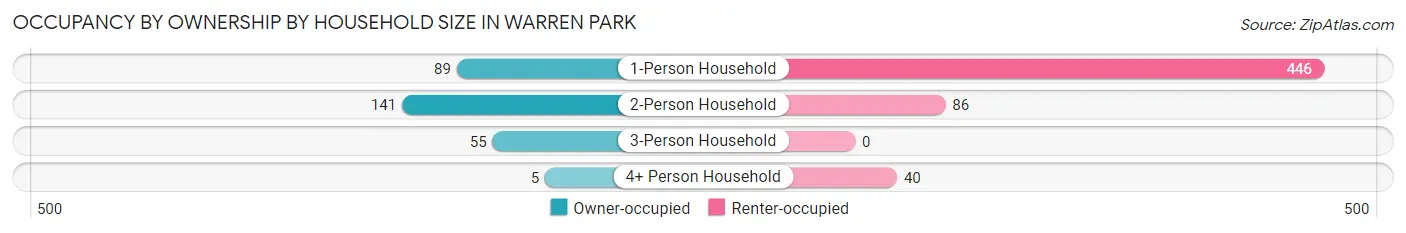
| Household Size | Owner-occupied | Renter-occupied |
| 1-Person Household | 89 (16.6%) | 446 (83.4%) |
| 2-Person Household | 141 (62.1%) | 86 (37.9%) |
| 3-Person Household | 55 (100.0%) | 0 (0.0%) |
| 4+ Person Household | 5 (11.1%) | 40 (88.9%) |
| Total Housing Units | 290 (33.6%) | 572 (66.4%) |
Occupancy by Educational Attainment in Warren Park
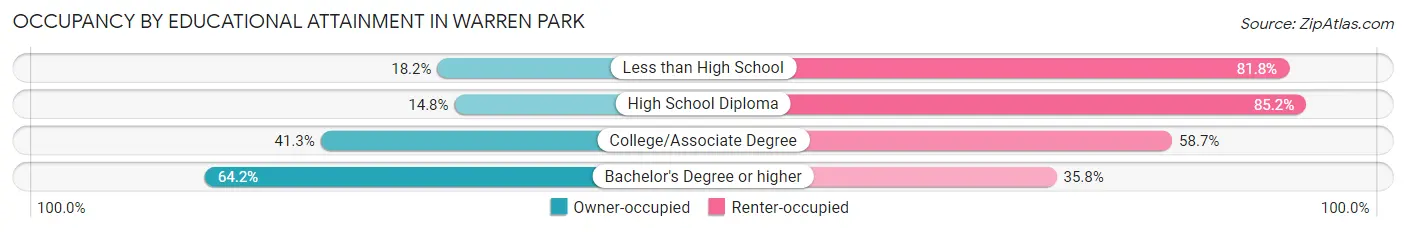
| Household Size | Owner-occupied | Renter-occupied |
| Less than High School | 20 (18.2%) | 90 (81.8%) |
| High School Diploma | 42 (14.8%) | 242 (85.2%) |
| College/Associate Degree | 131 (41.3%) | 186 (58.7%) |
| Bachelor's Degree or higher | 97 (64.2%) | 54 (35.8%) |
Occupancy by Age of Householder in Warren Park
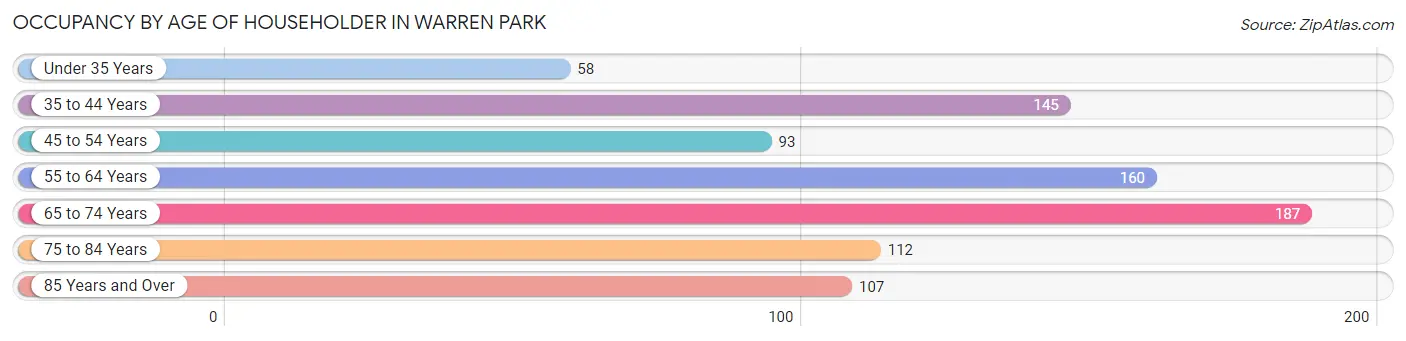
| Age Bracket | # Households | % Households |
| Under 35 Years | 58 | 6.7% |
| 35 to 44 Years | 145 | 16.8% |
| 45 to 54 Years | 93 | 10.8% |
| 55 to 64 Years | 160 | 18.6% |
| 65 to 74 Years | 187 | 21.7% |
| 75 to 84 Years | 112 | 13.0% |
| 85 Years and Over | 107 | 12.4% |
| Total | 862 | 100.0% |
Housing Finances in Warren Park
Median Income by Occupancy in Warren Park
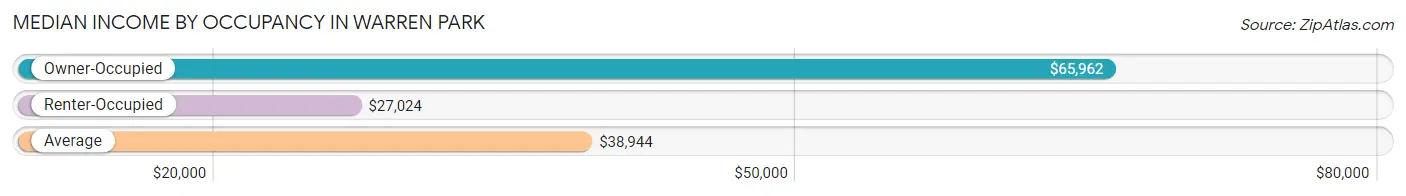
| Occupancy Type | # Households | Median Income |
| Owner-Occupied | 290 (33.6%) | $65,962 |
| Renter-Occupied | 572 (66.4%) | $27,024 |
| Average | 862 (100.0%) | $38,944 |
Occupancy by Householder Income Bracket in Warren Park
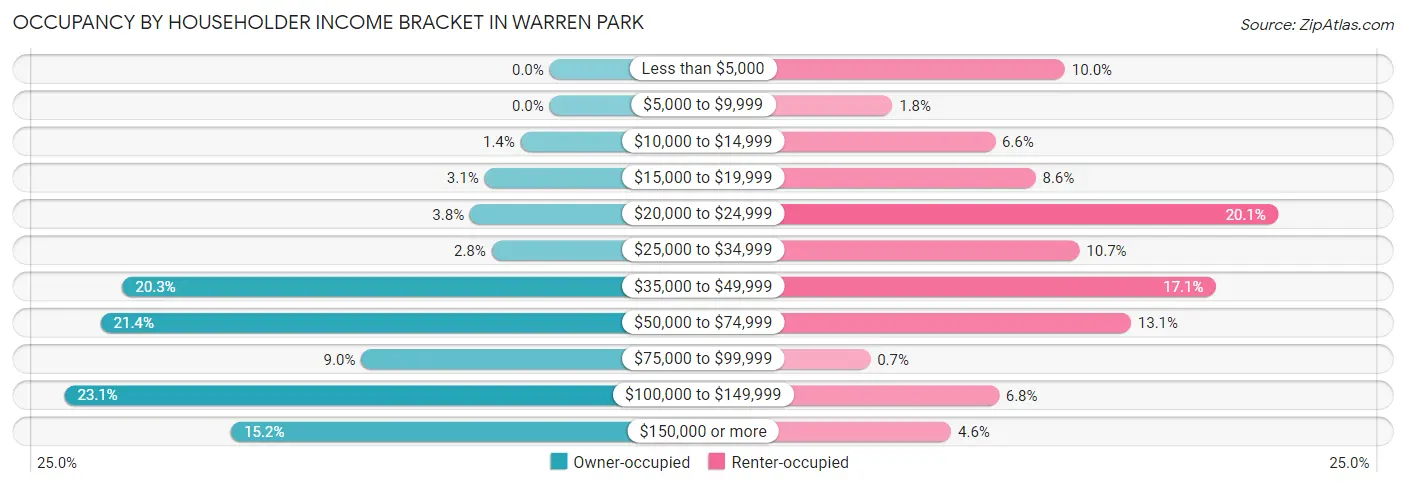
| Income Bracket | Owner-occupied | Renter-occupied |
| Less than $5,000 | 0 (0.0%) | 57 (10.0%) |
| $5,000 to $9,999 | 0 (0.0%) | 10 (1.8%) |
| $10,000 to $14,999 | 4 (1.4%) | 38 (6.6%) |
| $15,000 to $19,999 | 9 (3.1%) | 49 (8.6%) |
| $20,000 to $24,999 | 11 (3.8%) | 115 (20.1%) |
| $25,000 to $34,999 | 8 (2.8%) | 61 (10.7%) |
| $35,000 to $49,999 | 59 (20.3%) | 98 (17.1%) |
| $50,000 to $74,999 | 62 (21.4%) | 75 (13.1%) |
| $75,000 to $99,999 | 26 (9.0%) | 4 (0.7%) |
| $100,000 to $149,999 | 67 (23.1%) | 39 (6.8%) |
| $150,000 or more | 44 (15.2%) | 26 (4.5%) |
| Total | 290 (100.0%) | 572 (100.0%) |
Monthly Housing Cost Tiers in Warren Park
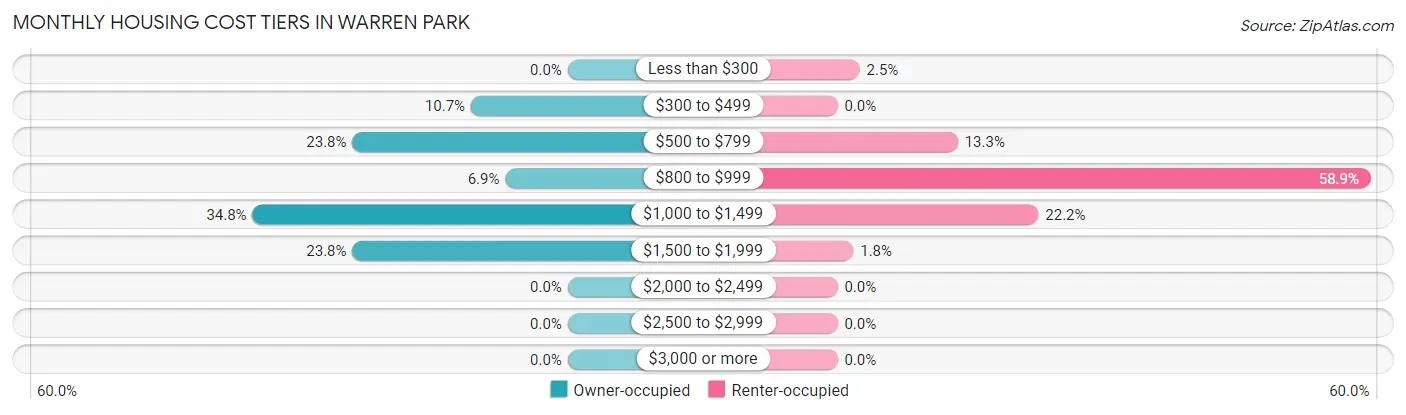
| Monthly Cost | Owner-occupied | Renter-occupied |
| Less than $300 | 0 (0.0%) | 14 (2.5%) |
| $300 to $499 | 31 (10.7%) | 0 (0.0%) |
| $500 to $799 | 69 (23.8%) | 76 (13.3%) |
| $800 to $999 | 20 (6.9%) | 337 (58.9%) |
| $1,000 to $1,499 | 101 (34.8%) | 127 (22.2%) |
| $1,500 to $1,999 | 69 (23.8%) | 10 (1.8%) |
| $2,000 to $2,499 | 0 (0.0%) | 0 (0.0%) |
| $2,500 to $2,999 | 0 (0.0%) | 0 (0.0%) |
| $3,000 or more | 0 (0.0%) | 0 (0.0%) |
| Total | 290 (100.0%) | 572 (100.0%) |
Physical Housing Characteristics in Warren Park
Housing Structures in Warren Park
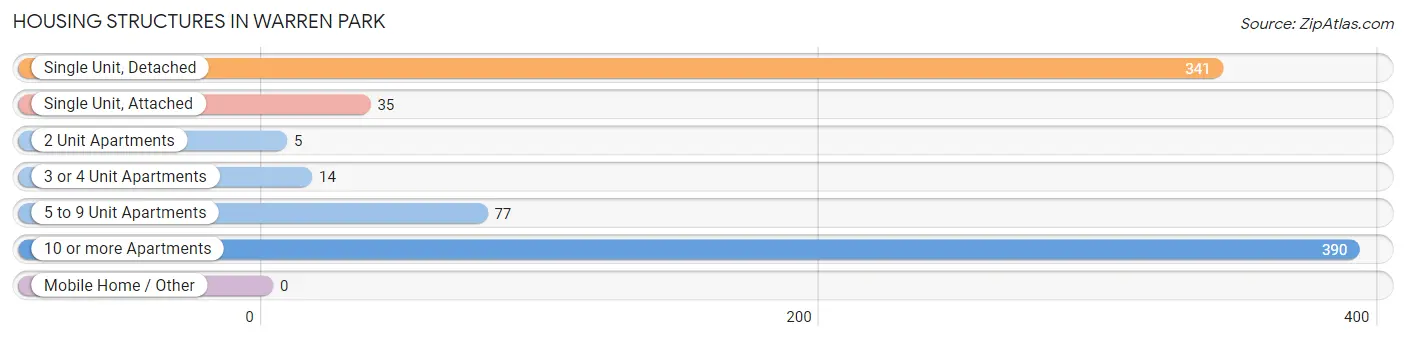
| Structure Type | # Housing Units | % Housing Units |
| Single Unit, Detached | 341 | 39.6% |
| Single Unit, Attached | 35 | 4.1% |
| 2 Unit Apartments | 5 | 0.6% |
| 3 or 4 Unit Apartments | 14 | 1.6% |
| 5 to 9 Unit Apartments | 77 | 8.9% |
| 10 or more Apartments | 390 | 45.2% |
| Mobile Home / Other | 0 | 0.0% |
| Total | 862 | 100.0% |
Housing Structures by Occupancy in Warren Park
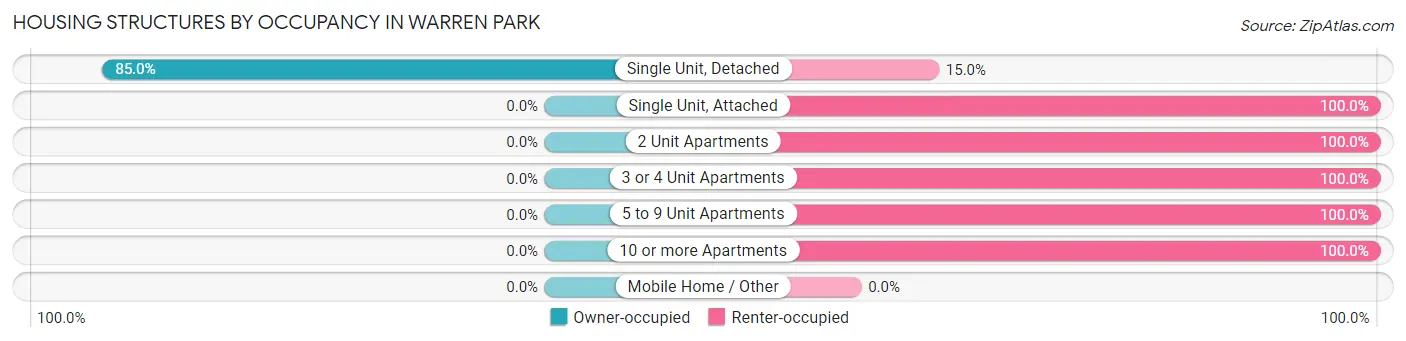
| Structure Type | Owner-occupied | Renter-occupied |
| Single Unit, Detached | 290 (85.0%) | 51 (15.0%) |
| Single Unit, Attached | 0 (0.0%) | 35 (100.0%) |
| 2 Unit Apartments | 0 (0.0%) | 5 (100.0%) |
| 3 or 4 Unit Apartments | 0 (0.0%) | 14 (100.0%) |
| 5 to 9 Unit Apartments | 0 (0.0%) | 77 (100.0%) |
| 10 or more Apartments | 0 (0.0%) | 390 (100.0%) |
| Mobile Home / Other | 0 (0.0%) | 0 (0.0%) |
| Total | 290 (33.6%) | 572 (66.4%) |
Housing Structures by Number of Rooms in Warren Park
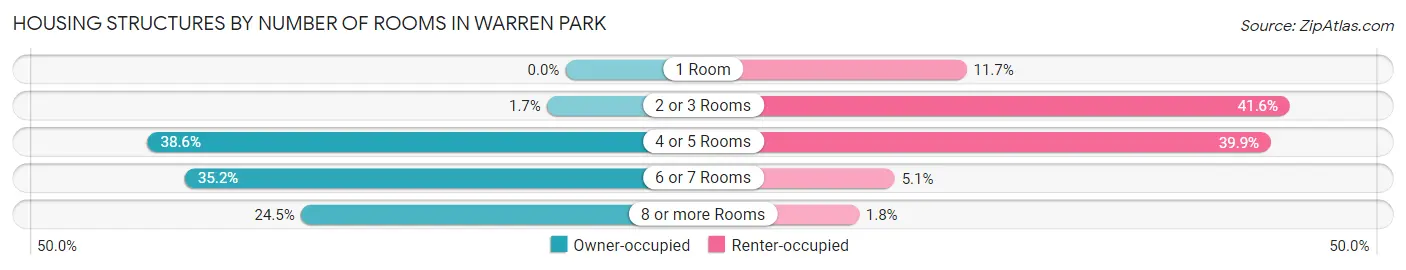
| Number of Rooms | Owner-occupied | Renter-occupied |
| 1 Room | 0 (0.0%) | 67 (11.7%) |
| 2 or 3 Rooms | 5 (1.7%) | 238 (41.6%) |
| 4 or 5 Rooms | 112 (38.6%) | 228 (39.9%) |
| 6 or 7 Rooms | 102 (35.2%) | 29 (5.1%) |
| 8 or more Rooms | 71 (24.5%) | 10 (1.8%) |
| Total | 290 (100.0%) | 572 (100.0%) |
Housing Structure by Heating Type in Warren Park
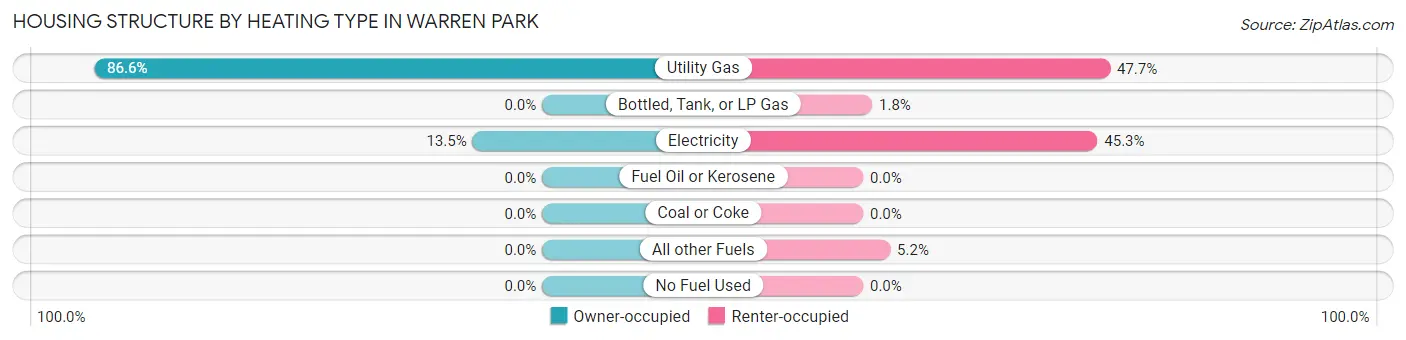
| Heating Type | Owner-occupied | Renter-occupied |
| Utility Gas | 251 (86.6%) | 273 (47.7%) |
| Bottled, Tank, or LP Gas | 0 (0.0%) | 10 (1.8%) |
| Electricity | 39 (13.5%) | 259 (45.3%) |
| Fuel Oil or Kerosene | 0 (0.0%) | 0 (0.0%) |
| Coal or Coke | 0 (0.0%) | 0 (0.0%) |
| All other Fuels | 0 (0.0%) | 30 (5.2%) |
| No Fuel Used | 0 (0.0%) | 0 (0.0%) |
| Total | 290 (100.0%) | 572 (100.0%) |
Household Vehicle Usage in Warren Park
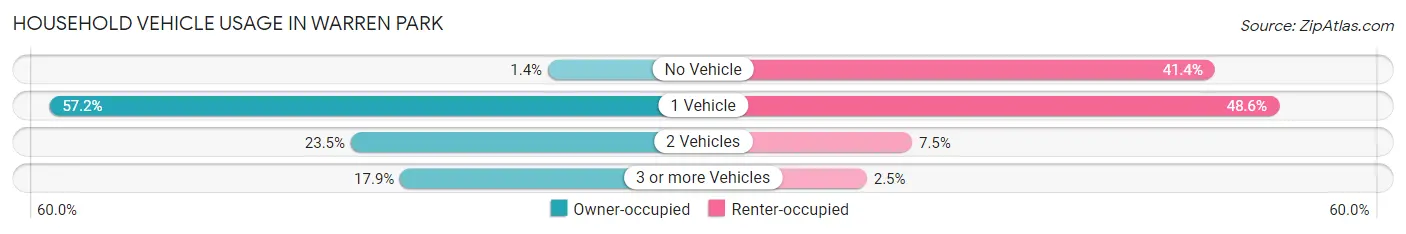
| Vehicles per Household | Owner-occupied | Renter-occupied |
| No Vehicle | 4 (1.4%) | 237 (41.4%) |
| 1 Vehicle | 166 (57.2%) | 278 (48.6%) |
| 2 Vehicles | 68 (23.4%) | 43 (7.5%) |
| 3 or more Vehicles | 52 (17.9%) | 14 (2.5%) |
| Total | 290 (100.0%) | 572 (100.0%) |
Real Estate & Mortgages in Warren Park
Real Estate and Mortgage Overview in Warren Park
| Characteristic | Without Mortgage | With Mortgage |
| Housing Units | 99 | 191 |
| Median Property Value | $162,500 | $190,200 |
| Median Household Income | $41,394 | $40 |
| Monthly Housing Costs | $554 | $0 |
| Real Estate Taxes | $1,919 | $0 |
Property Value by Mortgage Status in Warren Park
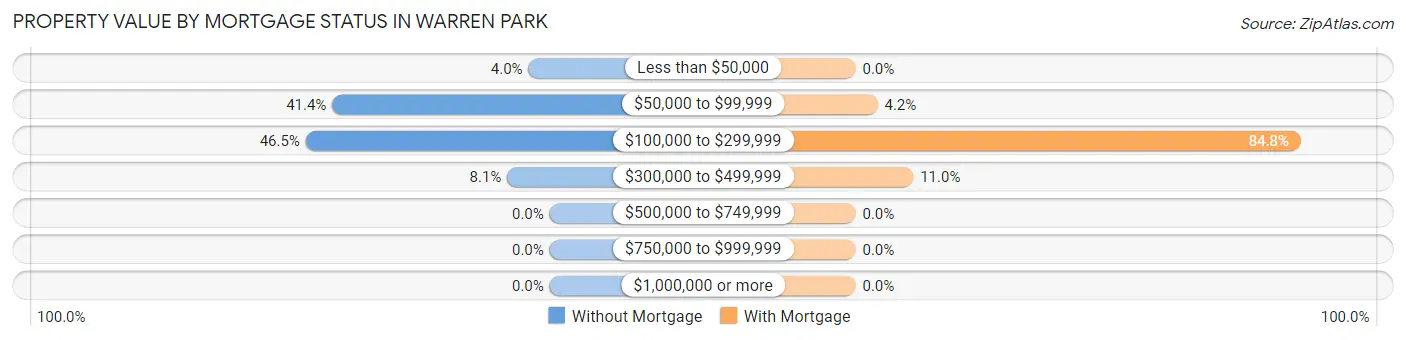
| Property Value | Without Mortgage | With Mortgage |
| Less than $50,000 | 4 (4.0%) | 0 (0.0%) |
| $50,000 to $99,999 | 41 (41.4%) | 8 (4.2%) |
| $100,000 to $299,999 | 46 (46.5%) | 162 (84.8%) |
| $300,000 to $499,999 | 8 (8.1%) | 21 (11.0%) |
| $500,000 to $749,999 | 0 (0.0%) | 0 (0.0%) |
| $750,000 to $999,999 | 0 (0.0%) | 0 (0.0%) |
| $1,000,000 or more | 0 (0.0%) | 0 (0.0%) |
| Total | 99 (100.0%) | 191 (100.0%) |
Household Income by Mortgage Status in Warren Park
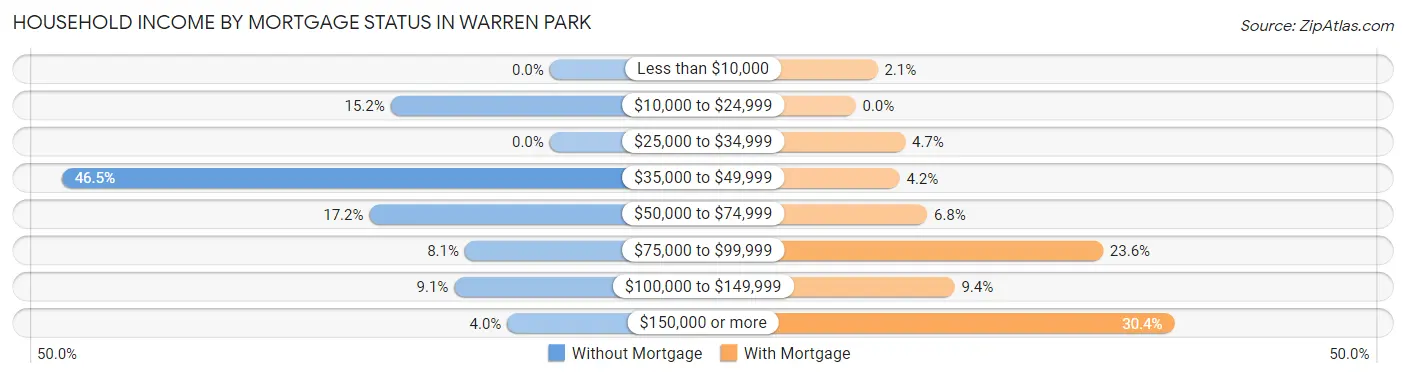
| Household Income | Without Mortgage | With Mortgage |
| Less than $10,000 | 0 (0.0%) | 4 (2.1%) |
| $10,000 to $24,999 | 15 (15.1%) | 0 (0.0%) |
| $25,000 to $34,999 | 0 (0.0%) | 9 (4.7%) |
| $35,000 to $49,999 | 46 (46.5%) | 8 (4.2%) |
| $50,000 to $74,999 | 17 (17.2%) | 13 (6.8%) |
| $75,000 to $99,999 | 8 (8.1%) | 45 (23.6%) |
| $100,000 to $149,999 | 9 (9.1%) | 18 (9.4%) |
| $150,000 or more | 4 (4.0%) | 58 (30.4%) |
| Total | 99 (100.0%) | 191 (100.0%) |
Property Value to Household Income Ratio in Warren Park
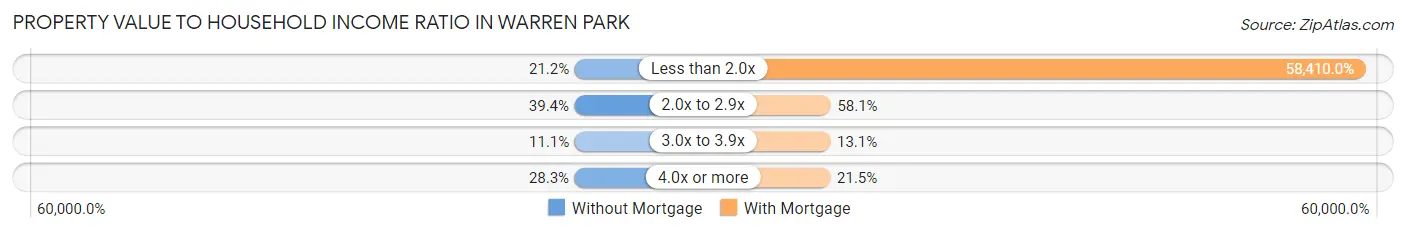
| Value-to-Income Ratio | Without Mortgage | With Mortgage |
| Less than 2.0x | 21 (21.2%) | 111,563 (58,410.0%) |
| 2.0x to 2.9x | 39 (39.4%) | 111 (58.1%) |
| 3.0x to 3.9x | 11 (11.1%) | 25 (13.1%) |
| 4.0x or more | 28 (28.3%) | 41 (21.5%) |
| Total | 99 (100.0%) | 191 (100.0%) |
Real Estate Taxes by Mortgage Status in Warren Park
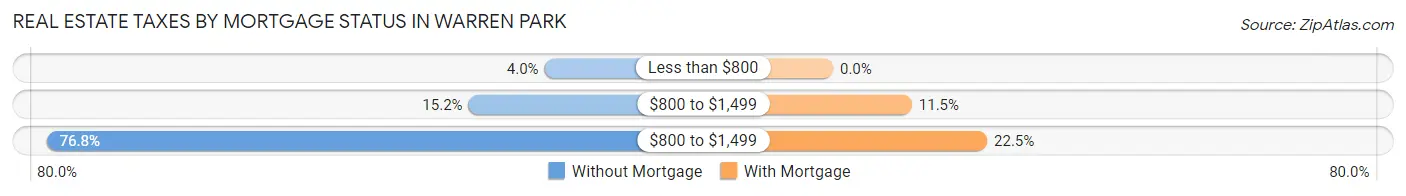
| Property Taxes | Without Mortgage | With Mortgage |
| Less than $800 | 4 (4.0%) | 0 (0.0%) |
| $800 to $1,499 | 15 (15.1%) | 22 (11.5%) |
| $800 to $1,499 | 76 (76.8%) | 43 (22.5%) |
| Total | 99 (100.0%) | 191 (100.0%) |
Health & Disability in Warren Park
Health Insurance Coverage by Age in Warren Park
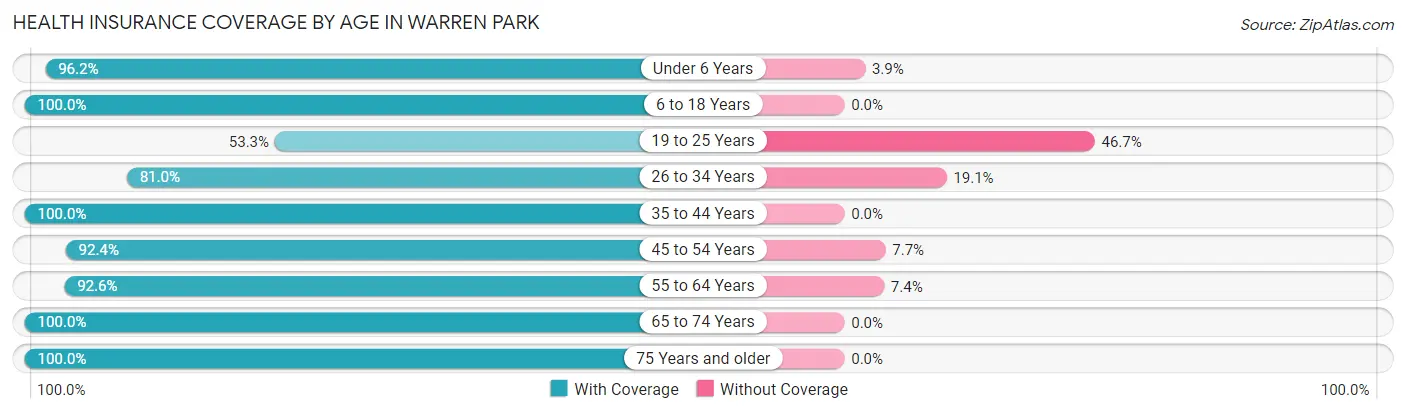
| Age Bracket | With Coverage | Without Coverage |
| Under 6 Years | 150 (96.2%) | 6 (3.8%) |
| 6 to 18 Years | 124 (100.0%) | 0 (0.0%) |
| 19 to 25 Years | 24 (53.3%) | 21 (46.7%) |
| 26 to 34 Years | 68 (80.9%) | 16 (19.1%) |
| 35 to 44 Years | 183 (100.0%) | 0 (0.0%) |
| 45 to 54 Years | 157 (92.3%) | 13 (7.6%) |
| 55 to 64 Years | 213 (92.6%) | 17 (7.4%) |
| 65 to 74 Years | 241 (100.0%) | 0 (0.0%) |
| 75 Years and older | 242 (100.0%) | 0 (0.0%) |
| Total | 1,402 (95.1%) | 73 (5.0%) |
Health Insurance Coverage by Citizenship Status in Warren Park
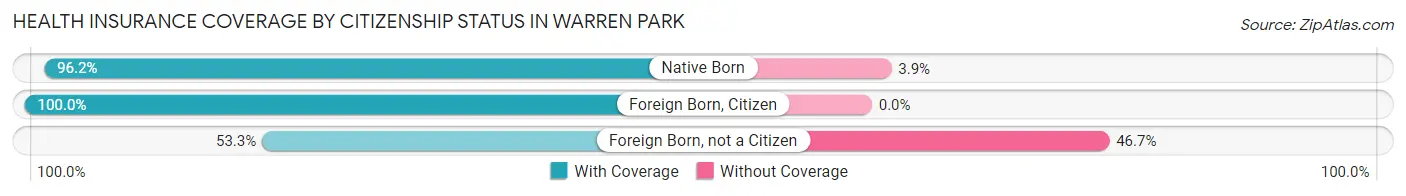
| Citizenship Status | With Coverage | Without Coverage |
| Native Born | 150 (96.2%) | 6 (3.8%) |
| Foreign Born, Citizen | 124 (100.0%) | 0 (0.0%) |
| Foreign Born, not a Citizen | 24 (53.3%) | 21 (46.7%) |
Health Insurance Coverage by Household Income in Warren Park
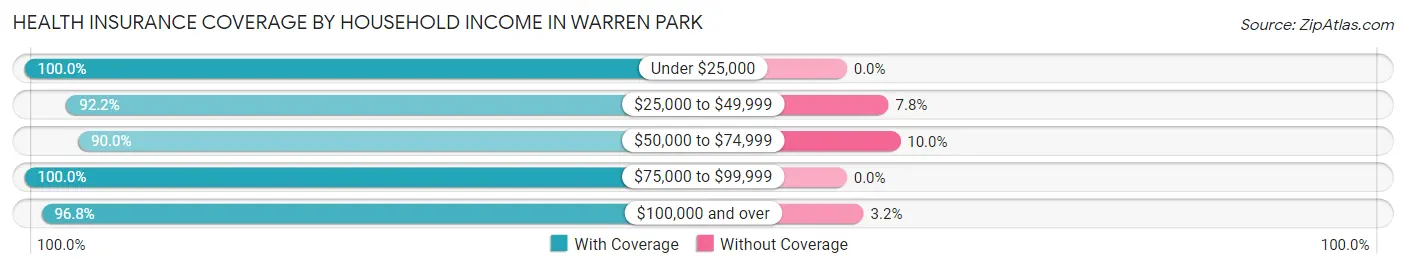
| Household Income | With Coverage | Without Coverage |
| Under $25,000 | 330 (100.0%) | 0 (0.0%) |
| $25,000 to $49,999 | 306 (92.2%) | 26 (7.8%) |
| $50,000 to $74,999 | 305 (90.0%) | 34 (10.0%) |
| $75,000 to $99,999 | 63 (100.0%) | 0 (0.0%) |
| $100,000 and over | 398 (96.8%) | 13 (3.2%) |
Public vs Private Health Insurance Coverage by Age in Warren Park
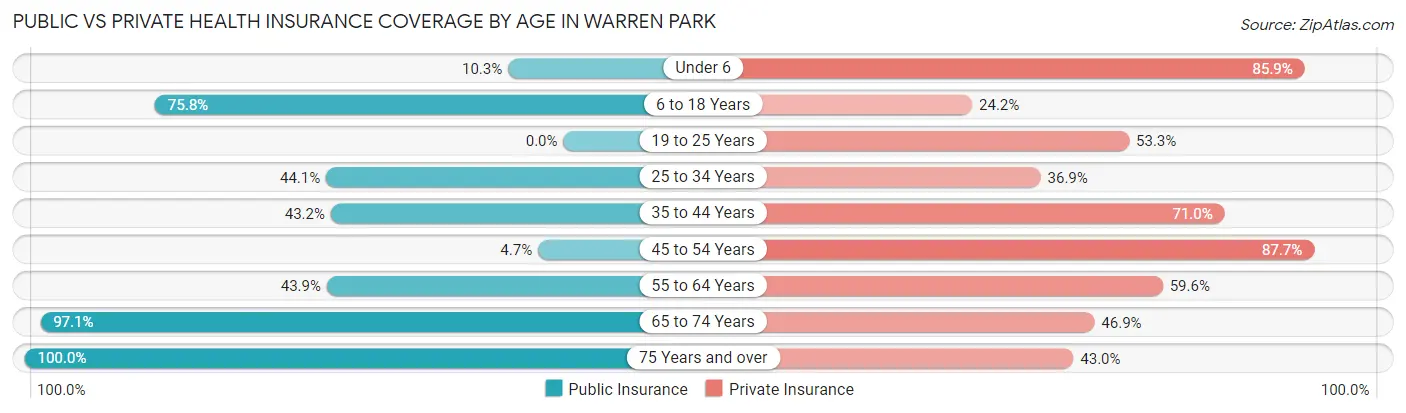
| Age Bracket | Public Insurance | Private Insurance |
| Under 6 | 16 (10.3%) | 134 (85.9%) |
| 6 to 18 Years | 94 (75.8%) | 30 (24.2%) |
| 19 to 25 Years | 0 (0.0%) | 24 (53.3%) |
| 25 to 34 Years | 37 (44.1%) | 31 (36.9%) |
| 35 to 44 Years | 79 (43.2%) | 130 (71.0%) |
| 45 to 54 Years | 8 (4.7%) | 149 (87.6%) |
| 55 to 64 Years | 101 (43.9%) | 137 (59.6%) |
| 65 to 74 Years | 234 (97.1%) | 113 (46.9%) |
| 75 Years and over | 242 (100.0%) | 104 (43.0%) |
| Total | 811 (55.0%) | 852 (57.8%) |
Disability Status by Sex by Age in Warren Park
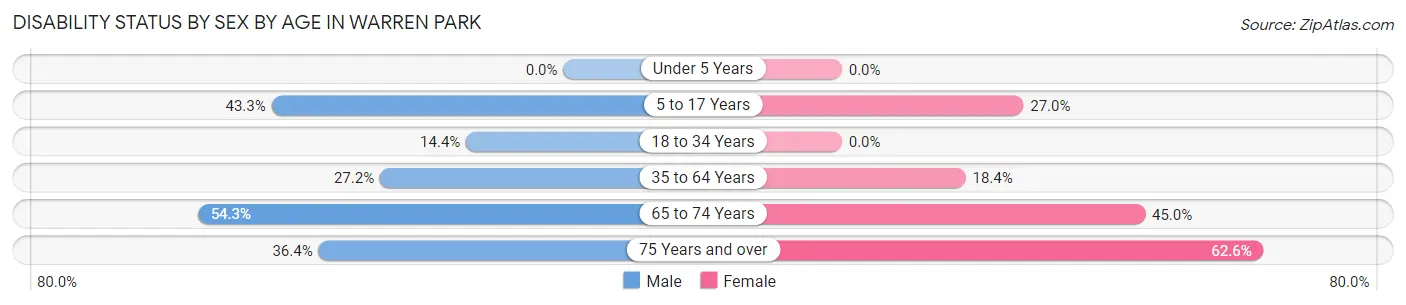
| Age Bracket | Male | Female |
| Under 5 Years | 0 (0.0%) | 0 (0.0%) |
| 5 to 17 Years | 13 (43.3%) | 38 (27.0%) |
| 18 to 34 Years | 14 (14.4%) | 0 (0.0%) |
| 35 to 64 Years | 61 (27.2%) | 66 (18.4%) |
| 65 to 74 Years | 38 (54.3%) | 77 (45.0%) |
| 75 Years and over | 16 (36.4%) | 124 (62.6%) |
Disability Class by Sex by Age in Warren Park
Disability Class: Hearing Difficulty
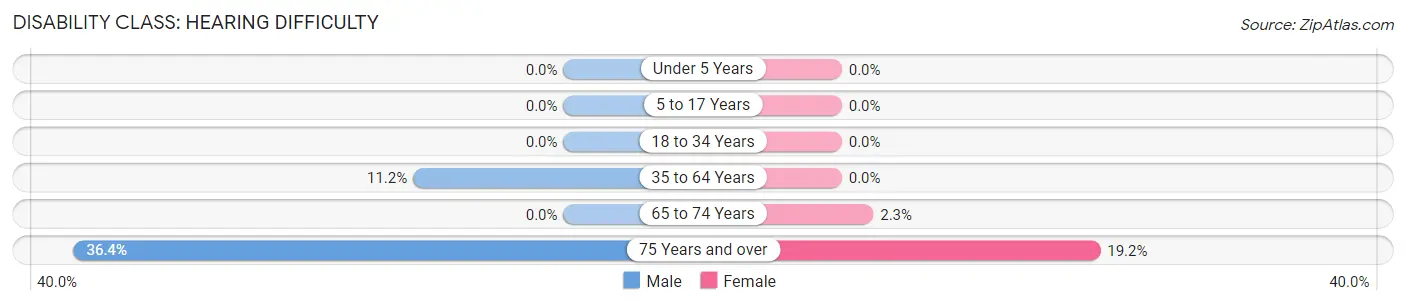
| Age Bracket | Male | Female |
| Under 5 Years | 0 (0.0%) | 0 (0.0%) |
| 5 to 17 Years | 0 (0.0%) | 0 (0.0%) |
| 18 to 34 Years | 0 (0.0%) | 0 (0.0%) |
| 35 to 64 Years | 25 (11.2%) | 0 (0.0%) |
| 65 to 74 Years | 0 (0.0%) | 4 (2.3%) |
| 75 Years and over | 16 (36.4%) | 38 (19.2%) |
Disability Class: Vision Difficulty
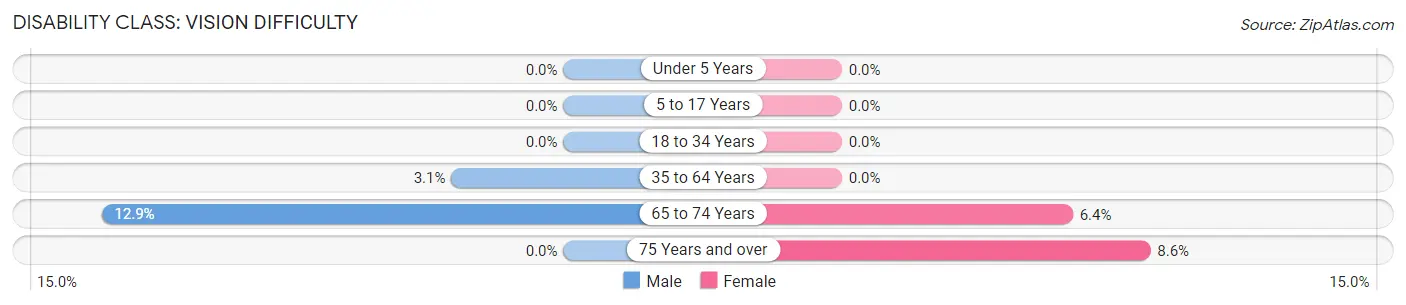
| Age Bracket | Male | Female |
| Under 5 Years | 0 (0.0%) | 0 (0.0%) |
| 5 to 17 Years | 0 (0.0%) | 0 (0.0%) |
| 18 to 34 Years | 0 (0.0%) | 0 (0.0%) |
| 35 to 64 Years | 7 (3.1%) | 0 (0.0%) |
| 65 to 74 Years | 9 (12.9%) | 11 (6.4%) |
| 75 Years and over | 0 (0.0%) | 17 (8.6%) |
Disability Class: Cognitive Difficulty
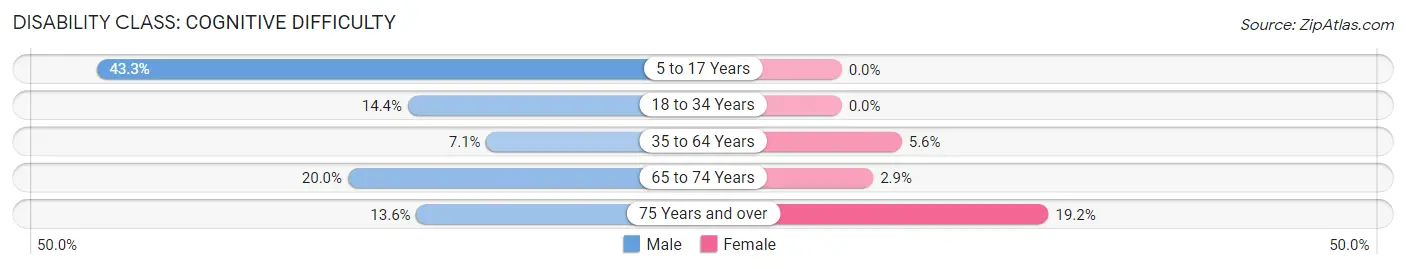
| Age Bracket | Male | Female |
| 5 to 17 Years | 13 (43.3%) | 0 (0.0%) |
| 18 to 34 Years | 14 (14.4%) | 0 (0.0%) |
| 35 to 64 Years | 16 (7.1%) | 20 (5.6%) |
| 65 to 74 Years | 14 (20.0%) | 5 (2.9%) |
| 75 Years and over | 6 (13.6%) | 38 (19.2%) |
Disability Class: Ambulatory Difficulty
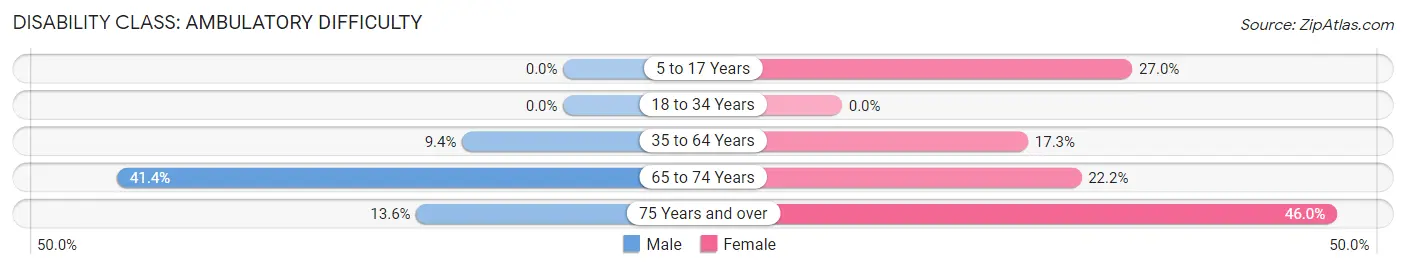
| Age Bracket | Male | Female |
| 5 to 17 Years | 0 (0.0%) | 38 (27.0%) |
| 18 to 34 Years | 0 (0.0%) | 0 (0.0%) |
| 35 to 64 Years | 21 (9.4%) | 62 (17.3%) |
| 65 to 74 Years | 29 (41.4%) | 38 (22.2%) |
| 75 Years and over | 6 (13.6%) | 91 (46.0%) |
Disability Class: Self-Care Difficulty
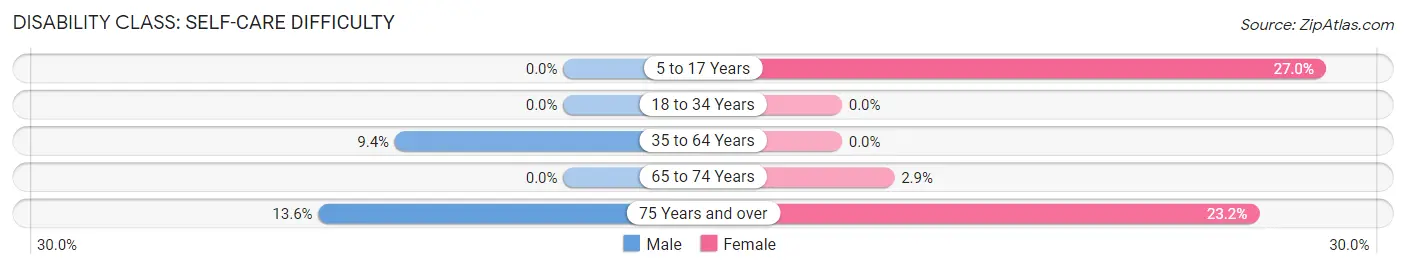
| Age Bracket | Male | Female |
| 5 to 17 Years | 0 (0.0%) | 38 (27.0%) |
| 18 to 34 Years | 0 (0.0%) | 0 (0.0%) |
| 35 to 64 Years | 21 (9.4%) | 0 (0.0%) |
| 65 to 74 Years | 0 (0.0%) | 5 (2.9%) |
| 75 Years and over | 6 (13.6%) | 46 (23.2%) |
Technology Access in Warren Park
Computing Device Access in Warren Park
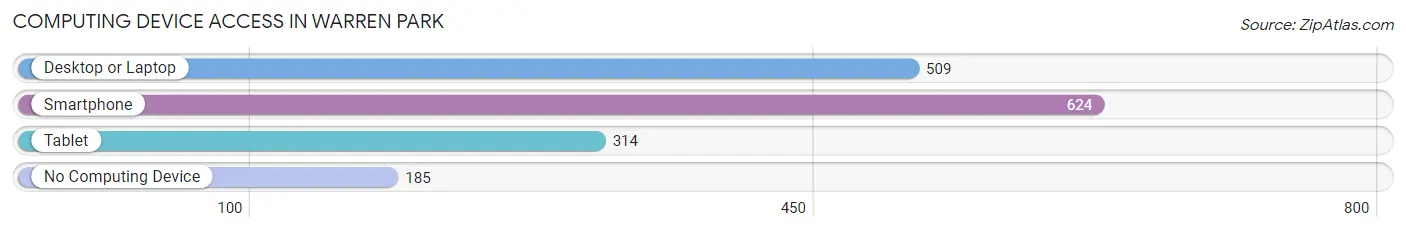
| Device Type | # Households | % Households |
| Desktop or Laptop | 509 | 59.1% |
| Smartphone | 624 | 72.4% |
| Tablet | 314 | 36.4% |
| No Computing Device | 185 | 21.5% |
| Total | 862 | 100.0% |
Internet Access in Warren Park
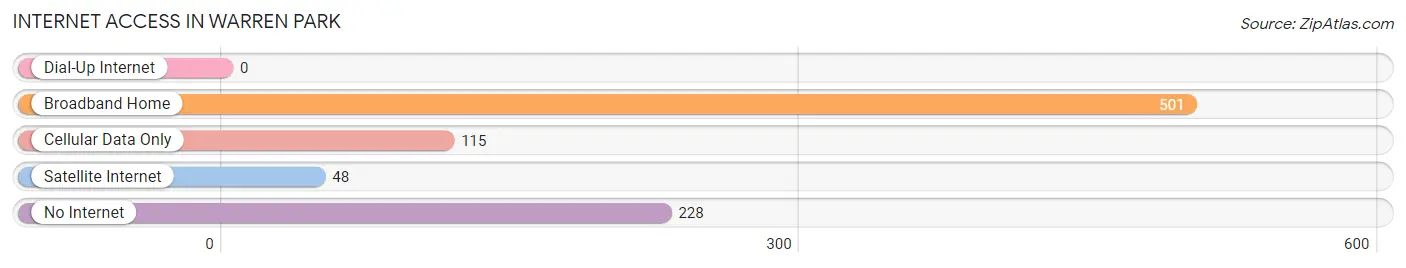
| Internet Type | # Households | % Households |
| Dial-Up Internet | 0 | 0.0% |
| Broadband Home | 501 | 58.1% |
| Cellular Data Only | 115 | 13.3% |
| Satellite Internet | 48 | 5.6% |
| No Internet | 228 | 26.5% |
| Total | 862 | 100.0% |
Warren Park Summary
Warren Park is a small town located in Marion County, Indiana. It is situated in the northwest corner of the county, just south of the city of Indianapolis. The town was founded in 1837 and has a population of approximately 4,000 people.
Geography
Warren Park is located in the northwest corner of Marion County, Indiana. It is situated on the White River, which is a tributary of the Wabash River. The town is bordered by the cities of Indianapolis to the north, Speedway to the east, and Beech Grove to the south. The town is located in the Central Till Plains region of Indiana, which is characterized by flat terrain and fertile soils. The town is located at an elevation of approximately 800 feet above sea level.
Economy
The economy of Warren Park is largely based on manufacturing and retail. The town is home to several manufacturing companies, including a steel mill, a paper mill, and a plastics factory. The town also has a number of retail stores, including a grocery store, a hardware store, and a variety of other shops. The town is also home to a number of small businesses, including restaurants, auto repair shops, and other services.
Demographics
As of the 2010 census, the population of Warren Park was 4,039. The population is predominantly white, with approximately 85% of the population identifying as white. The remaining 15% of the population is made up of African Americans, Hispanics, and other ethnicities. The median household income in Warren Park is $45,000, which is slightly lower than the median household income for Marion County.
The town has a relatively low crime rate, with only a few reported incidents of violent crime in recent years. The town is served by the Warren Park Police Department, which is responsible for providing law enforcement services to the town.
History
Warren Park was founded in 1837 by a group of settlers from Ohio. The town was named after General Joseph Warren, who was a Revolutionary War hero. The town was originally a farming community, but it soon developed into a manufacturing center due to its proximity to the White River. The town was home to several factories, including a steel mill, a paper mill, and a plastics factory.
In the late 19th century, the town was home to a number of prominent businesses, including a bank, a hotel, and a newspaper. The town was also home to a number of churches, including the First Presbyterian Church, which was founded in 1845.
In the early 20th century, the town experienced a period of growth and development. The town was home to a number of new businesses, including a movie theater, a bowling alley, and a variety of other shops. The town also experienced a period of population growth, with the population increasing from 1,000 in 1900 to 4,000 in 1950.
In recent years, the town has experienced a period of decline. The population has decreased from 4,000 in 1950 to 4,039 in 2010. The town has also experienced a decrease in the number of businesses, with many of the factories and other businesses closing in recent years. Despite this, the town remains a vibrant community, with a number of small businesses and a variety of recreational activities.
Common Questions
What is the Total Population of Warren Park?
Total Population of Warren Park is 1,475.
What is the Total Male Population of Warren Park?
Total Male Population of Warren Park is 542.
What is the Total Female Population of Warren Park?
Total Female Population of Warren Park is 933.
What is the Ratio of Males per 100 Females in Warren Park?
There are 58.09 Males per 100 Females in Warren Park.
What is the Ratio of Females per 100 Males in Warren Park?
There are 172.14 Females per 100 Males in Warren Park.
What is the Median Population Age in Warren Park?
Median Population Age in Warren Park is 54.3 Years.
What is the Average Family Size in Warren Park
Average Family Size in Warren Park is 2.8 People.
What is the Average Household Size in Warren Park
Average Household Size in Warren Park is 1.7 People.
What is Per Capita Income in Warren Park?
Per Capita income in Warren Park is $50,166.
What is the Median Family Income in Warren Park?
Median Family Income in Warren Park is $66,635.
What is the Median Household income in Warren Park?
Median Household Income in Warren Park is $38,944.
What is Income or Wage Gap in Warren Park?
Income or Wage Gap in Warren Park is 9.1%.
Women in Warren Park earn 90.9 cents for every dollar earned by a man.
What is Inequality or Gini Index in Warren Park?
Inequality or Gini Index in Warren Park is 0.62.
How Large is the Labor Force in Warren Park?
There are 640 People in the Labor Forcein in Warren Park.
What is the Percentage of People in the Labor Force in Warren Park?
51.8% of People are in the Labor Force in Warren Park.
What is the Unemployment Rate in Warren Park?
Unemployment Rate in Warren Park is 3.3%.