Cities with the Highest Percentage of Immigrants from Bolivia in Virginia
RELATED REPORTS & OPTIONS
Bolivia
Virginia
Compare Cities
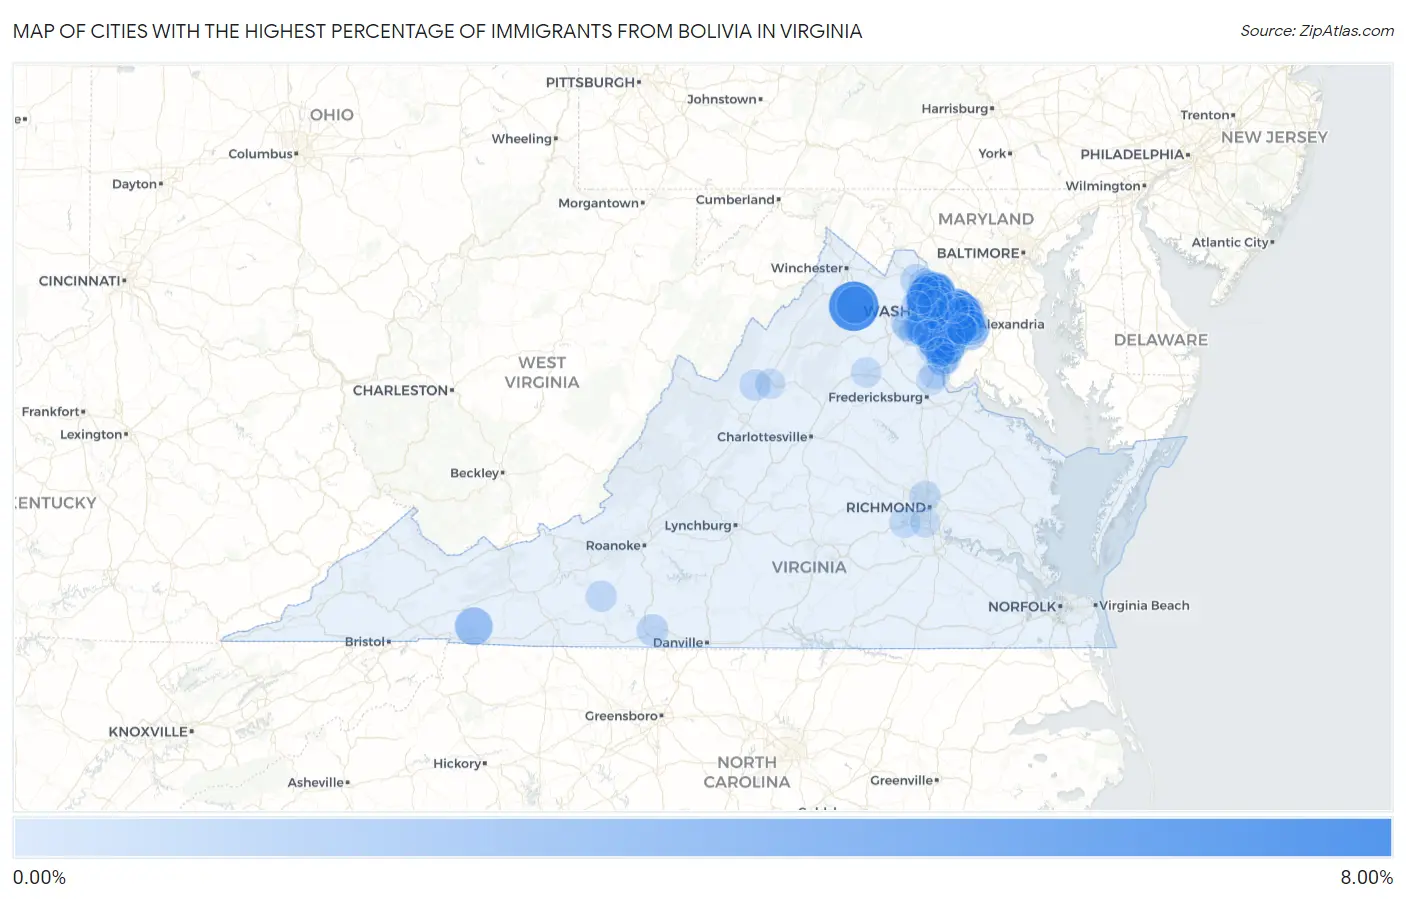
Map of Cities with the Highest Percentage of Immigrants from Bolivia in Virginia
0.00%
8.00%
Cities with the Highest Percentage of Immigrants from Bolivia in Virginia
| City | Bolivia | vs State | vs National | |
| 1. | Apple Mountain Lake | 6.82% | 0.30%(+6.52)#-1 | 0.024%(+6.79)#0 |
| 2. | Oak Grove | 6.47% | 0.30%(+6.18)#0 | 0.024%(+6.45)#1 |
| 3. | West Falls Church | 6.27% | 0.30%(+5.97)#6 | 0.024%(+6.24)#217 |
| 4. | County Center | 4.90% | 0.30%(+4.60)#7 | 0.024%(+4.87)#218 |
| 5. | Kings Park | 4.35% | 0.30%(+4.05)#8 | 0.024%(+4.32)#219 |
| 6. | Pimmit Hills | 3.66% | 0.30%(+3.36)#9 | 0.024%(+3.64)#220 |
| 7. | North Springfield | 3.30% | 0.30%(+3.00)#10 | 0.024%(+3.27)#221 |
| 8. | Annandale | 3.28% | 0.30%(+2.99)#11 | 0.024%(+3.26)#222 |
| 9. | Potomac Mills | 3.09% | 0.30%(+2.79)#12 | 0.024%(+3.06)#223 |
| 10. | Lincolnia | 2.91% | 0.30%(+2.61)#13 | 0.024%(+2.88)#224 |
| 11. | Troutdale | 2.70% | 0.30%(+2.40)#14 | 0.024%(+2.68)#225 |
| 12. | Skyland Estates | 2.65% | 0.30%(+2.36)#15 | 0.024%(+2.63)#226 |
| 13. | Sugarland Run | 2.65% | 0.30%(+2.35)#25 | 0.024%(+2.63)#767 |
| 14. | Sterling | 2.55% | 0.30%(+2.25)#29 | 0.024%(+2.53)#828 |
| 15. | Braddock | 2.53% | 0.30%(+2.23)#30 | 0.024%(+2.51)#829 |
| 16. | Bailey S Crossroads | 2.32% | 0.30%(+2.02)#31 | 0.024%(+2.29)#830 |
| 17. | Loch Lomond | 2.18% | 0.30%(+1.88)#32 | 0.024%(+2.16)#831 |
| 18. | Idylwood | 2.13% | 0.30%(+1.83)#33 | 0.024%(+2.11)#832 |
| 19. | Seven Corners | 2.10% | 0.30%(+1.80)#34 | 0.024%(+2.08)#833 |
| 20. | Springfield | 1.94% | 0.30%(+1.65)#35 | 0.024%(+1.92)#834 |
| 21. | Hybla Valley | 1.89% | 0.30%(+1.59)#36 | 0.024%(+1.86)#835 |
| 22. | Burke | 1.88% | 0.30%(+1.59)#37 | 0.024%(+1.86)#836 |
| 23. | Fairfax | 1.75% | 0.30%(+1.45)#38 | 0.024%(+1.72)#837 |
| 24. | Belle Haven | 1.71% | 0.30%(+1.42)#39 | 0.024%(+1.69)#838 |
| 25. | Long Branch | 1.57% | 0.30%(+1.27)#40 | 0.024%(+1.55)#839 |
| 26. | Dale City | 1.52% | 0.30%(+1.22)#44 | 0.024%(+1.49)#1,269 |
| 27. | Chantilly | 1.43% | 0.30%(+1.13)#45 | 0.024%(+1.41)#1,270 |
| 28. | Newington Forest | 1.30% | 0.30%(+0.999)#46 | 0.024%(+1.27)#1,271 |
| 29. | Mantua | 1.27% | 0.30%(+0.976)#47 | 0.024%(+1.25)#1,272 |
| 30. | Bull Run | 1.16% | 0.30%(+0.863)#48 | 0.024%(+1.14)#1,273 |
| 31. | George Mason | 1.15% | 0.30%(+0.850)#49 | 0.024%(+1.12)#1,274 |
| 32. | Moorefield | 1.15% | 0.30%(+0.849)#50 | 0.024%(+1.12)#1,275 |
| 33. | Lake Barcroft | 1.14% | 0.30%(+0.844)#51 | 0.024%(+1.12)#1,276 |
| 34. | Cascades | 1.10% | 0.30%(+0.802)#52 | 0.024%(+1.08)#1,277 |
| 35. | Arlington | 1.08% | 0.30%(+0.780)#53 | 0.024%(+1.05)#1,278 |
| 36. | Burke Centre | 1.07% | 0.30%(+0.767)#54 | 0.024%(+1.04)#1,279 |
| 37. | Rose Hill Cdp Fairfax County | 0.99% | 0.30%(+0.687)#55 | 0.024%(+0.961)#1,280 |
| 38. | Dumfries | 0.90% | 0.30%(+0.597)#56 | 0.024%(+0.871)#1,281 |
| 39. | Herndon | 0.89% | 0.30%(+0.593)#57 | 0.024%(+0.867)#1,282 |
| 40. | Navy | 0.88% | 0.30%(+0.581)#58 | 0.024%(+0.855)#1,283 |
| 41. | Centreville | 0.88% | 0.30%(+0.581)#59 | 0.024%(+0.855)#1,284 |
| 42. | Lake Ridge | 0.86% | 0.30%(+0.560)#60 | 0.024%(+0.834)#1,285 |
| 43. | Kings Park West | 0.81% | 0.30%(+0.517)#61 | 0.024%(+0.791)#1,286 |
| 44. | Lorton | 0.80% | 0.30%(+0.505)#62 | 0.024%(+0.779)#1,287 |
| 45. | West Springfield | 0.78% | 0.30%(+0.485)#63 | 0.024%(+0.759)#1,288 |
| 46. | Dunn Loring | 0.77% | 0.30%(+0.471)#64 | 0.024%(+0.745)#1,289 |
| 47. | Leesburg | 0.74% | 0.30%(+0.440)#65 | 0.024%(+0.714)#1,394 |
| 48. | Laurel Hill | 0.72% | 0.30%(+0.424)#66 | 0.024%(+0.698)#1,395 |
| 49. | Oakton | 0.72% | 0.30%(+0.422)#67 | 0.024%(+0.696)#1,396 |
| 50. | University Center | 0.71% | 0.30%(+0.412)#68 | 0.024%(+0.686)#1,397 |
| 51. | Fairfax Station | 0.70% | 0.30%(+0.402)#69 | 0.024%(+0.676)#1,398 |
| 52. | Martinsville | 0.69% | 0.30%(+0.396)#70 | 0.024%(+0.670)#1,399 |
| 53. | Dulles Town Center | 0.68% | 0.30%(+0.382)#71 | 0.024%(+0.656)#1,400 |
| 54. | Alexandria | 0.65% | 0.30%(+0.352)#72 | 0.024%(+0.626)#1,401 |
| 55. | Fair Lakes | 0.64% | 0.30%(+0.341)#73 | 0.024%(+0.615)#1,402 |
| 56. | Hutchison | 0.62% | 0.30%(+0.321)#74 | 0.024%(+0.595)#1,403 |
| 57. | Lowes Island | 0.60% | 0.30%(+0.305)#75 | 0.024%(+0.579)#1,404 |
| 58. | Independent Hill | 0.59% | 0.30%(+0.290)#76 | 0.024%(+0.564)#1,405 |
| 59. | Bridgewater | 0.58% | 0.30%(+0.280)#77 | 0.024%(+0.554)#1,406 |
| 60. | Fair Oaks | 0.58% | 0.30%(+0.277)#78 | 0.024%(+0.551)#1,407 |
| 61. | Haymarket | 0.57% | 0.30%(+0.274)#79 | 0.024%(+0.548)#1,408 |
| 62. | Floyd | 0.53% | 0.30%(+0.228)#80 | 0.024%(+0.502)#1,409 |
| 63. | Sudley | 0.51% | 0.30%(+0.215)#81 | 0.024%(+0.489)#1,410 |
| 64. | Reston | 0.51% | 0.30%(+0.210)#82 | 0.024%(+0.484)#1,411 |
| 65. | Lakeside | 0.49% | 0.30%(+0.188)#83 | 0.024%(+0.462)#1,412 |
| 66. | Manassas | 0.47% | 0.30%(+0.171)#84 | 0.024%(+0.445)#1,413 |
| 67. | Brandermill | 0.46% | 0.30%(+0.164)#85 | 0.024%(+0.438)#1,414 |
| 68. | Hayfield | 0.46% | 0.30%(+0.157)#86 | 0.024%(+0.431)#1,415 |
| 69. | Dranesville | 0.40% | 0.30%(+0.105)#87 | 0.024%(+0.379)#1,416 |
| 70. | Triangle | 0.40% | 0.30%(+0.097)#88 | 0.024%(+0.371)#1,417 |
| 71. | Woodbridge | 0.39% | 0.30%(+0.096)#89 | 0.024%(+0.370)#1,418 |
| 72. | Groveton | 0.38% | 0.30%(+0.078)#90 | 0.024%(+0.352)#1,419 |
| 73. | Lansdowne | 0.37% | 0.30%(+0.076)#91 | 0.024%(+0.350)#1,420 |
| 74. | South Riding | 0.37% | 0.30%(+0.070)#92 | 0.024%(+0.345)#1,421 |
| 75. | Newington | 0.35% | 0.30%(+0.048)#93 | 0.024%(+0.322)#1,422 |
| 76. | Woodlawn Cdp Fairfax County | 0.34% | 0.30%(+0.041)#94 | 0.024%(+0.315)#1,423 |
| 77. | Huntington | 0.34% | 0.30%(+0.040)#95 | 0.024%(+0.314)#1,424 |
| 78. | Linton Hall | 0.33% | 0.30%(+0.037)#96 | 0.024%(+0.311)#1,425 |
| 79. | Falls Church | 0.33% | 0.30%(+0.031)#97 | 0.024%(+0.305)#1,426 |
| 80. | Greenbriar | 0.33% | 0.30%(+0.029)#98 | 0.024%(+0.303)#1,427 |
| 81. | Brambleton | 0.32% | 0.30%(+0.026)#99 | 0.024%(+0.300)#1,428 |
| 82. | Leesylvania | 0.32% | 0.30%(+0.023)#100 | 0.024%(+0.297)#1,429 |
| 83. | Culpeper | 0.31% | 0.30%(+0.015)#101 | 0.024%(+0.289)#1,430 |
| 84. | Kingstowne | 0.29% | 0.30%(-0.007)#102 | 0.024%(+0.267)#1,431 |
| 85. | Crosspointe | 0.28% | 0.30%(-0.015)#103 | 0.024%(+0.259)#1,432 |
| 86. | Mcnair | 0.27% | 0.30%(-0.023)#104 | 0.024%(+0.251)#1,433 |
| 87. | Franconia | 0.27% | 0.30%(-0.025)#105 | 0.024%(+0.249)#1,434 |
| 88. | Aquia Harbour | 0.27% | 0.30%(-0.025)#106 | 0.024%(+0.249)#1,435 |
| 89. | Massanetta Springs | 0.27% | 0.30%(-0.026)#107 | 0.024%(+0.248)#1,436 |
| 90. | Tysons | 0.27% | 0.30%(-0.027)#108 | 0.024%(+0.247)#1,437 |
| 91. | Floris | 0.27% | 0.30%(-0.029)#109 | 0.024%(+0.245)#1,438 |
| 92. | Cherry Hill | 0.25% | 0.30%(-0.045)#110 | 0.024%(+0.229)#1,439 |
| 93. | Loudoun Valley Estates | 0.23% | 0.30%(-0.070)#111 | 0.024%(+0.204)#1,440 |
| 94. | Stafford Courthouse | 0.22% | 0.30%(-0.078)#112 | 0.024%(+0.196)#1,441 |
| 95. | Gainesville | 0.22% | 0.30%(-0.080)#113 | 0.024%(+0.194)#1,442 |
| 96. | Buckhall | 0.20% | 0.30%(-0.094)#114 | 0.024%(+0.180)#1,443 |
| 97. | Ashburn | 0.19% | 0.30%(-0.107)#115 | 0.024%(+0.167)#1,444 |
| 98. | Stone Ridge | 0.19% | 0.30%(-0.111)#116 | 0.024%(+0.163)#1,445 |
| 99. | Montclair | 0.19% | 0.30%(-0.113)#117 | 0.024%(+0.161)#1,446 |
| 100. | Meadowbrook | 0.18% | 0.30%(-0.119)#118 | 0.024%(+0.155)#1,447 |
Common Questions
What are the Top 10 Cities with the Highest Percentage of Immigrants from Bolivia in Virginia?
Top 10 Cities with the Highest Percentage of Immigrants from Bolivia in Virginia are:
#1
6.82%
#2
6.47%
#3
6.27%
#4
4.90%
#5
4.35%
#6
3.66%
#7
3.30%
#8
3.28%
#9
3.09%
#10
2.91%
What city has the Highest Percentage of Immigrants from Bolivia in Virginia?
Apple Mountain Lake has the Highest Percentage of Immigrants from Bolivia in Virginia with 6.82%.
What is the Percentage of Immigrants from Bolivia in the State of Virginia?
Percentage of Immigrants from Bolivia in Virginia is 0.30%.
What is the Percentage of Immigrants from Bolivia in the United States?
Percentage of Immigrants from Bolivia in the United States is 0.024%.