Arcola, VA
Arcola Map
Arcola Overview
2,437
TOTAL POPULATION
1,266
MALE POPULATION
1,171
FEMALE POPULATION
108.11
MALES / 100 FEMALES
92.50
FEMALES / 100 MALES
33.4
MEDIAN AGE
3.0
AVG FAMILY SIZE
2.7
AVG HOUSEHOLD SIZE
$49,148
PER CAPITA INCOME
$130,938
AVG FAMILY INCOME
$119,659
AVG HOUSEHOLD INCOME
64.1%
WAGE / INCOME GAP [ % ]
35.9¢/ $1
WAGE / INCOME GAP [ $ ]
0.32
INEQUALITY / GINI INDEX
1,306
LABOR FORCE [ PEOPLE ]
73.1%
PERCENT IN LABOR FORCE
2.3%
UNEMPLOYMENT RATE
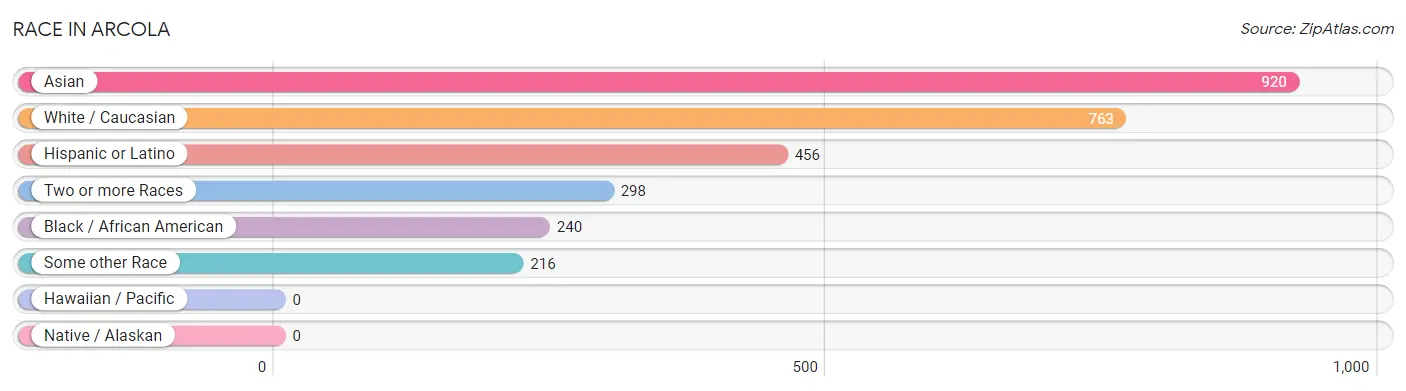
Race in Arcola
The most populous races in Arcola are Asian (920 | 37.8%), White / Caucasian (763 | 31.3%), and Hispanic or Latino (456 | 18.7%).
| Race | # Population | % Population |
| Asian | 920 | 37.8% |
| Black / African American | 240 | 9.9% |
| Hawaiian / Pacific | 0 | 0.0% |
| Hispanic or Latino | 456 | 18.7% |
| Native / Alaskan | 0 | 0.0% |
| White / Caucasian | 763 | 31.3% |
| Two or more Races | 298 | 12.2% |
| Some other Race | 216 | 8.9% |
| Total | 2,437 | 100.0% |
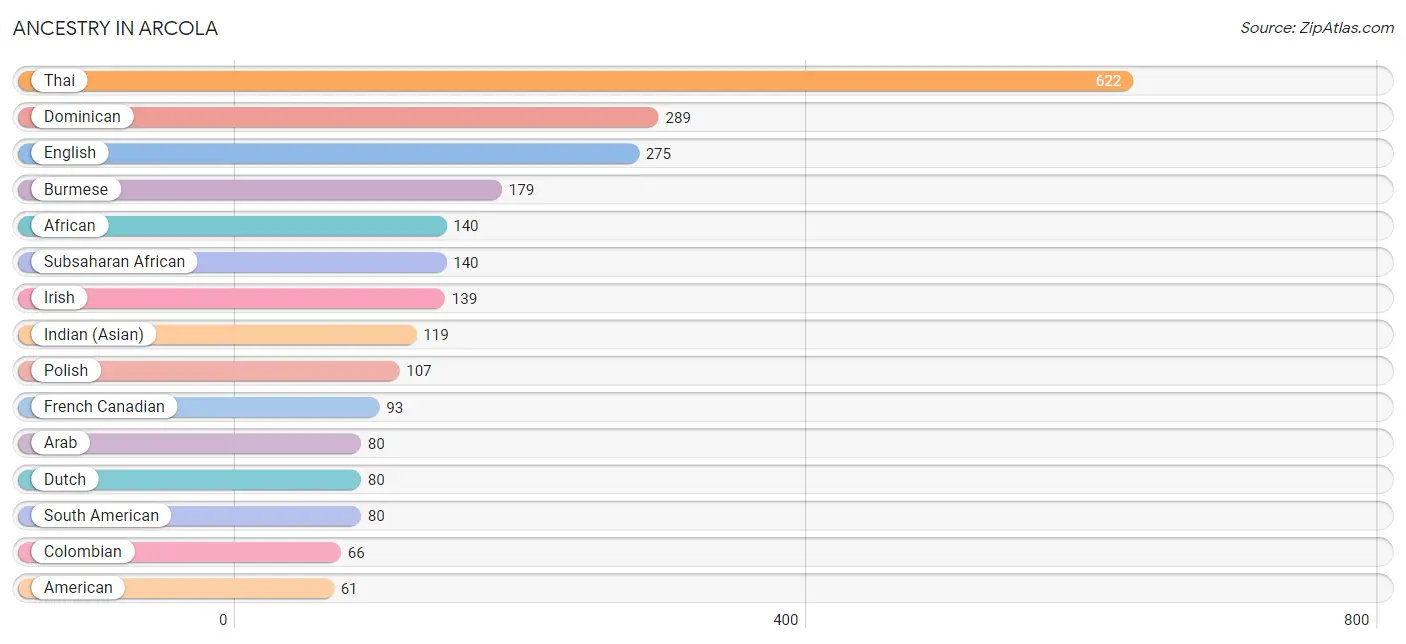
Ancestry in Arcola
The most populous ancestries reported in Arcola are Thai (622 | 25.5%), Dominican (289 | 11.9%), English (275 | 11.3%), Burmese (179 | 7.3%), and African (140 | 5.7%), together accounting for 61.7% of all Arcola residents.
| Ancestry | # Population | % Population |
| African | 140 | 5.7% |
| American | 61 | 2.5% |
| Arab | 80 | 3.3% |
| British | 27 | 1.1% |
| Burmese | 179 | 7.3% |
| Colombian | 66 | 2.7% |
| Cuban | 35 | 1.4% |
| Dominican | 289 | 11.9% |
| Dutch | 80 | 3.3% |
| Ecuadorian | 14 | 0.6% |
| English | 275 | 11.3% |
| French | 33 | 1.3% |
| French Canadian | 93 | 3.8% |
| German | 53 | 2.2% |
| Indian (Asian) | 119 | 4.9% |
| Iranian | 14 | 0.6% |
| Iraqi | 45 | 1.8% |
| Irish | 139 | 5.7% |
| Italian | 53 | 2.2% |
| Jamaican | 54 | 2.2% |
| Jordanian | 35 | 1.4% |
| Norwegian | 26 | 1.1% |
| Polish | 107 | 4.4% |
| Puerto Rican | 32 | 1.3% |
| Scandinavian | 14 | 0.6% |
| South American | 80 | 3.3% |
| Subsaharan African | 140 | 5.7% |
| Swedish | 34 | 1.4% |
| Thai | 622 | 25.5% | View All 29 Rows |
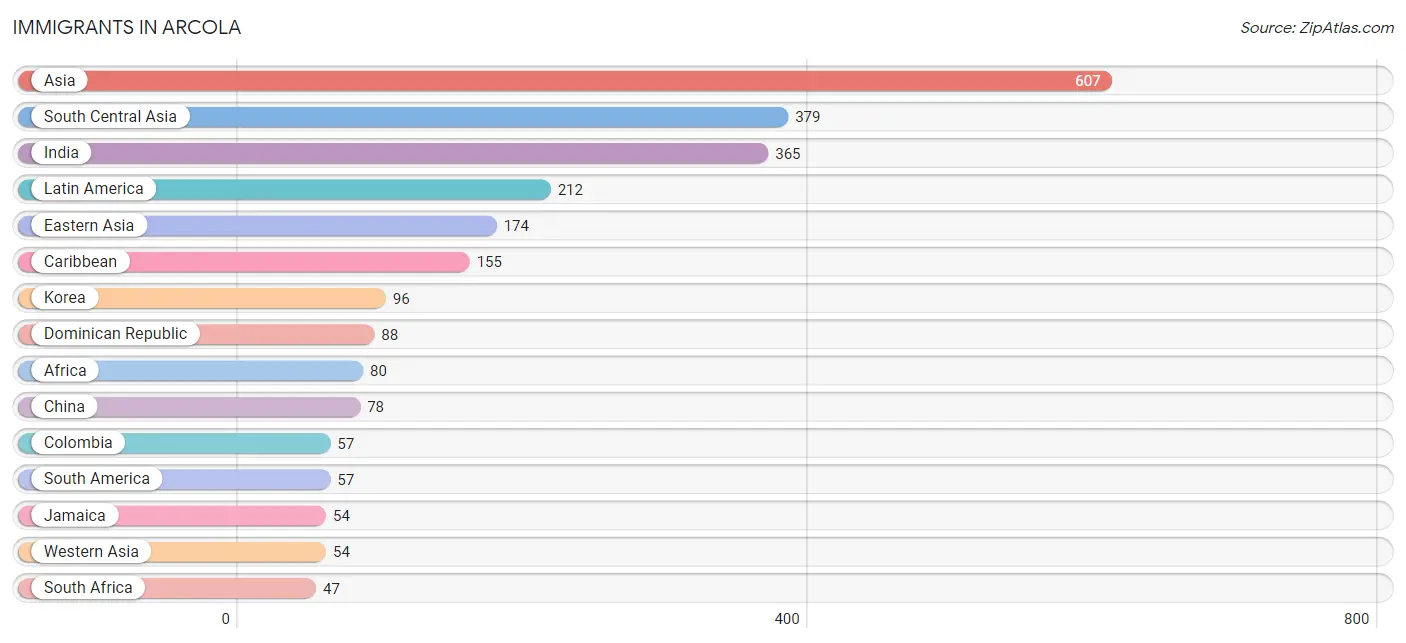
Immigrants in Arcola
The most numerous immigrant groups reported in Arcola came from Asia (607 | 24.9%), South Central Asia (379 | 15.5%), India (365 | 15.0%), Latin America (212 | 8.7%), and Eastern Asia (174 | 7.1%), together accounting for 71.3% of all Arcola residents.
| Immigration Origin | # Population | % Population |
| Africa | 80 | 3.3% |
| Asia | 607 | 24.9% |
| Caribbean | 155 | 6.4% |
| China | 78 | 3.2% |
| Colombia | 57 | 2.3% |
| Dominican Republic | 88 | 3.6% |
| Eastern Africa | 16 | 0.7% |
| Eastern Asia | 174 | 7.1% |
| Egypt | 17 | 0.7% |
| Ethiopia | 16 | 0.7% |
| India | 365 | 15.0% |
| Iran | 14 | 0.6% |
| Iraq | 45 | 1.8% |
| Jamaica | 54 | 2.2% |
| Jordan | 9 | 0.4% |
| Korea | 96 | 3.9% |
| Latin America | 212 | 8.7% |
| Northern Africa | 17 | 0.7% |
| South Africa | 47 | 1.9% |
| South America | 57 | 2.3% |
| South Central Asia | 379 | 15.5% |
| Taiwan | 12 | 0.5% |
| Trinidad and Tobago | 13 | 0.5% |
| Western Asia | 54 | 2.2% | View All 24 Rows |
Sex and Age in Arcola
Sex and Age in Arcola
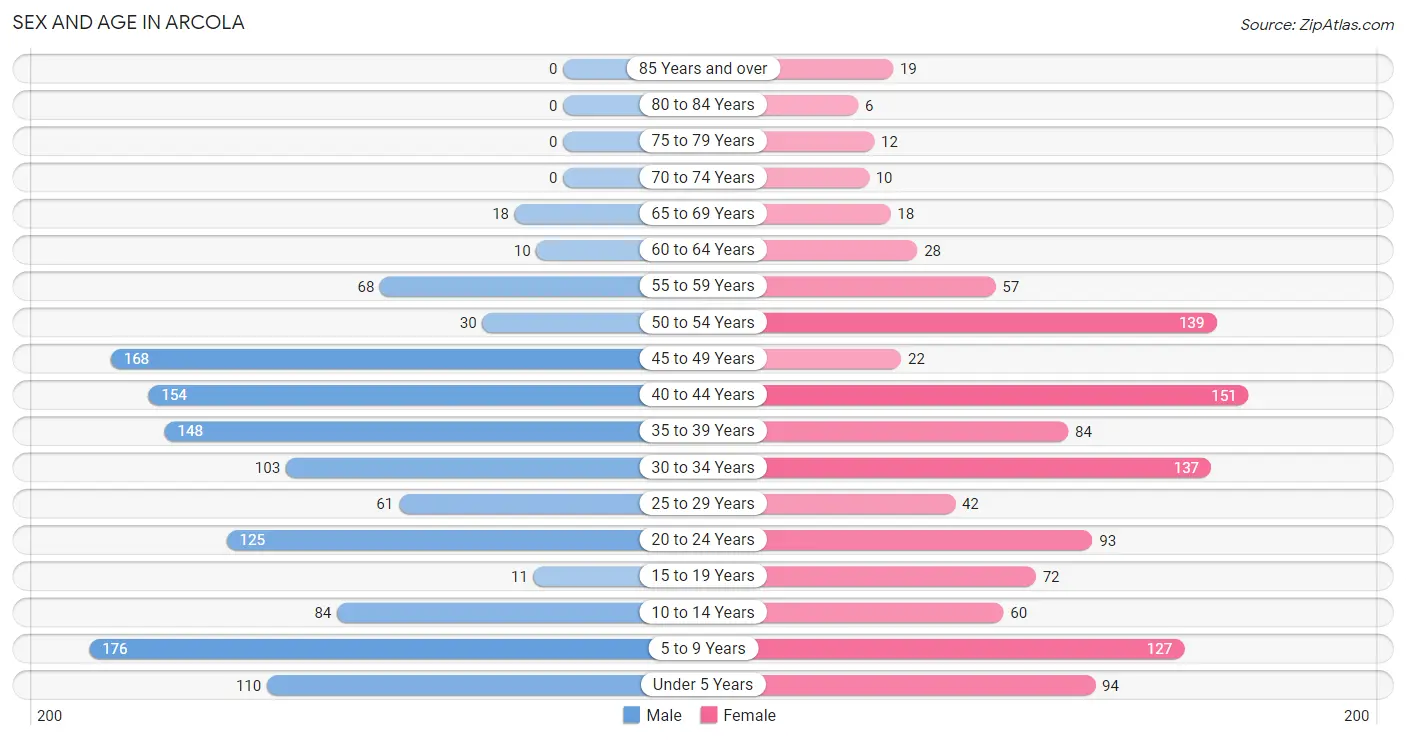
The most populous age groups in Arcola are 5 to 9 Years (176 | 13.9%) for men and 40 to 44 Years (151 | 12.9%) for women.
| Age Bracket | Male | Female |
| Under 5 Years | 110 (8.7%) | 94 (8.0%) |
| 5 to 9 Years | 176 (13.9%) | 127 (10.8%) |
| 10 to 14 Years | 84 (6.6%) | 60 (5.1%) |
| 15 to 19 Years | 11 (0.9%) | 72 (6.1%) |
| 20 to 24 Years | 125 (9.9%) | 93 (7.9%) |
| 25 to 29 Years | 61 (4.8%) | 42 (3.6%) |
| 30 to 34 Years | 103 (8.1%) | 137 (11.7%) |
| 35 to 39 Years | 148 (11.7%) | 84 (7.2%) |
| 40 to 44 Years | 154 (12.2%) | 151 (12.9%) |
| 45 to 49 Years | 168 (13.3%) | 22 (1.9%) |
| 50 to 54 Years | 30 (2.4%) | 139 (11.9%) |
| 55 to 59 Years | 68 (5.4%) | 57 (4.9%) |
| 60 to 64 Years | 10 (0.8%) | 28 (2.4%) |
| 65 to 69 Years | 18 (1.4%) | 18 (1.5%) |
| 70 to 74 Years | 0 (0.0%) | 10 (0.9%) |
| 75 to 79 Years | 0 (0.0%) | 12 (1.0%) |
| 80 to 84 Years | 0 (0.0%) | 6 (0.5%) |
| 85 Years and over | 0 (0.0%) | 19 (1.6%) |
| Total | 1,266 (100.0%) | 1,171 (100.0%) |
Families and Households in Arcola
Median Family Size in Arcola
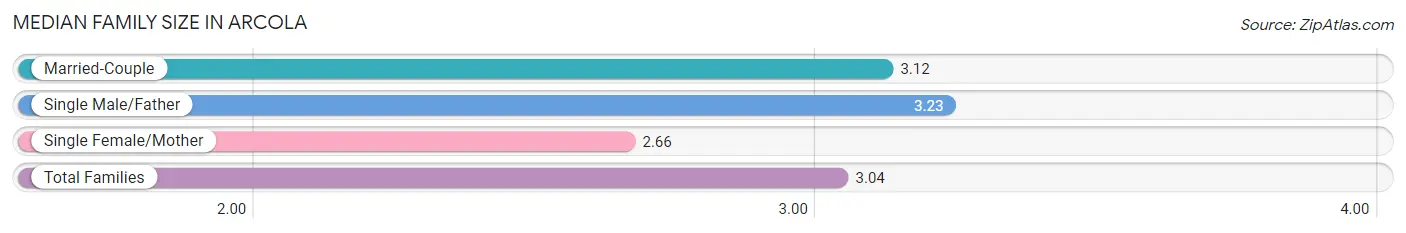
The median family size in Arcola is 3.04 persons per family, with single male/father families (44 | 6.2%) accounting for the largest median family size of 3.23 persons per family. On the other hand, single female/mother families (134 | 19.0%) represent the smallest median family size with 2.66 persons per family.
| Family Type | # Families | Family Size |
| Married-Couple | 527 (74.8%) | 3.12 |
| Single Male/Father | 44 (6.2%) | 3.23 |
| Single Female/Mother | 134 (19.0%) | 2.66 |
| Total Families | 705 (100.0%) | 3.04 |
Median Household Size in Arcola
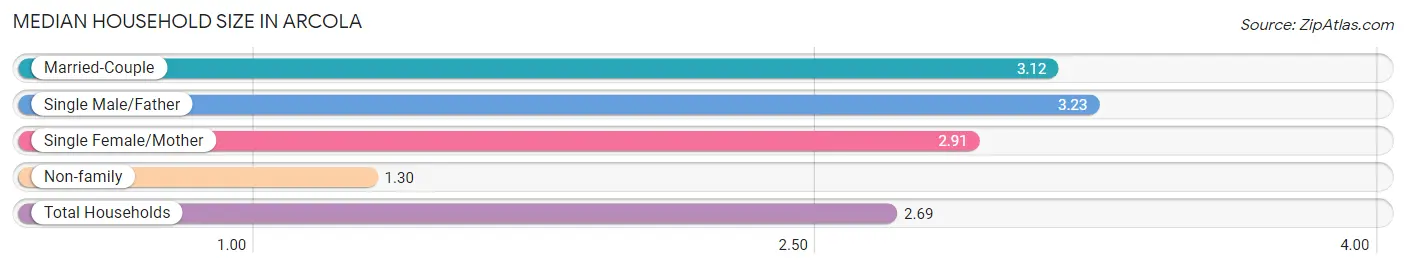
The median household size in Arcola is 2.69 persons per household, with single male/father households (44 | 4.9%) accounting for the largest median household size of 3.23 persons per household. non-family households (202 | 22.3%) represent the smallest median household size with 1.30 persons per household.
| Household Type | # Households | Household Size |
| Married-Couple | 527 (58.1%) | 3.12 |
| Single Male/Father | 44 (4.9%) | 3.23 |
| Single Female/Mother | 134 (14.8%) | 2.91 |
| Non-family | 202 (22.3%) | 1.30 |
| Total Households | 907 (100.0%) | 2.69 |
Household Size by Marriage Status in Arcola
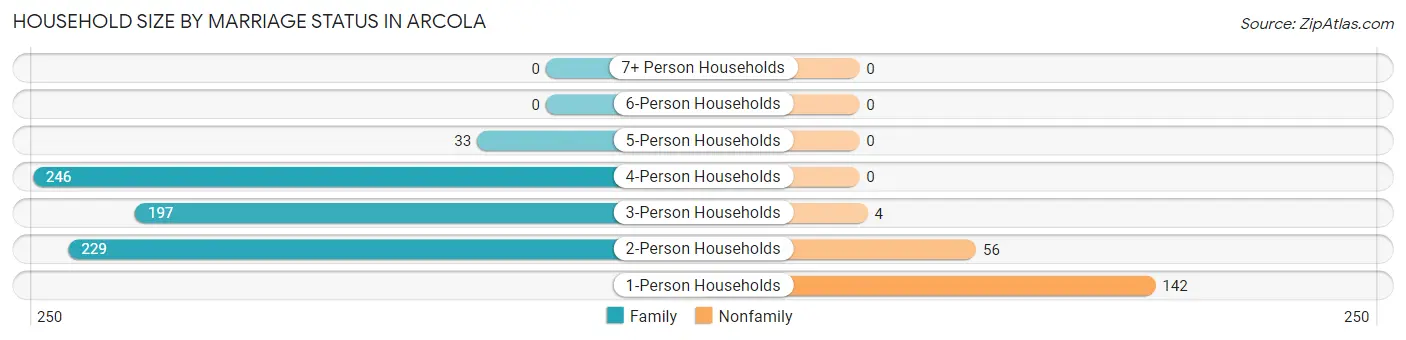
Out of a total of 907 households in Arcola, 705 (77.7%) are family households, while 202 (22.3%) are nonfamily households. The most numerous type of family households are 4-person households, comprising 246, and the most common type of nonfamily households are 1-person households, comprising 142.
| Household Size | Family Households | Nonfamily Households |
| 1-Person Households | - | 142 (15.7%) |
| 2-Person Households | 229 (25.3%) | 56 (6.2%) |
| 3-Person Households | 197 (21.7%) | 4 (0.4%) |
| 4-Person Households | 246 (27.1%) | 0 (0.0%) |
| 5-Person Households | 33 (3.6%) | 0 (0.0%) |
| 6-Person Households | 0 (0.0%) | 0 (0.0%) |
| 7+ Person Households | 0 (0.0%) | 0 (0.0%) |
| Total | 705 (77.7%) | 202 (22.3%) |
Female Fertility in Arcola
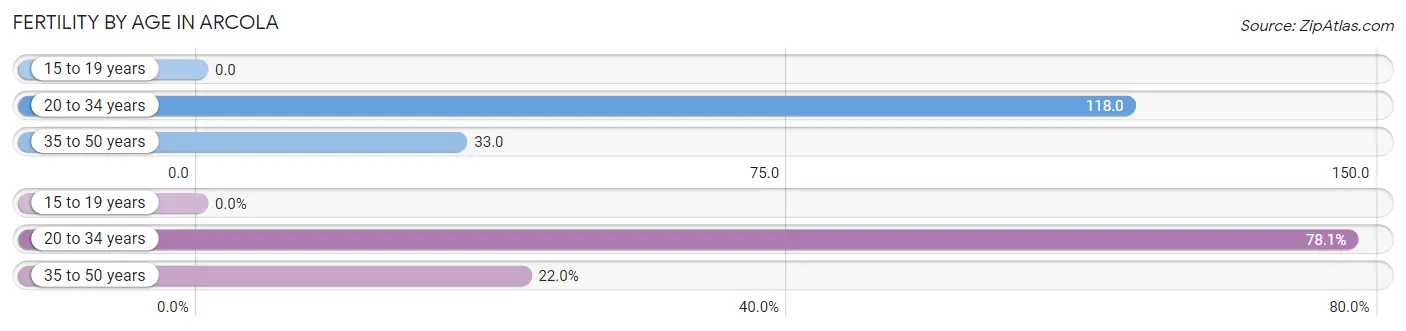
Fertility by Age in Arcola
Average fertility rate in Arcola is 67.0 births per 1,000 women. Women in the age bracket of 20 to 34 years have the highest fertility rate with 118.0 births per 1,000 women. Women in the age bracket of 20 to 34 years acount for 78.0% of all women with births.
| Age Bracket | Women with Births | Births / 1,000 Women |
| 15 to 19 years | 0 (0.0%) | 0.0 |
| 20 to 34 years | 32 (78.0%) | 118.0 |
| 35 to 50 years | 9 (22.0%) | 33.0 |
| Total | 41 (100.0%) | 67.0 |
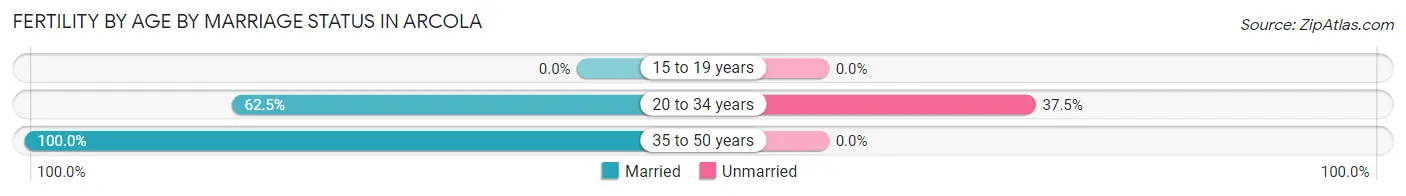
Fertility by Age by Marriage Status in Arcola
70.7% of women with births (41) in Arcola are married. The highest percentage of unmarried women with births falls into 20 to 34 years age bracket with 37.5% of them unmarried at the time of birth, while the lowest percentage of unmarried women with births belong to 35 to 50 years age bracket with 0.0% of them unmarried.
| Age Bracket | Married | Unmarried |
| 15 to 19 years | 0 (0.0%) | 0 (0.0%) |
| 20 to 34 years | 20 (62.5%) | 12 (37.5%) |
| 35 to 50 years | 9 (100.0%) | 0 (0.0%) |
| Total | 29 (70.7%) | 12 (29.3%) |
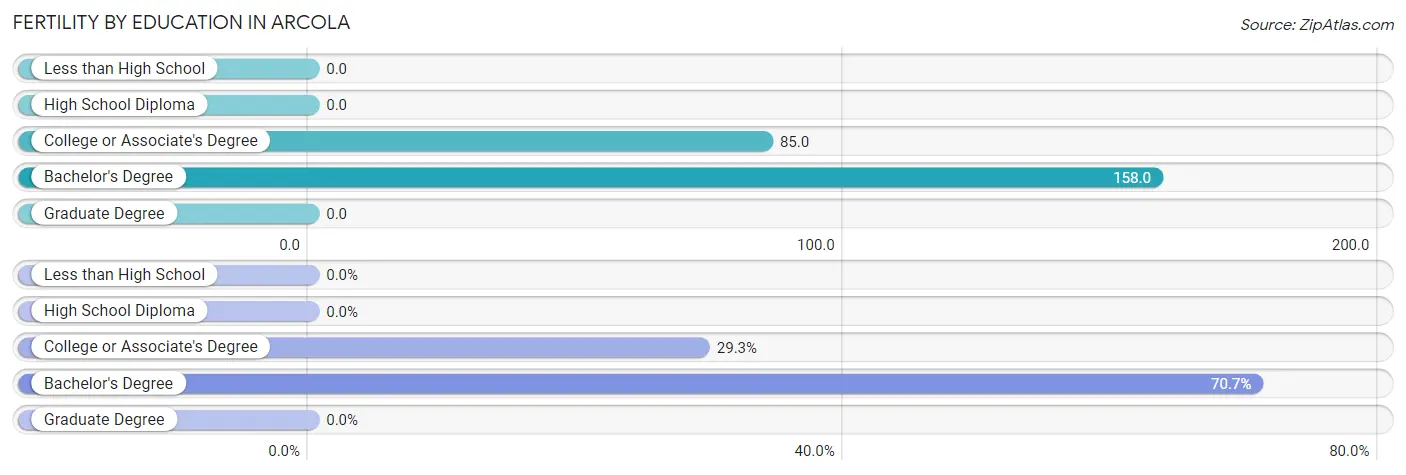
Fertility by Education in Arcola
| Educational Attainment | Women with Births | Births / 1,000 Women |
| Less than High School | 0 (0.0%) | 0.0 |
| High School Diploma | 0 (0.0%) | 0.0 |
| College or Associate's Degree | 12 (29.3%) | 85.0 |
| Bachelor's Degree | 29 (70.7%) | 158.0 |
| Graduate Degree | 0 (0.0%) | 0.0 |
| Total | 41 (100.0%) | 67.0 |
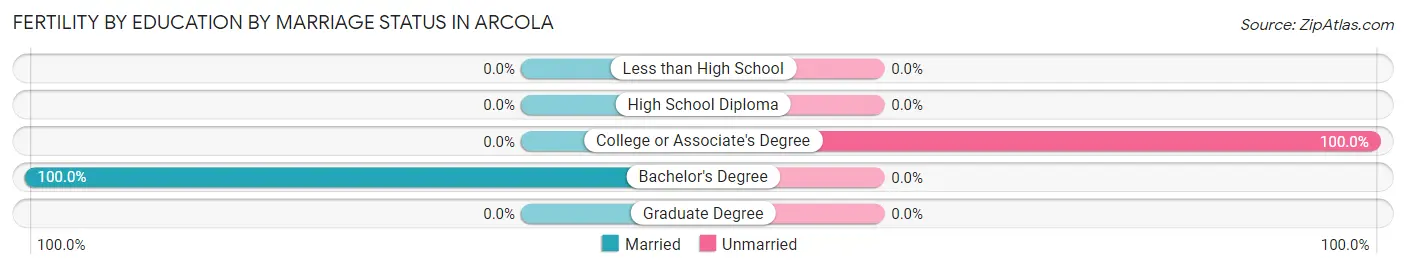
Fertility by Education by Marriage Status in Arcola
29.3% of women with births in Arcola are unmarried. Women with the educational attainment of bachelor's degree are most likely to be married with 100.0% of them married at childbirth, while women with the educational attainment of college or associate's degree are least likely to be married with 100.0% of them unmarried at childbirth.
| Educational Attainment | Married | Unmarried |
| Less than High School | 0 (0.0%) | 0 (0.0%) |
| High School Diploma | 0 (0.0%) | 0 (0.0%) |
| College or Associate's Degree | 0 (0.0%) | 12 (100.0%) |
| Bachelor's Degree | 29 (100.0%) | 0 (0.0%) |
| Graduate Degree | 0 (0.0%) | 0 (0.0%) |
| Total | 29 (70.7%) | 12 (29.3%) |
Income in Arcola
Income Overview in Arcola
Per Capita Income in Arcola is $49,148, while median incomes of families and households are $130,938 and $119,659 respectively.
| Characteristic | Number | Measure |
| Per Capita Income | 2,437 | $49,148 |
| Median Family Income | 705 | $130,938 |
| Mean Family Income | 705 | $137,186 |
| Median Household Income | 907 | $119,659 |
| Mean Household Income | 907 | $130,947 |
| Income Deficit | 705 | $0 |
| Wage / Income Gap (%) | 2,437 | 64.08% |
| Wage / Income Gap ($) | 2,437 | 35.92¢ per $1 |
| Gini / Inequality Index | 2,437 | 0.32 |
Earnings by Sex in Arcola
Average Earnings in Arcola are $72,594, $89,095 for men and $32,000 for women, a difference of 64.1%.
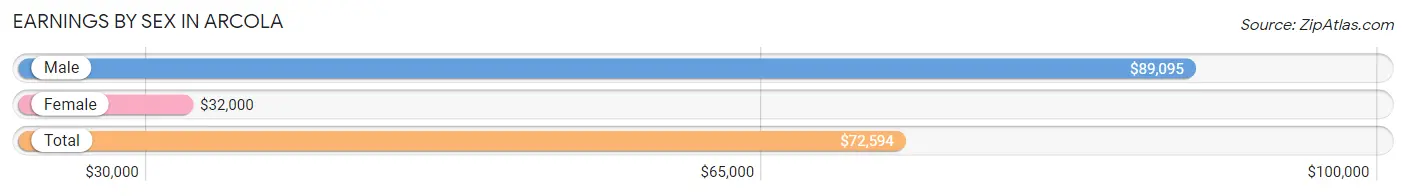
| Sex | Number | Average Earnings |
| Male | 767 (56.2%) | $89,095 |
| Female | 598 (43.8%) | $32,000 |
| Total | 1,365 (100.0%) | $72,594 |
Earnings by Sex by Income Bracket in Arcola
The most common earnings brackets in Arcola are $100,000+ for men (325 | 42.4%) and $2,499 or less for women (109 | 18.2%).
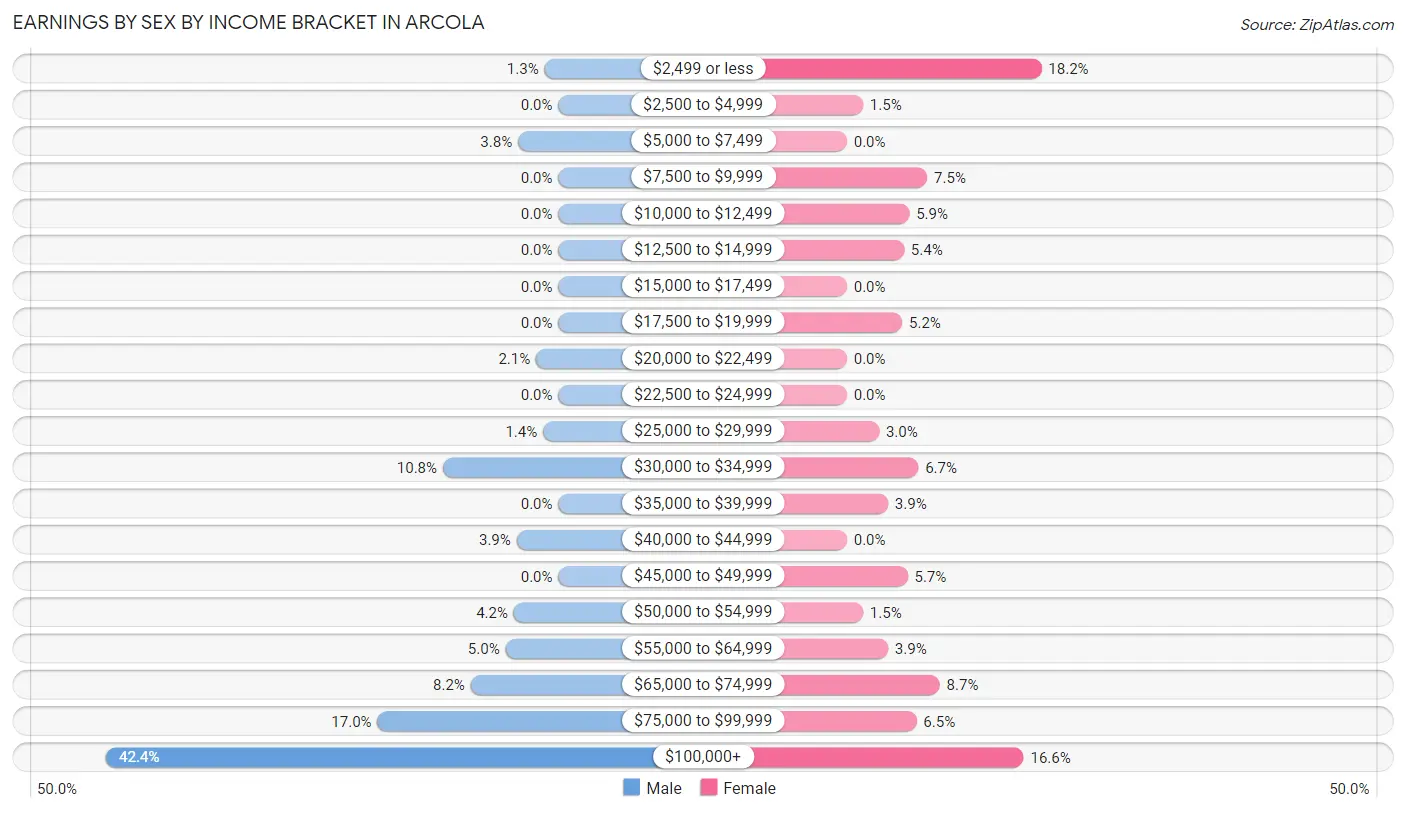
| Income | Male | Female |
| $2,499 or less | 10 (1.3%) | 109 (18.2%) |
| $2,500 to $4,999 | 0 (0.0%) | 9 (1.5%) |
| $5,000 to $7,499 | 29 (3.8%) | 0 (0.0%) |
| $7,500 to $9,999 | 0 (0.0%) | 45 (7.5%) |
| $10,000 to $12,499 | 0 (0.0%) | 35 (5.9%) |
| $12,500 to $14,999 | 0 (0.0%) | 32 (5.3%) |
| $15,000 to $17,499 | 0 (0.0%) | 0 (0.0%) |
| $17,500 to $19,999 | 0 (0.0%) | 31 (5.2%) |
| $20,000 to $22,499 | 16 (2.1%) | 0 (0.0%) |
| $22,500 to $24,999 | 0 (0.0%) | 0 (0.0%) |
| $25,000 to $29,999 | 11 (1.4%) | 18 (3.0%) |
| $30,000 to $34,999 | 83 (10.8%) | 40 (6.7%) |
| $35,000 to $39,999 | 0 (0.0%) | 23 (3.8%) |
| $40,000 to $44,999 | 30 (3.9%) | 0 (0.0%) |
| $45,000 to $49,999 | 0 (0.0%) | 34 (5.7%) |
| $50,000 to $54,999 | 32 (4.2%) | 9 (1.5%) |
| $55,000 to $64,999 | 38 (5.0%) | 23 (3.8%) |
| $65,000 to $74,999 | 63 (8.2%) | 52 (8.7%) |
| $75,000 to $99,999 | 130 (17.0%) | 39 (6.5%) |
| $100,000+ | 325 (42.4%) | 99 (16.6%) |
| Total | 767 (100.0%) | 598 (100.0%) |
Earnings by Sex by Educational Attainment in Arcola
Average earnings in Arcola are $108,000 for men and $36,136 for women, a difference of 66.5%. Men with an educational attainment of graduate degree enjoy the highest average annual earnings of $155,677, while those with high school diploma education earn the least with $72,685. Women with an educational attainment of bachelor's degree earn the most with the average annual earnings of $72,250, while those with bachelor's degree education have the smallest earnings of $72,250.
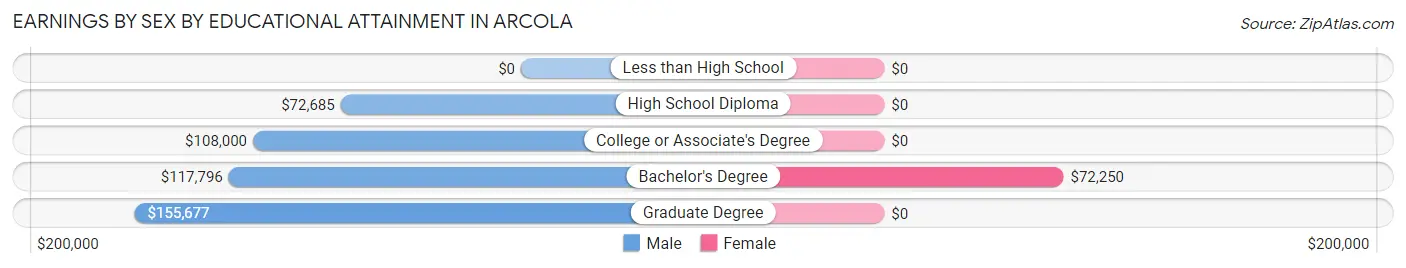
| Educational Attainment | Male Income | Female Income |
| Less than High School | - | - |
| High School Diploma | $72,685 | $0 |
| College or Associate's Degree | $108,000 | $0 |
| Bachelor's Degree | $117,796 | $72,250 |
| Graduate Degree | $155,677 | $0 |
| Total | $108,000 | $36,136 |
Family Income in Arcola
Family Income Brackets in Arcola
According to the Arcola family income data, there are 168 families falling into the $200,000+ income range, which is the most common income bracket and makes up 23.8% of all families.
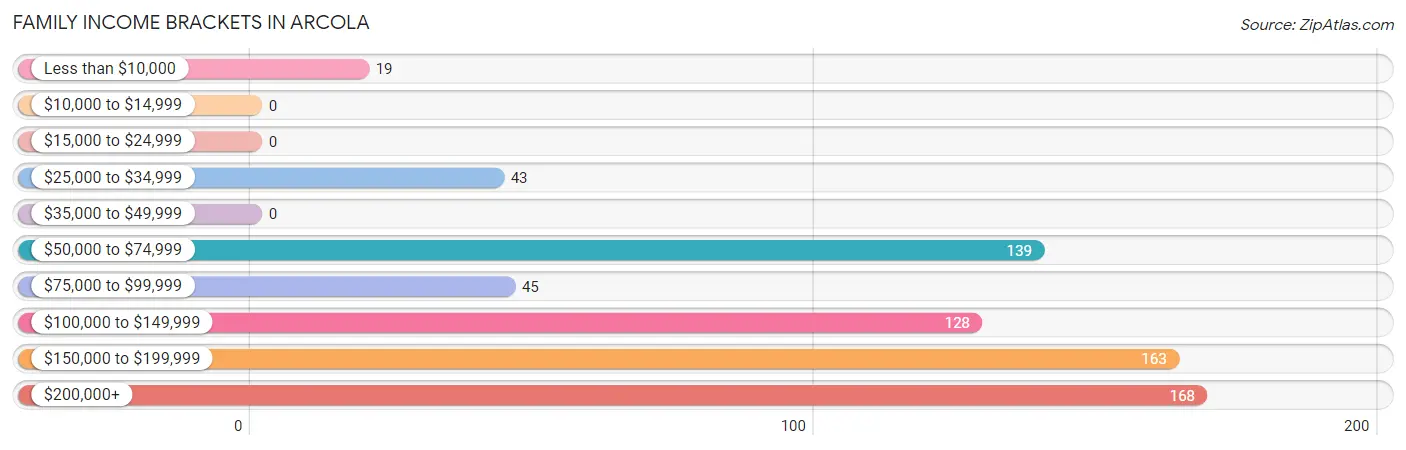
| Income Bracket | # Families | % Families |
| Less than $10,000 | 19 | 2.7% |
| $10,000 to $14,999 | 0 | 0.0% |
| $15,000 to $24,999 | 0 | 0.0% |
| $25,000 to $34,999 | 43 | 6.1% |
| $35,000 to $49,999 | 0 | 0.0% |
| $50,000 to $74,999 | 139 | 19.7% |
| $75,000 to $99,999 | 45 | 6.4% |
| $100,000 to $149,999 | 128 | 18.2% |
| $150,000 to $199,999 | 163 | 23.1% |
| $200,000+ | 168 | 23.8% |
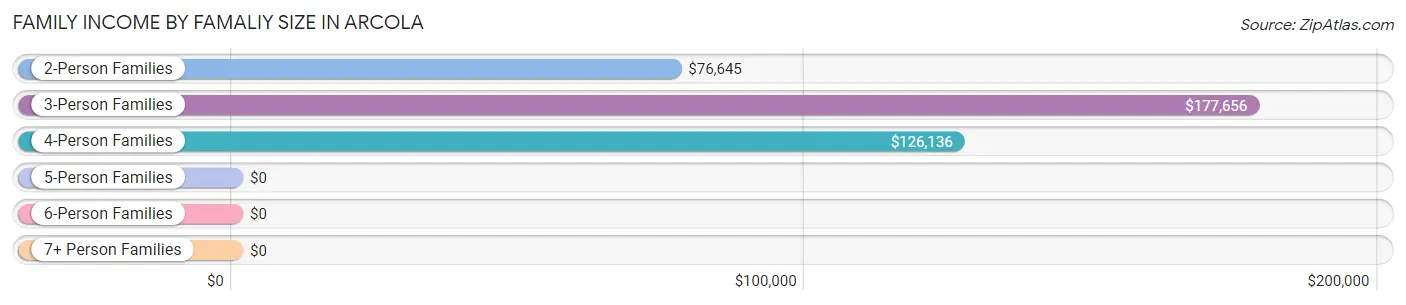
Family Income by Famaliy Size in Arcola
3-person families (210 | 29.8%) account for the highest median family income in Arcola with $177,656 per family, while 3-person families (210 | 29.8%) have the highest median income of $59,219 per family member.
| Income Bracket | # Families | Median Income |
| 2-Person Families | 229 (32.5%) | $76,645 |
| 3-Person Families | 210 (29.8%) | $177,656 |
| 4-Person Families | 246 (34.9%) | $126,136 |
| 5-Person Families | 20 (2.8%) | $0 |
| 6-Person Families | 0 (0.0%) | $0 |
| 7+ Person Families | 0 (0.0%) | $0 |
| Total | 705 (100.0%) | $130,938 |
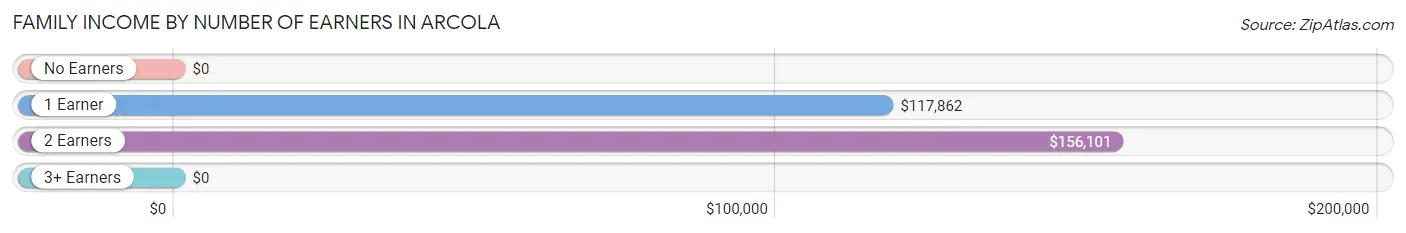
Family Income by Number of Earners in Arcola
| Number of Earners | # Families | Median Income |
| No Earners | 25 (3.5%) | $0 |
| 1 Earner | 335 (47.5%) | $117,862 |
| 2 Earners | 313 (44.4%) | $156,101 |
| 3+ Earners | 32 (4.5%) | $0 |
| Total | 705 (100.0%) | $130,938 |
Household Income in Arcola
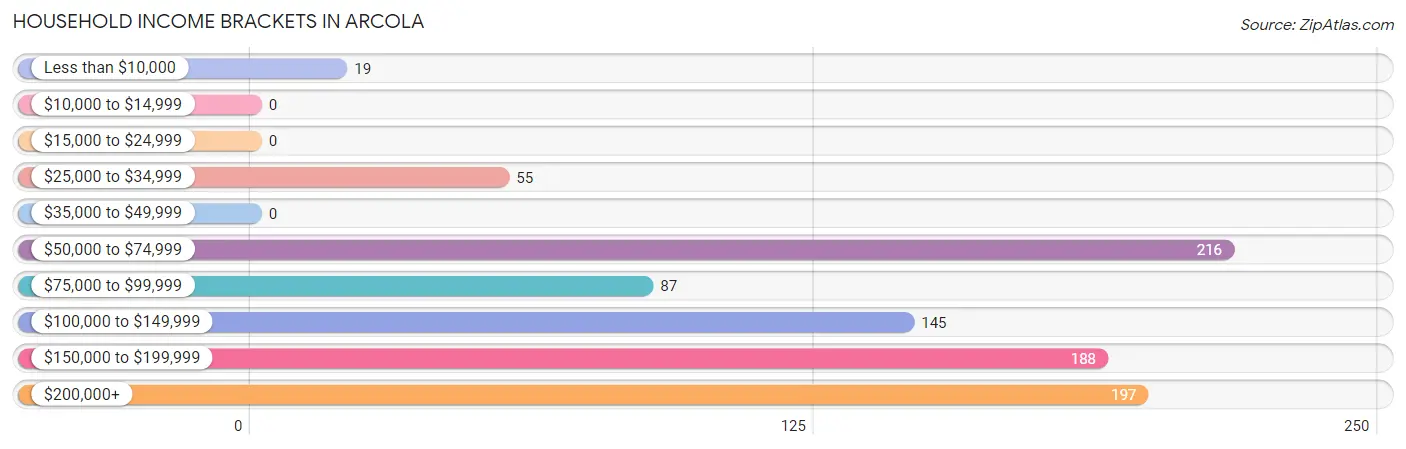
Household Income Brackets in Arcola
With 216 households falling in the category, the $50,000 to $74,999 income range is the most frequent in Arcola, accounting for 23.8% of all households.
| Income Bracket | # Households | % Households |
| Less than $10,000 | 19 | 2.1% |
| $10,000 to $14,999 | 0 | 0.0% |
| $15,000 to $24,999 | 0 | 0.0% |
| $25,000 to $34,999 | 55 | 6.1% |
| $35,000 to $49,999 | 0 | 0.0% |
| $50,000 to $74,999 | 216 | 23.8% |
| $75,000 to $99,999 | 87 | 9.6% |
| $100,000 to $149,999 | 145 | 16.0% |
| $150,000 to $199,999 | 188 | 20.7% |
| $200,000+ | 197 | 21.7% |
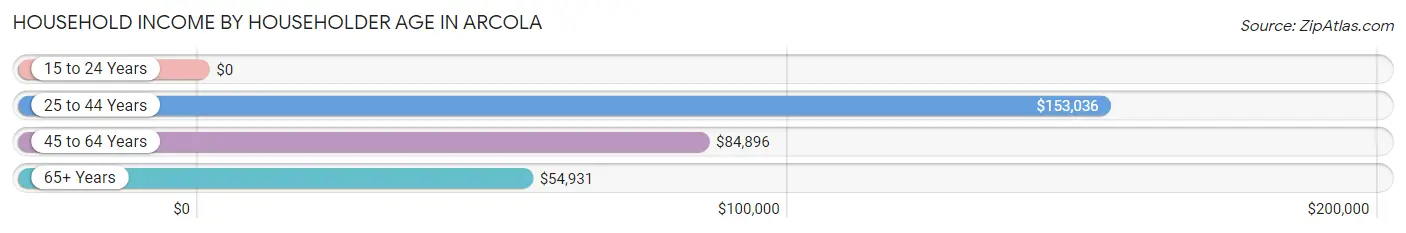
Household Income by Householder Age in Arcola
The median household income in Arcola is $119,659, with the highest median household income of $153,036 found in the 25 to 44 years age bracket for the primary householder. A total of 436 households (48.1%) fall into this category. Meanwhile, the 15 to 24 years age bracket for the primary householder has the lowest median household income of $0, with 33 households (3.6%) in this group.
| Income Bracket | # Households | Median Income |
| 15 to 24 Years | 33 (3.6%) | $0 |
| 25 to 44 Years | 436 (48.1%) | $153,036 |
| 45 to 64 Years | 379 (41.8%) | $84,896 |
| 65+ Years | 59 (6.5%) | $54,931 |
| Total | 907 (100.0%) | $119,659 |
Poverty in Arcola
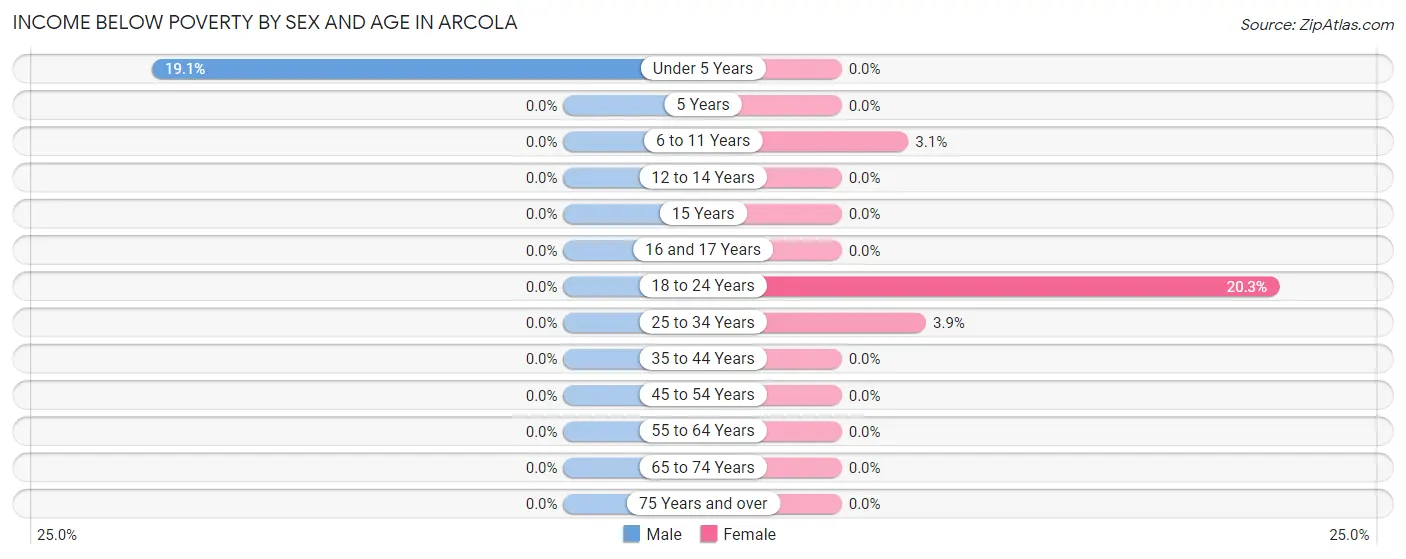
Income Below Poverty by Sex and Age in Arcola
With 1.7% poverty level for males and 3.5% for females among the residents of Arcola, under 5 year old males and 18 to 24 year old females are the most vulnerable to poverty, with 21 males (19.1%) and 29 females (20.3%) in their respective age groups living below the poverty level.
| Age Bracket | Male | Female |
| Under 5 Years | 21 (19.1%) | 0 (0.0%) |
| 5 Years | 0 (0.0%) | 0 (0.0%) |
| 6 to 11 Years | 0 (0.0%) | 5 (3.1%) |
| 12 to 14 Years | 0 (0.0%) | 0 (0.0%) |
| 15 Years | 0 (0.0%) | 0 (0.0%) |
| 16 and 17 Years | 0 (0.0%) | 0 (0.0%) |
| 18 to 24 Years | 0 (0.0%) | 29 (20.3%) |
| 25 to 34 Years | 0 (0.0%) | 7 (3.9%) |
| 35 to 44 Years | 0 (0.0%) | 0 (0.0%) |
| 45 to 54 Years | 0 (0.0%) | 0 (0.0%) |
| 55 to 64 Years | 0 (0.0%) | 0 (0.0%) |
| 65 to 74 Years | 0 (0.0%) | 0 (0.0%) |
| 75 Years and over | 0 (0.0%) | 0 (0.0%) |
| Total | 21 (1.7%) | 41 (3.5%) |
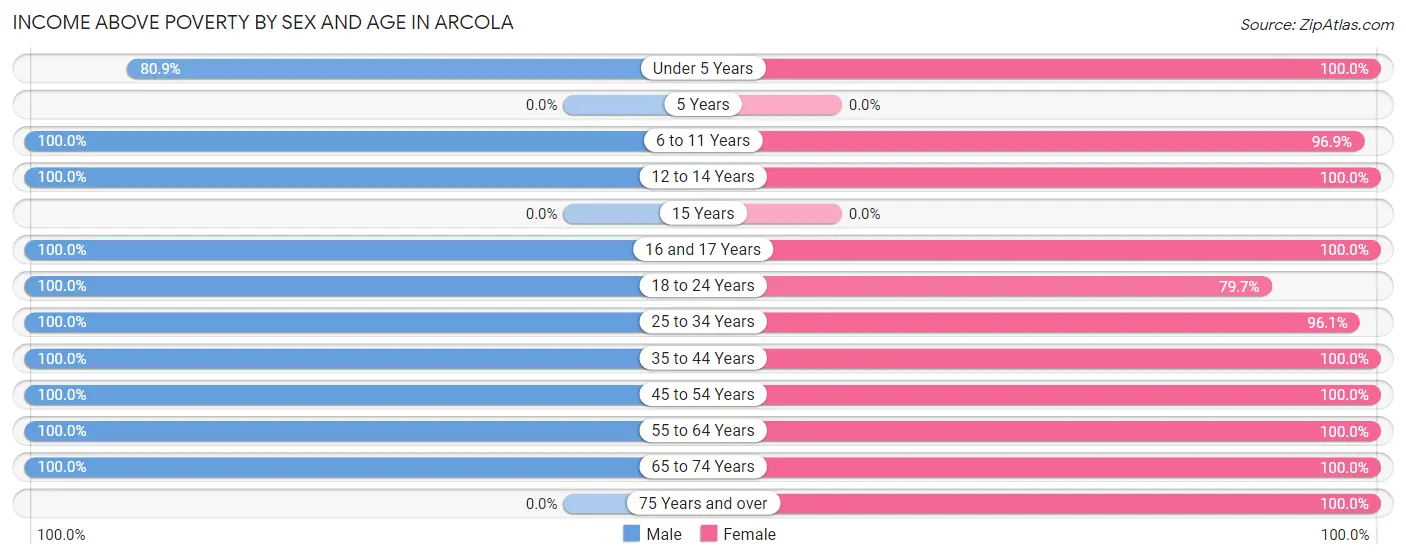
Income Above Poverty by Sex and Age in Arcola
According to the poverty statistics in Arcola, males aged 6 to 11 years and females aged under 5 years are the age groups that are most secure financially, with 100.0% of males and 100.0% of females in these age groups living above the poverty line.
| Age Bracket | Male | Female |
| Under 5 Years | 89 (80.9%) | 94 (100.0%) |
| 5 Years | 0 (0.0%) | 0 (0.0%) |
| 6 to 11 Years | 191 (100.0%) | 157 (96.9%) |
| 12 to 14 Years | 69 (100.0%) | 25 (100.0%) |
| 15 Years | 0 (0.0%) | 0 (0.0%) |
| 16 and 17 Years | 11 (100.0%) | 22 (100.0%) |
| 18 to 24 Years | 125 (100.0%) | 114 (79.7%) |
| 25 to 34 Years | 164 (100.0%) | 172 (96.1%) |
| 35 to 44 Years | 302 (100.0%) | 235 (100.0%) |
| 45 to 54 Years | 198 (100.0%) | 161 (100.0%) |
| 55 to 64 Years | 78 (100.0%) | 85 (100.0%) |
| 65 to 74 Years | 18 (100.0%) | 28 (100.0%) |
| 75 Years and over | 0 (0.0%) | 37 (100.0%) |
| Total | 1,245 (98.3%) | 1,130 (96.5%) |
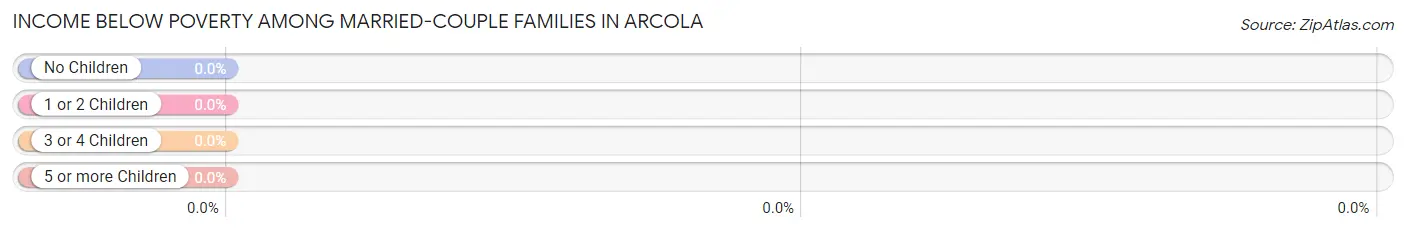
Income Below Poverty Among Married-Couple Families in Arcola
| Children | Above Poverty | Below Poverty |
| No Children | 161 (100.0%) | 0 (0.0%) |
| 1 or 2 Children | 352 (100.0%) | 0 (0.0%) |
| 3 or 4 Children | 14 (100.0%) | 0 (0.0%) |
| 5 or more Children | 0 (0.0%) | 0 (0.0%) |
| Total | 527 (100.0%) | 0 (0.0%) |
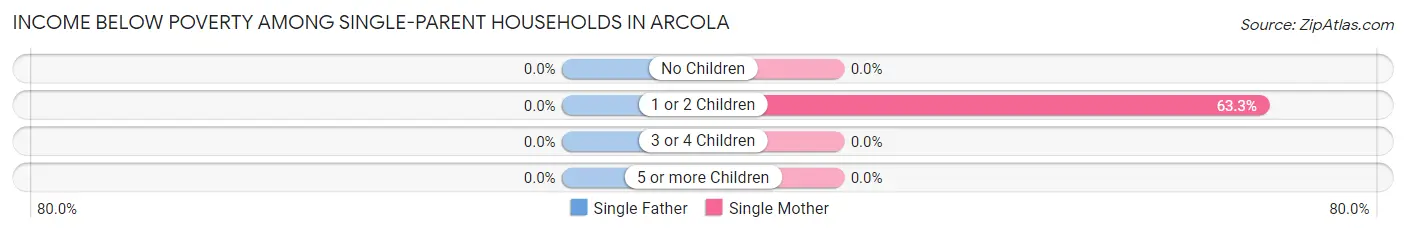
Income Below Poverty Among Single-Parent Households in Arcola
| Children | Single Father | Single Mother |
| No Children | 0 (0.0%) | 0 (0.0%) |
| 1 or 2 Children | 0 (0.0%) | 19 (63.3%) |
| 3 or 4 Children | 0 (0.0%) | 0 (0.0%) |
| 5 or more Children | 0 (0.0%) | 0 (0.0%) |
| Total | 0 (0.0%) | 19 (14.2%) |
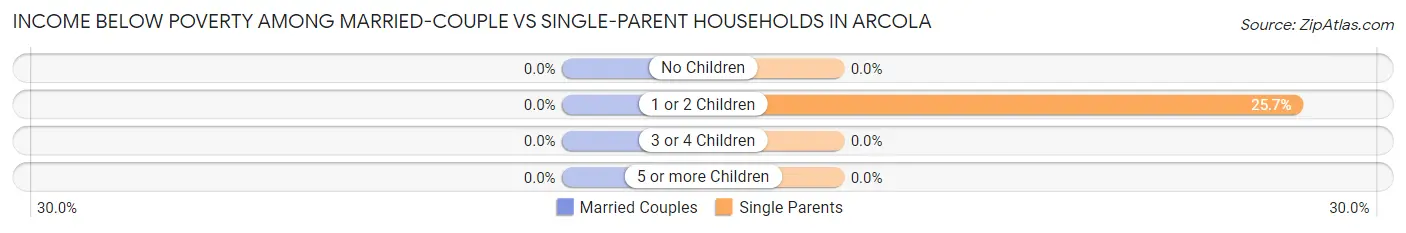
Income Below Poverty Among Married-Couple vs Single-Parent Households in Arcola
| Children | Married-Couple Families | Single-Parent Households |
| No Children | 0 (0.0%) | 0 (0.0%) |
| 1 or 2 Children | 0 (0.0%) | 19 (25.7%) |
| 3 or 4 Children | 0 (0.0%) | 0 (0.0%) |
| 5 or more Children | 0 (0.0%) | 0 (0.0%) |
| Total | 0 (0.0%) | 19 (10.7%) |
Employment Characteristics in Arcola
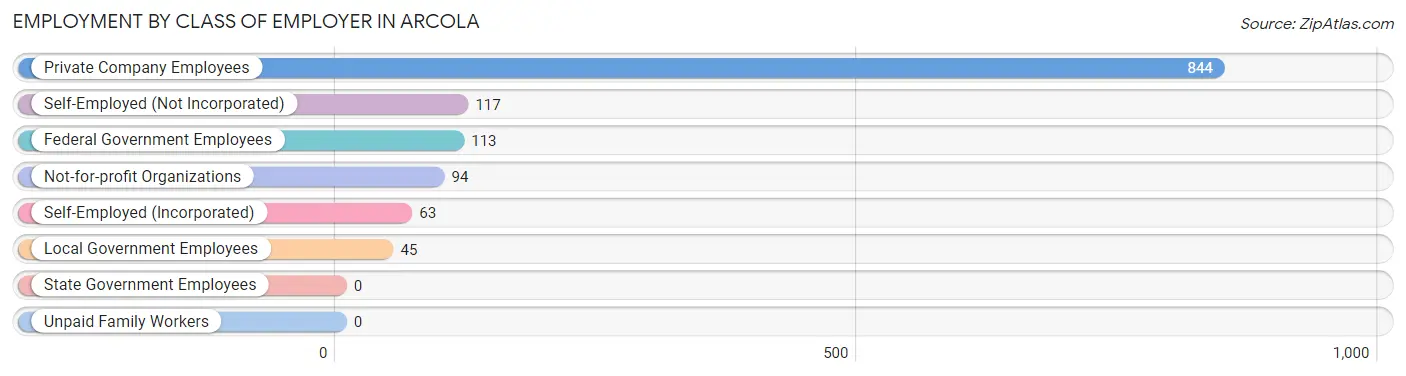
Employment by Class of Employer in Arcola
Among the 1,276 employed individuals in Arcola, private company employees (844 | 66.1%), self-employed (not incorporated) (117 | 9.2%), and federal government employees (113 | 8.9%) make up the most common classes of employment.
| Employer Class | # Employees | % Employees |
| Private Company Employees | 844 | 66.1% |
| Self-Employed (Incorporated) | 63 | 4.9% |
| Self-Employed (Not Incorporated) | 117 | 9.2% |
| Not-for-profit Organizations | 94 | 7.4% |
| Local Government Employees | 45 | 3.5% |
| State Government Employees | 0 | 0.0% |
| Federal Government Employees | 113 | 8.9% |
| Unpaid Family Workers | 0 | 0.0% |
| Total | 1,276 | 100.0% |
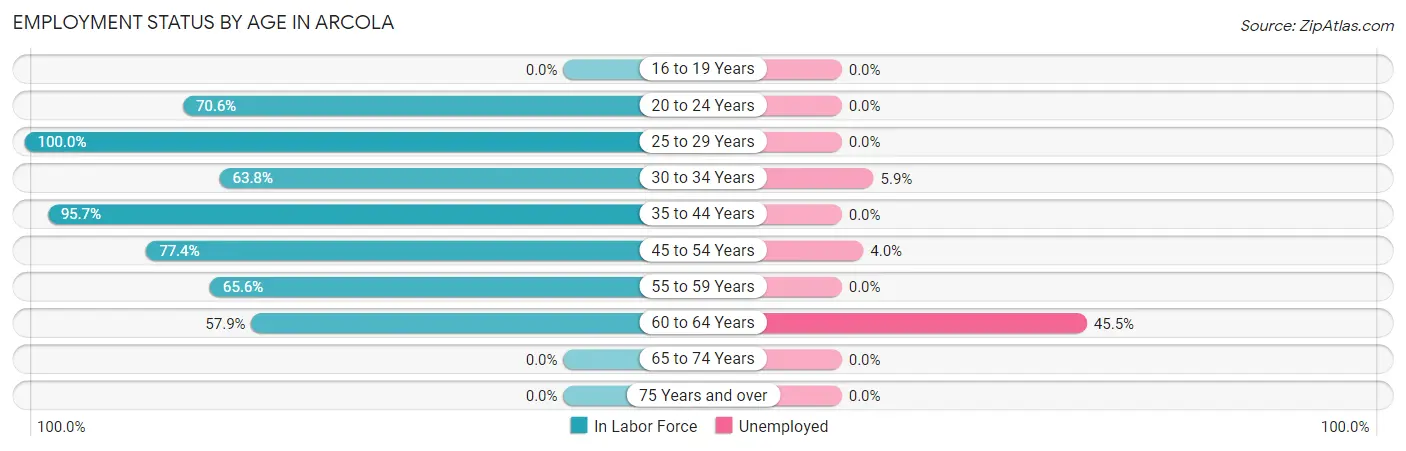
Employment Status by Age in Arcola
According to the labor force statistics for Arcola, out of the total population over 16 years of age (1,786), 73.1% or 1,306 individuals are in the labor force, with 2.3% or 30 of them unemployed. The age group with the highest labor force participation rate is 25 to 29 years, with 100.0% or 103 individuals in the labor force. Within the labor force, the 60 to 64 years age range has the highest percentage of unemployed individuals, with 45.5% or 10 of them being unemployed.
| Age Bracket | In Labor Force | Unemployed |
| 16 to 19 Years | 0 (0.0%) | 0 (0.0%) |
| 20 to 24 Years | 154 (70.6%) | 0 (0.0%) |
| 25 to 29 Years | 103 (100.0%) | 0 (0.0%) |
| 30 to 34 Years | 153 (63.8%) | 9 (5.9%) |
| 35 to 44 Years | 514 (95.7%) | 0 (0.0%) |
| 45 to 54 Years | 278 (77.4%) | 11 (4.0%) |
| 55 to 59 Years | 82 (65.6%) | 0 (0.0%) |
| 60 to 64 Years | 22 (57.9%) | 10 (45.5%) |
| 65 to 74 Years | 0 (0.0%) | 0 (0.0%) |
| 75 Years and over | 0 (0.0%) | 0 (0.0%) |
| Total | 1,306 (73.1%) | 30 (2.3%) |
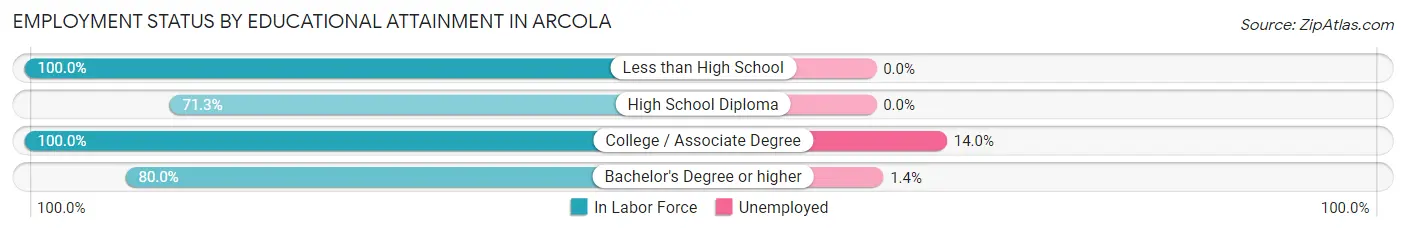
Employment Status by Educational Attainment in Arcola
According to labor force statistics for Arcola, 82.2% of individuals (1,152) out of the total population between 25 and 64 years of age (1,402) are in the labor force, with 2.6% or 30 of them being unemployed. The group with the highest labor force participation rate are those with the educational attainment of less than high school, with 100.0% or 108 individuals in the labor force. Within the labor force, individuals with college / associate degree education have the highest percentage of unemployment, with 14.0% or 20 of them being unemployed.
| Educational Attainment | In Labor Force | Unemployed |
| Less than High School | 108 (100.0%) | 0 (0.0%) |
| High School Diploma | 164 (71.3%) | 0 (0.0%) |
| College / Associate Degree | 143 (100.0%) | 20 (14.0%) |
| Bachelor's Degree or higher | 737 (80.0%) | 13 (1.4%) |
| Total | 1,152 (82.2%) | 36 (2.6%) |
Employment Occupations by Sex in Arcola
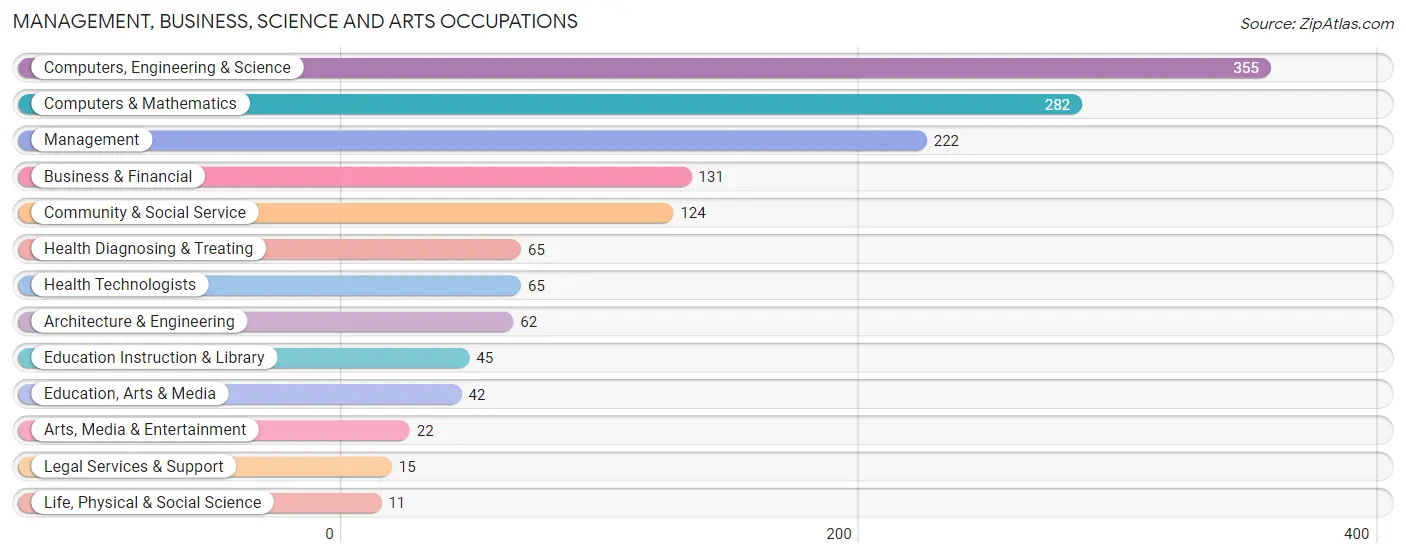
Management, Business, Science and Arts Occupations
The most common Management, Business, Science and Arts occupations in Arcola are Computers, Engineering & Science (355 | 27.8%), Computers & Mathematics (282 | 22.1%), Management (222 | 17.4%), Business & Financial (131 | 10.3%), and Community & Social Service (124 | 9.7%).
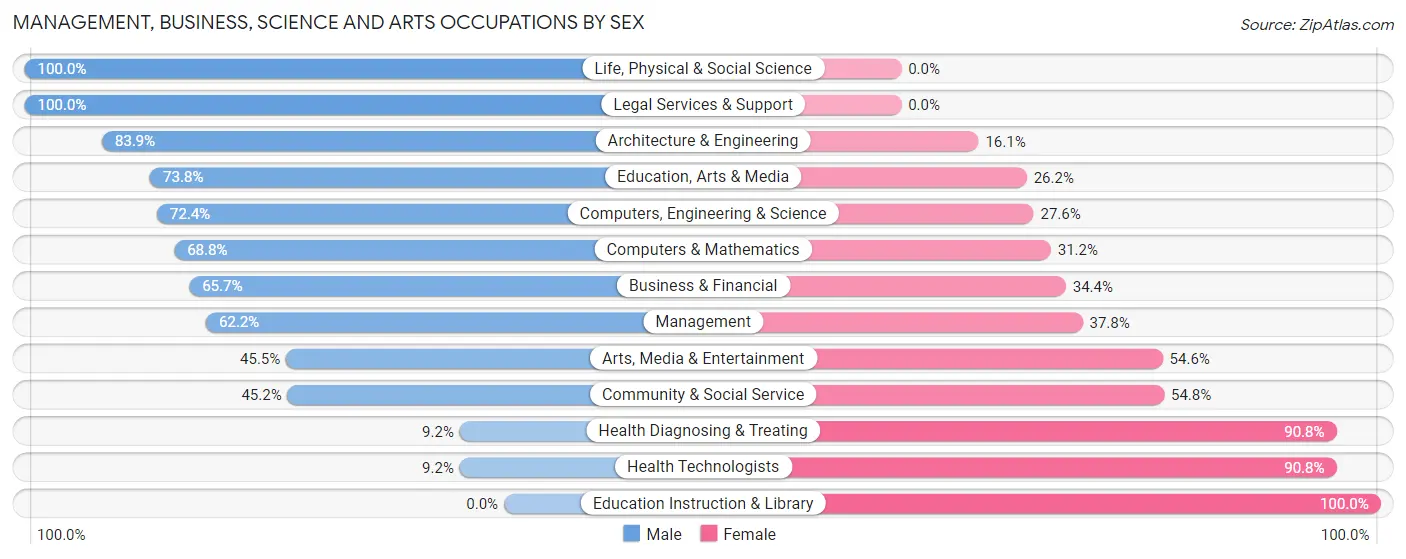
Management, Business, Science and Arts Occupations by Sex
Within the Management, Business, Science and Arts occupations in Arcola, the most male-oriented occupations are Life, Physical & Social Science (100.0%), Legal Services & Support (100.0%), and Architecture & Engineering (83.9%), while the most female-oriented occupations are Education Instruction & Library (100.0%), Health Diagnosing & Treating (90.8%), and Health Technologists (90.8%).
| Occupation | Male | Female |
| Management | 138 (62.2%) | 84 (37.8%) |
| Business & Financial | 86 (65.6%) | 45 (34.4%) |
| Computers, Engineering & Science | 257 (72.4%) | 98 (27.6%) |
| Computers & Mathematics | 194 (68.8%) | 88 (31.2%) |
| Architecture & Engineering | 52 (83.9%) | 10 (16.1%) |
| Life, Physical & Social Science | 11 (100.0%) | 0 (0.0%) |
| Community & Social Service | 56 (45.2%) | 68 (54.8%) |
| Education, Arts & Media | 31 (73.8%) | 11 (26.2%) |
| Legal Services & Support | 15 (100.0%) | 0 (0.0%) |
| Education Instruction & Library | 0 (0.0%) | 45 (100.0%) |
| Arts, Media & Entertainment | 10 (45.5%) | 12 (54.5%) |
| Health Diagnosing & Treating | 6 (9.2%) | 59 (90.8%) |
| Health Technologists | 6 (9.2%) | 59 (90.8%) |
| Total (Category) | 543 (60.5%) | 354 (39.5%) |
| Total (Overall) | 746 (58.5%) | 530 (41.5%) |
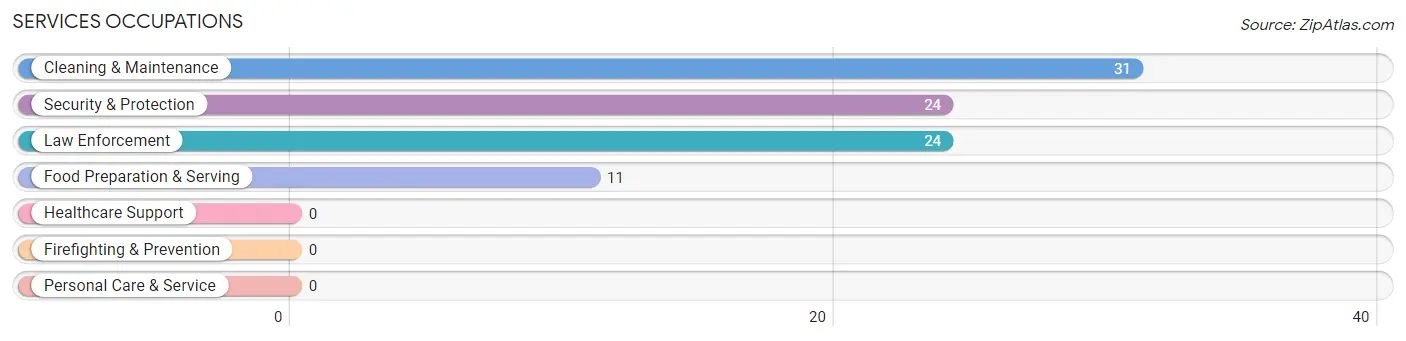
Services Occupations
The most common Services occupations in Arcola are Cleaning & Maintenance (31 | 2.4%), Security & Protection (24 | 1.9%), Law Enforcement (24 | 1.9%), and Food Preparation & Serving (11 | 0.9%).
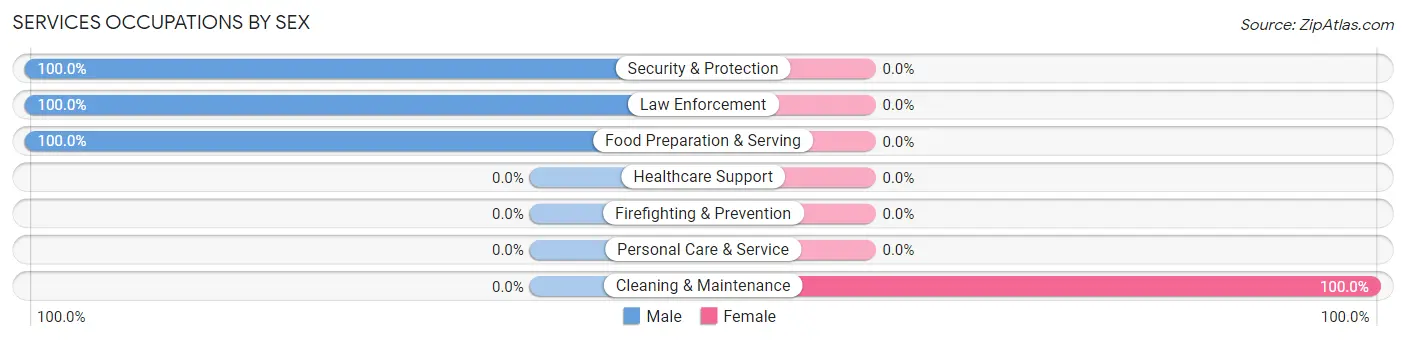
Services Occupations by Sex
| Occupation | Male | Female |
| Healthcare Support | 0 (0.0%) | 0 (0.0%) |
| Security & Protection | 24 (100.0%) | 0 (0.0%) |
| Firefighting & Prevention | 0 (0.0%) | 0 (0.0%) |
| Law Enforcement | 24 (100.0%) | 0 (0.0%) |
| Food Preparation & Serving | 11 (100.0%) | 0 (0.0%) |
| Cleaning & Maintenance | 0 (0.0%) | 31 (100.0%) |
| Personal Care & Service | 0 (0.0%) | 0 (0.0%) |
| Total (Category) | 35 (53.0%) | 31 (47.0%) |
| Total (Overall) | 746 (58.5%) | 530 (41.5%) |
Sales and Office Occupations
The most common Sales and Office occupations in Arcola are Office & Administration (125 | 9.8%), and Sales & Related (105 | 8.2%).

Sales and Office Occupations by Sex

| Occupation | Male | Female |
| Sales & Related | 67 (63.8%) | 38 (36.2%) |
| Office & Administration | 18 (14.4%) | 107 (85.6%) |
| Total (Category) | 85 (37.0%) | 145 (63.0%) |
| Total (Overall) | 746 (58.5%) | 530 (41.5%) |
Natural Resources, Construction and Maintenance Occupations
The most common Natural Resources, Construction and Maintenance occupations in Arcola are , and Construction & Extraction (36 | 2.8%).
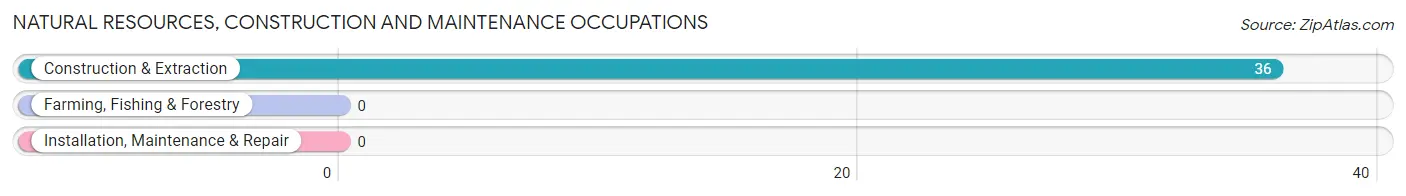
Natural Resources, Construction and Maintenance Occupations by Sex

| Occupation | Male | Female |
| Farming, Fishing & Forestry | 0 (0.0%) | 0 (0.0%) |
| Construction & Extraction | 36 (100.0%) | 0 (0.0%) |
| Installation, Maintenance & Repair | 0 (0.0%) | 0 (0.0%) |
| Total (Category) | 36 (100.0%) | 0 (0.0%) |
| Total (Overall) | 746 (58.5%) | 530 (41.5%) |
Production, Transportation and Moving Occupations
The most common Production, Transportation and Moving occupations in Arcola are Transportation (38 | 3.0%), and Production (9 | 0.7%).
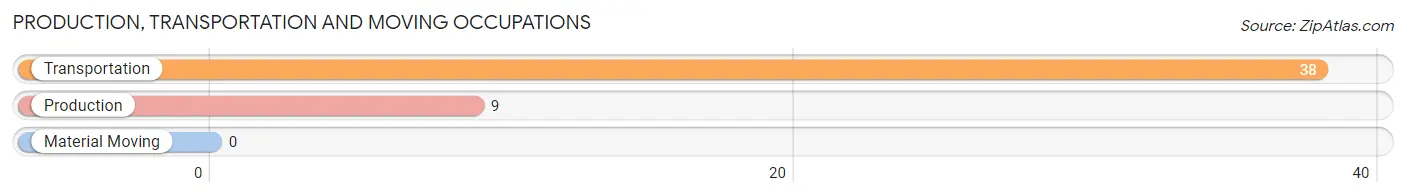
Production, Transportation and Moving Occupations by Sex

| Occupation | Male | Female |
| Production | 9 (100.0%) | 0 (0.0%) |
| Transportation | 38 (100.0%) | 0 (0.0%) |
| Material Moving | 0 (0.0%) | 0 (0.0%) |
| Total (Category) | 47 (100.0%) | 0 (0.0%) |
| Total (Overall) | 746 (58.5%) | 530 (41.5%) |
Employment Industries by Sex in Arcola
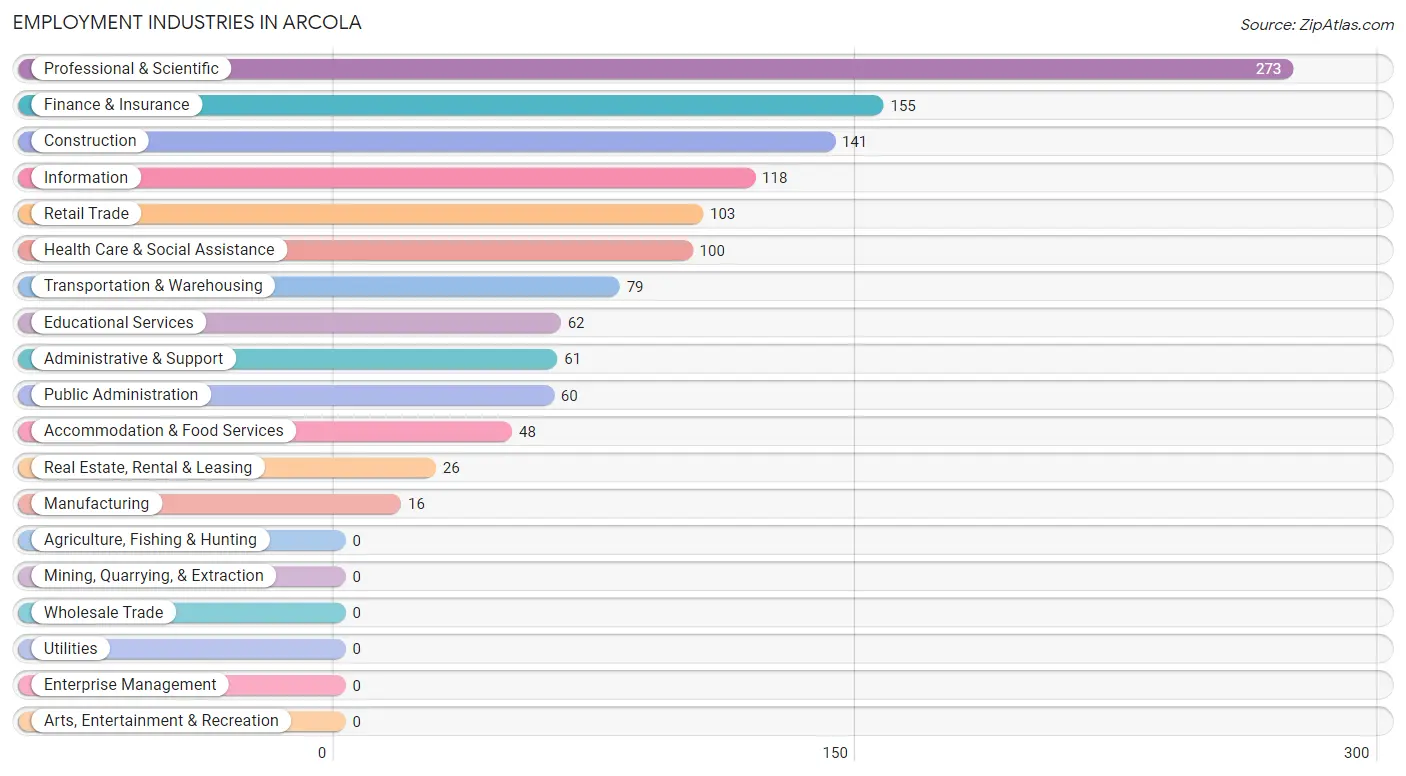
Employment Industries in Arcola
The major employment industries in Arcola include Professional & Scientific (273 | 21.4%), Finance & Insurance (155 | 12.1%), Construction (141 | 11.1%), Information (118 | 9.2%), and Retail Trade (103 | 8.1%).
Employment Industries by Sex in Arcola
The Arcola industries that see more men than women are Transportation & Warehousing (100.0%), Accommodation & Food Services (83.3%), and Finance & Insurance (81.9%), whereas the industries that tend to have a higher number of women are Health Care & Social Assistance (91.0%), Information (74.6%), and Educational Services (72.6%).
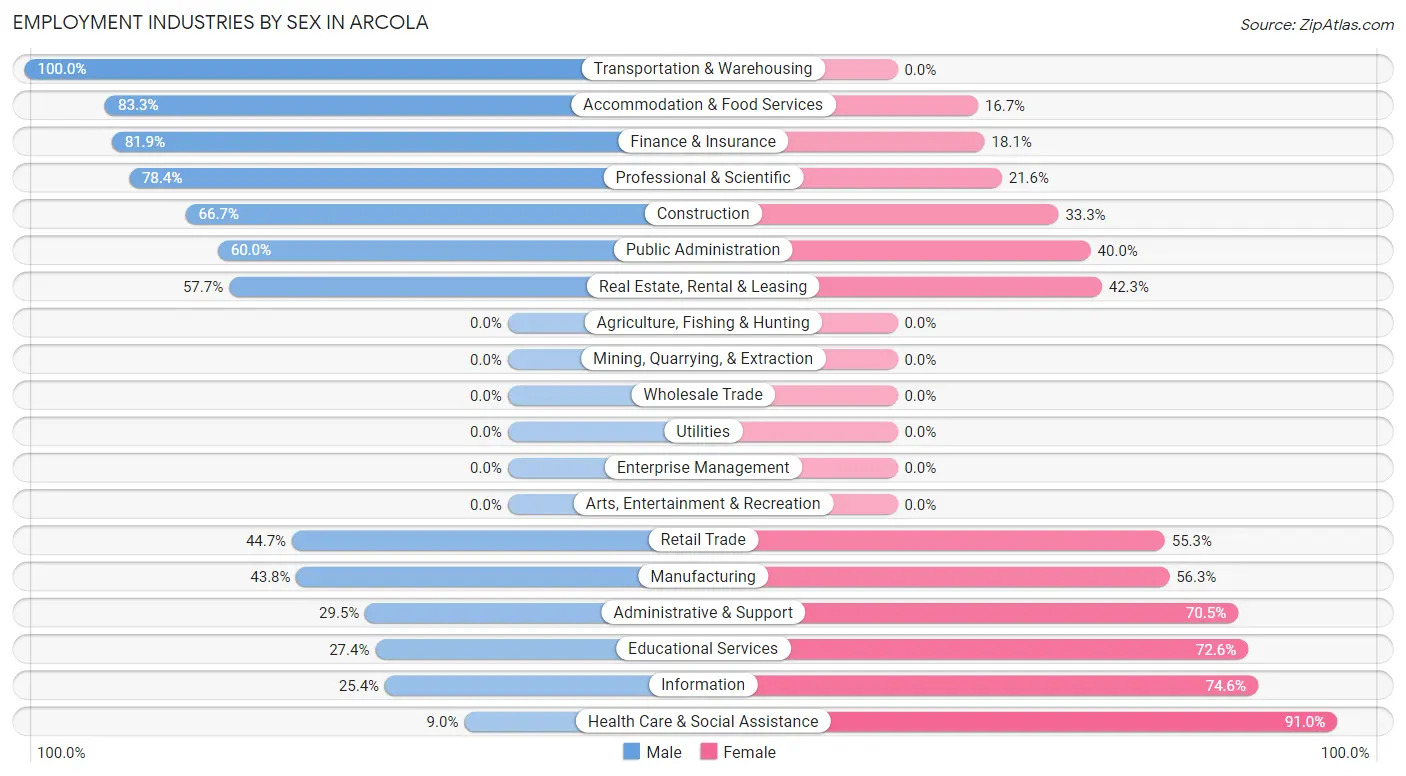
| Industry | Male | Female |
| Agriculture, Fishing & Hunting | 0 (0.0%) | 0 (0.0%) |
| Mining, Quarrying, & Extraction | 0 (0.0%) | 0 (0.0%) |
| Construction | 94 (66.7%) | 47 (33.3%) |
| Manufacturing | 7 (43.8%) | 9 (56.2%) |
| Wholesale Trade | 0 (0.0%) | 0 (0.0%) |
| Retail Trade | 46 (44.7%) | 57 (55.3%) |
| Transportation & Warehousing | 79 (100.0%) | 0 (0.0%) |
| Utilities | 0 (0.0%) | 0 (0.0%) |
| Information | 30 (25.4%) | 88 (74.6%) |
| Finance & Insurance | 127 (81.9%) | 28 (18.1%) |
| Real Estate, Rental & Leasing | 15 (57.7%) | 11 (42.3%) |
| Professional & Scientific | 214 (78.4%) | 59 (21.6%) |
| Enterprise Management | 0 (0.0%) | 0 (0.0%) |
| Administrative & Support | 18 (29.5%) | 43 (70.5%) |
| Educational Services | 17 (27.4%) | 45 (72.6%) |
| Health Care & Social Assistance | 9 (9.0%) | 91 (91.0%) |
| Arts, Entertainment & Recreation | 0 (0.0%) | 0 (0.0%) |
| Accommodation & Food Services | 40 (83.3%) | 8 (16.7%) |
| Public Administration | 36 (60.0%) | 24 (40.0%) |
| Total | 746 (58.5%) | 530 (41.5%) |
Education in Arcola
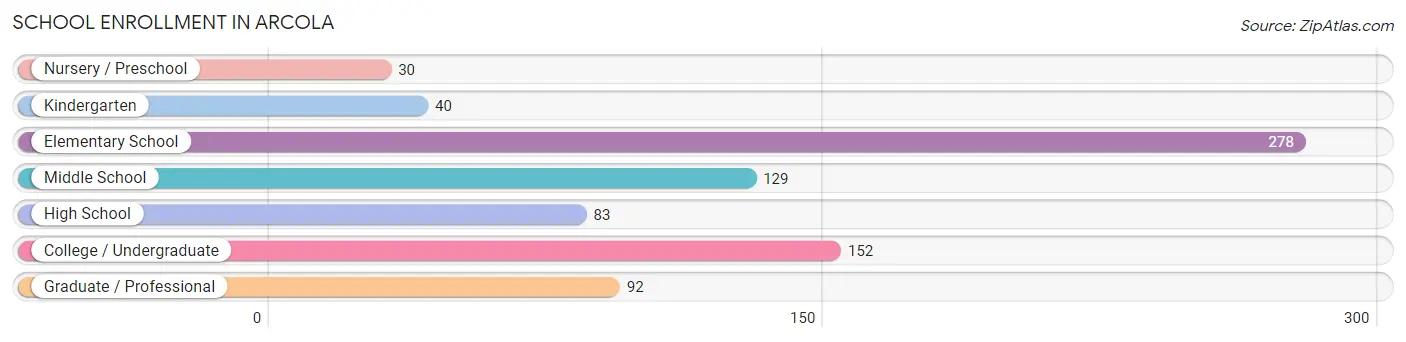
School Enrollment in Arcola
The most common levels of schooling among the 804 students in Arcola are elementary school (278 | 34.6%), college / undergraduate (152 | 18.9%), and middle school (129 | 16.0%).
| School Level | # Students | % Students |
| Nursery / Preschool | 30 | 3.7% |
| Kindergarten | 40 | 5.0% |
| Elementary School | 278 | 34.6% |
| Middle School | 129 | 16.0% |
| High School | 83 | 10.3% |
| College / Undergraduate | 152 | 18.9% |
| Graduate / Professional | 92 | 11.4% |
| Total | 804 | 100.0% |
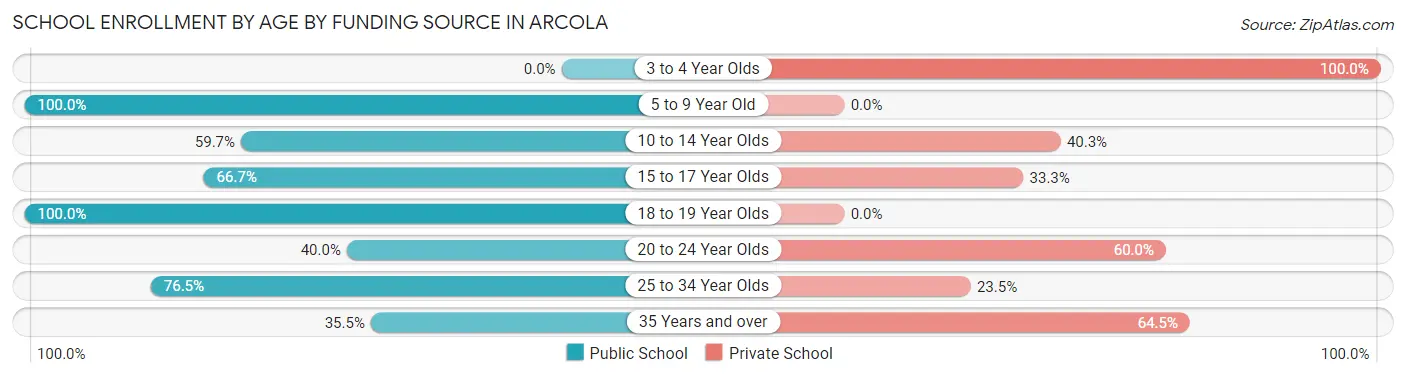
School Enrollment by Age by Funding Source in Arcola
Out of a total of 804 students who are enrolled in schools in Arcola, 224 (27.9%) attend a private institution, while the remaining 580 (72.1%) are enrolled in public schools. The age group of 3 to 4 year olds has the highest likelihood of being enrolled in private schools, with 30 (100.0% in the age bracket) enrolled. Conversely, the age group of 5 to 9 year old has the lowest likelihood of being enrolled in a private school, with 303 (100.0% in the age bracket) attending a public institution.
| Age Bracket | Public School | Private School |
| 3 to 4 Year Olds | 0 (0.0%) | 30 (100.0%) |
| 5 to 9 Year Old | 303 (100.0%) | 0 (0.0%) |
| 10 to 14 Year Olds | 86 (59.7%) | 58 (40.3%) |
| 15 to 17 Year Olds | 22 (66.7%) | 11 (33.3%) |
| 18 to 19 Year Olds | 50 (100.0%) | 0 (0.0%) |
| 20 to 24 Year Olds | 40 (40.0%) | 60 (60.0%) |
| 25 to 34 Year Olds | 52 (76.5%) | 16 (23.5%) |
| 35 Years and over | 27 (35.5%) | 49 (64.5%) |
| Total | 580 (72.1%) | 224 (27.9%) |
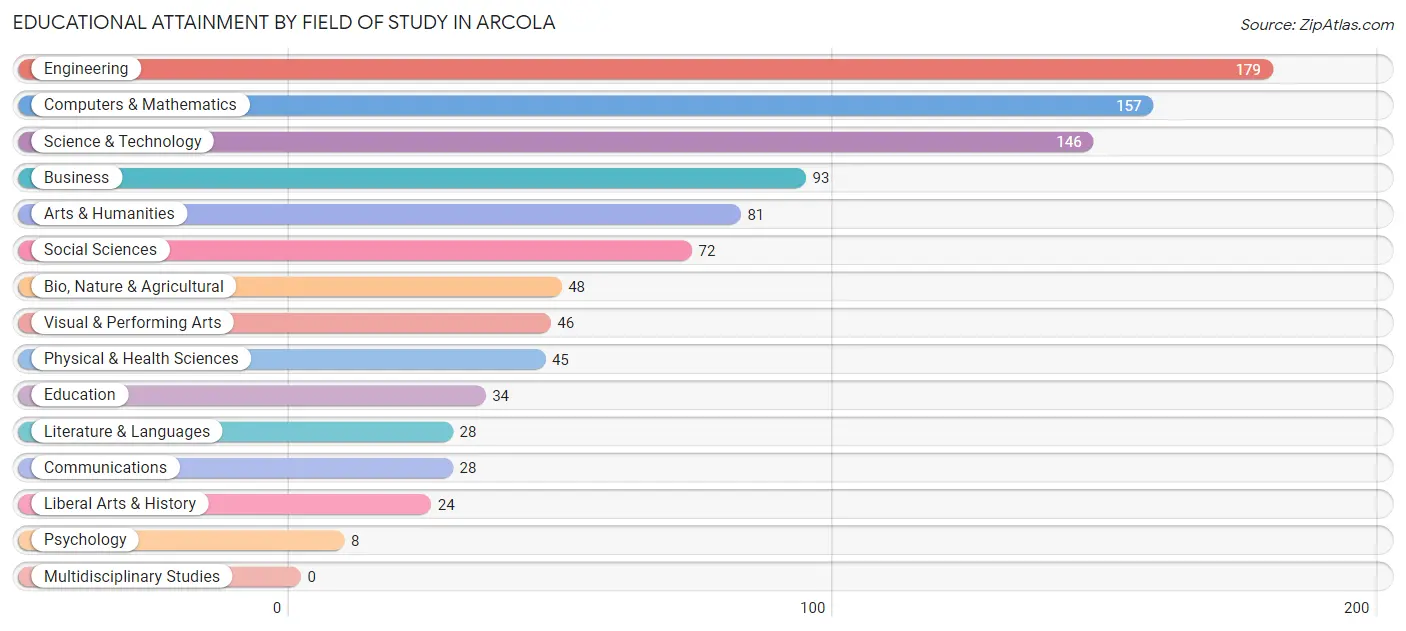
Educational Attainment by Field of Study in Arcola
Engineering (179 | 18.1%), computers & mathematics (157 | 15.9%), science & technology (146 | 14.8%), business (93 | 9.4%), and arts & humanities (81 | 8.2%) are the most common fields of study among 989 individuals in Arcola who have obtained a bachelor's degree or higher.
| Field of Study | # Graduates | % Graduates |
| Computers & Mathematics | 157 | 15.9% |
| Bio, Nature & Agricultural | 48 | 4.9% |
| Physical & Health Sciences | 45 | 4.5% |
| Psychology | 8 | 0.8% |
| Social Sciences | 72 | 7.3% |
| Engineering | 179 | 18.1% |
| Multidisciplinary Studies | 0 | 0.0% |
| Science & Technology | 146 | 14.8% |
| Business | 93 | 9.4% |
| Education | 34 | 3.4% |
| Literature & Languages | 28 | 2.8% |
| Liberal Arts & History | 24 | 2.4% |
| Visual & Performing Arts | 46 | 4.6% |
| Communications | 28 | 2.8% |
| Arts & Humanities | 81 | 8.2% |
| Total | 989 | 100.0% |
Transportation & Commute in Arcola
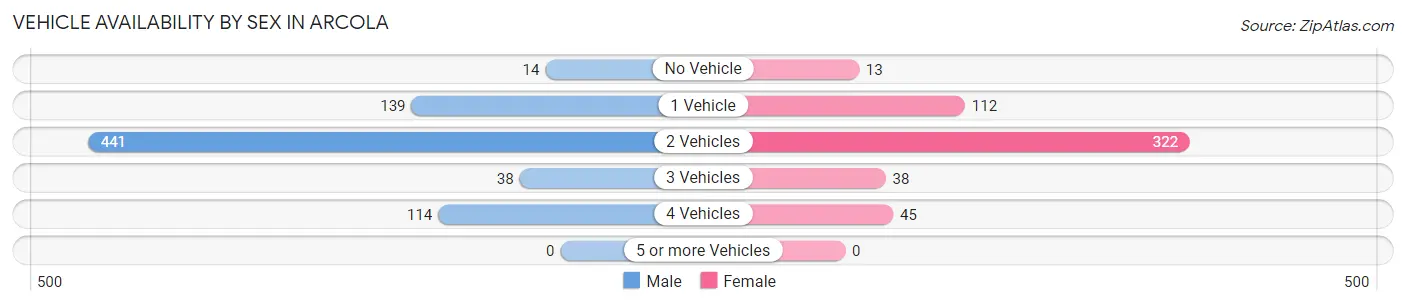
Vehicle Availability by Sex in Arcola
The most prevalent vehicle ownership categories in Arcola are males with 2 vehicles (441, accounting for 59.1%) and females with 2 vehicles (322, making up 83.2%).
| Vehicles Available | Male | Female |
| No Vehicle | 14 (1.9%) | 13 (2.5%) |
| 1 Vehicle | 139 (18.6%) | 112 (21.1%) |
| 2 Vehicles | 441 (59.1%) | 322 (60.8%) |
| 3 Vehicles | 38 (5.1%) | 38 (7.2%) |
| 4 Vehicles | 114 (15.3%) | 45 (8.5%) |
| 5 or more Vehicles | 0 (0.0%) | 0 (0.0%) |
| Total | 746 (100.0%) | 530 (100.0%) |
Commute Time in Arcola
The most frequently occuring commute durations in Arcola are 45 to 59 minutes (156 commuters, 18.1%), 30 to 34 minutes (150 commuters, 17.4%), and 15 to 19 minutes (141 commuters, 16.3%).
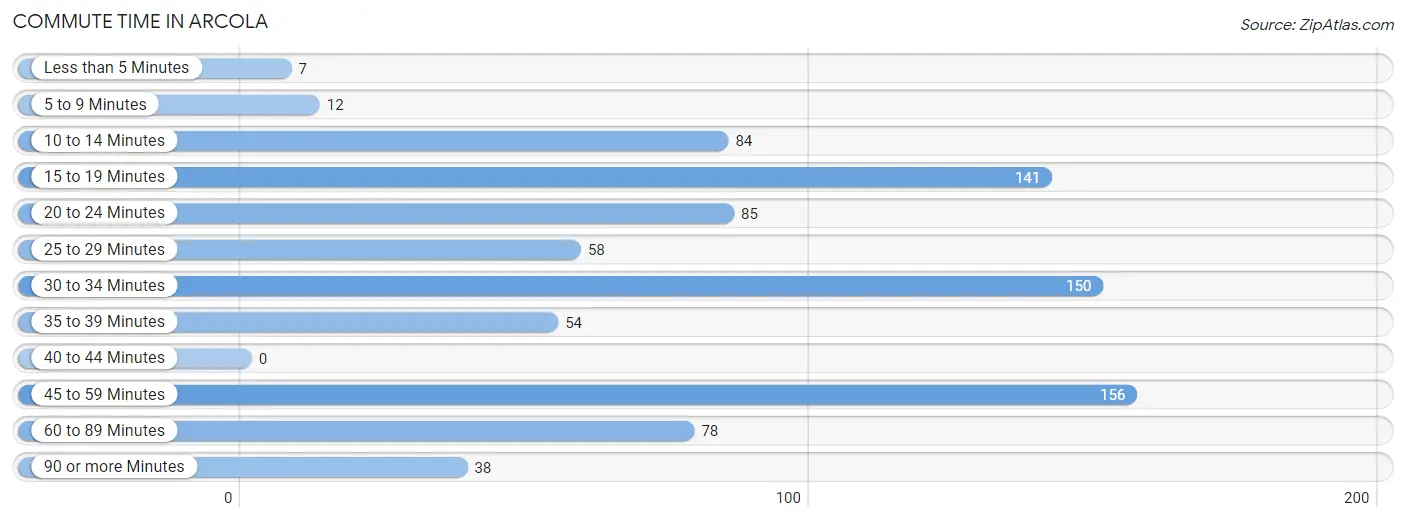
| Commute Time | # Commuters | % Commuters |
| Less than 5 Minutes | 7 | 0.8% |
| 5 to 9 Minutes | 12 | 1.4% |
| 10 to 14 Minutes | 84 | 9.7% |
| 15 to 19 Minutes | 141 | 16.3% |
| 20 to 24 Minutes | 85 | 9.9% |
| 25 to 29 Minutes | 58 | 6.7% |
| 30 to 34 Minutes | 150 | 17.4% |
| 35 to 39 Minutes | 54 | 6.3% |
| 40 to 44 Minutes | 0 | 0.0% |
| 45 to 59 Minutes | 156 | 18.1% |
| 60 to 89 Minutes | 78 | 9.0% |
| 90 or more Minutes | 38 | 4.4% |
Commute Time by Sex in Arcola
The most common commute times in Arcola are 30 to 34 minutes (142 commuters, 26.7%) for males and 15 to 19 minutes (76 commuters, 22.9%) for females.
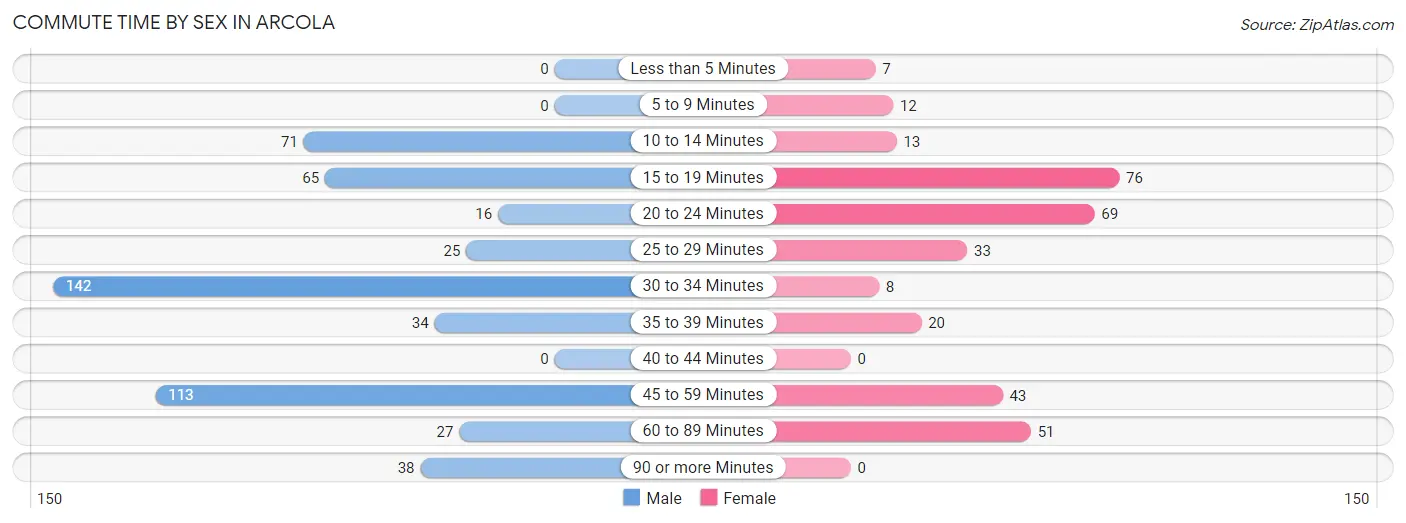
| Commute Time | Male | Female |
| Less than 5 Minutes | 0 (0.0%) | 7 (2.1%) |
| 5 to 9 Minutes | 0 (0.0%) | 12 (3.6%) |
| 10 to 14 Minutes | 71 (13.4%) | 13 (3.9%) |
| 15 to 19 Minutes | 65 (12.2%) | 76 (22.9%) |
| 20 to 24 Minutes | 16 (3.0%) | 69 (20.8%) |
| 25 to 29 Minutes | 25 (4.7%) | 33 (9.9%) |
| 30 to 34 Minutes | 142 (26.7%) | 8 (2.4%) |
| 35 to 39 Minutes | 34 (6.4%) | 20 (6.0%) |
| 40 to 44 Minutes | 0 (0.0%) | 0 (0.0%) |
| 45 to 59 Minutes | 113 (21.3%) | 43 (13.0%) |
| 60 to 89 Minutes | 27 (5.1%) | 51 (15.4%) |
| 90 or more Minutes | 38 (7.2%) | 0 (0.0%) |
Time of Departure to Work by Sex in Arcola
The most frequent times of departure to work in Arcola are 6:00 AM to 6:29 AM (108, 20.3%) for males and 7:30 AM to 7:59 AM (82, 24.7%) for females.
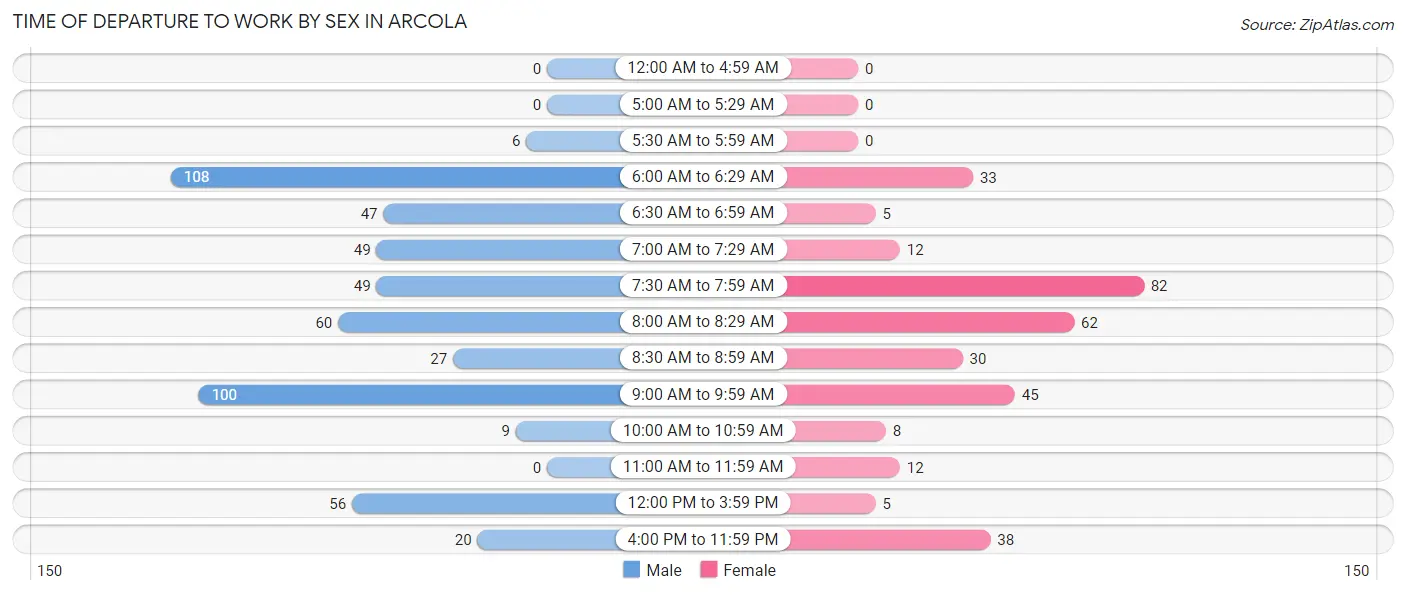
| Time of Departure | Male | Female |
| 12:00 AM to 4:59 AM | 0 (0.0%) | 0 (0.0%) |
| 5:00 AM to 5:29 AM | 0 (0.0%) | 0 (0.0%) |
| 5:30 AM to 5:59 AM | 6 (1.1%) | 0 (0.0%) |
| 6:00 AM to 6:29 AM | 108 (20.3%) | 33 (9.9%) |
| 6:30 AM to 6:59 AM | 47 (8.8%) | 5 (1.5%) |
| 7:00 AM to 7:29 AM | 49 (9.2%) | 12 (3.6%) |
| 7:30 AM to 7:59 AM | 49 (9.2%) | 82 (24.7%) |
| 8:00 AM to 8:29 AM | 60 (11.3%) | 62 (18.7%) |
| 8:30 AM to 8:59 AM | 27 (5.1%) | 30 (9.0%) |
| 9:00 AM to 9:59 AM | 100 (18.8%) | 45 (13.6%) |
| 10:00 AM to 10:59 AM | 9 (1.7%) | 8 (2.4%) |
| 11:00 AM to 11:59 AM | 0 (0.0%) | 12 (3.6%) |
| 12:00 PM to 3:59 PM | 56 (10.5%) | 5 (1.5%) |
| 4:00 PM to 11:59 PM | 20 (3.8%) | 38 (11.5%) |
| Total | 531 (100.0%) | 332 (100.0%) |
Housing Occupancy in Arcola
Occupancy by Ownership in Arcola
Of the total 907 dwellings in Arcola, owner-occupied units account for 591 (65.2%), while renter-occupied units make up 316 (34.8%).
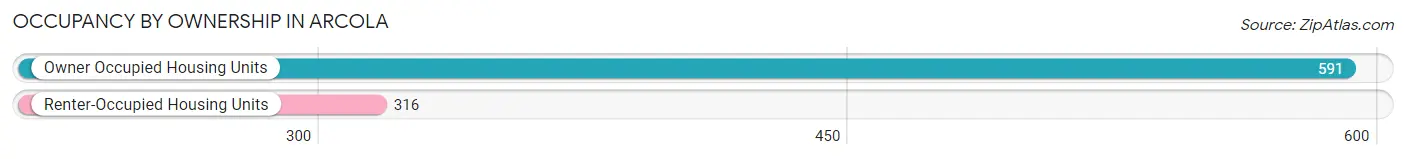
| Occupancy | # Housing Units | % Housing Units |
| Owner Occupied Housing Units | 591 | 65.2% |
| Renter-Occupied Housing Units | 316 | 34.8% |
| Total Occupied Housing Units | 907 | 100.0% |
Occupancy by Household Size in Arcola
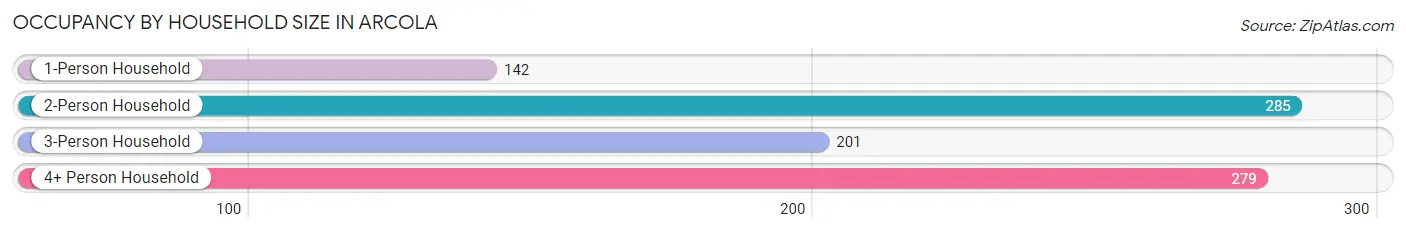
| Household Size | # Housing Units | % Housing Units |
| 1-Person Household | 142 | 15.7% |
| 2-Person Household | 285 | 31.4% |
| 3-Person Household | 201 | 22.2% |
| 4+ Person Household | 279 | 30.8% |
| Total Housing Units | 907 | 100.0% |
Occupancy by Ownership by Household Size in Arcola
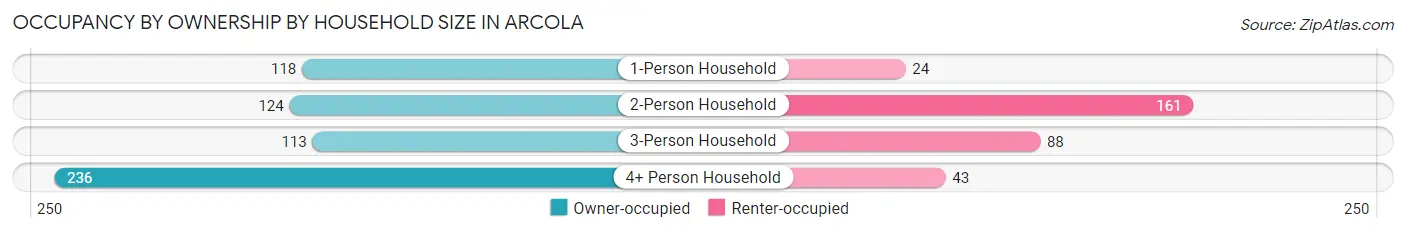
| Household Size | Owner-occupied | Renter-occupied |
| 1-Person Household | 118 (83.1%) | 24 (16.9%) |
| 2-Person Household | 124 (43.5%) | 161 (56.5%) |
| 3-Person Household | 113 (56.2%) | 88 (43.8%) |
| 4+ Person Household | 236 (84.6%) | 43 (15.4%) |
| Total Housing Units | 591 (65.2%) | 316 (34.8%) |
Occupancy by Educational Attainment in Arcola
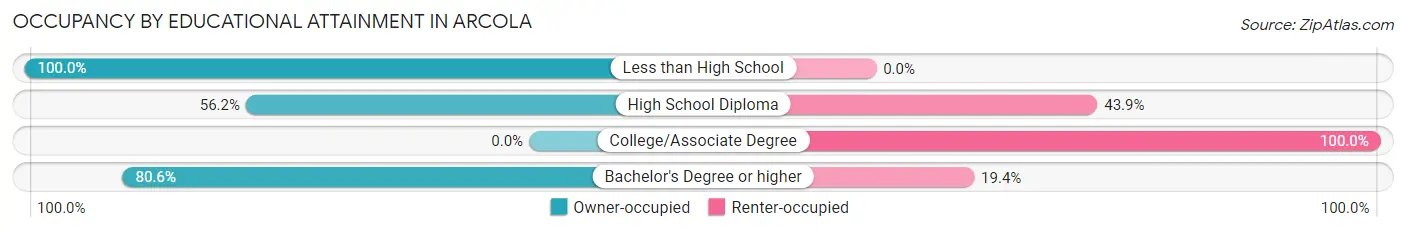
| Household Size | Owner-occupied | Renter-occupied |
| Less than High School | 9 (100.0%) | 0 (0.0%) |
| High School Diploma | 105 (56.1%) | 82 (43.9%) |
| College/Associate Degree | 0 (0.0%) | 119 (100.0%) |
| Bachelor's Degree or higher | 477 (80.6%) | 115 (19.4%) |
Occupancy by Age of Householder in Arcola
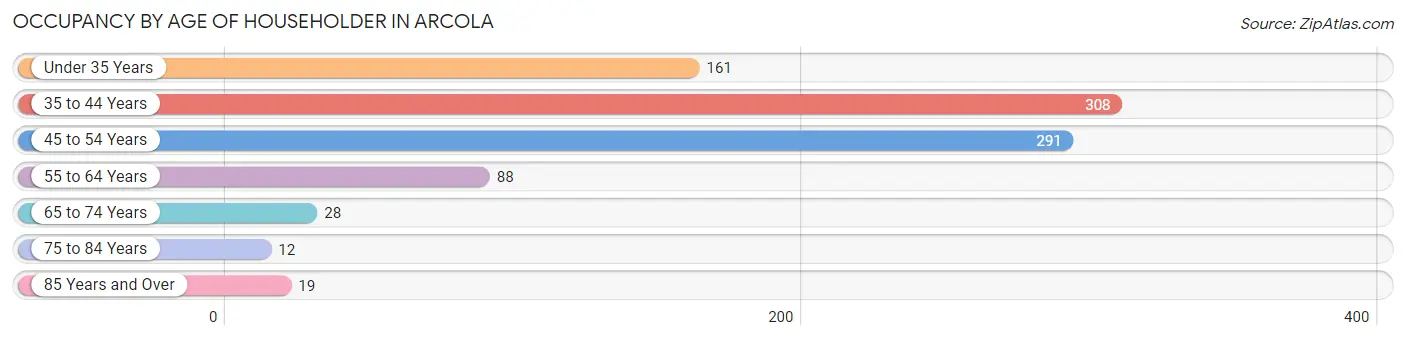
| Age Bracket | # Households | % Households |
| Under 35 Years | 161 | 17.7% |
| 35 to 44 Years | 308 | 34.0% |
| 45 to 54 Years | 291 | 32.1% |
| 55 to 64 Years | 88 | 9.7% |
| 65 to 74 Years | 28 | 3.1% |
| 75 to 84 Years | 12 | 1.3% |
| 85 Years and Over | 19 | 2.1% |
| Total | 907 | 100.0% |
Housing Finances in Arcola
Median Income by Occupancy in Arcola
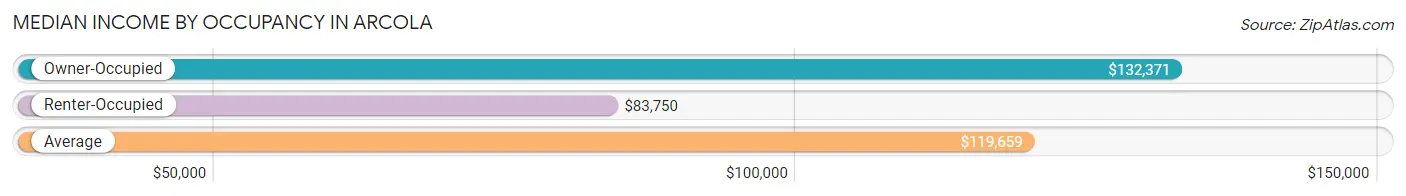
| Occupancy Type | # Households | Median Income |
| Owner-Occupied | 591 (65.2%) | $132,371 |
| Renter-Occupied | 316 (34.8%) | $83,750 |
| Average | 907 (100.0%) | $119,659 |
Occupancy by Householder Income Bracket in Arcola
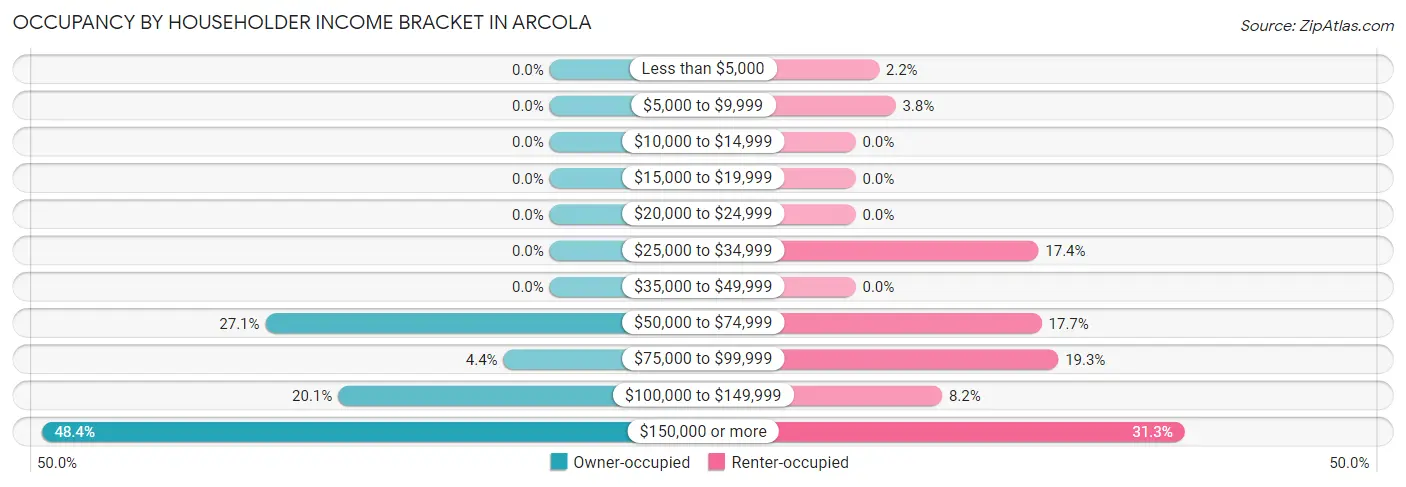
| Income Bracket | Owner-occupied | Renter-occupied |
| Less than $5,000 | 0 (0.0%) | 7 (2.2%) |
| $5,000 to $9,999 | 0 (0.0%) | 12 (3.8%) |
| $10,000 to $14,999 | 0 (0.0%) | 0 (0.0%) |
| $15,000 to $19,999 | 0 (0.0%) | 0 (0.0%) |
| $20,000 to $24,999 | 0 (0.0%) | 0 (0.0%) |
| $25,000 to $34,999 | 0 (0.0%) | 55 (17.4%) |
| $35,000 to $49,999 | 0 (0.0%) | 0 (0.0%) |
| $50,000 to $74,999 | 160 (27.1%) | 56 (17.7%) |
| $75,000 to $99,999 | 26 (4.4%) | 61 (19.3%) |
| $100,000 to $149,999 | 119 (20.1%) | 26 (8.2%) |
| $150,000 or more | 286 (48.4%) | 99 (31.3%) |
| Total | 591 (100.0%) | 316 (100.0%) |
Monthly Housing Cost Tiers in Arcola
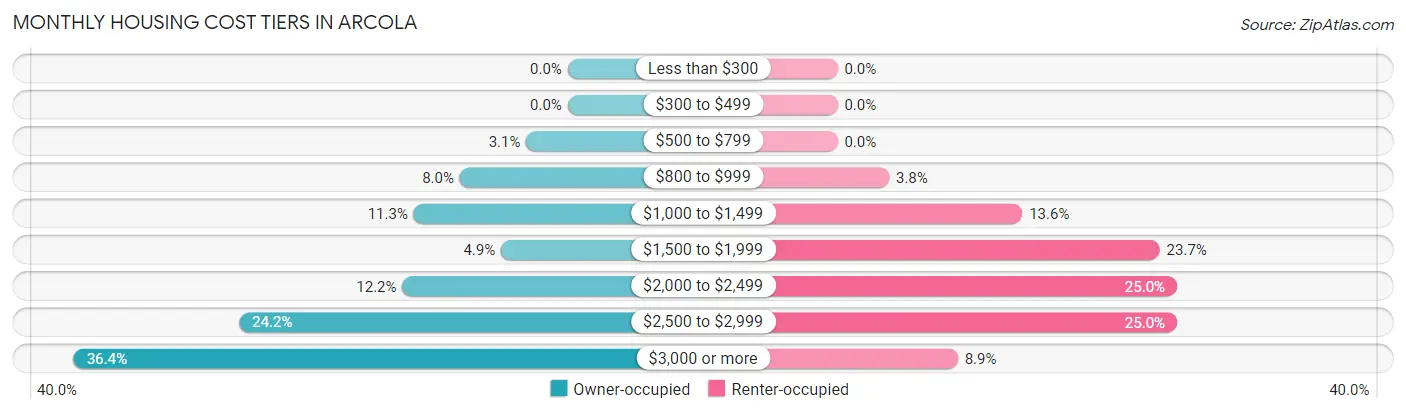
| Monthly Cost | Owner-occupied | Renter-occupied |
| Less than $300 | 0 (0.0%) | 0 (0.0%) |
| $300 to $499 | 0 (0.0%) | 0 (0.0%) |
| $500 to $799 | 18 (3.0%) | 0 (0.0%) |
| $800 to $999 | 47 (8.0%) | 12 (3.8%) |
| $1,000 to $1,499 | 67 (11.3%) | 43 (13.6%) |
| $1,500 to $1,999 | 29 (4.9%) | 75 (23.7%) |
| $2,000 to $2,499 | 72 (12.2%) | 79 (25.0%) |
| $2,500 to $2,999 | 143 (24.2%) | 79 (25.0%) |
| $3,000 or more | 215 (36.4%) | 28 (8.9%) |
| Total | 591 (100.0%) | 316 (100.0%) |
Physical Housing Characteristics in Arcola
Housing Structures in Arcola
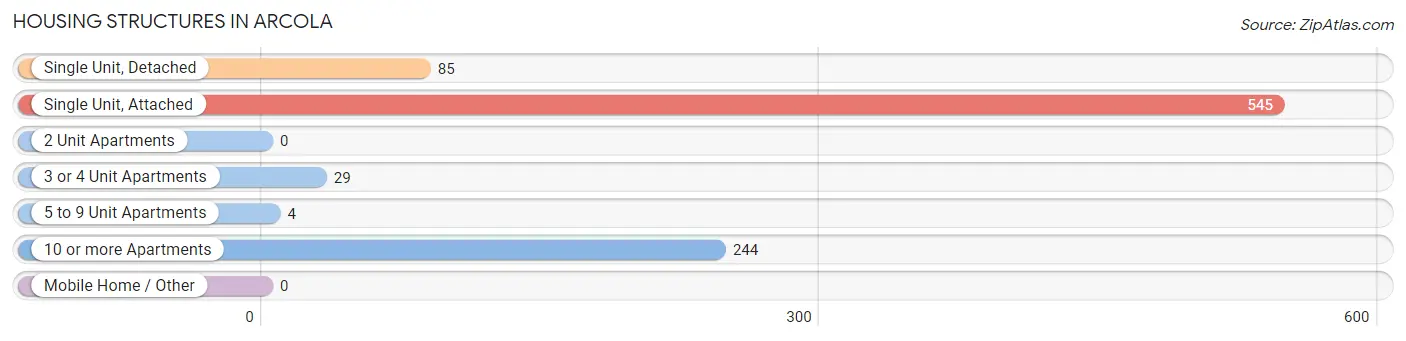
| Structure Type | # Housing Units | % Housing Units |
| Single Unit, Detached | 85 | 9.4% |
| Single Unit, Attached | 545 | 60.1% |
| 2 Unit Apartments | 0 | 0.0% |
| 3 or 4 Unit Apartments | 29 | 3.2% |
| 5 to 9 Unit Apartments | 4 | 0.4% |
| 10 or more Apartments | 244 | 26.9% |
| Mobile Home / Other | 0 | 0.0% |
| Total | 907 | 100.0% |
Housing Structures by Occupancy in Arcola
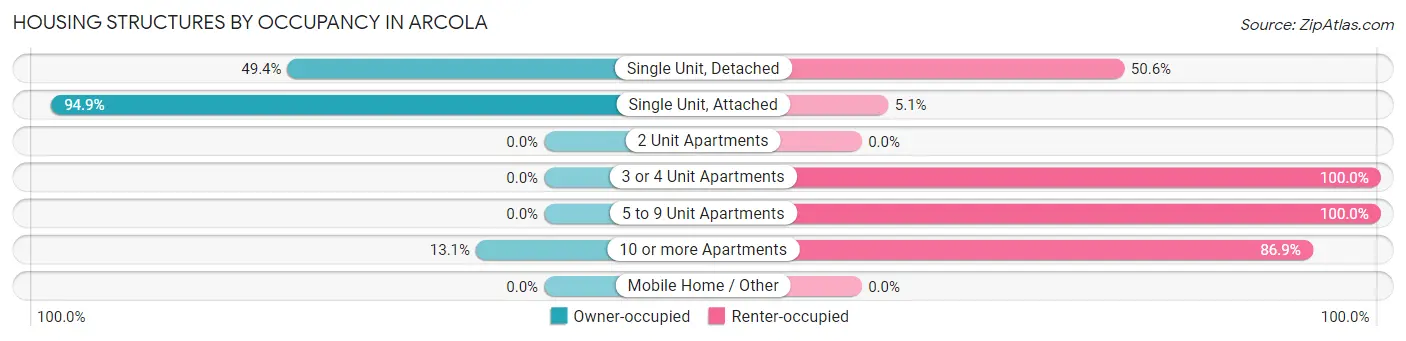
| Structure Type | Owner-occupied | Renter-occupied |
| Single Unit, Detached | 42 (49.4%) | 43 (50.6%) |
| Single Unit, Attached | 517 (94.9%) | 28 (5.1%) |
| 2 Unit Apartments | 0 (0.0%) | 0 (0.0%) |
| 3 or 4 Unit Apartments | 0 (0.0%) | 29 (100.0%) |
| 5 to 9 Unit Apartments | 0 (0.0%) | 4 (100.0%) |
| 10 or more Apartments | 32 (13.1%) | 212 (86.9%) |
| Mobile Home / Other | 0 (0.0%) | 0 (0.0%) |
| Total | 591 (65.2%) | 316 (34.8%) |
Housing Structures by Number of Rooms in Arcola
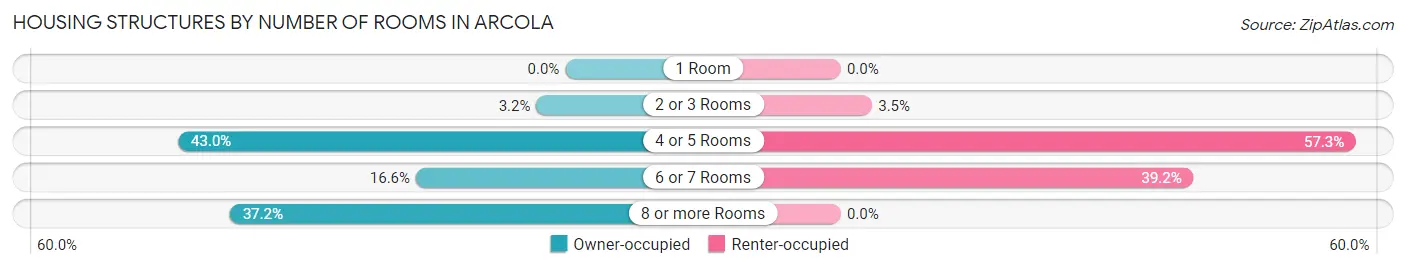
| Number of Rooms | Owner-occupied | Renter-occupied |
| 1 Room | 0 (0.0%) | 0 (0.0%) |
| 2 or 3 Rooms | 19 (3.2%) | 11 (3.5%) |
| 4 or 5 Rooms | 254 (43.0%) | 181 (57.3%) |
| 6 or 7 Rooms | 98 (16.6%) | 124 (39.2%) |
| 8 or more Rooms | 220 (37.2%) | 0 (0.0%) |
| Total | 591 (100.0%) | 316 (100.0%) |
Housing Structure by Heating Type in Arcola
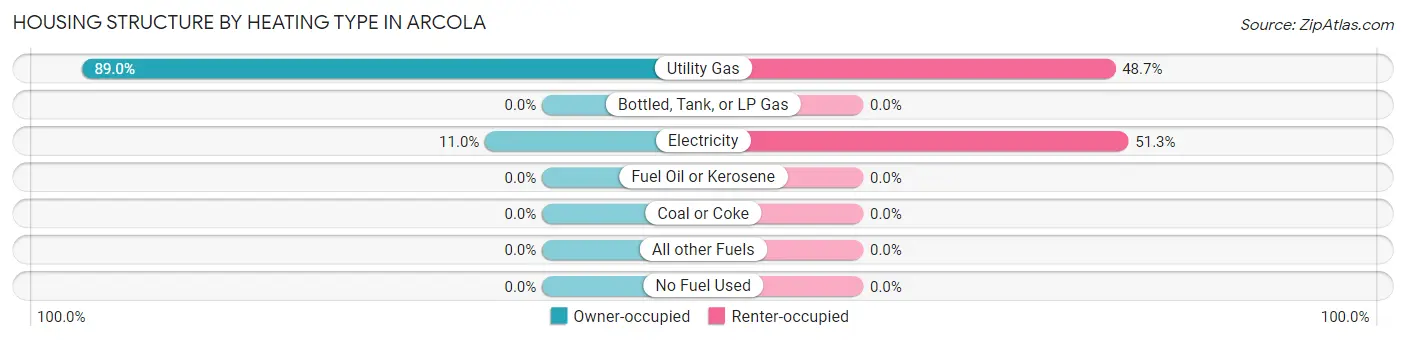
| Heating Type | Owner-occupied | Renter-occupied |
| Utility Gas | 526 (89.0%) | 154 (48.7%) |
| Bottled, Tank, or LP Gas | 0 (0.0%) | 0 (0.0%) |
| Electricity | 65 (11.0%) | 162 (51.3%) |
| Fuel Oil or Kerosene | 0 (0.0%) | 0 (0.0%) |
| Coal or Coke | 0 (0.0%) | 0 (0.0%) |
| All other Fuels | 0 (0.0%) | 0 (0.0%) |
| No Fuel Used | 0 (0.0%) | 0 (0.0%) |
| Total | 591 (100.0%) | 316 (100.0%) |
Household Vehicle Usage in Arcola
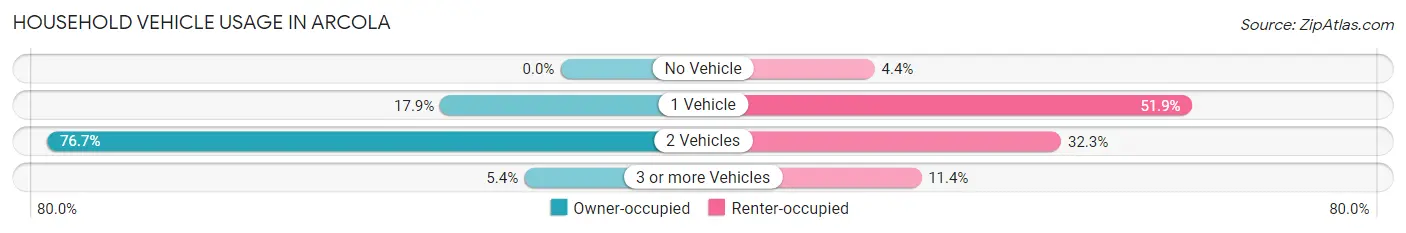
| Vehicles per Household | Owner-occupied | Renter-occupied |
| No Vehicle | 0 (0.0%) | 14 (4.4%) |
| 1 Vehicle | 106 (17.9%) | 164 (51.9%) |
| 2 Vehicles | 453 (76.6%) | 102 (32.3%) |
| 3 or more Vehicles | 32 (5.4%) | 36 (11.4%) |
| Total | 591 (100.0%) | 316 (100.0%) |
Real Estate & Mortgages in Arcola
Real Estate and Mortgage Overview in Arcola
| Characteristic | Without Mortgage | With Mortgage |
| Housing Units | 57 | 534 |
| Median Property Value | $489,100 | $573,800 |
| Median Household Income | $178,945 | $239 |
| Monthly Housing Costs | $911 | $215 |
| Real Estate Taxes | $3,891 | $69 |
Property Value by Mortgage Status in Arcola
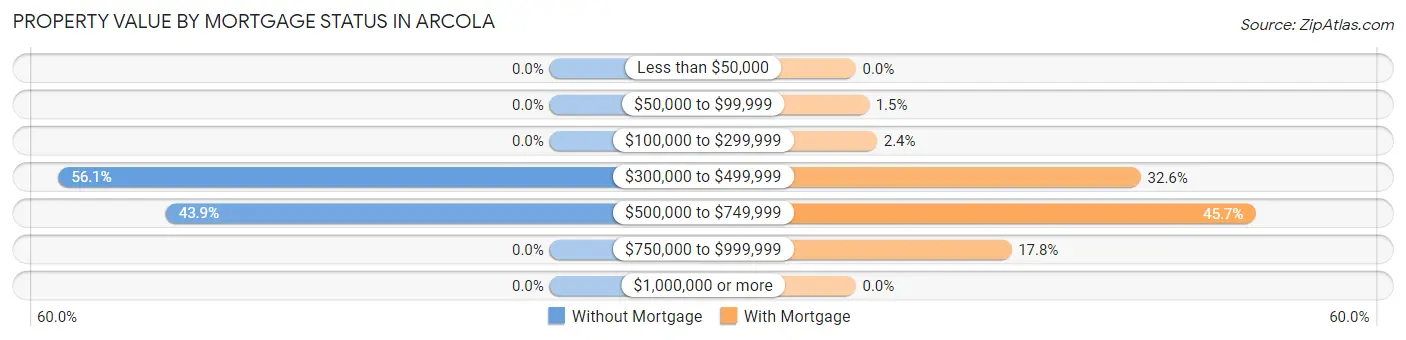
| Property Value | Without Mortgage | With Mortgage |
| Less than $50,000 | 0 (0.0%) | 0 (0.0%) |
| $50,000 to $99,999 | 0 (0.0%) | 8 (1.5%) |
| $100,000 to $299,999 | 0 (0.0%) | 13 (2.4%) |
| $300,000 to $499,999 | 32 (56.1%) | 174 (32.6%) |
| $500,000 to $749,999 | 25 (43.9%) | 244 (45.7%) |
| $750,000 to $999,999 | 0 (0.0%) | 95 (17.8%) |
| $1,000,000 or more | 0 (0.0%) | 0 (0.0%) |
| Total | 57 (100.0%) | 534 (100.0%) |
Household Income by Mortgage Status in Arcola
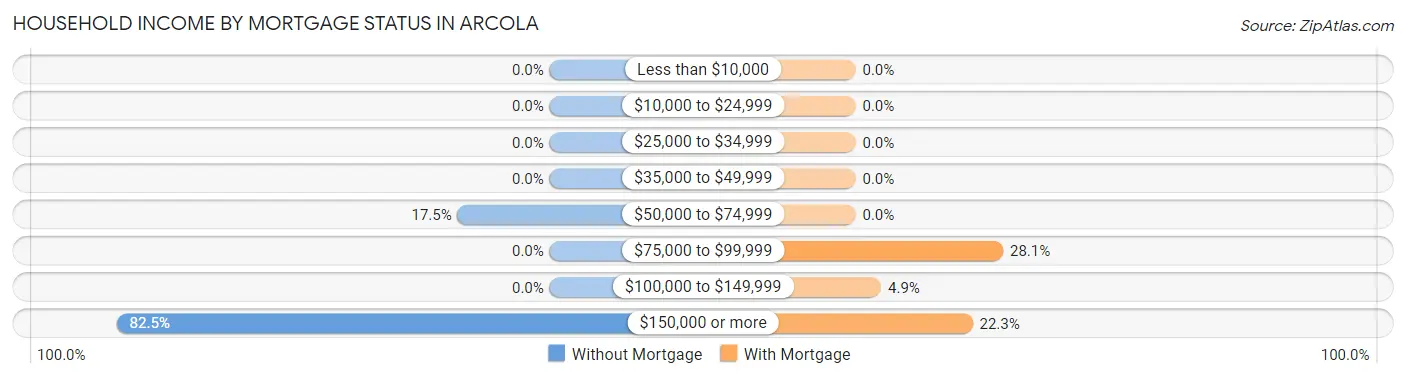
| Household Income | Without Mortgage | With Mortgage |
| Less than $10,000 | 0 (0.0%) | 0 (0.0%) |
| $10,000 to $24,999 | 0 (0.0%) | 0 (0.0%) |
| $25,000 to $34,999 | 0 (0.0%) | 0 (0.0%) |
| $35,000 to $49,999 | 0 (0.0%) | 0 (0.0%) |
| $50,000 to $74,999 | 10 (17.5%) | 0 (0.0%) |
| $75,000 to $99,999 | 0 (0.0%) | 150 (28.1%) |
| $100,000 to $149,999 | 0 (0.0%) | 26 (4.9%) |
| $150,000 or more | 47 (82.5%) | 119 (22.3%) |
| Total | 57 (100.0%) | 534 (100.0%) |
Property Value to Household Income Ratio in Arcola
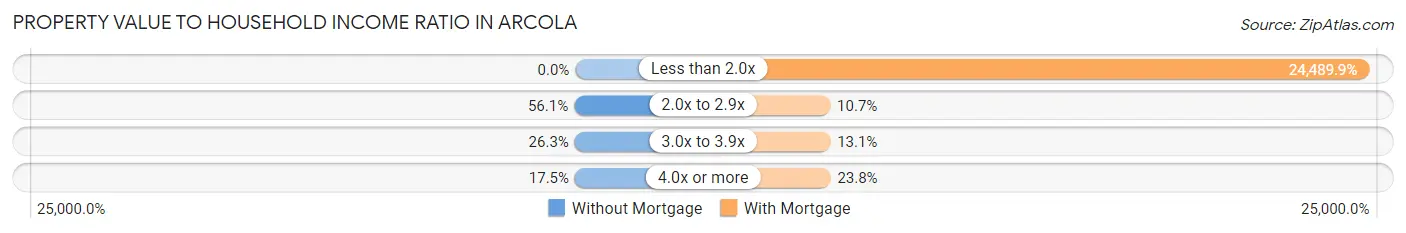
| Value-to-Income Ratio | Without Mortgage | With Mortgage |
| Less than 2.0x | 0 (0.0%) | 130,776 (24,489.9%) |
| 2.0x to 2.9x | 32 (56.1%) | 57 (10.7%) |
| 3.0x to 3.9x | 15 (26.3%) | 70 (13.1%) |
| 4.0x or more | 10 (17.5%) | 127 (23.8%) |
| Total | 57 (100.0%) | 534 (100.0%) |
Real Estate Taxes by Mortgage Status in Arcola

| Property Taxes | Without Mortgage | With Mortgage |
| Less than $800 | 0 (0.0%) | 0 (0.0%) |
| $800 to $1,499 | 0 (0.0%) | 8 (1.5%) |
| $800 to $1,499 | 57 (100.0%) | 0 (0.0%) |
| Total | 57 (100.0%) | 534 (100.0%) |
Health & Disability in Arcola
Health Insurance Coverage by Age in Arcola
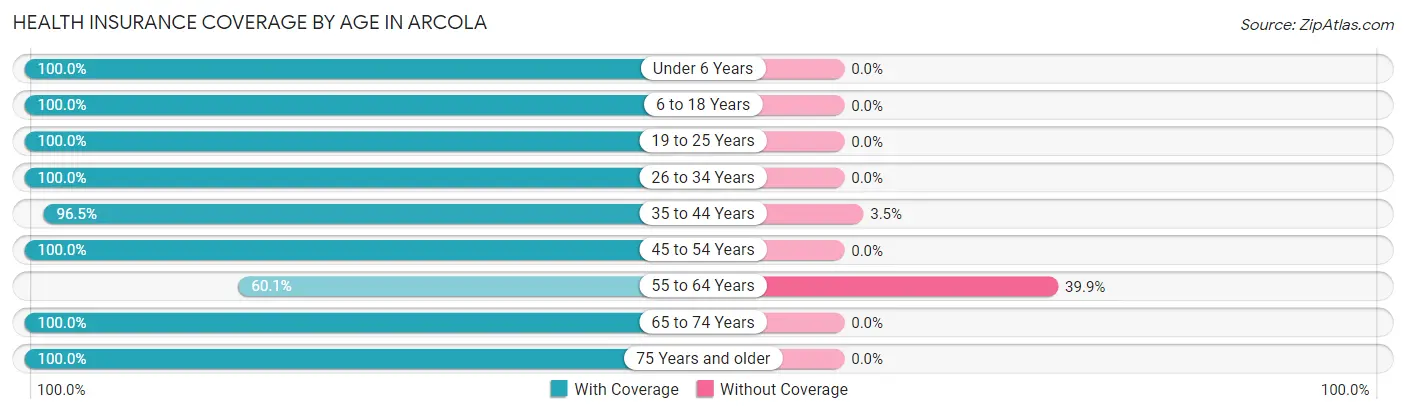
| Age Bracket | With Coverage | Without Coverage |
| Under 6 Years | 204 (100.0%) | 0 (0.0%) |
| 6 to 18 Years | 530 (100.0%) | 0 (0.0%) |
| 19 to 25 Years | 240 (100.0%) | 0 (0.0%) |
| 26 to 34 Years | 321 (100.0%) | 0 (0.0%) |
| 35 to 44 Years | 518 (96.5%) | 19 (3.5%) |
| 45 to 54 Years | 359 (100.0%) | 0 (0.0%) |
| 55 to 64 Years | 98 (60.1%) | 65 (39.9%) |
| 65 to 74 Years | 46 (100.0%) | 0 (0.0%) |
| 75 Years and older | 37 (100.0%) | 0 (0.0%) |
| Total | 2,353 (96.6%) | 84 (3.5%) |
Health Insurance Coverage by Citizenship Status in Arcola

| Citizenship Status | With Coverage | Without Coverage |
| Native Born | 204 (100.0%) | 0 (0.0%) |
| Foreign Born, Citizen | 530 (100.0%) | 0 (0.0%) |
| Foreign Born, not a Citizen | 240 (100.0%) | 0 (0.0%) |
Health Insurance Coverage by Household Income in Arcola
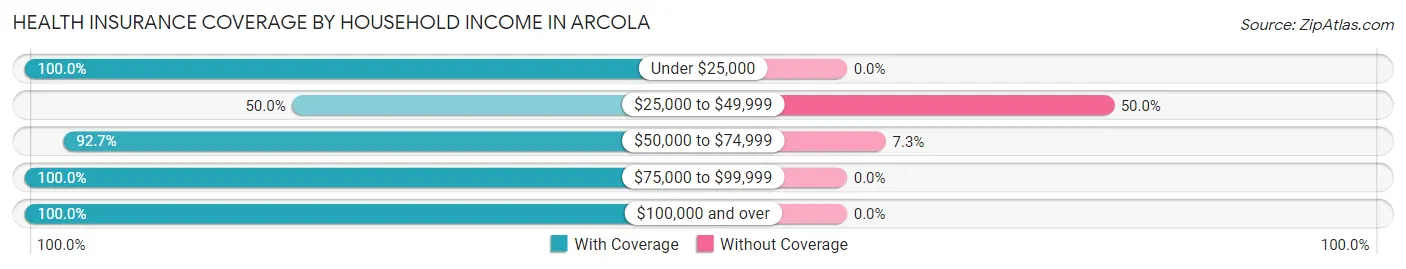
| Household Income | With Coverage | Without Coverage |
| Under $25,000 | 45 (100.0%) | 0 (0.0%) |
| $25,000 to $49,999 | 43 (50.0%) | 43 (50.0%) |
| $50,000 to $74,999 | 523 (92.7%) | 41 (7.3%) |
| $75,000 to $99,999 | 173 (100.0%) | 0 (0.0%) |
| $100,000 and over | 1,569 (100.0%) | 0 (0.0%) |
Public vs Private Health Insurance Coverage by Age in Arcola
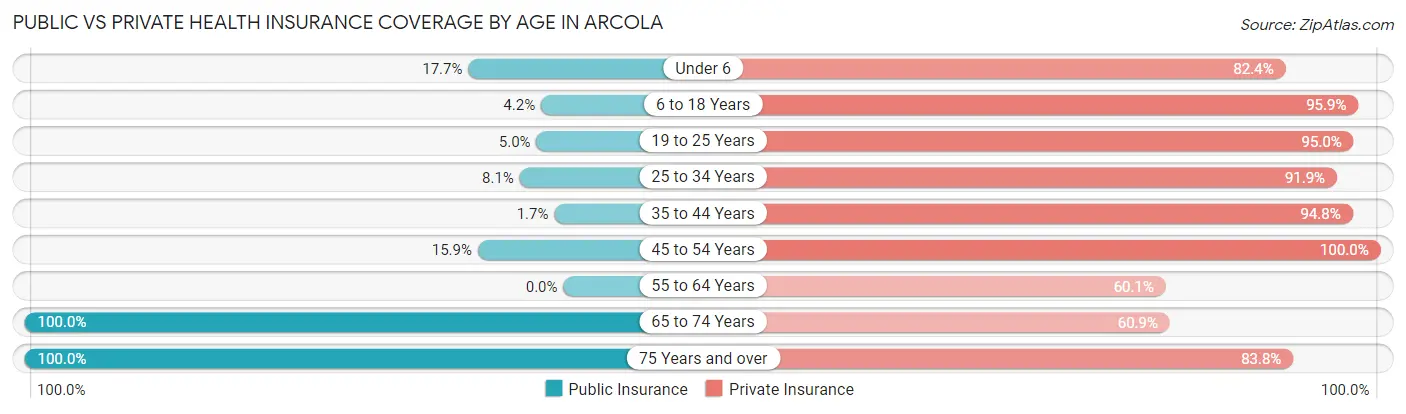
| Age Bracket | Public Insurance | Private Insurance |
| Under 6 | 36 (17.6%) | 168 (82.4%) |
| 6 to 18 Years | 22 (4.2%) | 508 (95.9%) |
| 19 to 25 Years | 12 (5.0%) | 228 (95.0%) |
| 25 to 34 Years | 26 (8.1%) | 295 (91.9%) |
| 35 to 44 Years | 9 (1.7%) | 509 (94.8%) |
| 45 to 54 Years | 57 (15.9%) | 359 (100.0%) |
| 55 to 64 Years | 0 (0.0%) | 98 (60.1%) |
| 65 to 74 Years | 46 (100.0%) | 28 (60.9%) |
| 75 Years and over | 37 (100.0%) | 31 (83.8%) |
| Total | 245 (10.1%) | 2,224 (91.3%) |
Disability Status by Sex by Age in Arcola
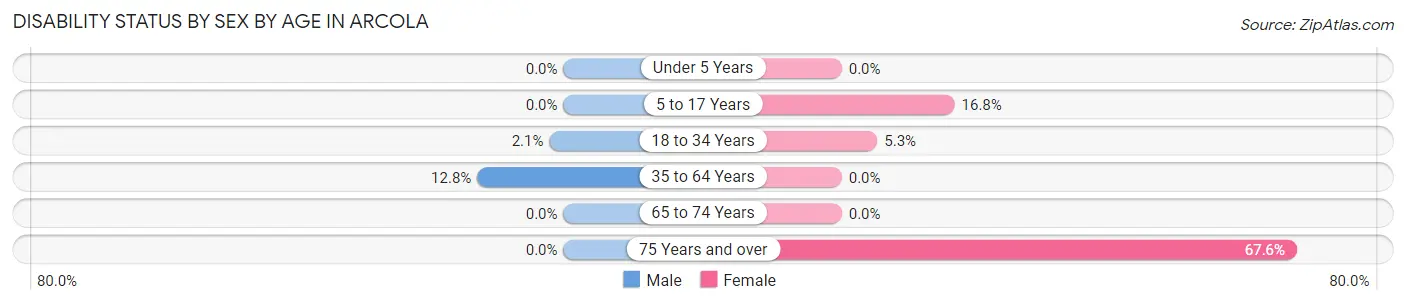
| Age Bracket | Male | Female |
| Under 5 Years | 0 (0.0%) | 0 (0.0%) |
| 5 to 17 Years | 0 (0.0%) | 35 (16.8%) |
| 18 to 34 Years | 6 (2.1%) | 17 (5.3%) |
| 35 to 64 Years | 74 (12.8%) | 0 (0.0%) |
| 65 to 74 Years | 0 (0.0%) | 0 (0.0%) |
| 75 Years and over | 0 (0.0%) | 25 (67.6%) |
Disability Class by Sex by Age in Arcola
Disability Class: Hearing Difficulty
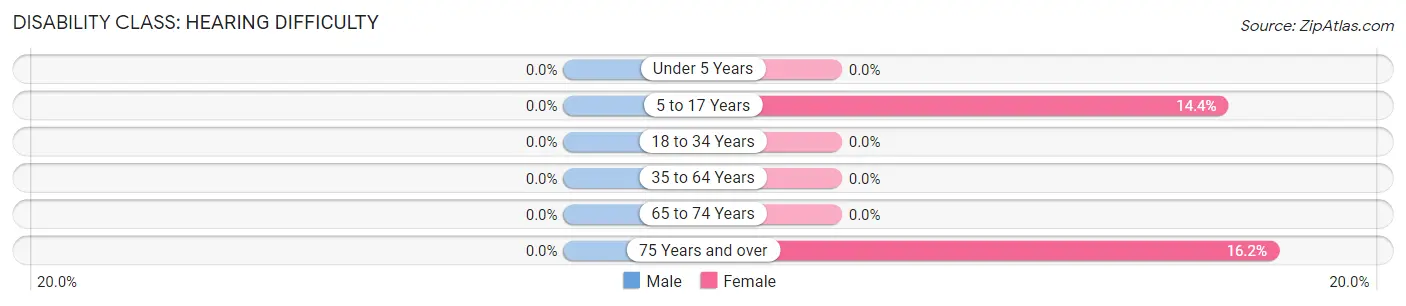
| Age Bracket | Male | Female |
| Under 5 Years | 0 (0.0%) | 0 (0.0%) |
| 5 to 17 Years | 0 (0.0%) | 30 (14.3%) |
| 18 to 34 Years | 0 (0.0%) | 0 (0.0%) |
| 35 to 64 Years | 0 (0.0%) | 0 (0.0%) |
| 65 to 74 Years | 0 (0.0%) | 0 (0.0%) |
| 75 Years and over | 0 (0.0%) | 6 (16.2%) |
Disability Class: Vision Difficulty
| Age Bracket | Male | Female |
| Under 5 Years | 0 (0.0%) | 0 (0.0%) |
| 5 to 17 Years | 0 (0.0%) | 0 (0.0%) |
| 18 to 34 Years | 0 (0.0%) | 0 (0.0%) |
| 35 to 64 Years | 0 (0.0%) | 0 (0.0%) |
| 65 to 74 Years | 0 (0.0%) | 0 (0.0%) |
| 75 Years and over | 0 (0.0%) | 0 (0.0%) |
Disability Class: Cognitive Difficulty
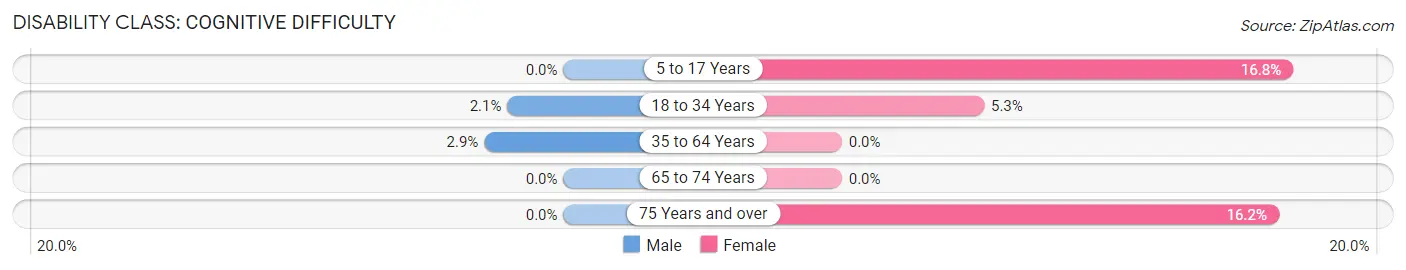
| Age Bracket | Male | Female |
| 5 to 17 Years | 0 (0.0%) | 35 (16.8%) |
| 18 to 34 Years | 6 (2.1%) | 17 (5.3%) |
| 35 to 64 Years | 17 (2.9%) | 0 (0.0%) |
| 65 to 74 Years | 0 (0.0%) | 0 (0.0%) |
| 75 Years and over | 0 (0.0%) | 6 (16.2%) |
Disability Class: Ambulatory Difficulty
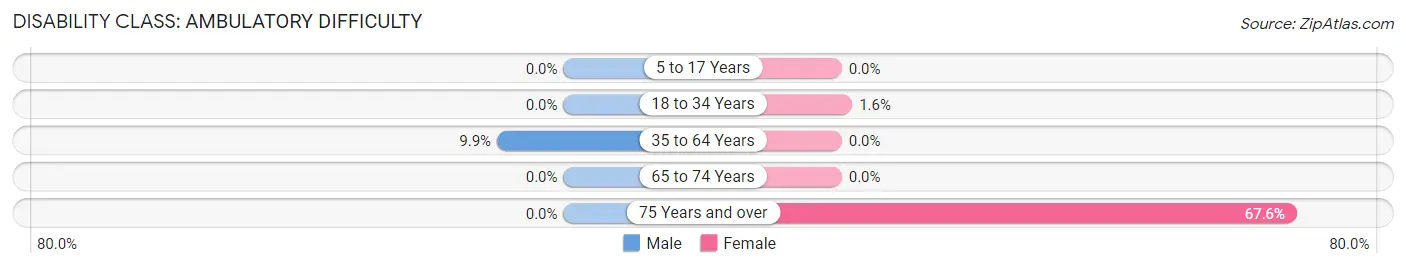
| Age Bracket | Male | Female |
| 5 to 17 Years | 0 (0.0%) | 0 (0.0%) |
| 18 to 34 Years | 0 (0.0%) | 5 (1.5%) |
| 35 to 64 Years | 57 (9.9%) | 0 (0.0%) |
| 65 to 74 Years | 0 (0.0%) | 0 (0.0%) |
| 75 Years and over | 0 (0.0%) | 25 (67.6%) |
Disability Class: Self-Care Difficulty
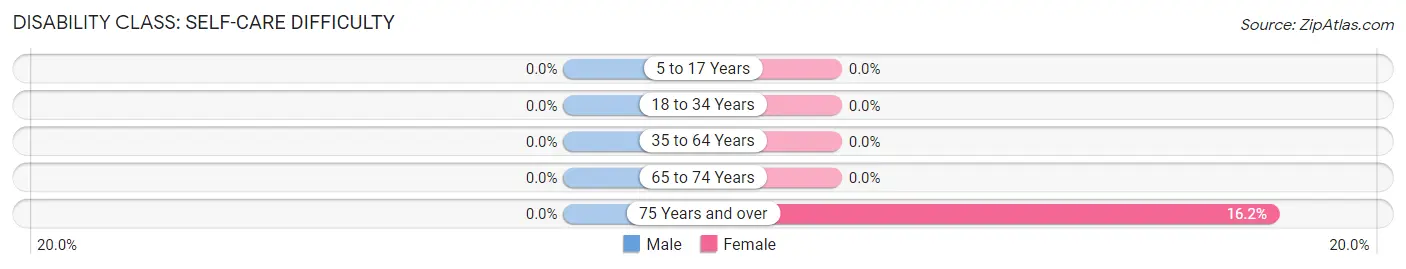
| Age Bracket | Male | Female |
| 5 to 17 Years | 0 (0.0%) | 0 (0.0%) |
| 18 to 34 Years | 0 (0.0%) | 0 (0.0%) |
| 35 to 64 Years | 0 (0.0%) | 0 (0.0%) |
| 65 to 74 Years | 0 (0.0%) | 0 (0.0%) |
| 75 Years and over | 0 (0.0%) | 6 (16.2%) |
Technology Access in Arcola
Computing Device Access in Arcola
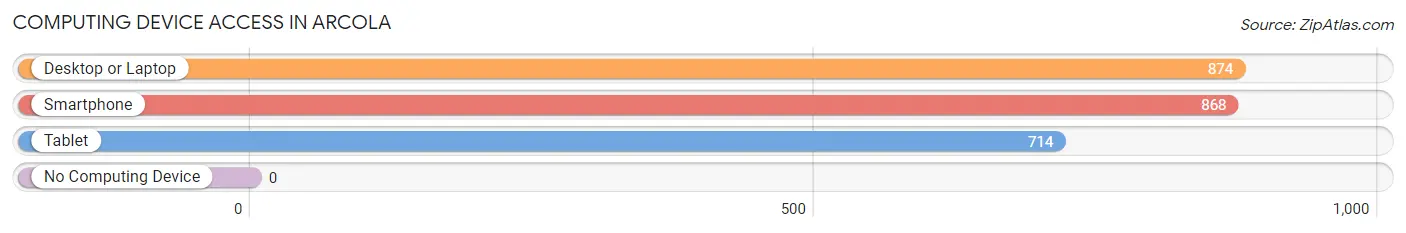
| Device Type | # Households | % Households |
| Desktop or Laptop | 874 | 96.4% |
| Smartphone | 868 | 95.7% |
| Tablet | 714 | 78.7% |
| No Computing Device | 0 | 0.0% |
| Total | 907 | 100.0% |
Internet Access in Arcola
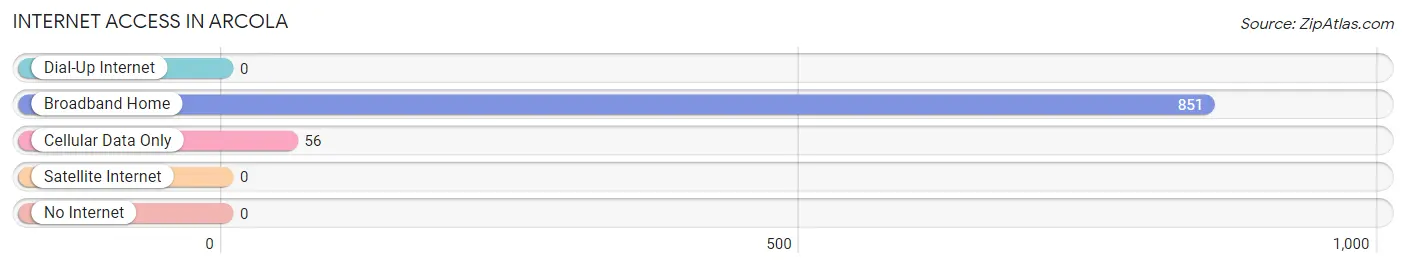
| Internet Type | # Households | % Households |
| Dial-Up Internet | 0 | 0.0% |
| Broadband Home | 851 | 93.8% |
| Cellular Data Only | 56 | 6.2% |
| Satellite Internet | 0 | 0.0% |
| No Internet | 0 | 0.0% |
| Total | 907 | 100.0% |
Arcola Summary
Arcola, Virginia is a small town located in Loudoun County, Virginia. It is situated in the northern part of the county, about 25 miles west of Washington, D.C. The town has a population of approximately 1,500 people and is part of the Washington metropolitan area.
History
Arcola was first settled in the late 1700s by a group of German immigrants. The town was originally known as “Arcola”, which is derived from the Latin phrase “arco luna”, meaning “circle of the moon”. The town was officially incorporated in 1891.
In the early 1900s, Arcola was a thriving agricultural community. The town was home to several farms, as well as a number of small businesses. The town also had a train station, which was used to transport goods and passengers to and from Washington, D.C.
In the mid-1900s, Arcola began to experience a decline in population and economic activity. This was due in part to the decline of the agricultural industry in the area, as well as the increasing popularity of suburban living in the Washington metropolitan area.
Geography
Arcola is located in the northern part of Loudoun County, Virginia. The town is situated on the eastern side of the Blue Ridge Mountains, about 25 miles west of Washington, D.C. The town is bordered by the towns of Sterling, Ashburn, and Leesburg.
The terrain of Arcola is mostly flat, with some rolling hills. The town is located in a temperate climate zone, with hot summers and cold winters. The average annual temperature is around 55 degrees Fahrenheit.
Economy
Arcola’s economy is largely based on agriculture and tourism. The town is home to several farms, which produce a variety of crops, including corn, soybeans, wheat, and hay. The town also has a number of small businesses, including restaurants, shops, and services.
In recent years, Arcola has become a popular destination for tourists. The town is home to several wineries, as well as a number of historic sites. The town also hosts a number of festivals and events throughout the year, including the Arcola Wine Festival and the Arcola Harvest Festival.
Demographics
As of the 2010 census, Arcola had a population of 1,500 people. The town is predominantly white (90.2%), with a small percentage of African Americans (4.2%) and Hispanics (2.7%). The median household income in Arcola is $76,250, and the median home value is $400,000.
Arcola is a small, rural town with a rich history and a vibrant economy. The town is home to a diverse population, and offers a variety of attractions and activities for visitors and residents alike.
Common Questions
What is the Total Population of Arcola?
Total Population of Arcola is 2,437.
What is the Total Male Population of Arcola?
Total Male Population of Arcola is 1,266.
What is the Total Female Population of Arcola?
Total Female Population of Arcola is 1,171.
What is the Ratio of Males per 100 Females in Arcola?
There are 108.11 Males per 100 Females in Arcola.
What is the Ratio of Females per 100 Males in Arcola?
There are 92.50 Females per 100 Males in Arcola.
What is the Median Population Age in Arcola?
Median Population Age in Arcola is 33.4 Years.
What is the Average Family Size in Arcola
Average Family Size in Arcola is 3.0 People.
What is the Average Household Size in Arcola
Average Household Size in Arcola is 2.7 People.
What is Per Capita Income in Arcola?
Per Capita income in Arcola is $49,148.
What is the Median Family Income in Arcola?
Median Family Income in Arcola is $130,938.
What is the Median Household income in Arcola?
Median Household Income in Arcola is $119,659.
What is Income or Wage Gap in Arcola?
Income or Wage Gap in Arcola is 64.1%.
Women in Arcola earn 35.9 cents for every dollar earned by a man.
What is Inequality or Gini Index in Arcola?
Inequality or Gini Index in Arcola is 0.32.
How Large is the Labor Force in Arcola?
There are 1,306 People in the Labor Forcein in Arcola.
What is the Percentage of People in the Labor Force in Arcola?
73.1% of People are in the Labor Force in Arcola.
What is the Unemployment Rate in Arcola?
Unemployment Rate in Arcola is 2.3%.