Cities with the Highest Percentage of Immigrants from Caribbean in Virginia
RELATED REPORTS & OPTIONS
Caribbean
Virginia
Compare Cities
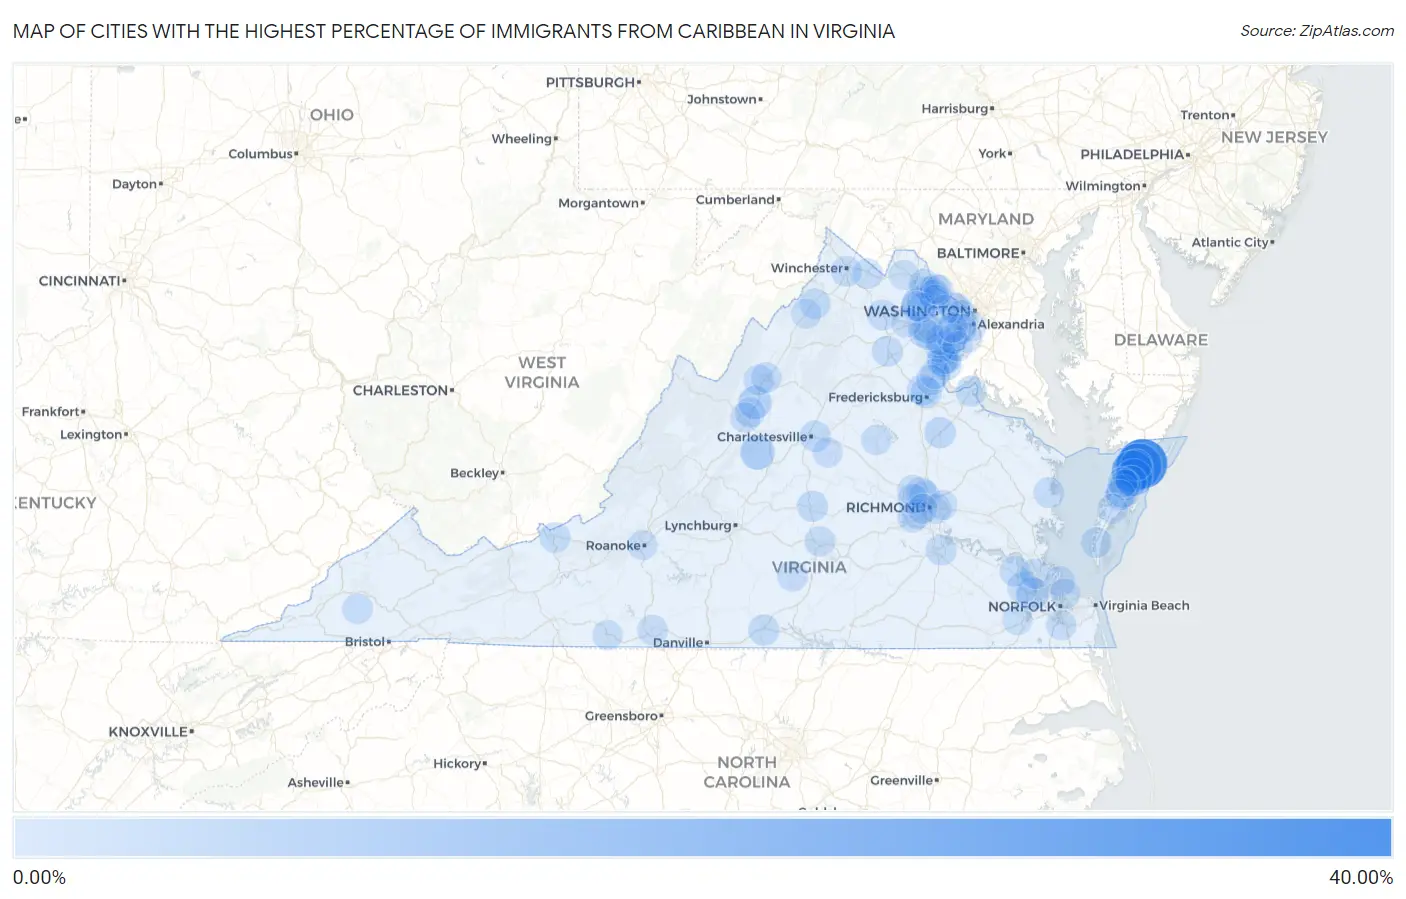
Map of Cities with the Highest Percentage of Immigrants from Caribbean in Virginia
0.00%
40.00%
Cities with the Highest Percentage of Immigrants from Caribbean in Virginia
| City | Caribbean | vs State | vs National | |
| 1. | Mappsville | 32.36% | 0.42%(+31.9)#-1 | 1.37%(+31.0)#0 |
| 2. | Nelsonia | 26.11% | 0.42%(+25.7)#0 | 1.37%(+24.7)#1 |
| 3. | Parksley | 19.37% | 0.42%(+19.0)#1 | 1.37%(+18.0)#2 |
| 4. | Pastoria | 11.96% | 0.42%(+11.5)#2 | 1.37%(+10.6)#3 |
| 5. | Wintergreen | 7.02% | 0.42%(+6.60)#3 | 1.37%(+5.65)#4 |
| 6. | Arcola | 6.36% | 0.42%(+5.94)#4 | 1.37%(+4.99)#5 |
| 7. | Mount Sidney | 5.26% | 0.42%(+4.84)#5 | 1.37%(+3.88)#6 |
| 8. | Melfa | 4.59% | 0.42%(+4.17)#6 | 1.37%(+3.21)#7 |
| 9. | Carrollton | 4.31% | 0.42%(+3.89)#7 | 1.37%(+2.94)#8 |
| 10. | One Loudoun | 3.78% | 0.42%(+3.36)#20 | 1.37%(+2.41)#906 |
| 11. | Bowling Green | 2.54% | 0.42%(+2.12)#21 | 1.37%(+1.16)#907 |
| 12. | Bloxom | 2.51% | 0.42%(+2.09)#22 | 1.37%(+1.14)#908 |
| 13. | Pantops | 2.41% | 0.42%(+1.99)#23 | 1.37%(+1.04)#909 |
| 14. | Riverdale | 2.20% | 0.42%(+1.78)#24 | 1.37%(+0.826)#910 |
| 15. | Southern Gateway | 2.20% | 0.42%(+1.78)#25 | 1.37%(+0.823)#911 |
| 16. | Falmouth | 2.13% | 0.42%(+1.71)#26 | 1.37%(+0.760)#912 |
| 17. | Dillwyn | 2.07% | 0.42%(+1.65)#27 | 1.37%(+0.697)#913 |
| 18. | Dumfries | 2.02% | 0.42%(+1.60)#28 | 1.37%(+0.646)#914 |
| 19. | Dahlgren | 1.91% | 0.42%(+1.49)#29 | 1.37%(+0.533)#915 |
| 20. | Fort Lee | 1.89% | 0.42%(+1.47)#30 | 1.37%(+0.515)#916 |
| 21. | Potomac Mills | 1.77% | 0.42%(+1.35)#31 | 1.37%(+0.394)#917 |
| 22. | Opal | 1.72% | 0.42%(+1.30)#32 | 1.37%(+0.347)#918 |
| 23. | Triangle | 1.68% | 0.42%(+1.26)#33 | 1.37%(+0.309)#919 |
| 24. | Lakeside | 1.67% | 0.42%(+1.25)#34 | 1.37%(+0.302)#920 |
| 25. | Accomac | 1.63% | 0.42%(+1.21)#35 | 1.37%(+0.259)#921 |
| 26. | Pimmit Hills | 1.58% | 0.42%(+1.17)#36 | 1.37%(+0.212)#922 |
| 27. | Marshall | 1.55% | 0.42%(+1.13)#37 | 1.37%(+0.177)#923 |
| 28. | Pearisburg | 1.53% | 0.42%(+1.11)#38 | 1.37%(+0.157)#924 |
| 29. | Smithfield | 1.48% | 0.42%(+1.06)#39 | 1.37%(+0.112)#925 |
| 30. | Quantico | 1.47% | 0.42%(+1.05)#40 | 1.37%(+0.101)#926 |
| 31. | Dayton | 1.46% | 0.42%(+1.04)#41 | 1.37%(+0.090)#927 |
| 32. | Rushmere | 1.45% | 0.42%(+1.03)#42 | 1.37%(+0.078)#928 |
| 33. | Winchester | 1.43% | 0.42%(+1.01)#43 | 1.37%(+0.062)#929 |
| 34. | Cheriton | 1.42% | 0.42%(+1.00)#44 | 1.37%(+0.051)#930 |
| 35. | Toms Brook | 1.38% | 0.42%(+0.958)#45 | 1.37%(+0.005)#931 |
| 36. | Onley | 1.37% | 0.42%(+0.952)#46 | 1.37%(-0.000)#932 |
| 37. | Laurel | 1.36% | 0.42%(+0.944)#47 | 1.37%(-0.009)#933 |
| 38. | Dungannon | 1.29% | 0.42%(+0.875)#48 | 1.37%(-0.078)#934 |
| 39. | White Stone | 1.29% | 0.42%(+0.867)#49 | 1.37%(-0.086)#935 |
| 40. | Woodlawn Cdp Fairfax County | 1.26% | 0.42%(+0.839)#50 | 1.37%(-0.114)#936 |
| 41. | Farmville | 1.23% | 0.42%(+0.810)#51 | 1.37%(-0.143)#937 |
| 42. | Martinsville | 1.21% | 0.42%(+0.792)#52 | 1.37%(-0.161)#938 |
| 43. | Harrisonburg | 1.17% | 0.42%(+0.755)#65 | 1.37%(-0.198)#2,302 |
| 44. | Cherry Hill | 1.15% | 0.42%(+0.727)#66 | 1.37%(-0.226)#2,303 |
| 45. | Keller | 1.05% | 0.42%(+0.629)#67 | 1.37%(-0.323)#2,304 |
| 46. | Manassas | 1.05% | 0.42%(+0.629)#68 | 1.37%(-0.324)#2,305 |
| 47. | Charlotte Court House | 1.01% | 0.42%(+0.586)#69 | 1.37%(-0.367)#2,306 |
| 48. | Tysons | 1.00% | 0.42%(+0.580)#70 | 1.37%(-0.373)#2,307 |
| 49. | Mineral | 0.98% | 0.42%(+0.558)#71 | 1.37%(-0.395)#2,308 |
| 50. | Dale City | 0.96% | 0.42%(+0.541)#72 | 1.37%(-0.412)#2,309 |
| 51. | Seven Corners | 0.95% | 0.42%(+0.532)#73 | 1.37%(-0.421)#2,310 |
| 52. | Newport News | 0.95% | 0.42%(+0.527)#74 | 1.37%(-0.425)#2,311 |
| 53. | Ashburn | 0.95% | 0.42%(+0.526)#75 | 1.37%(-0.427)#2,312 |
| 54. | Stafford Courthouse | 0.94% | 0.42%(+0.521)#76 | 1.37%(-0.432)#2,313 |
| 55. | Manchester | 0.94% | 0.42%(+0.519)#77 | 1.37%(-0.434)#2,314 |
| 56. | Berryville | 0.91% | 0.42%(+0.494)#78 | 1.37%(-0.459)#2,315 |
| 57. | South Run | 0.91% | 0.42%(+0.488)#79 | 1.37%(-0.465)#2,316 |
| 58. | Chesapeake | 0.90% | 0.42%(+0.479)#80 | 1.37%(-0.474)#2,390 |
| 59. | Sudley | 0.85% | 0.42%(+0.431)#81 | 1.37%(-0.522)#2,391 |
| 60. | Verona | 0.83% | 0.42%(+0.410)#82 | 1.37%(-0.543)#2,392 |
| 61. | Hampton | 0.81% | 0.42%(+0.395)#83 | 1.37%(-0.558)#2,393 |
| 62. | Stuart | 0.78% | 0.42%(+0.363)#84 | 1.37%(-0.590)#2,394 |
| 63. | Dulles Town Center | 0.78% | 0.42%(+0.362)#85 | 1.37%(-0.591)#2,395 |
| 64. | Sterling | 0.78% | 0.42%(+0.360)#86 | 1.37%(-0.593)#2,396 |
| 65. | Staunton | 0.78% | 0.42%(+0.358)#87 | 1.37%(-0.595)#2,397 |
| 66. | Montrose | 0.78% | 0.42%(+0.358)#88 | 1.37%(-0.595)#2,398 |
| 67. | Suffolk | 0.76% | 0.42%(+0.336)#89 | 1.37%(-0.617)#2,399 |
| 68. | Rockwood | 0.76% | 0.42%(+0.336)#90 | 1.37%(-0.617)#2,400 |
| 69. | Hamilton | 0.74% | 0.42%(+0.322)#91 | 1.37%(-0.631)#2,401 |
| 70. | Rose Hill Cdp Fairfax County | 0.74% | 0.42%(+0.321)#92 | 1.37%(-0.632)#2,402 |
| 71. | Leesylvania | 0.74% | 0.42%(+0.318)#93 | 1.37%(-0.635)#2,403 |
| 72. | Norfolk | 0.73% | 0.42%(+0.314)#94 | 1.37%(-0.639)#2,404 |
| 73. | Lansdowne | 0.72% | 0.42%(+0.305)#95 | 1.37%(-0.648)#2,405 |
| 74. | County Center | 0.72% | 0.42%(+0.301)#96 | 1.37%(-0.652)#2,406 |
| 75. | Roanoke | 0.71% | 0.42%(+0.293)#97 | 1.37%(-0.660)#2,407 |
| 76. | Moorefield | 0.71% | 0.42%(+0.291)#98 | 1.37%(-0.662)#2,408 |
| 77. | Lake Monticello | 0.70% | 0.42%(+0.282)#99 | 1.37%(-0.671)#2,409 |
| 78. | Onancock | 0.70% | 0.42%(+0.278)#100 | 1.37%(-0.675)#2,410 |
| 79. | Mount Vernon | 0.69% | 0.42%(+0.272)#101 | 1.37%(-0.681)#2,411 |
| 80. | Huntington | 0.69% | 0.42%(+0.270)#102 | 1.37%(-0.682)#2,412 |
| 81. | Woodstock | 0.69% | 0.42%(+0.270)#103 | 1.37%(-0.683)#2,413 |
| 82. | Innsbrook | 0.69% | 0.42%(+0.270)#104 | 1.37%(-0.683)#2,414 |
| 83. | Manassas Park | 0.68% | 0.42%(+0.258)#105 | 1.37%(-0.695)#2,415 |
| 84. | Herndon | 0.66% | 0.42%(+0.243)#106 | 1.37%(-0.710)#2,416 |
| 85. | Buckhall | 0.65% | 0.42%(+0.232)#107 | 1.37%(-0.721)#2,417 |
| 86. | Franconia | 0.65% | 0.42%(+0.228)#108 | 1.37%(-0.725)#2,418 |
| 87. | Aquia Harbour | 0.65% | 0.42%(+0.228)#109 | 1.37%(-0.725)#2,419 |
| 88. | South Riding | 0.63% | 0.42%(+0.207)#110 | 1.37%(-0.746)#2,420 |
| 89. | Oakton | 0.62% | 0.42%(+0.199)#111 | 1.37%(-0.754)#2,421 |
| 90. | Cascades | 0.61% | 0.42%(+0.194)#112 | 1.37%(-0.758)#2,422 |
| 91. | Highland Springs | 0.58% | 0.42%(+0.158)#113 | 1.37%(-0.795)#2,423 |
| 92. | Lowes Island | 0.58% | 0.42%(+0.157)#114 | 1.37%(-0.795)#2,424 |
| 93. | Exmore | 0.57% | 0.42%(+0.154)#115 | 1.37%(-0.799)#2,425 |
| 94. | Haymarket | 0.57% | 0.42%(+0.153)#116 | 1.37%(-0.800)#2,426 |
| 95. | Laurel Hill | 0.57% | 0.42%(+0.153)#117 | 1.37%(-0.800)#2,427 |
| 96. | Tuckahoe | 0.57% | 0.42%(+0.151)#118 | 1.37%(-0.802)#2,428 |
| 97. | Mason Neck | 0.57% | 0.42%(+0.150)#119 | 1.37%(-0.803)#2,429 |
| 98. | West Springfield | 0.57% | 0.42%(+0.150)#120 | 1.37%(-0.803)#2,430 |
| 99. | Richmond | 0.56% | 0.42%(+0.145)#121 | 1.37%(-0.808)#2,431 |
| 100. | Stone Ridge | 0.56% | 0.42%(+0.141)#122 | 1.37%(-0.812)#2,432 |
Common Questions
What are the Top 10 Cities with the Highest Percentage of Immigrants from Caribbean in Virginia?
Top 10 Cities with the Highest Percentage of Immigrants from Caribbean in Virginia are:
#1
32.36%
#2
26.11%
#3
19.37%
#4
11.96%
#5
7.02%
#6
6.36%
#7
5.26%
#8
4.59%
#9
4.31%
#10
2.54%
What city has the Highest Percentage of Immigrants from Caribbean in Virginia?
Mappsville has the Highest Percentage of Immigrants from Caribbean in Virginia with 32.36%.
What is the Percentage of Immigrants from Caribbean in the State of Virginia?
Percentage of Immigrants from Caribbean in Virginia is 0.42%.
What is the Percentage of Immigrants from Caribbean in the United States?
Percentage of Immigrants from Caribbean in the United States is 1.37%.