Cities with the Highest Percentage of Lebanese Population in Virginia
RELATED REPORTS & OPTIONS
Lebanese
Virginia
Compare Cities
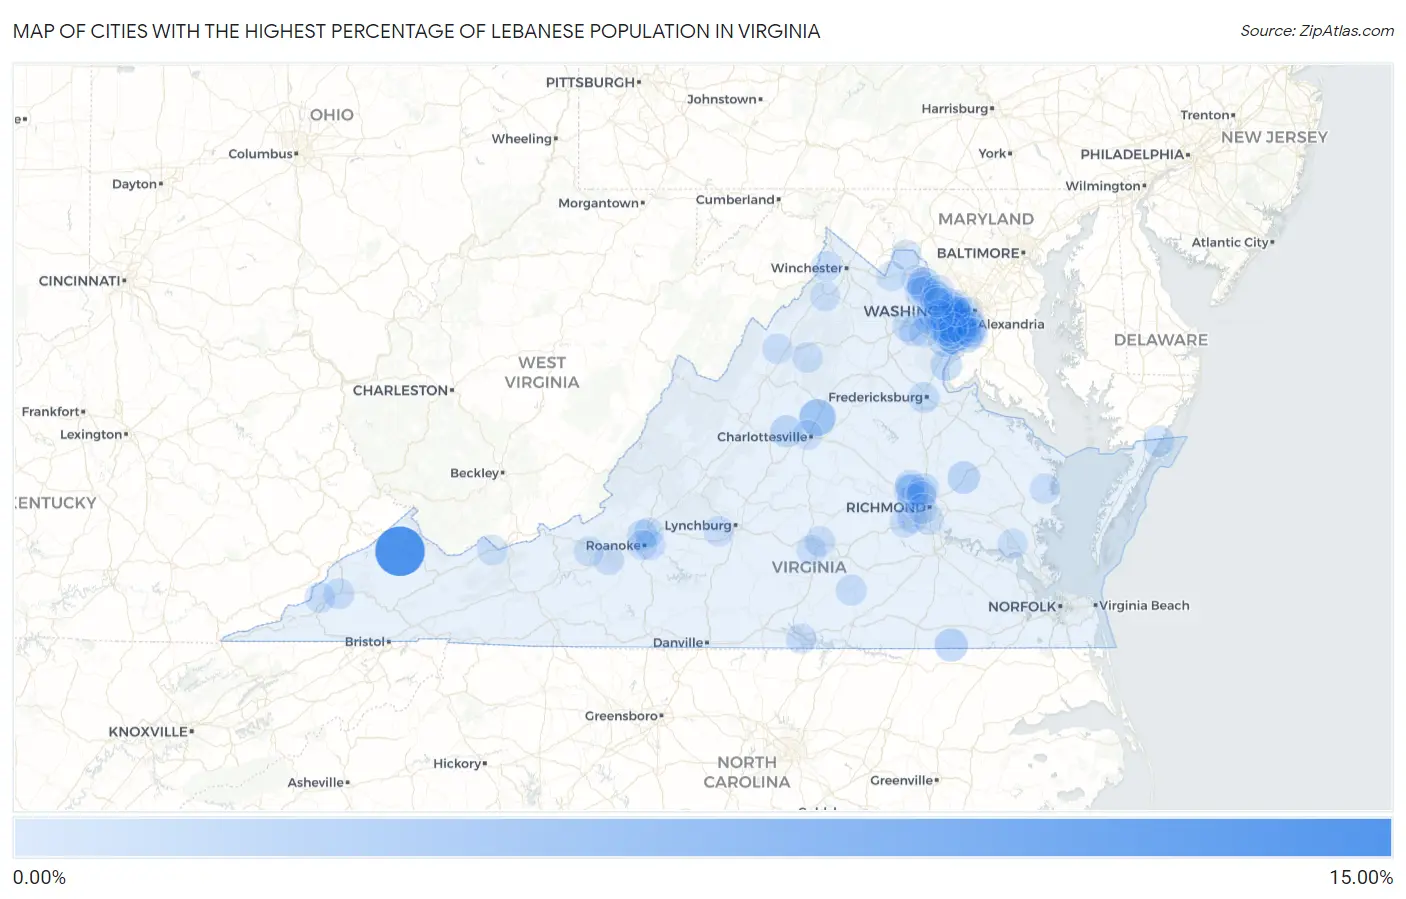
Map of Cities with the Highest Percentage of Lebanese Population in Virginia
0.00%
15.00%
Cities with the Highest Percentage of Lebanese Population in Virginia
| City | Lebanese | vs State | vs National | |
| 1. | Vansant | 13.97% | 0.21%(+13.8)#1 | 0.17%(+13.8)#9 |
| 2. | Moneta | 8.73% | 0.21%(+8.52)#2 | 0.17%(+8.57)#14 |
| 3. | Piney Mountain | 4.60% | 0.21%(+4.39)#3 | 0.17%(+4.43)#48 |
| 4. | Long Branch | 4.41% | 0.21%(+4.21)#4 | 0.17%(+4.25)#52 |
| 5. | Branchville | 2.29% | 0.21%(+2.08)#5 | 0.17%(+2.12)#160 |
| 6. | Great Falls Crossing | 2.19% | 0.21%(+1.98)#6 | 0.17%(+2.02)#171 |
| 7. | Lansdowne | 2.10% | 0.21%(+1.89)#7 | 0.17%(+1.93)#182 |
| 8. | Central Garage | 1.72% | 0.21%(+1.52)#8 | 0.17%(+1.56)#266 |
| 9. | Earlysville | 1.69% | 0.21%(+1.49)#9 | 0.17%(+1.53)#272 |
| 10. | Crozet | 1.51% | 0.21%(+1.30)#10 | 0.17%(+1.34)#333 |
| 11. | Greenbriar | 1.46% | 0.21%(+1.25)#11 | 0.17%(+1.29)#347 |
| 12. | Innsbrook | 1.38% | 0.21%(+1.17)#12 | 0.17%(+1.21)#380 |
| 13. | Burke Centre | 1.35% | 0.21%(+1.14)#13 | 0.17%(+1.18)#392 |
| 14. | Quantico | 1.29% | 0.21%(+1.08)#14 | 0.17%(+1.12)#422 |
| 15. | Captains Cove | 1.18% | 0.21%(+0.971)#15 | 0.17%(+1.01)#471 |
| 16. | Lake Ridge | 1.17% | 0.21%(+0.963)#16 | 0.17%(+1.00)#476 |
| 17. | Wolf Trap | 1.13% | 0.21%(+0.926)#17 | 0.17%(+0.968)#499 |
| 18. | Merrifield | 1.12% | 0.21%(+0.913)#18 | 0.17%(+0.954)#508 |
| 19. | Woodburn | 1.03% | 0.21%(+0.828)#19 | 0.17%(+0.869)#554 |
| 20. | Fairfax Station | 1.03% | 0.21%(+0.820)#20 | 0.17%(+0.861)#564 |
| 21. | Annandale | 1.02% | 0.21%(+0.809)#21 | 0.17%(+0.851)#576 |
| 22. | Hayfield | 1.00% | 0.21%(+0.796)#22 | 0.17%(+0.837)#585 |
| 23. | Burke | 0.98% | 0.21%(+0.772)#23 | 0.17%(+0.814)#598 |
| 24. | Glen Allen | 0.90% | 0.21%(+0.692)#24 | 0.17%(+0.734)#676 |
| 25. | Sterling | 0.87% | 0.21%(+0.660)#25 | 0.17%(+0.701)#707 |
| 26. | Fredericksburg | 0.86% | 0.21%(+0.657)#26 | 0.17%(+0.698)#710 |
| 27. | Kenbridge | 0.79% | 0.21%(+0.585)#27 | 0.17%(+0.627)#781 |
| 28. | Belmont | 0.77% | 0.21%(+0.562)#28 | 0.17%(+0.603)#819 |
| 29. | Kings Park | 0.75% | 0.21%(+0.543)#29 | 0.17%(+0.584)#850 |
| 30. | Norton | 0.74% | 0.21%(+0.530)#30 | 0.17%(+0.571)#861 |
| 31. | Laurel Hill | 0.70% | 0.21%(+0.488)#31 | 0.17%(+0.530)#921 |
| 32. | Lorton | 0.69% | 0.21%(+0.483)#32 | 0.17%(+0.524)#930 |
| 33. | Hollins | 0.68% | 0.21%(+0.477)#33 | 0.17%(+0.518)#942 |
| 34. | Short Pump | 0.68% | 0.21%(+0.473)#34 | 0.17%(+0.514)#952 |
| 35. | Rockwood | 0.67% | 0.21%(+0.462)#35 | 0.17%(+0.504)#975 |
| 36. | Vienna | 0.66% | 0.21%(+0.458)#36 | 0.17%(+0.499)#983 |
| 37. | Fair Lakes | 0.64% | 0.21%(+0.433)#37 | 0.17%(+0.474)#1,027 |
| 38. | West Falls Church | 0.60% | 0.21%(+0.398)#38 | 0.17%(+0.439)#1,088 |
| 39. | Lovettsville | 0.56% | 0.21%(+0.356)#39 | 0.17%(+0.397)#1,179 |
| 40. | Gainesville | 0.55% | 0.21%(+0.347)#40 | 0.17%(+0.389)#1,194 |
| 41. | Vinton | 0.55% | 0.21%(+0.340)#41 | 0.17%(+0.382)#1,215 |
| 42. | Franconia | 0.53% | 0.21%(+0.324)#42 | 0.17%(+0.365)#1,241 |
| 43. | Broadlands | 0.53% | 0.21%(+0.321)#43 | 0.17%(+0.363)#1,245 |
| 44. | Lincolnia | 0.52% | 0.21%(+0.318)#44 | 0.17%(+0.360)#1,250 |
| 45. | Fort Hunt | 0.52% | 0.21%(+0.318)#45 | 0.17%(+0.360)#1,252 |
| 46. | Dunn Loring | 0.52% | 0.21%(+0.310)#46 | 0.17%(+0.352)#1,275 |
| 47. | Bluefield | 0.51% | 0.21%(+0.307)#47 | 0.17%(+0.349)#1,286 |
| 48. | Appalachia | 0.50% | 0.21%(+0.298)#48 | 0.17%(+0.340)#1,308 |
| 49. | Stanley | 0.50% | 0.21%(+0.290)#49 | 0.17%(+0.332)#1,327 |
| 50. | Centreville | 0.48% | 0.21%(+0.272)#50 | 0.17%(+0.314)#1,388 |
| 51. | Forest | 0.48% | 0.21%(+0.269)#51 | 0.17%(+0.311)#1,399 |
| 52. | Linton Hall | 0.47% | 0.21%(+0.262)#52 | 0.17%(+0.303)#1,421 |
| 53. | Fairfax | 0.47% | 0.21%(+0.260)#53 | 0.17%(+0.301)#1,433 |
| 54. | Falls Church | 0.46% | 0.21%(+0.253)#54 | 0.17%(+0.295)#1,450 |
| 55. | Shawsville | 0.46% | 0.21%(+0.251)#55 | 0.17%(+0.293)#1,459 |
| 56. | Crosspointe | 0.45% | 0.21%(+0.246)#56 | 0.17%(+0.287)#1,478 |
| 57. | Kingstowne | 0.45% | 0.21%(+0.243)#57 | 0.17%(+0.285)#1,487 |
| 58. | Mclean | 0.44% | 0.21%(+0.235)#58 | 0.17%(+0.277)#1,508 |
| 59. | Timberville | 0.44% | 0.21%(+0.232)#59 | 0.17%(+0.273)#1,526 |
| 60. | Moorefield | 0.44% | 0.21%(+0.231)#60 | 0.17%(+0.272)#1,529 |
| 61. | Mount Vernon | 0.44% | 0.21%(+0.230)#61 | 0.17%(+0.271)#1,535 |
| 62. | Clarksville | 0.43% | 0.21%(+0.223)#62 | 0.17%(+0.265)#1,560 |
| 63. | Shawneeland | 0.43% | 0.21%(+0.220)#63 | 0.17%(+0.261)#1,575 |
| 64. | Brandermill | 0.42% | 0.21%(+0.213)#64 | 0.17%(+0.255)#1,601 |
| 65. | Newington Forest | 0.42% | 0.21%(+0.213)#65 | 0.17%(+0.254)#1,605 |
| 66. | Tuckahoe | 0.42% | 0.21%(+0.212)#66 | 0.17%(+0.253)#1,608 |
| 67. | Tysons | 0.42% | 0.21%(+0.210)#67 | 0.17%(+0.251)#1,616 |
| 68. | Alexandria | 0.41% | 0.21%(+0.200)#68 | 0.17%(+0.242)#1,657 |
| 69. | Wyndham | 0.40% | 0.21%(+0.198)#69 | 0.17%(+0.239)#1,663 |
| 70. | Leesylvania | 0.40% | 0.21%(+0.196)#70 | 0.17%(+0.237)#1,670 |
| 71. | Arlington | 0.39% | 0.21%(+0.186)#71 | 0.17%(+0.228)#1,710 |
| 72. | Farmville | 0.39% | 0.21%(+0.186)#72 | 0.17%(+0.227)#1,711 |
| 73. | Irvington | 0.39% | 0.21%(+0.179)#73 | 0.17%(+0.220)#1,735 |
| 74. | Laurel | 0.38% | 0.21%(+0.172)#74 | 0.17%(+0.214)#1,767 |
| 75. | South Run | 0.37% | 0.21%(+0.168)#75 | 0.17%(+0.209)#1,781 |
| 76. | Ashburn | 0.37% | 0.21%(+0.161)#76 | 0.17%(+0.202)#1,813 |
| 77. | Belle Haven | 0.36% | 0.21%(+0.155)#77 | 0.17%(+0.197)#1,838 |
| 78. | Williamsburg | 0.36% | 0.21%(+0.149)#78 | 0.17%(+0.190)#1,871 |
| 79. | Dranesville | 0.35% | 0.21%(+0.147)#79 | 0.17%(+0.189)#1,878 |
| 80. | Dumbarton | 0.35% | 0.21%(+0.144)#80 | 0.17%(+0.185)#1,899 |
| 81. | Bensley | 0.35% | 0.21%(+0.142)#81 | 0.17%(+0.183)#1,917 |
| 82. | Strasburg | 0.34% | 0.21%(+0.131)#82 | 0.17%(+0.173)#1,954 |
| 83. | Hybla Valley | 0.32% | 0.21%(+0.114)#83 | 0.17%(+0.155)#2,050 |
| 84. | Hampden Sydney | 0.31% | 0.21%(+0.103)#84 | 0.17%(+0.145)#2,110 |
| 85. | Leesburg | 0.31% | 0.21%(+0.103)#85 | 0.17%(+0.144)#2,114 |
| 86. | West Springfield | 0.30% | 0.21%(+0.097)#86 | 0.17%(+0.139)#2,148 |
| 87. | Lowes Island | 0.30% | 0.21%(+0.095)#87 | 0.17%(+0.137)#2,163 |
| 88. | Round Hill | 0.30% | 0.21%(+0.093)#88 | 0.17%(+0.134)#2,183 |
| 89. | Braddock | 0.30% | 0.21%(+0.092)#89 | 0.17%(+0.134)#2,188 |
| 90. | Cloverdale | 0.29% | 0.21%(+0.079)#90 | 0.17%(+0.120)#2,258 |
| 91. | Blacksburg | 0.28% | 0.21%(+0.073)#91 | 0.17%(+0.114)#2,300 |
| 92. | Idylwood | 0.28% | 0.21%(+0.069)#92 | 0.17%(+0.110)#2,318 |
| 93. | Roanoke | 0.27% | 0.21%(+0.063)#93 | 0.17%(+0.104)#2,354 |
| 94. | Richmond | 0.26% | 0.21%(+0.058)#94 | 0.17%(+0.100)#2,376 |
| 95. | Herndon | 0.26% | 0.21%(+0.055)#95 | 0.17%(+0.097)#2,400 |
| 96. | Manassas | 0.25% | 0.21%(+0.047)#96 | 0.17%(+0.088)#2,463 |
| 97. | University Of Virginia | 0.25% | 0.21%(+0.042)#97 | 0.17%(+0.084)#2,499 |
| 98. | Fair Oaks | 0.25% | 0.21%(+0.041)#98 | 0.17%(+0.083)#2,511 |
| 99. | Rose Hill Cdp Fairfax County | 0.25% | 0.21%(+0.039)#99 | 0.17%(+0.080)#2,529 |
| 100. | Reston | 0.24% | 0.21%(+0.036)#100 | 0.17%(+0.077)#2,549 |
Common Questions
What are the Top 10 Cities with the Highest Percentage of Lebanese Population in Virginia?
Top 10 Cities with the Highest Percentage of Lebanese Population in Virginia are:
#1
13.97%
#2
4.60%
#3
4.41%
#4
2.29%
#5
2.10%
#6
1.72%
#7
1.51%
#8
1.46%
#9
1.38%
#10
1.35%
What city has the Highest Percentage of Lebanese Population in Virginia?
Vansant has the Highest Percentage of Lebanese Population in Virginia with 13.97%.
What is the Percentage of Lebanese Population in the State of Virginia?
Percentage of Lebanese Population in Virginia is 0.21%.
What is the Percentage of Lebanese Population in the United States?
Percentage of Lebanese Population in the United States is 0.17%.