Cities with the Highest Percentage of Immigrants from Lebanon in Virginia
RELATED REPORTS & OPTIONS
Lebanon
Virginia
Compare Cities
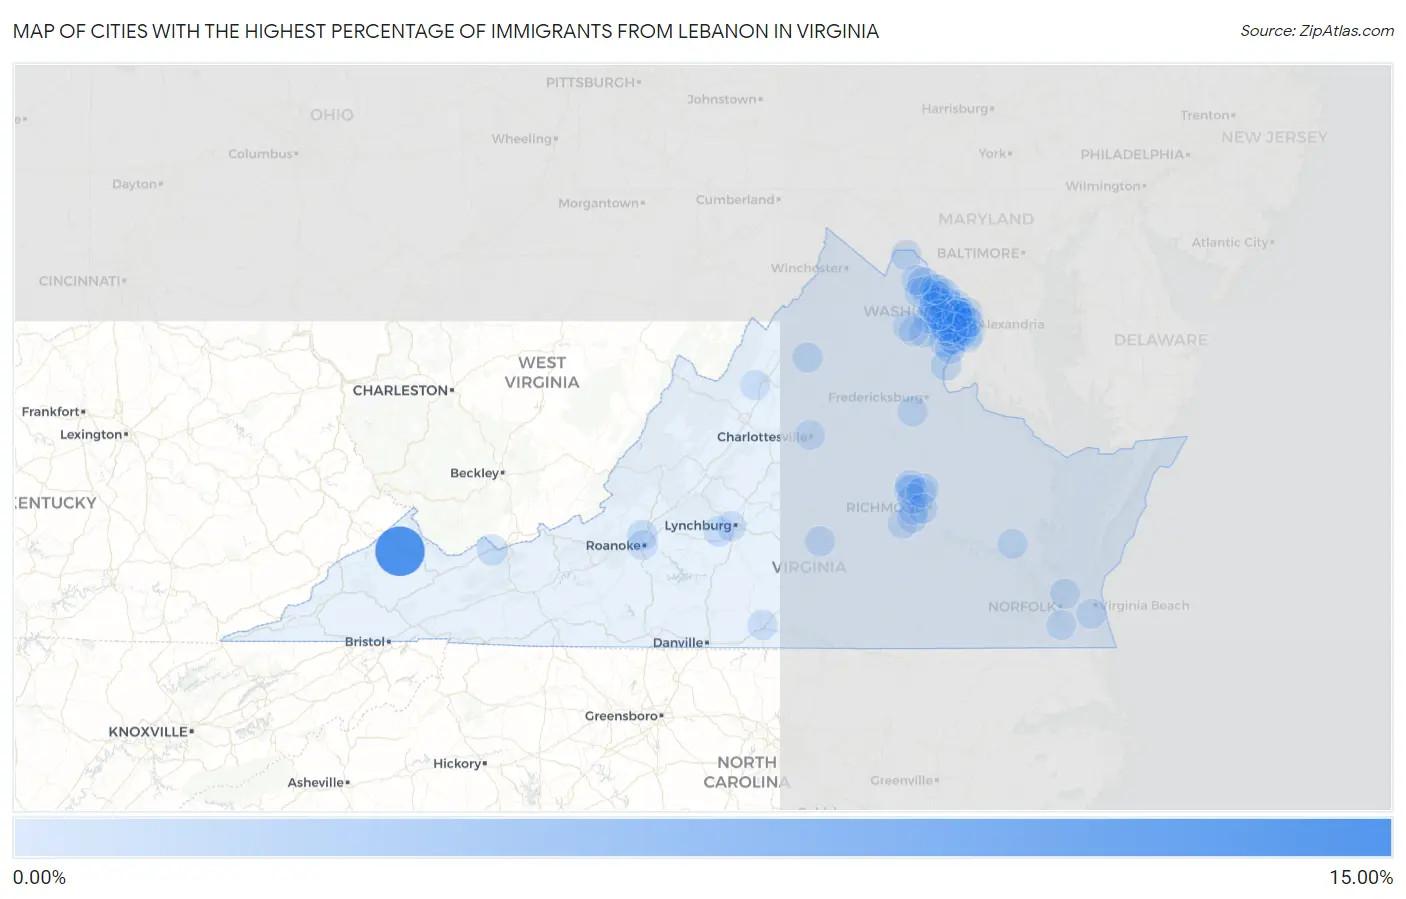
Map of Cities with the Highest Percentage of Immigrants from Lebanon in Virginia
0.00%
15.00%
Cities with the Highest Percentage of Immigrants from Lebanon in Virginia
| City | Lebanon | vs State | vs National | |
| 1. | Vansant | 13.97% | 0.063%(+13.9)#-1 | 0.040%(+13.9)#0 |
| 2. | Mantua | 1.89% | 0.063%(+1.82)#1 | 0.040%(+1.85)#112 |
| 3. | Lansdowne | 1.85% | 0.063%(+1.79)#2 | 0.040%(+1.81)#113 |
| 4. | Long Branch | 1.28% | 0.063%(+1.22)#16 | 0.040%(+1.24)#668 |
| 5. | Lake Ridge | 1.11% | 0.063%(+1.04)#40 | 0.040%(+1.07)#1,407 |
| 6. | Quantico | 0.74% | 0.063%(+0.674)#41 | 0.040%(+0.696)#1,408 |
| 7. | Wolf Trap | 0.65% | 0.063%(+0.586)#42 | 0.040%(+0.609)#1,409 |
| 8. | Greenbriar | 0.64% | 0.063%(+0.579)#43 | 0.040%(+0.602)#1,410 |
| 9. | Sterling | 0.54% | 0.063%(+0.481)#44 | 0.040%(+0.504)#1,411 |
| 10. | Broadlands | 0.52% | 0.063%(+0.458)#45 | 0.040%(+0.481)#1,412 |
| 11. | Bluefield | 0.51% | 0.063%(+0.451)#46 | 0.040%(+0.474)#1,413 |
| 12. | Fairfax Station | 0.45% | 0.063%(+0.385)#47 | 0.040%(+0.408)#1,414 |
| 13. | Vienna | 0.45% | 0.063%(+0.382)#48 | 0.040%(+0.405)#1,415 |
| 14. | Annandale | 0.44% | 0.063%(+0.374)#49 | 0.040%(+0.397)#1,416 |
| 15. | Glen Allen | 0.40% | 0.063%(+0.337)#50 | 0.040%(+0.360)#1,417 |
| 16. | Dunn Loring | 0.39% | 0.063%(+0.328)#51 | 0.040%(+0.350)#1,418 |
| 17. | Innsbrook | 0.37% | 0.063%(+0.305)#52 | 0.040%(+0.328)#1,419 |
| 18. | Rockwood | 0.36% | 0.063%(+0.296)#53 | 0.040%(+0.319)#1,420 |
| 19. | Tysons | 0.36% | 0.063%(+0.296)#54 | 0.040%(+0.318)#1,421 |
| 20. | Herndon | 0.36% | 0.063%(+0.293)#55 | 0.040%(+0.316)#1,422 |
| 21. | Burke | 0.35% | 0.063%(+0.292)#56 | 0.040%(+0.315)#1,423 |
| 22. | Forest | 0.32% | 0.063%(+0.257)#57 | 0.040%(+0.280)#1,424 |
| 23. | Spotsylvania Courthouse | 0.32% | 0.063%(+0.255)#58 | 0.040%(+0.278)#1,425 |
| 24. | Mclean | 0.30% | 0.063%(+0.238)#59 | 0.040%(+0.260)#1,426 |
| 25. | Hollins | 0.30% | 0.063%(+0.236)#60 | 0.040%(+0.259)#1,427 |
| 26. | Franconia | 0.28% | 0.063%(+0.222)#61 | 0.040%(+0.245)#1,428 |
| 27. | Lincolnia | 0.27% | 0.063%(+0.205)#62 | 0.040%(+0.227)#1,429 |
| 28. | George Mason | 0.24% | 0.063%(+0.177)#63 | 0.040%(+0.199)#1,430 |
| 29. | Bailey S Crossroads | 0.23% | 0.063%(+0.167)#64 | 0.040%(+0.190)#1,431 |
| 30. | Hayfield | 0.23% | 0.063%(+0.165)#65 | 0.040%(+0.188)#1,432 |
| 31. | Lorton | 0.22% | 0.063%(+0.159)#66 | 0.040%(+0.182)#1,433 |
| 32. | Woodburn | 0.21% | 0.063%(+0.148)#67 | 0.040%(+0.171)#1,434 |
| 33. | Merrifield | 0.21% | 0.063%(+0.148)#68 | 0.040%(+0.171)#1,435 |
| 34. | Laurel Hill | 0.20% | 0.063%(+0.141)#69 | 0.040%(+0.164)#1,436 |
| 35. | Short Pump | 0.20% | 0.063%(+0.138)#70 | 0.040%(+0.161)#1,437 |
| 36. | Kingstowne | 0.19% | 0.063%(+0.124)#71 | 0.040%(+0.146)#1,438 |
| 37. | Idylwood | 0.18% | 0.063%(+0.117)#72 | 0.040%(+0.140)#1,439 |
| 38. | Fair Lakes | 0.18% | 0.063%(+0.116)#73 | 0.040%(+0.139)#1,440 |
| 39. | Newington Forest | 0.17% | 0.063%(+0.111)#74 | 0.040%(+0.134)#1,441 |
| 40. | Stanley | 0.17% | 0.063%(+0.103)#75 | 0.040%(+0.125)#1,442 |
| 41. | Wyndham | 0.17% | 0.063%(+0.102)#76 | 0.040%(+0.125)#1,443 |
| 42. | Dranesville | 0.16% | 0.063%(+0.102)#77 | 0.040%(+0.124)#1,444 |
| 43. | Lovettsville | 0.15% | 0.063%(+0.087)#78 | 0.040%(+0.110)#1,445 |
| 44. | Springfield | 0.15% | 0.063%(+0.085)#79 | 0.040%(+0.108)#1,446 |
| 45. | Leesylvania | 0.14% | 0.063%(+0.082)#80 | 0.040%(+0.105)#1,447 |
| 46. | Farmville | 0.14% | 0.063%(+0.081)#81 | 0.040%(+0.104)#1,448 |
| 47. | Lowes Island | 0.14% | 0.063%(+0.079)#82 | 0.040%(+0.102)#1,449 |
| 48. | Woodlake | 0.13% | 0.063%(+0.069)#83 | 0.040%(+0.092)#1,450 |
| 49. | South Run | 0.13% | 0.063%(+0.067)#84 | 0.040%(+0.090)#1,451 |
| 50. | Woodbridge | 0.12% | 0.063%(+0.059)#85 | 0.040%(+0.082)#1,452 |
| 51. | Manassas | 0.12% | 0.063%(+0.059)#86 | 0.040%(+0.082)#1,453 |
| 52. | Arlington | 0.12% | 0.063%(+0.057)#87 | 0.040%(+0.080)#1,454 |
| 53. | Centreville | 0.12% | 0.063%(+0.054)#88 | 0.040%(+0.077)#1,455 |
| 54. | Lake Barcroft | 0.11% | 0.063%(+0.050)#89 | 0.040%(+0.073)#1,456 |
| 55. | Hybla Valley | 0.11% | 0.063%(+0.048)#90 | 0.040%(+0.070)#1,457 |
| 56. | Bridgewater | 0.11% | 0.063%(+0.044)#91 | 0.040%(+0.066)#1,458 |
| 57. | Linton Hall | 0.11% | 0.063%(+0.042)#92 | 0.040%(+0.065)#1,459 |
| 58. | Bon Air | 0.10% | 0.063%(+0.040)#93 | 0.040%(+0.063)#1,460 |
| 59. | Reston | 0.10% | 0.063%(+0.038)#94 | 0.040%(+0.061)#1,461 |
| 60. | South Boston | 0.10% | 0.063%(+0.038)#95 | 0.040%(+0.061)#1,462 |
| 61. | Tuckahoe | 0.089% | 0.063%(+0.027)#96 | 0.040%(+0.049)#1,463 |
| 62. | Oakton | 0.088% | 0.063%(+0.025)#97 | 0.040%(+0.047)#1,464 |
| 63. | Burke Centre | 0.084% | 0.063%(+0.021)#98 | 0.040%(+0.044)#1,465 |
| 64. | Mount Vernon | 0.083% | 0.063%(+0.020)#99 | 0.040%(+0.043)#1,466 |
| 65. | Williamsburg | 0.077% | 0.063%(+0.015)#100 | 0.040%(+0.037)#1,467 |
| 66. | Great Falls | 0.073% | 0.063%(+0.011)#101 | 0.040%(+0.033)#1,468 |
| 67. | Falls Church | 0.069% | 0.063%(+0.006)#102 | 0.040%(+0.028)#1,469 |
| 68. | West Springfield | 0.064% | 0.063%(+0.001)#103 | 0.040%(+0.024)#1,470 |
| 69. | Alexandria | 0.062% | 0.063%(-0.001)#104 | 0.040%(+0.022)#1,515 |
| 70. | Ashburn | 0.059% | 0.063%(-0.004)#105 | 0.040%(+0.019)#1,516 |
| 71. | Gainesville | 0.053% | 0.063%(-0.010)#106 | 0.040%(+0.013)#1,517 |
| 72. | Franklin Farm | 0.053% | 0.063%(-0.010)#107 | 0.040%(+0.013)#1,518 |
| 73. | West Falls Church | 0.051% | 0.063%(-0.012)#108 | 0.040%(+0.011)#1,519 |
| 74. | Fair Oaks | 0.048% | 0.063%(-0.015)#109 | 0.040%(+0.008)#1,520 |
| 75. | Laurel | 0.043% | 0.063%(-0.020)#110 | 0.040%(+0.003)#1,521 |
| 76. | Charlottesville | 0.043% | 0.063%(-0.020)#111 | 0.040%(+0.003)#1,522 |
| 77. | Cascades | 0.040% | 0.063%(-0.023)#112 | 0.040%(-0.000)#1,523 |
| 78. | Lynchburg | 0.037% | 0.063%(-0.026)#113 | 0.040%(-0.004)#1,524 |
| 79. | Virginia Beach | 0.036% | 0.063%(-0.027)#114 | 0.040%(-0.004)#1,525 |
| 80. | Chesapeake | 0.028% | 0.063%(-0.034)#115 | 0.040%(-0.012)#1,526 |
| 81. | Rose Hill Cdp Fairfax County | 0.028% | 0.063%(-0.035)#116 | 0.040%(-0.012)#1,527 |
| 82. | Leesburg | 0.025% | 0.063%(-0.038)#117 | 0.040%(-0.015)#1,528 |
| 83. | Roanoke | 0.015% | 0.063%(-0.048)#118 | 0.040%(-0.025)#1,529 |
| 84. | Richmond | 0.015% | 0.063%(-0.048)#119 | 0.040%(-0.026)#1,567 |
| 85. | Norfolk | 0.012% | 0.063%(-0.051)#120 | 0.040%(-0.028)#1,571 |
Common Questions
What are the Top 10 Cities with the Highest Percentage of Immigrants from Lebanon in Virginia?
Top 10 Cities with the Highest Percentage of Immigrants from Lebanon in Virginia are:
#1
13.97%
#2
1.89%
#3
1.85%
#4
1.28%
#5
1.11%
#6
0.74%
#7
0.65%
#8
0.64%
#9
0.54%
#10
0.52%
What city has the Highest Percentage of Immigrants from Lebanon in Virginia?
Vansant has the Highest Percentage of Immigrants from Lebanon in Virginia with 13.97%.
What is the Percentage of Immigrants from Lebanon in the State of Virginia?
Percentage of Immigrants from Lebanon in Virginia is 0.063%.
What is the Percentage of Immigrants from Lebanon in the United States?
Percentage of Immigrants from Lebanon in the United States is 0.040%.