Cities with the Most Immigrants from Kenya in Virginia
RELATED REPORTS & OPTIONS
Kenya
Virginia
Compare Cities
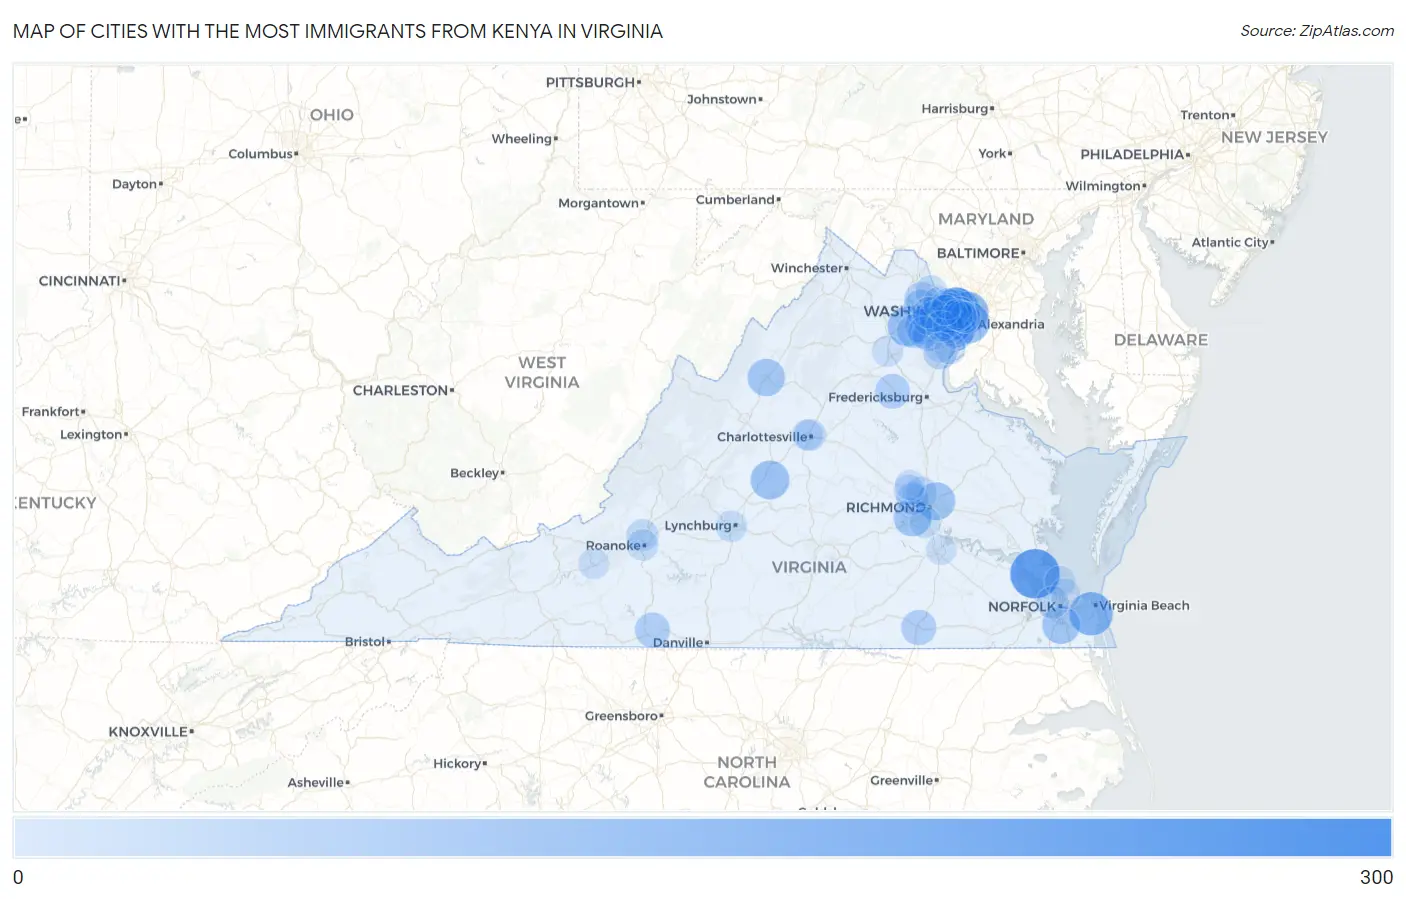
Map of Cities with the Most Immigrants from Kenya in Virginia
0
300
Cities with the Most Immigrants from Kenya in Virginia
| City | Kenya | vs State | vs National | |
| 1. | Woodlawn Cdp Fairfax County | 299 | 3,799(7.87%)#1 | 158,590(0.19%)#88 |
| 2. | Newport News | 246 | 3,799(6.48%)#2 | 158,590(0.16%)#115 |
| 3. | Idylwood | 212 | 3,799(5.58%)#3 | 158,590(0.13%)#137 |
| 4. | Virginia Beach | 166 | 3,799(4.37%)#4 | 158,590(0.10%)#190 |
| 5. | Arlington | 143 | 3,799(3.76%)#5 | 158,590(0.09%)#229 |
| 6. | Alexandria | 141 | 3,799(3.71%)#6 | 158,590(0.09%)#233 |
| 7. | Fair Oaks | 124 | 3,799(3.26%)#7 | 158,590(0.08%)#258 |
| 8. | Annandale | 122 | 3,799(3.21%)#8 | 158,590(0.08%)#263 |
| 9. | Gainesville | 119 | 3,799(3.13%)#9 | 158,590(0.08%)#272 |
| 10. | Shipman | 107 | 3,799(2.82%)#10 | 158,590(0.07%)#296 |
| 11. | Chesapeake | 97 | 3,799(2.55%)#11 | 158,590(0.06%)#316 |
| 12. | East Highland Park | 97 | 3,799(2.55%)#12 | 158,590(0.06%)#317 |
| 13. | Rockwood | 96 | 3,799(2.53%)#13 | 158,590(0.06%)#322 |
| 14. | Harrisonburg | 90 | 3,799(2.37%)#14 | 158,590(0.06%)#339 |
| 15. | Springfield | 87 | 3,799(2.29%)#15 | 158,590(0.05%)#350 |
| 16. | Tysons | 71 | 3,799(1.87%)#16 | 158,590(0.04%)#400 |
| 17. | Mclean | 70 | 3,799(1.84%)#17 | 158,590(0.04%)#403 |
| 18. | South Riding | 67 | 3,799(1.76%)#18 | 158,590(0.04%)#424 |
| 19. | West Springfield | 66 | 3,799(1.74%)#19 | 158,590(0.04%)#427 |
| 20. | Sudley | 61 | 3,799(1.61%)#20 | 158,590(0.04%)#461 |
| 21. | Martinsville | 60 | 3,799(1.58%)#21 | 158,590(0.04%)#467 |
| 22. | Emporia | 60 | 3,799(1.58%)#22 | 158,590(0.04%)#469 |
| 23. | Lake Of The Woods | 58 | 3,799(1.53%)#23 | 158,590(0.04%)#481 |
| 24. | Vienna | 51 | 3,799(1.34%)#24 | 158,590(0.03%)#531 |
| 25. | Linton Hall | 46 | 3,799(1.21%)#25 | 158,590(0.03%)#568 |
| 26. | Montclair | 43 | 3,799(1.13%)#26 | 158,590(0.03%)#595 |
| 27. | Loudoun Valley Estates | 43 | 3,799(1.13%)#27 | 158,590(0.03%)#599 |
| 28. | Woodburn | 42 | 3,799(1.11%)#28 | 158,590(0.03%)#612 |
| 29. | Kings Park West | 39 | 3,799(1.03%)#29 | 158,590(0.02%)#650 |
| 30. | Buckhall | 35 | 3,799(0.92%)#30 | 158,590(0.02%)#701 |
| 31. | Portsmouth | 28 | 3,799(0.74%)#31 | 158,590(0.02%)#783 |
| 32. | Centreville | 28 | 3,799(0.74%)#32 | 158,590(0.02%)#788 |
| 33. | Tuckahoe | 28 | 3,799(0.74%)#33 | 158,590(0.02%)#792 |
| 34. | Newington | 27 | 3,799(0.71%)#34 | 158,590(0.02%)#816 |
| 35. | Manassas | 26 | 3,799(0.68%)#35 | 158,590(0.02%)#830 |
| 36. | Charlottesville | 24 | 3,799(0.63%)#36 | 158,590(0.02%)#863 |
| 37. | Hollins | 23 | 3,799(0.61%)#37 | 158,590(0.01%)#887 |
| 38. | Merrifield | 21 | 3,799(0.55%)#38 | 158,590(0.01%)#918 |
| 39. | Dulles Town Center | 21 | 3,799(0.55%)#39 | 158,590(0.01%)#925 |
| 40. | Long Branch | 20 | 3,799(0.53%)#40 | 158,590(0.01%)#941 |
| 41. | Fair Lakes | 19 | 3,799(0.50%)#41 | 158,590(0.01%)#968 |
| 42. | Laurel | 18 | 3,799(0.47%)#42 | 158,590(0.01%)#986 |
| 43. | Roanoke | 17 | 3,799(0.45%)#43 | 158,590(0.01%)#1,001 |
| 44. | Leesylvania | 16 | 3,799(0.42%)#44 | 158,590(0.01%)#1,051 |
| 45. | Reston | 15 | 3,799(0.39%)#45 | 158,590(0.01%)#1,068 |
| 46. | Falls Church | 15 | 3,799(0.39%)#46 | 158,590(0.01%)#1,080 |
| 47. | Lynchburg | 14 | 3,799(0.37%)#47 | 158,590(0.01%)#1,098 |
| 48. | Chantilly | 14 | 3,799(0.37%)#48 | 158,590(0.01%)#1,109 |
| 49. | Meadowbrook | 13 | 3,799(0.34%)#49 | 158,590(0.01%)#1,135 |
| 50. | Woodbridge | 12 | 3,799(0.32%)#50 | 158,590(0.01%)#1,160 |
| 51. | Opal | 12 | 3,799(0.32%)#51 | 158,590(0.01%)#1,181 |
| 52. | Burke | 11 | 3,799(0.29%)#52 | 158,590(0.01%)#1,190 |
| 53. | Christiansburg | 11 | 3,799(0.29%)#53 | 158,590(0.01%)#1,196 |
| 54. | Bailey S Crossroads | 10 | 3,799(0.26%)#54 | 158,590(0.01%)#1,226 |
| 55. | University Of Virginia | 10 | 3,799(0.26%)#55 | 158,590(0.01%)#1,230 |
| 56. | Hampton | 9 | 3,799(0.24%)#56 | 158,590(0.01%)#1,240 |
| 57. | Short Pump | 9 | 3,799(0.24%)#57 | 158,590(0.01%)#1,251 |
| 58. | Norfolk | 8 | 3,799(0.21%)#58 | 158,590(0.01%)#1,268 |
| 59. | Wolf Trap | 8 | 3,799(0.21%)#59 | 158,590(0.01%)#1,289 |
| 60. | Fairfax Station | 8 | 3,799(0.21%)#60 | 158,590(0.01%)#1,291 |
| 61. | Lake Barcroft | 8 | 3,799(0.21%)#61 | 158,590(0.01%)#1,294 |
| 62. | Moorefield | 8 | 3,799(0.21%)#62 | 158,590(0.01%)#1,298 |
| 63. | West Falls Church | 7 | 3,799(0.18%)#63 | 158,590(0.00%)#1,323 |
| 64. | Wyndham | 7 | 3,799(0.18%)#64 | 158,590(0.00%)#1,340 |
| 65. | Difficult Run | 6 | 3,799(0.16%)#65 | 158,590(0.00%)#1,385 |
| 66. | Dale City | 4 | 3,799(0.11%)#66 | 158,590(0.00%)#1,427 |
| 67. | Oakton | 3 | 3,799(0.08%)#67 | 158,590(0.00%)#1,454 |
| 68. | Fort Lee | 3 | 3,799(0.08%)#68 | 158,590(0.00%)#1,462 |
Common Questions
What are the Top 10 Cities with the Most Immigrants from Kenya in Virginia?
Top 10 Cities with the Most Immigrants from Kenya in Virginia are:
#1
246
#2
212
#3
166
#4
143
#5
141
#6
124
#7
122
#8
119
#9
107
#10
97
What city has the Most Immigrants from Kenya in Virginia?
Newport News has the Most Immigrants from Kenya in Virginia with 246.
What is the Total Immigrants from Kenya in the State of Virginia?
Total Immigrants from Kenya in Virginia is 3,799.
What is the Total Immigrants from Kenya in the United States?
Total Immigrants from Kenya in the United States is 158,590.