Cities with the Highest Percentage of Immigrants from El Salvador in Virginia
RELATED REPORTS & OPTIONS
El Salvador
Virginia
Compare Cities
Map of Cities with the Highest Percentage of Immigrants from El Salvador in Virginia
0.00%
20.00%
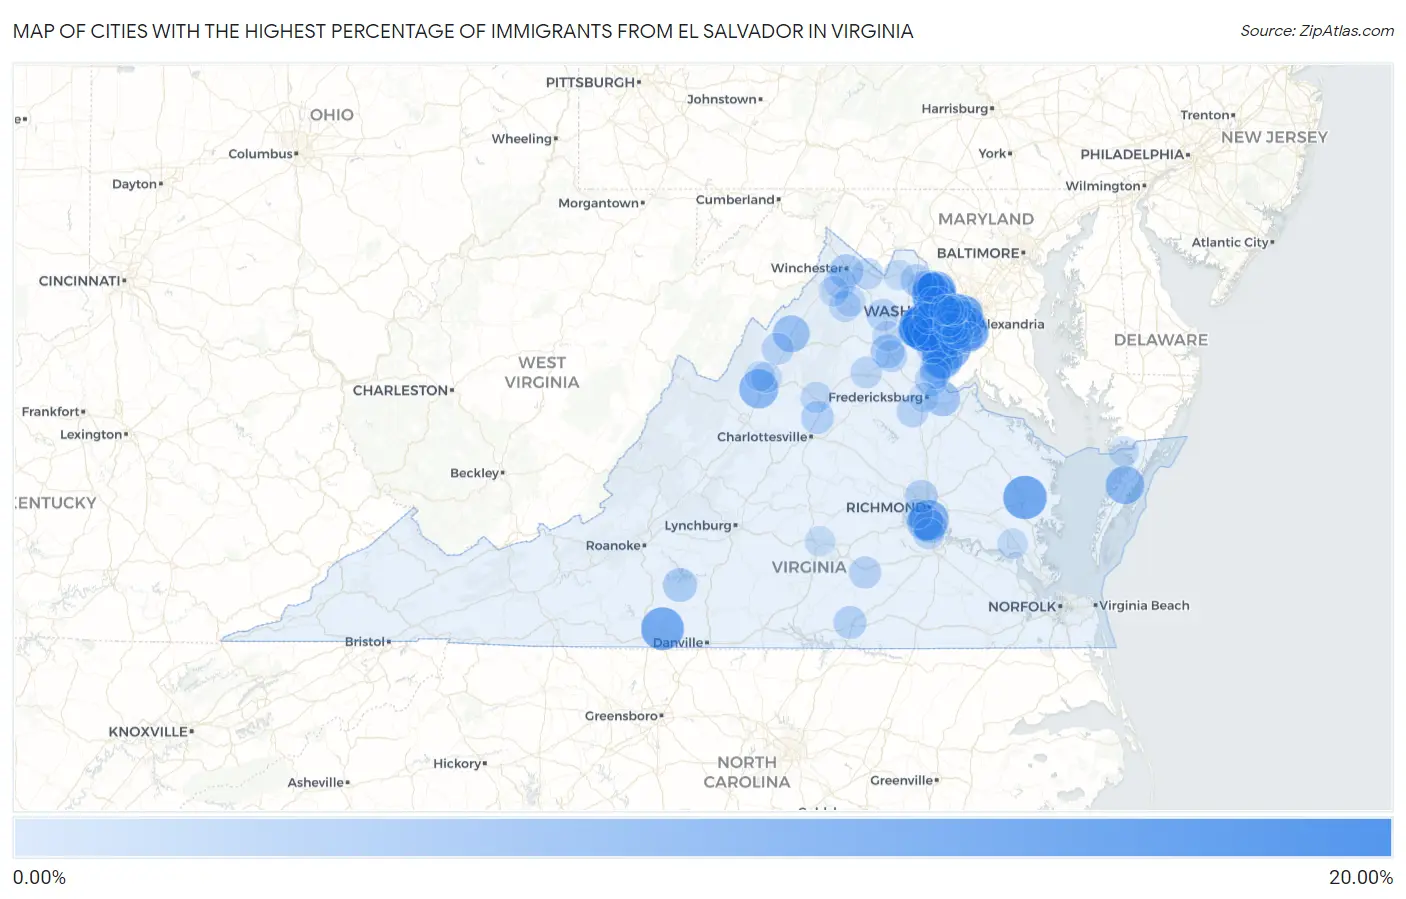
Cities with the Highest Percentage of Immigrants from El Salvador in Virginia
| City | El Salvador | vs State | vs National | |
| 1. | Yorkshire | 19.89% | 1.25%(+18.6)#-1 | 0.43%(+19.5)#0 |
| 2. | Loch Lomond | 17.42% | 1.25%(+16.2)#0 | 0.43%(+17.0)#1 |
| 3. | Hutchison | 16.63% | 1.25%(+15.4)#1 | 0.43%(+16.2)#2 |
| 4. | Saluda | 13.85% | 1.25%(+12.6)#2 | 0.43%(+13.4)#3 |
| 5. | Sterling | 13.80% | 1.25%(+12.6)#3 | 0.43%(+13.4)#4 |
| 6. | Woodlawn Cdp Fairfax County | 13.69% | 1.25%(+12.4)#21 | 0.43%(+13.3)#787 |
| 7. | Bull Run | 13.33% | 1.25%(+12.1)#31 | 0.43%(+12.9)#1,070 |
| 8. | Laurel Park | 13.29% | 1.25%(+12.0)#32 | 0.43%(+12.9)#1,071 |
| 9. | Herndon | 13.09% | 1.25%(+11.8)#33 | 0.43%(+12.7)#1,072 |
| 10. | Woodbridge | 11.49% | 1.25%(+10.2)#50 | 0.43%(+11.1)#1,395 |
| 11. | Sudley | 11.27% | 1.25%(+10.0)#51 | 0.43%(+10.8)#1,396 |
| 12. | Dumfries | 10.85% | 1.25%(+9.60)#52 | 0.43%(+10.4)#1,397 |
| 13. | Bensley | 10.64% | 1.25%(+9.40)#53 | 0.43%(+10.2)#1,398 |
| 14. | Seven Corners | 10.62% | 1.25%(+9.38)#54 | 0.43%(+10.2)#1,399 |
| 15. | Sugarland Run | 10.23% | 1.25%(+8.98)#55 | 0.43%(+9.80)#1,400 |
| 16. | Mount Crawford | 9.63% | 1.25%(+8.38)#56 | 0.43%(+9.20)#1,401 |
| 17. | Dale City | 9.17% | 1.25%(+7.92)#57 | 0.43%(+8.74)#1,546 |
| 18. | Onley | 8.99% | 1.25%(+7.75)#58 | 0.43%(+8.57)#1,547 |
| 19. | Manassas | 8.64% | 1.25%(+7.39)#59 | 0.43%(+8.21)#1,548 |
| 20. | Groveton | 8.38% | 1.25%(+7.13)#60 | 0.43%(+7.95)#1,549 |
| 21. | Hybla Valley | 7.85% | 1.25%(+6.60)#61 | 0.43%(+7.42)#1,550 |
| 22. | Mount Jackson | 7.26% | 1.25%(+6.01)#62 | 0.43%(+6.83)#1,551 |
| 23. | Meadowbrook | 7.02% | 1.25%(+5.77)#63 | 0.43%(+6.59)#1,552 |
| 24. | Manassas Park | 6.89% | 1.25%(+5.64)#64 | 0.43%(+6.46)#1,553 |
| 25. | Dulles Town Center | 6.65% | 1.25%(+5.40)#65 | 0.43%(+6.22)#1,554 |
| 26. | Mcgaheysville | 6.20% | 1.25%(+4.96)#66 | 0.43%(+5.78)#1,555 |
| 27. | Passapatanzy | 5.84% | 1.25%(+4.59)#67 | 0.43%(+5.42)#1,556 |
| 28. | Annandale | 5.68% | 1.25%(+4.43)#68 | 0.43%(+5.26)#1,557 |
| 29. | West Falls Church | 5.24% | 1.25%(+3.99)#69 | 0.43%(+4.81)#1,558 |
| 30. | Idylwood | 4.80% | 1.25%(+3.55)#70 | 0.43%(+4.37)#1,559 |
| 31. | Winchester | 4.64% | 1.25%(+3.40)#71 | 0.43%(+4.22)#1,560 |
| 32. | Penhook | 4.60% | 1.25%(+3.36)#72 | 0.43%(+4.18)#1,561 |
| 33. | Triangle | 4.28% | 1.25%(+3.03)#73 | 0.43%(+3.86)#1,562 |
| 34. | Bellwood | 4.25% | 1.25%(+3.01)#74 | 0.43%(+3.83)#1,563 |
| 35. | Bailey S Crossroads | 4.24% | 1.25%(+2.99)#75 | 0.43%(+3.81)#1,564 |
| 36. | Opal | 4.23% | 1.25%(+2.99)#76 | 0.43%(+3.81)#1,565 |
| 37. | Dumbarton | 3.66% | 1.25%(+2.42)#77 | 0.43%(+3.24)#1,566 |
| 38. | Newington Forest | 3.65% | 1.25%(+2.41)#78 | 0.43%(+3.23)#1,567 |
| 39. | South Hill | 3.63% | 1.25%(+2.38)#79 | 0.43%(+3.20)#1,568 |
| 40. | Greenbriar | 3.59% | 1.25%(+2.34)#80 | 0.43%(+3.16)#1,569 |
| 41. | Piney Mountain | 3.56% | 1.25%(+2.31)#81 | 0.43%(+3.14)#1,570 |
| 42. | Fairfax | 3.54% | 1.25%(+2.29)#82 | 0.43%(+3.11)#1,571 |
| 43. | Lake Ridge | 3.46% | 1.25%(+2.21)#83 | 0.43%(+3.04)#1,578 |
| 44. | Boswell S Corner | 3.46% | 1.25%(+2.21)#84 | 0.43%(+3.03)#1,579 |
| 45. | Stafford Courthouse | 3.36% | 1.25%(+2.12)#85 | 0.43%(+2.94)#1,580 |
| 46. | Independent Hill | 3.08% | 1.25%(+1.84)#86 | 0.43%(+2.66)#1,581 |
| 47. | University Center | 3.08% | 1.25%(+1.83)#87 | 0.43%(+2.65)#1,582 |
| 48. | Spotsylvania Courthouse | 2.92% | 1.25%(+1.67)#88 | 0.43%(+2.49)#1,583 |
| 49. | Blackstone | 2.91% | 1.25%(+1.67)#89 | 0.43%(+2.49)#1,584 |
| 50. | Springfield | 2.83% | 1.25%(+1.59)#90 | 0.43%(+2.41)#1,585 |
| 51. | Buckhall | 2.83% | 1.25%(+1.58)#91 | 0.43%(+2.41)#1,586 |
| 52. | Marshall | 2.80% | 1.25%(+1.56)#92 | 0.43%(+2.38)#1,587 |
| 53. | Timberville | 2.80% | 1.25%(+1.55)#93 | 0.43%(+2.37)#1,588 |
| 54. | Huntington | 2.78% | 1.25%(+1.53)#94 | 0.43%(+2.36)#1,589 |
| 55. | Alexandria | 2.76% | 1.25%(+1.51)#95 | 0.43%(+2.33)#1,762 |
| 56. | Stephens City | 2.75% | 1.25%(+1.51)#96 | 0.43%(+2.33)#1,763 |
| 57. | Sully Square | 2.73% | 1.25%(+1.49)#97 | 0.43%(+2.31)#1,764 |
| 58. | Lake Barcroft | 2.71% | 1.25%(+1.46)#98 | 0.43%(+2.28)#1,765 |
| 59. | Leesburg | 2.70% | 1.25%(+1.45)#99 | 0.43%(+2.28)#1,766 |
| 60. | Bealeton | 2.70% | 1.25%(+1.45)#100 | 0.43%(+2.27)#1,767 |
| 61. | Reston | 2.54% | 1.25%(+1.29)#101 | 0.43%(+2.11)#1,768 |
| 62. | Chantilly | 2.54% | 1.25%(+1.29)#102 | 0.43%(+2.11)#1,769 |
| 63. | Leesylvania | 2.53% | 1.25%(+1.29)#103 | 0.43%(+2.11)#1,770 |
| 64. | Culpeper | 2.44% | 1.25%(+1.20)#104 | 0.43%(+2.02)#1,771 |
| 65. | Rose Hill Cdp Fairfax County | 2.38% | 1.25%(+1.13)#105 | 0.43%(+1.96)#1,772 |
| 66. | Lincolnia | 2.37% | 1.25%(+1.12)#106 | 0.43%(+1.94)#1,773 |
| 67. | North Springfield | 2.30% | 1.25%(+1.05)#107 | 0.43%(+1.87)#1,774 |
| 68. | Front Royal | 2.25% | 1.25%(+1.00)#108 | 0.43%(+1.83)#1,775 |
| 69. | Lorton | 2.20% | 1.25%(+0.953)#109 | 0.43%(+1.77)#1,776 |
| 70. | Arlington | 2.16% | 1.25%(+0.909)#110 | 0.43%(+1.73)#1,777 |
| 71. | Berryville | 2.09% | 1.25%(+0.841)#111 | 0.43%(+1.66)#1,778 |
| 72. | Mount Vernon | 2.05% | 1.25%(+0.806)#112 | 0.43%(+1.63)#1,779 |
| 73. | Stanardsville | 2.03% | 1.25%(+0.786)#113 | 0.43%(+1.61)#1,780 |
| 74. | Chester | 1.96% | 1.25%(+0.717)#114 | 0.43%(+1.54)#1,781 |
| 75. | Linton Hall | 1.89% | 1.25%(+0.641)#115 | 0.43%(+1.46)#1,782 |
| 76. | Harrisonburg | 1.77% | 1.25%(+0.522)#116 | 0.43%(+1.34)#1,783 |
| 77. | Merrifield | 1.76% | 1.25%(+0.510)#117 | 0.43%(+1.33)#1,784 |
| 78. | West Springfield | 1.75% | 1.25%(+0.499)#118 | 0.43%(+1.32)#1,785 |
| 79. | Belmont | 1.71% | 1.25%(+0.462)#119 | 0.43%(+1.28)#1,786 |
| 80. | Centreville | 1.70% | 1.25%(+0.458)#120 | 0.43%(+1.28)#1,787 |
| 81. | Aquia Harbour | 1.68% | 1.25%(+0.437)#121 | 0.43%(+1.26)#1,788 |
| 82. | Shenandoah Shores | 1.59% | 1.25%(+0.347)#122 | 0.43%(+1.17)#1,789 |
| 83. | Mcnair | 1.56% | 1.25%(+0.313)#123 | 0.43%(+1.13)#1,790 |
| 84. | Countryside | 1.52% | 1.25%(+0.277)#124 | 0.43%(+1.10)#1,791 |
| 85. | Warrenton | 1.52% | 1.25%(+0.276)#125 | 0.43%(+1.10)#1,792 |
| 86. | Newington | 1.47% | 1.25%(+0.228)#126 | 0.43%(+1.05)#1,793 |
| 87. | Burke | 1.47% | 1.25%(+0.221)#127 | 0.43%(+1.04)#1,794 |
| 88. | Williamsburg | 1.45% | 1.25%(+0.206)#128 | 0.43%(+1.03)#1,795 |
| 89. | Middletown | 1.41% | 1.25%(+0.165)#129 | 0.43%(+0.987)#1,796 |
| 90. | Long Branch | 1.39% | 1.25%(+0.142)#130 | 0.43%(+0.963)#1,797 |
| 91. | Pimmit Hills | 1.35% | 1.25%(+0.107)#131 | 0.43%(+0.928)#1,798 |
| 92. | Belmont Estates | 1.34% | 1.25%(+0.095)#132 | 0.43%(+0.917)#1,799 |
| 93. | Dunn Loring | 1.27% | 1.25%(+0.028)#133 | 0.43%(+0.849)#1,800 |
| 94. | Vienna | 1.24% | 1.25%(-0.003)#134 | 0.43%(+0.818)#1,801 |
| 95. | Purcellville | 1.24% | 1.25%(-0.004)#135 | 0.43%(+0.818)#1,802 |
| 96. | Oakton | 1.23% | 1.25%(-0.012)#136 | 0.43%(+0.809)#1,803 |
| 97. | Saxis | 1.17% | 1.25%(-0.075)#137 | 0.43%(+0.747)#1,804 |
| 98. | Farmville | 1.15% | 1.25%(-0.096)#138 | 0.43%(+0.725)#1,805 |
| 99. | Manchester | 1.09% | 1.25%(-0.157)#139 | 0.43%(+0.664)#1,806 |
| 100. | Fredericksburg | 1.07% | 1.25%(-0.178)#140 | 0.43%(+0.643)#1,807 |
Common Questions
What are the Top 10 Cities with the Highest Percentage of Immigrants from El Salvador in Virginia?
Top 10 Cities with the Highest Percentage of Immigrants from El Salvador in Virginia are:
#1
19.89%
#2
17.42%
#3
13.85%
#4
13.80%
#5
13.33%
#6
13.29%
#7
13.09%
#8
11.49%
#9
11.27%
#10
10.85%
What city has the Highest Percentage of Immigrants from El Salvador in Virginia?
Yorkshire has the Highest Percentage of Immigrants from El Salvador in Virginia with 19.89%.
What is the Percentage of Immigrants from El Salvador in the State of Virginia?
Percentage of Immigrants from El Salvador in Virginia is 1.25%.
What is the Percentage of Immigrants from El Salvador in the United States?
Percentage of Immigrants from El Salvador in the United States is 0.43%.