Cities with the Highest Percentage of Immigrants from Pakistan in Virginia
RELATED REPORTS & OPTIONS
Pakistan
Virginia
Compare Cities
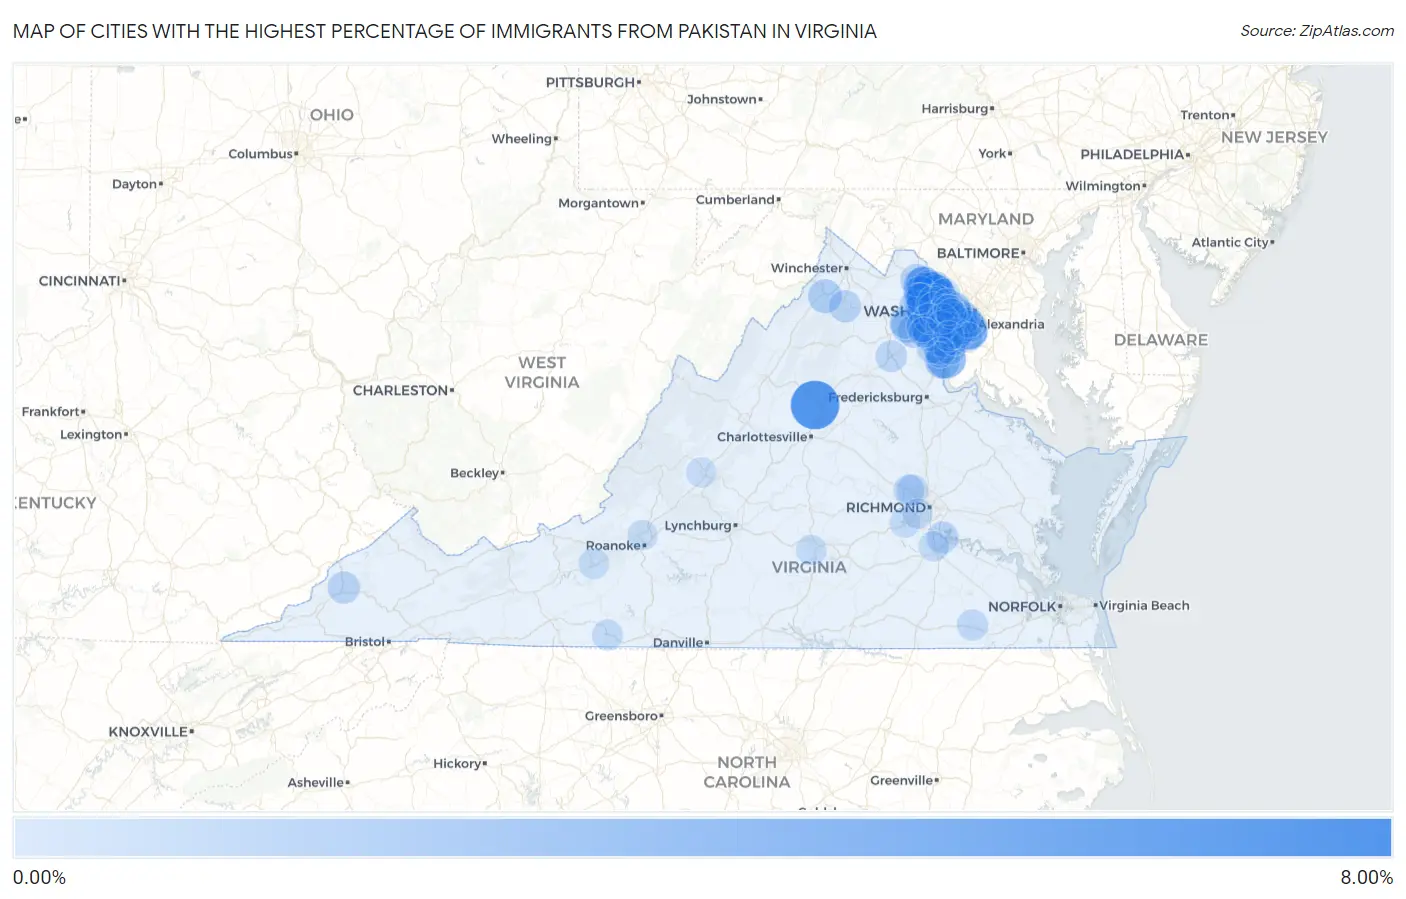
Map of Cities with the Highest Percentage of Immigrants from Pakistan in Virginia
0.00%
8.00%
Cities with the Highest Percentage of Immigrants from Pakistan in Virginia
| City | Pakistan | vs State | vs National | |
| 1. | Oak Grove | 7.07% | 0.29%(+6.78)#-1 | 0.12%(+6.95)#0 |
| 2. | Twin Lakes | 6.70% | 0.29%(+6.41)#0 | 0.12%(+6.58)#1 |
| 3. | Union Mill | 4.93% | 0.29%(+4.64)#1 | 0.12%(+4.81)#2 |
| 4. | Cherry Hill | 3.38% | 0.29%(+3.09)#2 | 0.12%(+3.26)#3 |
| 5. | Chantilly | 3.33% | 0.29%(+3.05)#3 | 0.12%(+3.21)#21 |
| 6. | Springfield | 3.23% | 0.29%(+2.94)#33 | 0.12%(+3.11)#234 |
| 7. | Groveton | 3.01% | 0.29%(+2.72)#34 | 0.12%(+2.89)#235 |
| 8. | Belmont | 2.91% | 0.29%(+2.63)#35 | 0.12%(+2.79)#236 |
| 9. | Dulles Town Center | 2.75% | 0.29%(+2.47)#36 | 0.12%(+2.63)#237 |
| 10. | Sterling | 2.71% | 0.29%(+2.43)#37 | 0.12%(+2.60)#238 |
| 11. | Ashburn | 2.46% | 0.29%(+2.18)#38 | 0.12%(+2.34)#283 |
| 12. | Lansdowne | 1.87% | 0.29%(+1.58)#39 | 0.12%(+1.75)#284 |
| 13. | Triangle | 1.86% | 0.29%(+1.57)#40 | 0.12%(+1.74)#285 |
| 14. | Goose Creek | 1.84% | 0.29%(+1.56)#41 | 0.12%(+1.72)#286 |
| 15. | Cascades | 1.82% | 0.29%(+1.53)#44 | 0.12%(+1.70)#338 |
| 16. | Hybla Valley | 1.66% | 0.29%(+1.37)#45 | 0.12%(+1.54)#339 |
| 17. | Dale City | 1.66% | 0.29%(+1.37)#46 | 0.12%(+1.54)#340 |
| 18. | Loch Lomond | 1.64% | 0.29%(+1.35)#47 | 0.12%(+1.52)#341 |
| 19. | Yorkshire | 1.55% | 0.29%(+1.27)#48 | 0.12%(+1.43)#342 |
| 20. | Stone Ridge | 1.49% | 0.29%(+1.20)#49 | 0.12%(+1.37)#343 |
| 21. | Strasburg | 1.48% | 0.29%(+1.19)#50 | 0.12%(+1.36)#344 |
| 22. | Gainesville | 1.43% | 0.29%(+1.15)#51 | 0.12%(+1.31)#345 |
| 23. | West Springfield | 1.33% | 0.29%(+1.05)#74 | 0.12%(+1.21)#857 |
| 24. | Mantua | 1.33% | 0.29%(+1.04)#75 | 0.12%(+1.21)#858 |
| 25. | Sugarland Run | 1.27% | 0.29%(+0.987)#76 | 0.12%(+1.15)#859 |
| 26. | Broadlands | 1.23% | 0.29%(+0.943)#77 | 0.12%(+1.11)#860 |
| 27. | Reston | 1.20% | 0.29%(+0.918)#78 | 0.12%(+1.08)#921 |
| 28. | Linton Hall | 1.15% | 0.29%(+0.867)#79 | 0.12%(+1.03)#922 |
| 29. | Haymarket | 1.15% | 0.29%(+0.860)#80 | 0.12%(+1.03)#923 |
| 30. | Rose Hill Cdp Fairfax County | 1.13% | 0.29%(+0.847)#81 | 0.12%(+1.01)#924 |
| 31. | Lincolnia | 1.11% | 0.29%(+0.825)#82 | 0.12%(+0.991)#925 |
| 32. | Floris | 1.11% | 0.29%(+0.821)#83 | 0.12%(+0.987)#926 |
| 33. | County Center | 0.99% | 0.29%(+0.709)#84 | 0.12%(+0.875)#927 |
| 34. | Wise | 0.98% | 0.29%(+0.694)#85 | 0.12%(+0.860)#928 |
| 35. | Woodlawn Cdp Fairfax County | 0.98% | 0.29%(+0.690)#86 | 0.12%(+0.856)#929 |
| 36. | University Center | 0.97% | 0.29%(+0.686)#87 | 0.12%(+0.852)#930 |
| 37. | Greenbriar | 0.97% | 0.29%(+0.684)#88 | 0.12%(+0.850)#931 |
| 38. | Lake Barcroft | 0.95% | 0.29%(+0.669)#89 | 0.12%(+0.835)#932 |
| 39. | South Riding | 0.94% | 0.29%(+0.653)#90 | 0.12%(+0.819)#933 |
| 40. | Leesburg | 0.93% | 0.29%(+0.646)#91 | 0.12%(+0.812)#934 |
| 41. | Laurel Hill | 0.91% | 0.29%(+0.628)#92 | 0.12%(+0.794)#935 |
| 42. | Front Royal | 0.89% | 0.29%(+0.605)#93 | 0.12%(+0.771)#936 |
| 43. | Lake Ridge | 0.88% | 0.29%(+0.594)#94 | 0.12%(+0.760)#937 |
| 44. | Herndon | 0.87% | 0.29%(+0.586)#95 | 0.12%(+0.752)#938 |
| 45. | Enon | 0.86% | 0.29%(+0.571)#96 | 0.12%(+0.737)#939 |
| 46. | South Run | 0.85% | 0.29%(+0.565)#97 | 0.12%(+0.731)#940 |
| 47. | Mcnair | 0.84% | 0.29%(+0.553)#98 | 0.12%(+0.719)#941 |
| 48. | Tysons | 0.83% | 0.29%(+0.544)#99 | 0.12%(+0.710)#942 |
| 49. | Manassas Park | 0.82% | 0.29%(+0.538)#100 | 0.12%(+0.704)#943 |
| 50. | Kingstowne | 0.80% | 0.29%(+0.516)#101 | 0.12%(+0.682)#944 |
| 51. | Buckhall | 0.80% | 0.29%(+0.511)#102 | 0.12%(+0.677)#945 |
| 52. | Independent Hill | 0.79% | 0.29%(+0.506)#103 | 0.12%(+0.672)#946 |
| 53. | Sudley | 0.79% | 0.29%(+0.503)#104 | 0.12%(+0.669)#947 |
| 54. | Fair Oaks | 0.75% | 0.29%(+0.466)#105 | 0.12%(+0.633)#948 |
| 55. | Burke Centre | 0.73% | 0.29%(+0.440)#106 | 0.12%(+0.606)#949 |
| 56. | Midlothian | 0.72% | 0.29%(+0.431)#107 | 0.12%(+0.597)#950 |
| 57. | Bealeton | 0.71% | 0.29%(+0.422)#108 | 0.12%(+0.588)#951 |
| 58. | Woodbridge | 0.70% | 0.29%(+0.417)#109 | 0.12%(+0.583)#952 |
| 59. | Franconia | 0.68% | 0.29%(+0.396)#110 | 0.12%(+0.562)#953 |
| 60. | Fair Lakes | 0.67% | 0.29%(+0.388)#111 | 0.12%(+0.554)#954 |
| 61. | Leesylvania | 0.67% | 0.29%(+0.384)#112 | 0.12%(+0.550)#955 |
| 62. | Brambleton | 0.64% | 0.29%(+0.351)#113 | 0.12%(+0.517)#956 |
| 63. | Annandale | 0.62% | 0.29%(+0.334)#114 | 0.12%(+0.500)#957 |
| 64. | Courtland | 0.61% | 0.29%(+0.324)#115 | 0.12%(+0.490)#958 |
| 65. | Pimmit Hills | 0.60% | 0.29%(+0.315)#116 | 0.12%(+0.481)#959 |
| 66. | Lorton | 0.58% | 0.29%(+0.296)#117 | 0.12%(+0.462)#960 |
| 67. | Innsbrook | 0.57% | 0.29%(+0.290)#118 | 0.12%(+0.456)#961 |
| 68. | Short Pump | 0.53% | 0.29%(+0.247)#119 | 0.12%(+0.413)#962 |
| 69. | Stuart | 0.52% | 0.29%(+0.237)#120 | 0.12%(+0.403)#963 |
| 70. | Loudoun Valley Estates | 0.48% | 0.29%(+0.191)#121 | 0.12%(+0.357)#964 |
| 71. | Huntington | 0.47% | 0.29%(+0.189)#122 | 0.12%(+0.355)#965 |
| 72. | Bailey S Crossroads | 0.45% | 0.29%(+0.167)#123 | 0.12%(+0.333)#966 |
| 73. | Franklin Farm | 0.43% | 0.29%(+0.143)#124 | 0.12%(+0.310)#967 |
| 74. | Oakton | 0.43% | 0.29%(+0.142)#125 | 0.12%(+0.308)#968 |
| 75. | Woodburn | 0.42% | 0.29%(+0.137)#126 | 0.12%(+0.303)#969 |
| 76. | Idylwood | 0.42% | 0.29%(+0.131)#127 | 0.12%(+0.297)#970 |
| 77. | Kings Park West | 0.39% | 0.29%(+0.107)#128 | 0.12%(+0.273)#971 |
| 78. | Brandermill | 0.39% | 0.29%(+0.107)#129 | 0.12%(+0.273)#972 |
| 79. | Great Falls | 0.39% | 0.29%(+0.102)#130 | 0.12%(+0.269)#973 |
| 80. | Christiansburg | 0.38% | 0.29%(+0.094)#131 | 0.12%(+0.260)#974 |
| 81. | Newington Forest | 0.36% | 0.29%(+0.079)#132 | 0.12%(+0.245)#975 |
| 82. | Hampden Sydney | 0.36% | 0.29%(+0.077)#133 | 0.12%(+0.243)#976 |
| 83. | Colonial Heights | 0.35% | 0.29%(+0.067)#134 | 0.12%(+0.234)#977 |
| 84. | Wolf Trap | 0.35% | 0.29%(+0.065)#135 | 0.12%(+0.231)#978 |
| 85. | Burke | 0.34% | 0.29%(+0.059)#136 | 0.12%(+0.225)#979 |
| 86. | Centreville | 0.34% | 0.29%(+0.051)#137 | 0.12%(+0.217)#980 |
| 87. | Newington | 0.32% | 0.29%(+0.039)#138 | 0.12%(+0.206)#981 |
| 88. | Alexandria | 0.32% | 0.29%(+0.035)#139 | 0.12%(+0.201)#1,252 |
| 89. | Fairfax Station | 0.31% | 0.29%(+0.024)#140 | 0.12%(+0.191)#1,253 |
| 90. | Montclair | 0.30% | 0.29%(+0.014)#141 | 0.12%(+0.180)#1,254 |
| 91. | George Mason | 0.28% | 0.29%(-0.005)#142 | 0.12%(+0.161)#1,255 |
| 92. | Manchester | 0.28% | 0.29%(-0.008)#143 | 0.12%(+0.158)#1,256 |
| 93. | Lexington | 0.27% | 0.29%(-0.013)#144 | 0.12%(+0.153)#1,257 |
| 94. | Mount Vernon | 0.26% | 0.29%(-0.022)#145 | 0.12%(+0.144)#1,258 |
| 95. | Vienna | 0.26% | 0.29%(-0.023)#146 | 0.12%(+0.143)#1,259 |
| 96. | Merrifield | 0.26% | 0.29%(-0.024)#147 | 0.12%(+0.142)#1,260 |
| 97. | Hollins | 0.26% | 0.29%(-0.029)#148 | 0.12%(+0.137)#1,261 |
| 98. | Navy | 0.25% | 0.29%(-0.038)#149 | 0.12%(+0.128)#1,262 |
| 99. | Manassas | 0.25% | 0.29%(-0.039)#150 | 0.12%(+0.127)#1,263 |
| 100. | Crosspointe | 0.25% | 0.29%(-0.040)#151 | 0.12%(+0.126)#1,264 |
Common Questions
What are the Top 10 Cities with the Highest Percentage of Immigrants from Pakistan in Virginia?
Top 10 Cities with the Highest Percentage of Immigrants from Pakistan in Virginia are:
#1
7.07%
#2
6.70%
#3
3.38%
#4
3.33%
#5
3.23%
#6
3.01%
#7
2.91%
#8
2.75%
#9
2.71%
#10
2.46%
What city has the Highest Percentage of Immigrants from Pakistan in Virginia?
Oak Grove has the Highest Percentage of Immigrants from Pakistan in Virginia with 7.07%.
What is the Percentage of Immigrants from Pakistan in the State of Virginia?
Percentage of Immigrants from Pakistan in Virginia is 0.29%.
What is the Percentage of Immigrants from Pakistan in the United States?
Percentage of Immigrants from Pakistan in the United States is 0.12%.