Cities with the Highest Percentage of Central American Indian Population in Virginia
RELATED REPORTS & OPTIONS
Central American Indian
Virginia
Compare Cities
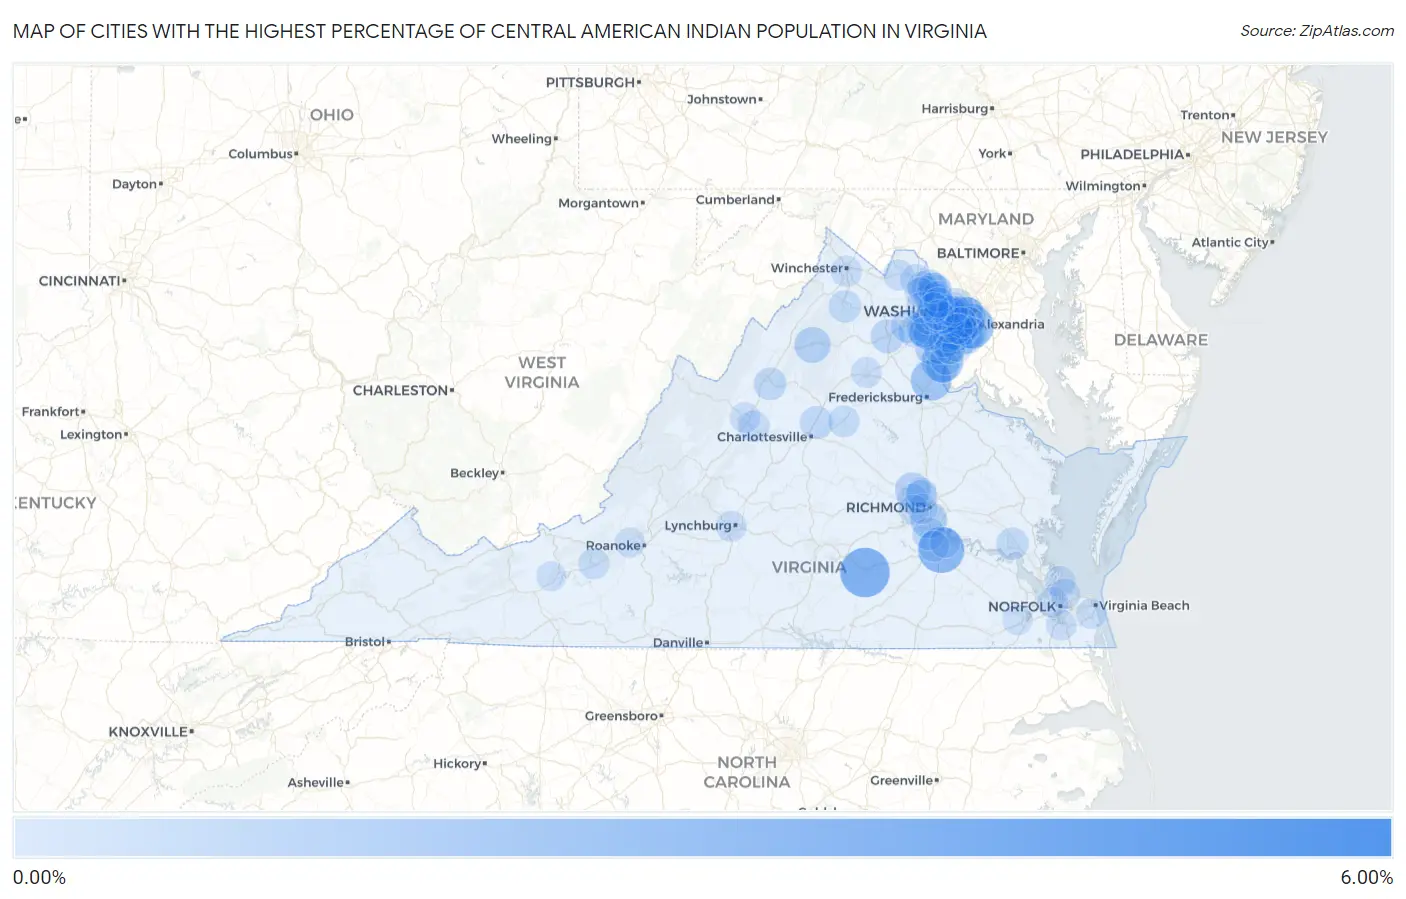
Map of Cities with the Highest Percentage of Central American Indian Population in Virginia
0.00%
6.00%
Cities with the Highest Percentage of Central American Indian Population in Virginia
| City | Central American Indian | vs State | vs National | |
| 1. | Afton | 5.32% | 0.12%(+5.20)#1 | 0.11%(+5.21)#47 |
| 2. | Blackstone | 3.09% | 0.12%(+2.97)#2 | 0.11%(+2.98)#98 |
| 3. | Fort Lee | 2.56% | 0.12%(+2.44)#3 | 0.11%(+2.45)#123 |
| 4. | Huntington | 2.29% | 0.12%(+2.17)#4 | 0.11%(+2.18)#138 |
| 5. | Bailey S Crossroads | 1.88% | 0.12%(+1.76)#5 | 0.11%(+1.77)#174 |
| 6. | Triangle | 1.85% | 0.12%(+1.73)#6 | 0.11%(+1.73)#178 |
| 7. | Stafford Courthouse | 1.72% | 0.12%(+1.60)#7 | 0.11%(+1.61)#201 |
| 8. | West Springfield | 1.69% | 0.12%(+1.57)#8 | 0.11%(+1.58)#207 |
| 9. | Manassas Park | 1.62% | 0.12%(+1.50)#9 | 0.11%(+1.51)#223 |
| 10. | Bensley | 1.04% | 0.12%(+0.924)#10 | 0.11%(+0.931)#382 |
| 11. | Rose Hill Cdp Fairfax County | 0.96% | 0.12%(+0.842)#11 | 0.11%(+0.849)#416 |
| 12. | Luray | 0.93% | 0.12%(+0.810)#12 | 0.11%(+0.817)#433 |
| 13. | Innsbrook | 0.82% | 0.12%(+0.696)#13 | 0.11%(+0.703)#489 |
| 14. | Independent Hill | 0.78% | 0.12%(+0.661)#14 | 0.11%(+0.668)#504 |
| 15. | Yorkshire | 0.75% | 0.12%(+0.628)#15 | 0.11%(+0.635)#527 |
| 16. | Fort Belvoir | 0.65% | 0.12%(+0.532)#16 | 0.11%(+0.540)#588 |
| 17. | West Falls Church | 0.62% | 0.12%(+0.503)#17 | 0.11%(+0.510)#617 |
| 18. | Newington | 0.60% | 0.12%(+0.477)#18 | 0.11%(+0.484)#639 |
| 19. | Warrenton | 0.57% | 0.12%(+0.453)#19 | 0.11%(+0.461)#657 |
| 20. | Mclean | 0.57% | 0.12%(+0.453)#20 | 0.11%(+0.460)#658 |
| 21. | North Springfield | 0.55% | 0.12%(+0.429)#21 | 0.11%(+0.436)#681 |
| 22. | Quantico Base | 0.54% | 0.12%(+0.420)#22 | 0.11%(+0.427)#696 |
| 23. | University Center | 0.52% | 0.12%(+0.401)#23 | 0.11%(+0.408)#717 |
| 24. | Herndon | 0.49% | 0.12%(+0.371)#24 | 0.11%(+0.378)#750 |
| 25. | Gainesville | 0.49% | 0.12%(+0.369)#25 | 0.11%(+0.376)#752 |
| 26. | Oak Grove | 0.47% | 0.12%(+0.354)#26 | 0.11%(+0.361)#772 |
| 27. | Dale City | 0.46% | 0.12%(+0.344)#27 | 0.11%(+0.351)#792 |
| 28. | Hollymead | 0.46% | 0.12%(+0.338)#28 | 0.11%(+0.345)#805 |
| 29. | Massanetta Springs | 0.43% | 0.12%(+0.312)#29 | 0.11%(+0.319)#853 |
| 30. | Dumbarton | 0.42% | 0.12%(+0.303)#30 | 0.11%(+0.310)#868 |
| 31. | Chester | 0.42% | 0.12%(+0.300)#31 | 0.11%(+0.307)#874 |
| 32. | Merrifield | 0.41% | 0.12%(+0.291)#32 | 0.11%(+0.299)#897 |
| 33. | Front Royal | 0.40% | 0.12%(+0.278)#33 | 0.11%(+0.285)#923 |
| 34. | Mount Vernon | 0.39% | 0.12%(+0.271)#34 | 0.11%(+0.278)#940 |
| 35. | Williamsburg | 0.38% | 0.12%(+0.261)#35 | 0.11%(+0.268)#956 |
| 36. | Newington Forest | 0.37% | 0.12%(+0.251)#36 | 0.11%(+0.259)#974 |
| 37. | Woodlawn Cdp Fairfax County | 0.34% | 0.12%(+0.224)#37 | 0.11%(+0.231)#1,048 |
| 38. | Cherry Hill | 0.34% | 0.12%(+0.222)#38 | 0.11%(+0.229)#1,054 |
| 39. | Falls Church | 0.32% | 0.12%(+0.202)#39 | 0.11%(+0.209)#1,100 |
| 40. | Sugarland Run | 0.32% | 0.12%(+0.200)#40 | 0.11%(+0.207)#1,114 |
| 41. | Franconia | 0.30% | 0.12%(+0.181)#41 | 0.11%(+0.189)#1,156 |
| 42. | Lake Ridge | 0.30% | 0.12%(+0.177)#42 | 0.11%(+0.184)#1,172 |
| 43. | Difficult Run | 0.28% | 0.12%(+0.158)#43 | 0.11%(+0.165)#1,215 |
| 44. | Gordonsville | 0.26% | 0.12%(+0.137)#44 | 0.11%(+0.144)#1,274 |
| 45. | Cascades | 0.26% | 0.12%(+0.135)#45 | 0.11%(+0.142)#1,279 |
| 46. | Buckhall | 0.24% | 0.12%(+0.124)#46 | 0.11%(+0.131)#1,324 |
| 47. | Linton Hall | 0.24% | 0.12%(+0.123)#47 | 0.11%(+0.131)#1,325 |
| 48. | Leesburg | 0.24% | 0.12%(+0.117)#48 | 0.11%(+0.124)#1,361 |
| 49. | Fishersville | 0.23% | 0.12%(+0.113)#49 | 0.11%(+0.120)#1,379 |
| 50. | Fairfax | 0.23% | 0.12%(+0.111)#50 | 0.11%(+0.118)#1,392 |
| 51. | Crosspointe | 0.23% | 0.12%(+0.106)#51 | 0.11%(+0.113)#1,412 |
| 52. | Alexandria | 0.22% | 0.12%(+0.104)#52 | 0.11%(+0.112)#1,420 |
| 53. | Hybla Valley | 0.22% | 0.12%(+0.101)#53 | 0.11%(+0.108)#1,431 |
| 54. | Winchester | 0.21% | 0.12%(+0.086)#54 | 0.11%(+0.093)#1,505 |
| 55. | George Mason | 0.20% | 0.12%(+0.080)#55 | 0.11%(+0.087)#1,541 |
| 56. | Christiansburg | 0.20% | 0.12%(+0.076)#56 | 0.11%(+0.083)#1,566 |
| 57. | Fort Hunt | 0.19% | 0.12%(+0.073)#57 | 0.11%(+0.081)#1,573 |
| 58. | Ashburn | 0.19% | 0.12%(+0.071)#58 | 0.11%(+0.078)#1,579 |
| 59. | Centreville | 0.19% | 0.12%(+0.071)#59 | 0.11%(+0.078)#1,580 |
| 60. | Kingstowne | 0.17% | 0.12%(+0.050)#60 | 0.11%(+0.057)#1,679 |
| 61. | Arlington | 0.16% | 0.12%(+0.038)#61 | 0.11%(+0.045)#1,754 |
| 62. | Purcellville | 0.16% | 0.12%(+0.037)#62 | 0.11%(+0.044)#1,758 |
| 63. | Mason Neck | 0.16% | 0.12%(+0.035)#63 | 0.11%(+0.042)#1,766 |
| 64. | Long Branch | 0.14% | 0.12%(+0.024)#64 | 0.11%(+0.031)#1,830 |
| 65. | Culpeper | 0.13% | 0.12%(+0.014)#65 | 0.11%(+0.021)#1,890 |
| 66. | Vienna | 0.13% | 0.12%(+0.014)#66 | 0.11%(+0.021)#1,894 |
| 67. | Hampton | 0.13% | 0.12%(+0.014)#67 | 0.11%(+0.021)#1,895 |
| 68. | Colonial Heights | 0.13% | 0.12%(+0.007)#68 | 0.11%(+0.014)#1,943 |
| 69. | Fair Lakes | 0.12% | 0.12%(+0.003)#69 | 0.11%(+0.010)#1,966 |
| 70. | Oakton | 0.12% | 0.12%(+0.003)#70 | 0.11%(+0.010)#1,967 |
| 71. | Chesapeake | 0.12% | 0.12%(+0.001)#71 | 0.11%(+0.009)#1,976 |
| 72. | Belmont | 0.12% | 0.12%(+0.001)#72 | 0.11%(+0.008)#1,978 |
| 73. | Lynchburg | 0.11% | 0.12%(-0.005)#73 | 0.11%(+0.002)#2,031 |
| 74. | Staunton | 0.11% | 0.12%(-0.007)#74 | 0.11%(+0.000)#2,044 |
| 75. | Burke | 0.11% | 0.12%(-0.007)#75 | 0.11%(+0.000)#2,048 |
| 76. | Portsmouth | 0.11% | 0.12%(-0.011)#76 | 0.11%(-0.004)#2,081 |
| 77. | Hopewell | 0.11% | 0.12%(-0.012)#77 | 0.11%(-0.005)#2,087 |
| 78. | Woodbridge | 0.11% | 0.12%(-0.012)#78 | 0.11%(-0.005)#2,090 |
| 79. | Floris | 0.11% | 0.12%(-0.012)#79 | 0.11%(-0.005)#2,093 |
| 80. | Dunn Loring | 0.10% | 0.12%(-0.017)#80 | 0.11%(-0.010)#2,133 |
| 81. | Tysons | 0.098% | 0.12%(-0.022)#81 | 0.11%(-0.015)#2,169 |
| 82. | South Riding | 0.093% | 0.12%(-0.027)#82 | 0.11%(-0.020)#2,213 |
| 83. | Broadlands | 0.075% | 0.12%(-0.045)#83 | 0.11%(-0.038)#2,365 |
| 84. | Dranesville | 0.074% | 0.12%(-0.046)#84 | 0.11%(-0.039)#2,381 |
| 85. | Virginia Beach | 0.073% | 0.12%(-0.047)#85 | 0.11%(-0.040)#2,398 |
| 86. | Countryside | 0.073% | 0.12%(-0.048)#86 | 0.11%(-0.040)#2,400 |
| 87. | Lincolnia | 0.071% | 0.12%(-0.049)#87 | 0.11%(-0.042)#2,416 |
| 88. | Norfolk | 0.070% | 0.12%(-0.050)#88 | 0.11%(-0.043)#2,420 |
| 89. | Reston | 0.061% | 0.12%(-0.059)#89 | 0.11%(-0.052)#2,523 |
| 90. | Suffolk | 0.057% | 0.12%(-0.063)#90 | 0.11%(-0.056)#2,562 |
| 91. | Manassas | 0.052% | 0.12%(-0.069)#91 | 0.11%(-0.061)#2,608 |
| 92. | Salem | 0.051% | 0.12%(-0.069)#92 | 0.11%(-0.062)#2,615 |
| 93. | Tuckahoe | 0.050% | 0.12%(-0.070)#93 | 0.11%(-0.063)#2,626 |
| 94. | Fair Oaks | 0.046% | 0.12%(-0.075)#94 | 0.11%(-0.067)#2,672 |
| 95. | Richmond | 0.042% | 0.12%(-0.078)#95 | 0.11%(-0.071)#2,697 |
| 96. | Bon Air | 0.040% | 0.12%(-0.080)#96 | 0.11%(-0.073)#2,720 |
| 97. | Franklin Farm | 0.037% | 0.12%(-0.083)#97 | 0.11%(-0.076)#2,747 |
| 98. | Laurel | 0.027% | 0.12%(-0.093)#98 | 0.11%(-0.086)#2,842 |
| 99. | Springfield | 0.026% | 0.12%(-0.094)#99 | 0.11%(-0.087)#2,858 |
| 100. | Pulaski | 0.022% | 0.12%(-0.098)#100 | 0.11%(-0.091)#2,900 |
Common Questions
What are the Top 10 Cities with the Highest Percentage of Central American Indian Population in Virginia?
Top 10 Cities with the Highest Percentage of Central American Indian Population in Virginia are:
#1
3.09%
#2
2.56%
#3
2.29%
#4
1.88%
#5
1.85%
#6
1.72%
#7
1.69%
#8
1.62%
#9
1.04%
#10
0.93%
What city has the Highest Percentage of Central American Indian Population in Virginia?
Blackstone has the Highest Percentage of Central American Indian Population in Virginia with 3.09%.
What is the Percentage of Central American Indian Population in the State of Virginia?
Percentage of Central American Indian Population in Virginia is 0.12%.
What is the Percentage of Central American Indian Population in the United States?
Percentage of Central American Indian Population in the United States is 0.11%.