Cities with the Highest Percentage of Households with Income Above $100,000 in Virginia
RELATED REPORTS & OPTIONS
Household Income | $100k+
Virginia
Compare Cities
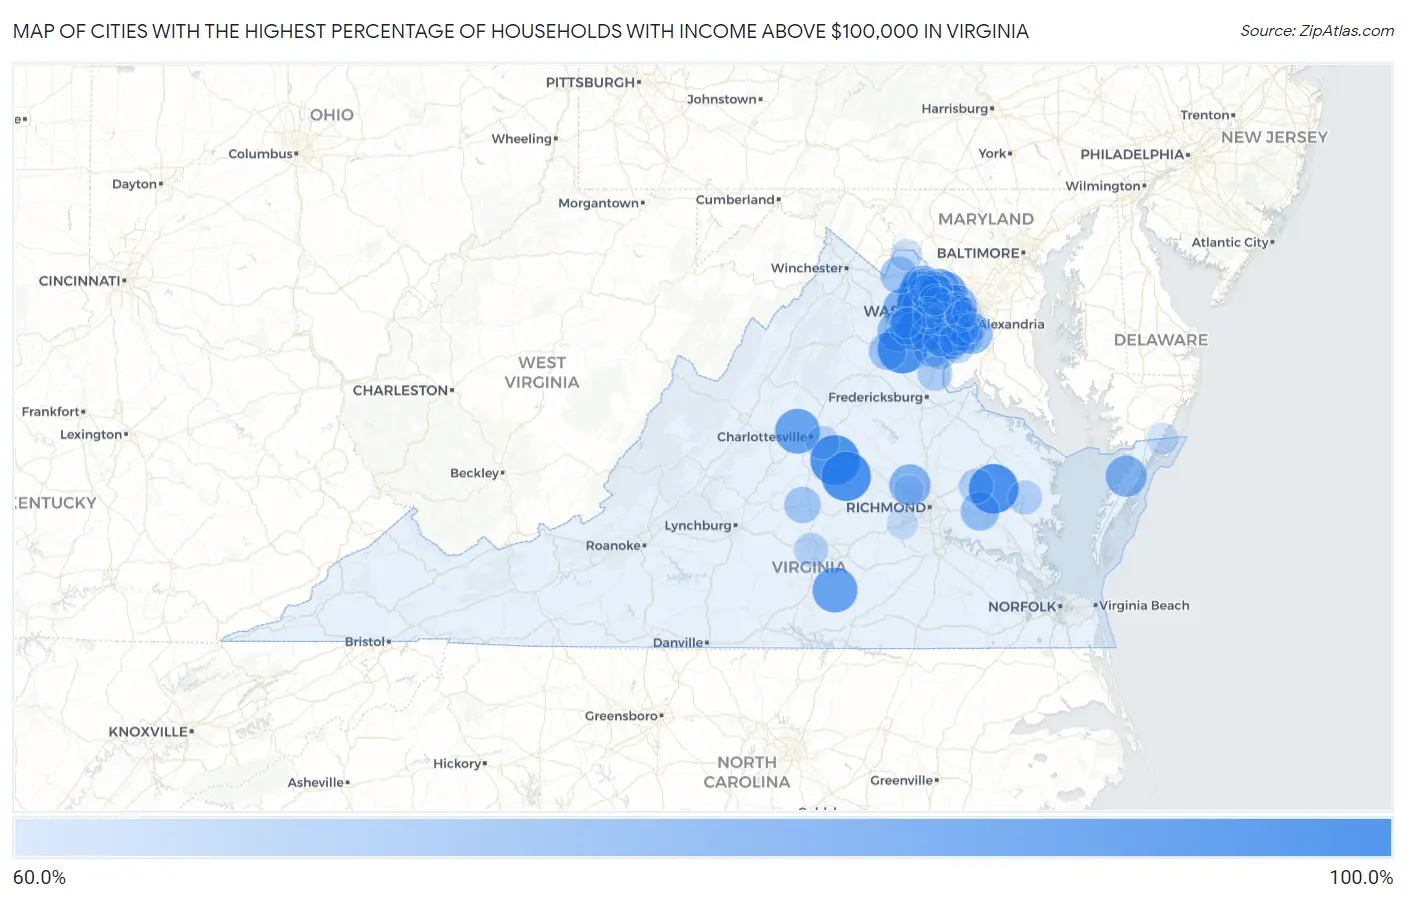
Map of Cities with the Highest Percentage of Households with Income Above $100,000 in Virginia
0.0%
100.0%
Cities with the Highest Percentage of Households with Income Above $100,000 in Virginia
| City | Households with Income > $100k | vs State | vs National | |
| 1. | Palmyra | 100.0% | 44.1%(+55.9)#1 | 37.3%(+62.7)#46 |
| 2. | Calverton | 100.0% | 44.1%(+55.9)#2 | 37.3%(+62.7)#101 |
| 3. | King And Queen Court House | 100.0% | 44.1%(+55.9)#3 | 37.3%(+62.7)#115 |
| 4. | Columbia | 100.0% | 44.1%(+55.9)#4 | 37.3%(+62.7)#118 |
| 5. | Crosspointe | 93.2% | 44.1%(+49.1)#5 | 37.3%(+55.9)#214 |
| 6. | Difficult Run | 92.7% | 44.1%(+48.6)#6 | 37.3%(+55.4)#218 |
| 7. | Navy | 92.1% | 44.1%(+48.0)#7 | 37.3%(+54.8)#224 |
| 8. | Lunenburg | 91.6% | 44.1%(+47.5)#8 | 37.3%(+54.3)#230 |
| 9. | Ivy | 91.3% | 44.1%(+47.2)#9 | 37.3%(+54.0)#233 |
| 10. | Loudoun Valley Estates | 91.2% | 44.1%(+47.1)#10 | 37.3%(+53.9)#235 |
| 11. | Great Falls Crossing | 90.3% | 44.1%(+46.2)#11 | 37.3%(+53.0)#246 |
| 12. | Great Falls | 89.9% | 44.1%(+45.8)#12 | 37.3%(+52.6)#256 |
| 13. | Brambleton | 89.3% | 44.1%(+45.2)#13 | 37.3%(+52.0)#269 |
| 14. | One Loudoun | 88.5% | 44.1%(+44.4)#14 | 37.3%(+51.2)#281 |
| 15. | Broadlands | 86.8% | 44.1%(+42.7)#15 | 37.3%(+49.5)#306 |
| 16. | South Run | 86.8% | 44.1%(+42.7)#16 | 37.3%(+49.5)#308 |
| 17. | Lowes Island | 86.5% | 44.1%(+42.4)#17 | 37.3%(+49.2)#313 |
| 18. | Dranesville | 86.4% | 44.1%(+42.3)#18 | 37.3%(+49.1)#315 |
| 19. | Clifton | 86.3% | 44.1%(+42.2)#19 | 37.3%(+49.0)#320 |
| 20. | Keswick | 85.7% | 44.1%(+41.6)#20 | 37.3%(+48.4)#327 |
| 21. | Franklin Farm | 85.4% | 44.1%(+41.3)#21 | 37.3%(+48.1)#334 |
| 22. | Fairfax Station | 85.2% | 44.1%(+41.1)#22 | 37.3%(+47.9)#338 |
| 23. | Belmont | 84.7% | 44.1%(+40.6)#23 | 37.3%(+47.4)#348 |
| 24. | Wyndham | 84.6% | 44.1%(+40.5)#24 | 37.3%(+47.3)#351 |
| 25. | Dunn Loring | 84.6% | 44.1%(+40.5)#25 | 37.3%(+47.3)#352 |
| 26. | Bull Run Mountain Estates | 84.6% | 44.1%(+40.5)#26 | 37.3%(+47.3)#356 |
| 27. | Bayside | 84.4% | 44.1%(+40.3)#27 | 37.3%(+47.1)#360 |
| 28. | Braddock | 84.2% | 44.1%(+40.1)#28 | 37.3%(+46.9)#364 |
| 29. | Wolf Trap | 82.8% | 44.1%(+38.7)#29 | 37.3%(+45.5)#422 |
| 30. | Mclean | 82.7% | 44.1%(+38.6)#30 | 37.3%(+45.4)#432 |
| 31. | Stone Ridge | 82.7% | 44.1%(+38.6)#31 | 37.3%(+45.4)#433 |
| 32. | Fort Hunt | 82.4% | 44.1%(+38.3)#32 | 37.3%(+45.1)#446 |
| 33. | New Baltimore | 82.1% | 44.1%(+38.0)#33 | 37.3%(+44.8)#453 |
| 34. | Goose Creek | 81.3% | 44.1%(+37.2)#34 | 37.3%(+44.0)#488 |
| 35. | Union Mill | 81.0% | 44.1%(+36.9)#35 | 37.3%(+43.7)#501 |
| 36. | South Riding | 80.7% | 44.1%(+36.6)#36 | 37.3%(+43.4)#511 |
| 37. | Floris | 80.7% | 44.1%(+36.6)#37 | 37.3%(+43.4)#512 |
| 38. | Hayfield | 80.6% | 44.1%(+36.5)#38 | 37.3%(+43.3)#520 |
| 39. | Moorefield | 79.7% | 44.1%(+35.6)#39 | 37.3%(+42.4)#565 |
| 40. | Dinwiddie | 79.7% | 44.1%(+35.6)#40 | 37.3%(+42.4)#568 |
| 41. | Independent Hill | 79.6% | 44.1%(+35.5)#41 | 37.3%(+42.3)#569 |
| 42. | New Kent | 79.5% | 44.1%(+35.4)#42 | 37.3%(+42.2)#584 |
| 43. | Linton Hall | 78.4% | 44.1%(+34.3)#43 | 37.3%(+41.1)#647 |
| 44. | Burke | 78.0% | 44.1%(+33.9)#44 | 37.3%(+40.7)#679 |
| 45. | Opal | 77.0% | 44.1%(+32.9)#45 | 37.3%(+39.7)#769 |
| 46. | Purcellville | 76.5% | 44.1%(+32.4)#46 | 37.3%(+39.2)#790 |
| 47. | Mantua | 76.4% | 44.1%(+32.3)#47 | 37.3%(+39.1)#794 |
| 48. | Gainesville | 76.2% | 44.1%(+32.1)#48 | 37.3%(+38.9)#802 |
| 49. | Long Branch | 76.1% | 44.1%(+32.0)#49 | 37.3%(+38.8)#808 |
| 50. | Sully Square | 75.9% | 44.1%(+31.8)#50 | 37.3%(+38.6)#815 |
| 51. | Earlysville | 75.9% | 44.1%(+31.8)#51 | 37.3%(+38.6)#818 |
| 52. | Kings Park West | 75.6% | 44.1%(+31.5)#52 | 37.3%(+38.3)#840 |
| 53. | Buckingham Courthouse | 75.4% | 44.1%(+31.3)#53 | 37.3%(+38.1)#864 |
| 54. | Ravensworth | 75.3% | 44.1%(+31.2)#54 | 37.3%(+38.0)#870 |
| 55. | Vienna | 75.0% | 44.1%(+30.9)#55 | 37.3%(+37.7)#887 |
| 56. | Newington Forest | 74.5% | 44.1%(+30.4)#56 | 37.3%(+37.2)#934 |
| 57. | Oak Grove | 74.5% | 44.1%(+30.4)#57 | 37.3%(+37.2)#938 |
| 58. | Buckhall | 73.9% | 44.1%(+29.8)#58 | 37.3%(+36.6)#981 |
| 59. | Franconia | 73.2% | 44.1%(+29.1)#59 | 37.3%(+35.9)#1,053 |
| 60. | Kings Park | 73.0% | 44.1%(+28.9)#60 | 37.3%(+35.7)#1,069 |
| 61. | West Springfield | 72.1% | 44.1%(+28.0)#61 | 37.3%(+34.8)#1,142 |
| 62. | Burke Centre | 72.1% | 44.1%(+28.0)#62 | 37.3%(+34.8)#1,143 |
| 63. | Aquia Harbour | 72.1% | 44.1%(+28.0)#63 | 37.3%(+34.8)#1,145 |
| 64. | King William | 72.1% | 44.1%(+28.0)#64 | 37.3%(+34.8)#1,149 |
| 65. | Newington | 72.0% | 44.1%(+27.9)#65 | 37.3%(+34.7)#1,152 |
| 66. | Rose Hill Cdp Fairfax County | 71.2% | 44.1%(+27.1)#66 | 37.3%(+33.9)#1,229 |
| 67. | Saluda | 71.2% | 44.1%(+27.1)#67 | 37.3%(+33.9)#1,234 |
| 68. | Montclair | 70.9% | 44.1%(+26.8)#68 | 37.3%(+33.6)#1,256 |
| 69. | Hampden Sydney | 70.8% | 44.1%(+26.7)#69 | 37.3%(+33.5)#1,268 |
| 70. | Mason Neck | 70.7% | 44.1%(+26.6)#70 | 37.3%(+33.4)#1,273 |
| 71. | Countryside | 70.6% | 44.1%(+26.5)#71 | 37.3%(+33.3)#1,277 |
| 72. | Cascades | 70.1% | 44.1%(+26.0)#72 | 37.3%(+32.8)#1,320 |
| 73. | Rivanna | 69.9% | 44.1%(+25.8)#73 | 37.3%(+32.6)#1,342 |
| 74. | Falls Church | 69.7% | 44.1%(+25.6)#74 | 37.3%(+32.4)#1,356 |
| 75. | County Center | 69.2% | 44.1%(+25.1)#75 | 37.3%(+31.9)#1,416 |
| 76. | Sugarland Run | 68.6% | 44.1%(+24.5)#76 | 37.3%(+31.3)#1,485 |
| 77. | Oakton | 68.5% | 44.1%(+24.4)#77 | 37.3%(+31.2)#1,496 |
| 78. | Pimmit Hills | 68.5% | 44.1%(+24.4)#78 | 37.3%(+31.2)#1,506 |
| 79. | George Mason | 68.4% | 44.1%(+24.3)#79 | 37.3%(+31.1)#1,517 |
| 80. | Mount Vernon | 68.3% | 44.1%(+24.2)#80 | 37.3%(+31.0)#1,534 |
| 81. | Ashburn | 67.9% | 44.1%(+23.8)#81 | 37.3%(+30.6)#1,583 |
| 82. | Kingstowne | 67.2% | 44.1%(+23.1)#82 | 37.3%(+29.9)#1,655 |
| 83. | Lorton | 66.8% | 44.1%(+22.7)#83 | 37.3%(+29.5)#1,684 |
| 84. | Lovettsville | 66.7% | 44.1%(+22.6)#84 | 37.3%(+29.4)#1,708 |
| 85. | Stickleyville | 66.7% | 44.1%(+22.6)#85 | 37.3%(+29.4)#1,717 |
| 86. | Greenbackville | 66.7% | 44.1%(+22.6)#86 | 37.3%(+29.4)#1,724 |
| 87. | North Garden | 66.5% | 44.1%(+22.4)#87 | 37.3%(+29.2)#1,761 |
| 88. | Centreville | 66.1% | 44.1%(+22.0)#88 | 37.3%(+28.8)#1,802 |
| 89. | Woodlake | 66.1% | 44.1%(+22.0)#89 | 37.3%(+28.8)#1,806 |
| 90. | Lansdowne | 65.9% | 44.1%(+21.8)#90 | 37.3%(+28.6)#1,825 |
| 91. | Reston | 65.8% | 44.1%(+21.7)#91 | 37.3%(+28.5)#1,834 |
| 92. | Chantilly | 65.8% | 44.1%(+21.7)#92 | 37.3%(+28.5)#1,836 |
| 93. | Eggleston | 65.7% | 44.1%(+21.6)#93 | 37.3%(+28.4)#1,862 |
| 94. | Haymarket | 65.6% | 44.1%(+21.5)#94 | 37.3%(+28.3)#1,866 |
| 95. | Herndon | 65.2% | 44.1%(+21.1)#95 | 37.3%(+27.9)#1,904 |
| 96. | Belle Haven | 64.5% | 44.1%(+20.4)#96 | 37.3%(+27.2)#1,996 |
| 97. | Short Pump | 64.3% | 44.1%(+20.2)#97 | 37.3%(+27.0)#2,024 |
| 98. | Lake Barcroft | 64.2% | 44.1%(+20.1)#98 | 37.3%(+26.9)#2,038 |
| 99. | Leesylvania | 63.9% | 44.1%(+19.8)#99 | 37.3%(+26.6)#2,082 |
| 100. | Arlington | 63.7% | 44.1%(+19.6)#100 | 37.3%(+26.4)#2,098 |
Common Questions
What are the Top 10 Cities with the Highest Percentage of Households with Income Above $100,000 in Virginia?
Top 10 Cities with the Highest Percentage of Households with Income Above $100,000 in Virginia are:
#1
100.0%
#2
100.0%
#3
100.0%
#4
100.0%
#5
93.2%
#6
91.6%
#7
91.3%
#8
91.2%
#9
89.9%
#10
89.3%
What city has the Highest Percentage of Households with Income Above $100,000 in Virginia?
Palmyra has the Highest Percentage of Households with Income Above $100,000 in Virginia with 100.0%.
What is the Percentage of Households with Income Above $100,000 in the State of Virginia?
Percentage of Households with Income Above $100,000 in Virginia is 44.1%.
What is the Percentage of Households with Income Above $100,000 in the United States?
Percentage of Households with Income Above $100,000 in the United States is 37.3%.