Cities with the Largest Indian (Asian) Community in Virginia
RELATED REPORTS & OPTIONS
Indian (Asian)
Virginia
Compare Cities
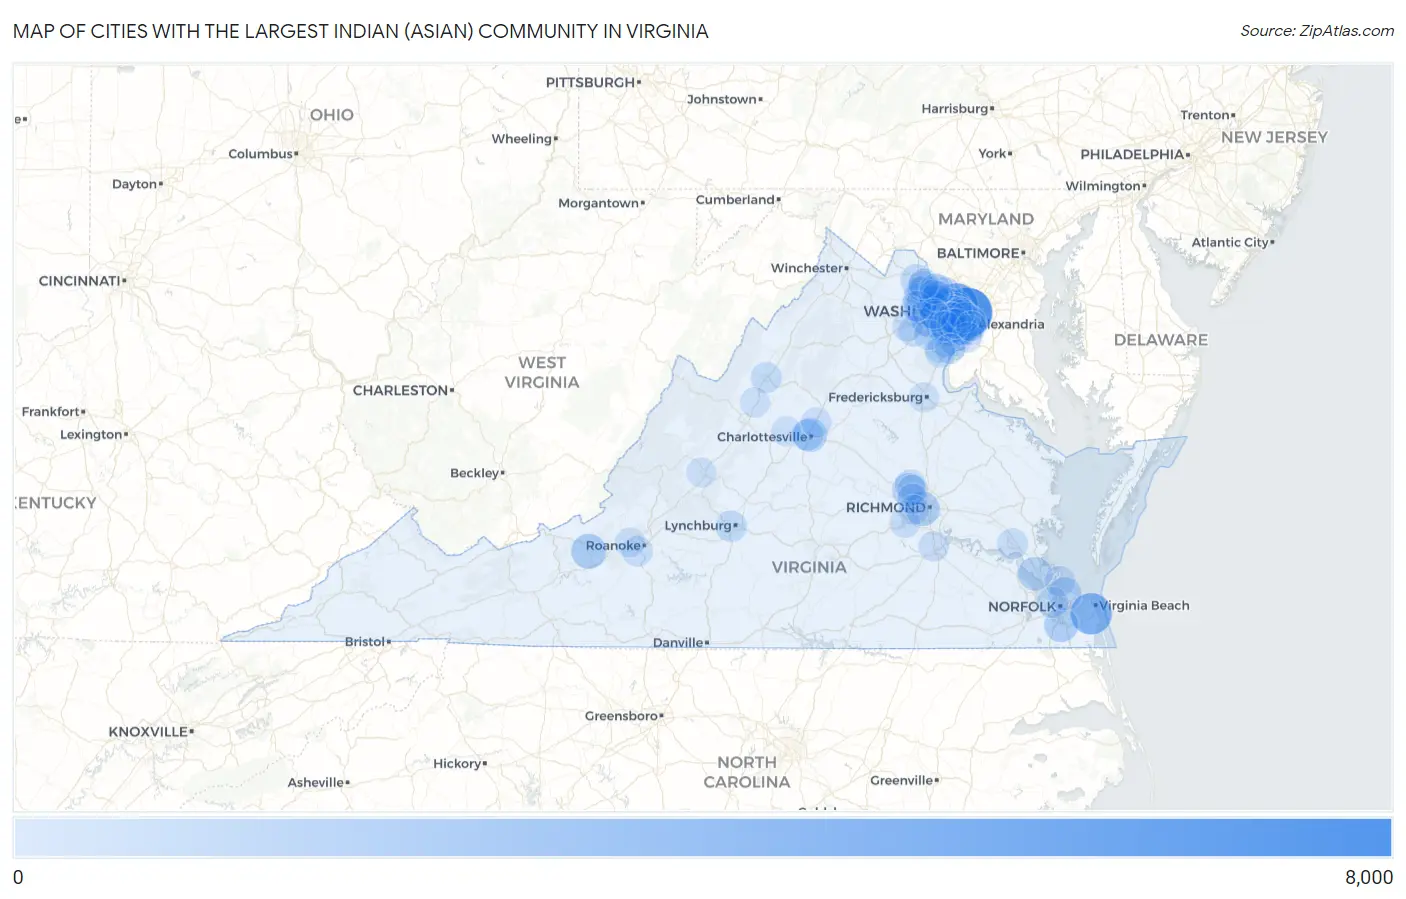
Map of Cities with the Largest Indian (Asian) Community in Virginia
0
8,000
Cities with the Largest Indian (Asian) Community in Virginia
| City | Indian (Asian) | vs State | vs National | |
| 1. | Arlington | 6,858 | 96,879(7.08%)#1 | 5,326,595(0.13%)#100 |
| 2. | Mclean | 4,773 | 96,879(4.93%)#2 | 5,326,595(0.09%)#142 |
| 3. | Virginia Beach | 4,004 | 96,879(4.13%)#3 | 5,326,595(0.08%)#170 |
| 4. | Fair Oaks | 2,677 | 96,879(2.76%)#4 | 5,326,595(0.05%)#264 |
| 5. | Oakton | 2,394 | 96,879(2.47%)#5 | 5,326,595(0.04%)#302 |
| 6. | Tysons | 2,364 | 96,879(2.44%)#6 | 5,326,595(0.04%)#306 |
| 7. | Centreville | 2,087 | 96,879(2.15%)#7 | 5,326,595(0.04%)#337 |
| 8. | Blacksburg | 1,762 | 96,879(1.82%)#8 | 5,326,595(0.03%)#393 |
| 9. | Alexandria | 1,761 | 96,879(1.82%)#9 | 5,326,595(0.03%)#394 |
| 10. | Burke | 1,644 | 96,879(1.70%)#10 | 5,326,595(0.03%)#419 |
| 11. | Richmond | 1,637 | 96,879(1.69%)#11 | 5,326,595(0.03%)#421 |
| 12. | Reston | 1,519 | 96,879(1.57%)#12 | 5,326,595(0.03%)#443 |
| 13. | Chesapeake | 1,482 | 96,879(1.53%)#13 | 5,326,595(0.03%)#455 |
| 14. | South Riding | 1,451 | 96,879(1.50%)#14 | 5,326,595(0.03%)#465 |
| 15. | Charlottesville | 1,448 | 96,879(1.49%)#15 | 5,326,595(0.03%)#467 |
| 16. | Newport News | 1,348 | 96,879(1.39%)#16 | 5,326,595(0.03%)#506 |
| 17. | Springfield | 1,338 | 96,879(1.38%)#17 | 5,326,595(0.03%)#512 |
| 18. | Short Pump | 1,275 | 96,879(1.32%)#18 | 5,326,595(0.02%)#531 |
| 19. | Norfolk | 1,173 | 96,879(1.21%)#19 | 5,326,595(0.02%)#565 |
| 20. | Great Falls | 1,133 | 96,879(1.17%)#20 | 5,326,595(0.02%)#586 |
| 21. | Chantilly | 1,016 | 96,879(1.05%)#21 | 5,326,595(0.02%)#641 |
| 22. | Fairfax | 839 | 96,879(0.87%)#22 | 5,326,595(0.02%)#727 |
| 23. | Wolf Trap | 820 | 96,879(0.85%)#23 | 5,326,595(0.02%)#737 |
| 24. | Ashburn | 815 | 96,879(0.84%)#24 | 5,326,595(0.02%)#742 |
| 25. | Vienna | 770 | 96,879(0.79%)#25 | 5,326,595(0.01%)#774 |
| 26. | Lorton | 758 | 96,879(0.78%)#26 | 5,326,595(0.01%)#780 |
| 27. | Annandale | 715 | 96,879(0.74%)#27 | 5,326,595(0.01%)#806 |
| 28. | Idylwood | 714 | 96,879(0.74%)#28 | 5,326,595(0.01%)#808 |
| 29. | Leesburg | 702 | 96,879(0.72%)#29 | 5,326,595(0.01%)#822 |
| 30. | Merrifield | 695 | 96,879(0.72%)#30 | 5,326,595(0.01%)#832 |
| 31. | Leesylvania | 678 | 96,879(0.70%)#31 | 5,326,595(0.01%)#847 |
| 32. | Franconia | 673 | 96,879(0.69%)#32 | 5,326,595(0.01%)#855 |
| 33. | Mcnair | 609 | 96,879(0.63%)#33 | 5,326,595(0.01%)#927 |
| 34. | Kings Park West | 608 | 96,879(0.63%)#34 | 5,326,595(0.01%)#930 |
| 35. | Brambleton | 606 | 96,879(0.63%)#35 | 5,326,595(0.01%)#934 |
| 36. | Franklin Farm | 605 | 96,879(0.62%)#36 | 5,326,595(0.01%)#939 |
| 37. | Pimmit Hills | 604 | 96,879(0.62%)#37 | 5,326,595(0.01%)#942 |
| 38. | University Of Virginia | 599 | 96,879(0.62%)#38 | 5,326,595(0.01%)#952 |
| 39. | George Mason | 597 | 96,879(0.62%)#39 | 5,326,595(0.01%)#957 |
| 40. | Lynchburg | 594 | 96,879(0.61%)#40 | 5,326,595(0.01%)#962 |
| 41. | Lincolnia | 543 | 96,879(0.56%)#41 | 5,326,595(0.01%)#1,029 |
| 42. | Lake Ridge | 529 | 96,879(0.55%)#42 | 5,326,595(0.01%)#1,053 |
| 43. | Floris | 529 | 96,879(0.55%)#43 | 5,326,595(0.01%)#1,056 |
| 44. | Broadlands | 525 | 96,879(0.54%)#44 | 5,326,595(0.01%)#1,063 |
| 45. | Herndon | 524 | 96,879(0.54%)#45 | 5,326,595(0.01%)#1,066 |
| 46. | Portsmouth | 521 | 96,879(0.54%)#46 | 5,326,595(0.01%)#1,069 |
| 47. | Harrisonburg | 501 | 96,879(0.52%)#47 | 5,326,595(0.01%)#1,103 |
| 48. | West Falls Church | 499 | 96,879(0.52%)#48 | 5,326,595(0.01%)#1,107 |
| 49. | South Run | 484 | 96,879(0.50%)#49 | 5,326,595(0.01%)#1,139 |
| 50. | Dale City | 468 | 96,879(0.48%)#50 | 5,326,595(0.01%)#1,158 |
| 51. | Linton Hall | 467 | 96,879(0.48%)#51 | 5,326,595(0.01%)#1,163 |
| 52. | Kingstowne | 459 | 96,879(0.47%)#52 | 5,326,595(0.01%)#1,179 |
| 53. | Williamsburg | 447 | 96,879(0.46%)#53 | 5,326,595(0.01%)#1,207 |
| 54. | Wyndham | 435 | 96,879(0.45%)#54 | 5,326,595(0.01%)#1,230 |
| 55. | Cave Spring | 426 | 96,879(0.44%)#55 | 5,326,595(0.01%)#1,243 |
| 56. | Rose Hill Cdp Fairfax County | 422 | 96,879(0.44%)#56 | 5,326,595(0.01%)#1,248 |
| 57. | Navy | 414 | 96,879(0.43%)#57 | 5,326,595(0.01%)#1,274 |
| 58. | Fairfax Station | 407 | 96,879(0.42%)#58 | 5,326,595(0.01%)#1,288 |
| 59. | Belmont | 407 | 96,879(0.42%)#59 | 5,326,595(0.01%)#1,289 |
| 60. | Hampton | 396 | 96,879(0.41%)#60 | 5,326,595(0.01%)#1,315 |
| 61. | Dunn Loring | 393 | 96,879(0.41%)#61 | 5,326,595(0.01%)#1,323 |
| 62. | Lowes Island | 391 | 96,879(0.40%)#62 | 5,326,595(0.01%)#1,330 |
| 63. | Sterling | 379 | 96,879(0.39%)#63 | 5,326,595(0.01%)#1,369 |
| 64. | Dranesville | 376 | 96,879(0.39%)#64 | 5,326,595(0.01%)#1,373 |
| 65. | Long Branch | 373 | 96,879(0.39%)#65 | 5,326,595(0.01%)#1,384 |
| 66. | Seven Corners | 367 | 96,879(0.38%)#66 | 5,326,595(0.01%)#1,408 |
| 67. | Fair Lakes | 355 | 96,879(0.37%)#67 | 5,326,595(0.01%)#1,444 |
| 68. | Innsbrook | 351 | 96,879(0.36%)#68 | 5,326,595(0.01%)#1,451 |
| 69. | Brandermill | 350 | 96,879(0.36%)#69 | 5,326,595(0.01%)#1,454 |
| 70. | Sully Square | 346 | 96,879(0.36%)#70 | 5,326,595(0.01%)#1,463 |
| 71. | Moorefield | 326 | 96,879(0.34%)#71 | 5,326,595(0.01%)#1,530 |
| 72. | Colonial Heights | 322 | 96,879(0.33%)#72 | 5,326,595(0.01%)#1,546 |
| 73. | Hollymead | 296 | 96,879(0.31%)#73 | 5,326,595(0.01%)#1,635 |
| 74. | Mantua | 293 | 96,879(0.30%)#74 | 5,326,595(0.01%)#1,646 |
| 75. | West Springfield | 289 | 96,879(0.30%)#75 | 5,326,595(0.01%)#1,663 |
| 76. | Gainesville | 288 | 96,879(0.30%)#76 | 5,326,595(0.01%)#1,674 |
| 77. | Stone Ridge | 279 | 96,879(0.29%)#77 | 5,326,595(0.01%)#1,714 |
| 78. | Tuckahoe | 261 | 96,879(0.27%)#78 | 5,326,595(0.00%)#1,791 |
| 79. | Woodburn | 252 | 96,879(0.26%)#79 | 5,326,595(0.00%)#1,840 |
| 80. | Lansdowne | 251 | 96,879(0.26%)#80 | 5,326,595(0.00%)#1,843 |
| 81. | Groveton | 245 | 96,879(0.25%)#81 | 5,326,595(0.00%)#1,878 |
| 82. | Kings Park | 237 | 96,879(0.24%)#82 | 5,326,595(0.00%)#1,925 |
| 83. | Cascades | 232 | 96,879(0.24%)#83 | 5,326,595(0.00%)#1,946 |
| 84. | Fredericksburg | 230 | 96,879(0.24%)#84 | 5,326,595(0.00%)#1,952 |
| 85. | Bailey S Crossroads | 227 | 96,879(0.23%)#85 | 5,326,595(0.00%)#1,968 |
| 86. | Montclair | 227 | 96,879(0.23%)#86 | 5,326,595(0.00%)#1,969 |
| 87. | Difficult Run | 227 | 96,879(0.23%)#87 | 5,326,595(0.00%)#1,971 |
| 88. | Crozet | 221 | 96,879(0.23%)#88 | 5,326,595(0.00%)#2,003 |
| 89. | Falls Church | 218 | 96,879(0.23%)#89 | 5,326,595(0.00%)#2,020 |
| 90. | Buckhall | 216 | 96,879(0.22%)#90 | 5,326,595(0.00%)#2,030 |
| 91. | Bon Air | 205 | 96,879(0.21%)#91 | 5,326,595(0.00%)#2,097 |
| 92. | Burke Centre | 203 | 96,879(0.21%)#92 | 5,326,595(0.00%)#2,109 |
| 93. | Salem | 197 | 96,879(0.20%)#93 | 5,326,595(0.00%)#2,145 |
| 94. | Mount Vernon | 193 | 96,879(0.20%)#94 | 5,326,595(0.00%)#2,173 |
| 95. | Lexington | 193 | 96,879(0.20%)#95 | 5,326,595(0.00%)#2,177 |
| 96. | Woodbridge | 192 | 96,879(0.20%)#96 | 5,326,595(0.00%)#2,181 |
| 97. | North Springfield | 185 | 96,879(0.19%)#97 | 5,326,595(0.00%)#2,232 |
| 98. | Huntington | 182 | 96,879(0.19%)#98 | 5,326,595(0.00%)#2,258 |
| 99. | Greenbriar | 182 | 96,879(0.19%)#99 | 5,326,595(0.00%)#2,262 |
| 100. | Mount Sidney | 182 | 96,879(0.19%)#100 | 5,326,595(0.00%)#2,266 |
Common Questions
What are the Top 10 Cities with the Largest Indian (Asian) Community in Virginia?
Top 10 Cities with the Largest Indian (Asian) Community in Virginia are:
#1
6,858
#2
4,773
#3
4,004
#4
2,677
#5
2,394
#6
2,364
#7
2,087
#8
1,762
#9
1,761
#10
1,644
What city has the Largest Indian (Asian) Community in Virginia?
Arlington has the Largest Indian (Asian) Community in Virginia with 6,858.
What is the Total Indian (Asian) Population in the State of Virginia?
Total Indian (Asian) Population in Virginia is 96,879.
What is the Total Indian (Asian) Population in the United States?
Total Indian (Asian) Population in the United States is 5,326,595.