Lake Monticello, VA
Lake Monticello Map
Lake Monticello Overview
10,834
TOTAL POPULATION
4,969
MALE POPULATION
5,865
FEMALE POPULATION
84.72
MALES / 100 FEMALES
118.03
FEMALES / 100 MALES
38.7
MEDIAN AGE
2.9
AVG FAMILY SIZE
2.6
AVG HOUSEHOLD SIZE
$64,305
PER CAPITA INCOME
$103,860
AVG FAMILY INCOME
$98,848
AVG HOUSEHOLD INCOME
42.4%
WAGE / INCOME GAP [ % ]
57.6¢/ $1
WAGE / INCOME GAP [ $ ]
$6,348
FAMILY INCOME DEFICIT
0.53
INEQUALITY / GINI INDEX
5,229
LABOR FORCE [ PEOPLE ]
61.2%
PERCENT IN LABOR FORCE
1.6%
UNEMPLOYMENT RATE
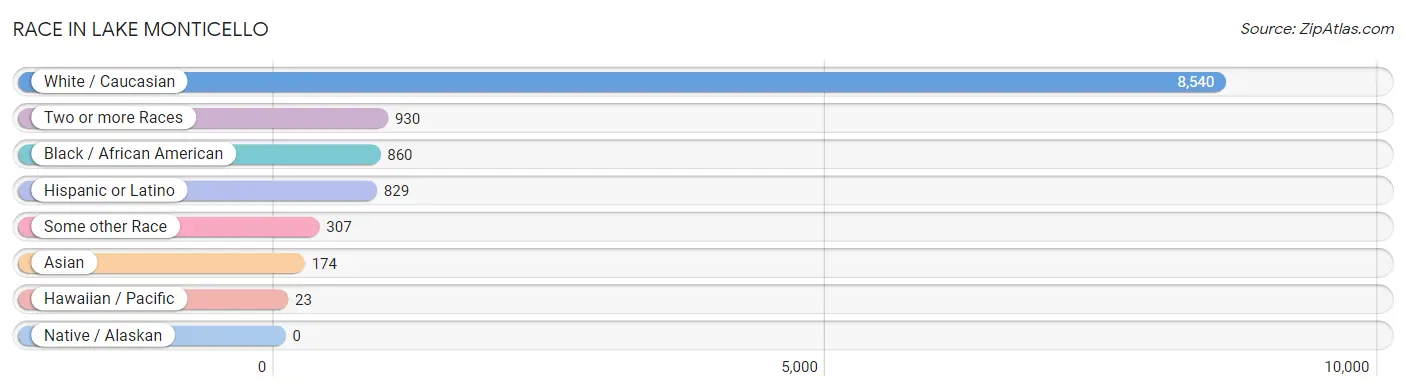
Race in Lake Monticello
The most populous races in Lake Monticello are White / Caucasian (8,540 | 78.8%), Two or more Races (930 | 8.6%), and Black / African American (860 | 7.9%).
| Race | # Population | % Population |
| Asian | 174 | 1.6% |
| Black / African American | 860 | 7.9% |
| Hawaiian / Pacific | 23 | 0.2% |
| Hispanic or Latino | 829 | 7.6% |
| Native / Alaskan | 0 | 0.0% |
| White / Caucasian | 8,540 | 78.8% |
| Two or more Races | 930 | 8.6% |
| Some other Race | 307 | 2.8% |
| Total | 10,834 | 100.0% |
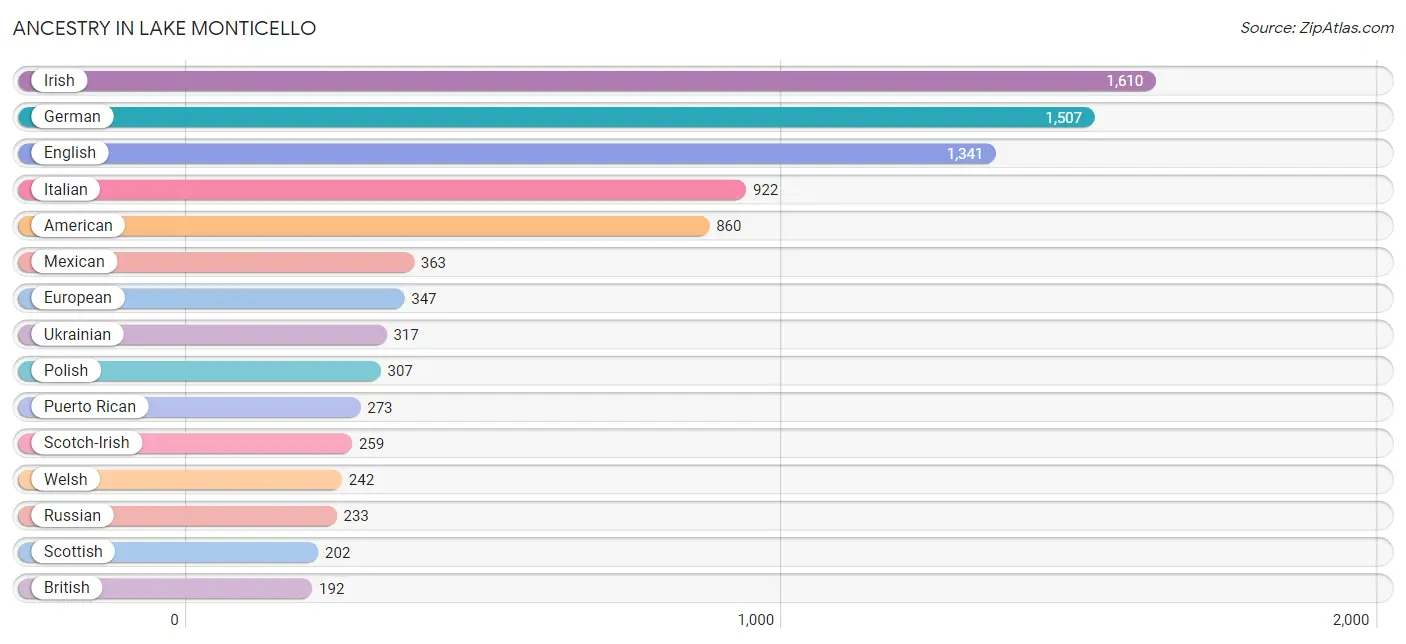
Ancestry in Lake Monticello
The most populous ancestries reported in Lake Monticello are Irish (1,610 | 14.9%), German (1,507 | 13.9%), English (1,341 | 12.4%), Italian (922 | 8.5%), and American (860 | 7.9%), together accounting for 57.6% of all Lake Monticello residents.
| Ancestry | # Population | % Population |
| American | 860 | 7.9% |
| Arab | 13 | 0.1% |
| Bhutanese | 141 | 1.3% |
| British | 192 | 1.8% |
| Burmese | 60 | 0.5% |
| Canadian | 31 | 0.3% |
| Cherokee | 62 | 0.6% |
| Czech | 9 | 0.1% |
| Danish | 52 | 0.5% |
| Dominican | 49 | 0.4% |
| Dutch | 62 | 0.6% |
| Eastern European | 21 | 0.2% |
| English | 1,341 | 12.4% |
| European | 347 | 3.2% |
| French | 158 | 1.5% |
| French American Indian | 11 | 0.1% |
| French Canadian | 138 | 1.3% |
| German | 1,507 | 13.9% |
| Greek | 179 | 1.7% |
| Hungarian | 130 | 1.2% |
| Irish | 1,610 | 14.9% |
| Italian | 922 | 8.5% |
| Korean | 26 | 0.2% |
| Lithuanian | 15 | 0.1% |
| Mexican | 363 | 3.4% |
| Norwegian | 78 | 0.7% |
| Pakistani | 5 | 0.1% |
| Palestinian | 13 | 0.1% |
| Polish | 307 | 2.8% |
| Puerto Rican | 273 | 2.5% |
| Romanian | 10 | 0.1% |
| Russian | 233 | 2.1% |
| Samoan | 23 | 0.2% |
| Scandinavian | 154 | 1.4% |
| Scotch-Irish | 259 | 2.4% |
| Scottish | 202 | 1.9% |
| Spaniard | 93 | 0.9% |
| Swedish | 184 | 1.7% |
| Thai | 26 | 0.2% |
| Ukrainian | 317 | 2.9% |
| Welsh | 242 | 2.2% | View All 41 Rows |
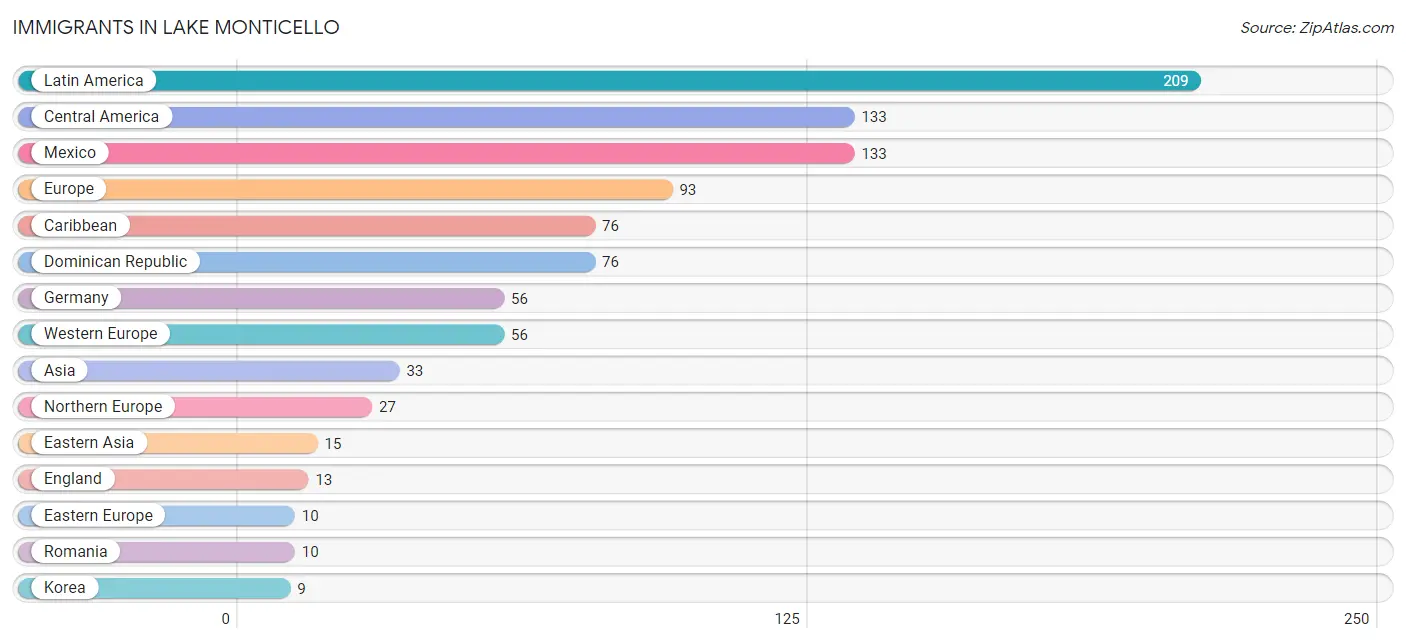
Immigrants in Lake Monticello
The most numerous immigrant groups reported in Lake Monticello came from Latin America (209 | 1.9%), Central America (133 | 1.2%), Mexico (133 | 1.2%), Europe (93 | 0.9%), and Caribbean (76 | 0.7%), together accounting for 6.0% of all Lake Monticello residents.
| Immigration Origin | # Population | % Population |
| Asia | 33 | 0.3% |
| Caribbean | 76 | 0.7% |
| Central America | 133 | 1.2% |
| Dominican Republic | 76 | 0.7% |
| Eastern Asia | 15 | 0.1% |
| Eastern Europe | 10 | 0.1% |
| England | 13 | 0.1% |
| Europe | 93 | 0.9% |
| Germany | 56 | 0.5% |
| Japan | 6 | 0.1% |
| Korea | 9 | 0.1% |
| Latin America | 209 | 1.9% |
| Mexico | 133 | 1.2% |
| Northern Europe | 27 | 0.3% |
| Romania | 10 | 0.1% |
| South Eastern Asia | 5 | 0.1% |
| Thailand | 5 | 0.1% |
| Western Europe | 56 | 0.5% | View All 18 Rows |
Sex and Age in Lake Monticello
Sex and Age in Lake Monticello
The most populous age groups in Lake Monticello are 35 to 39 Years (460 | 9.3%) for men and Under 5 Years (550 | 9.4%) for women.
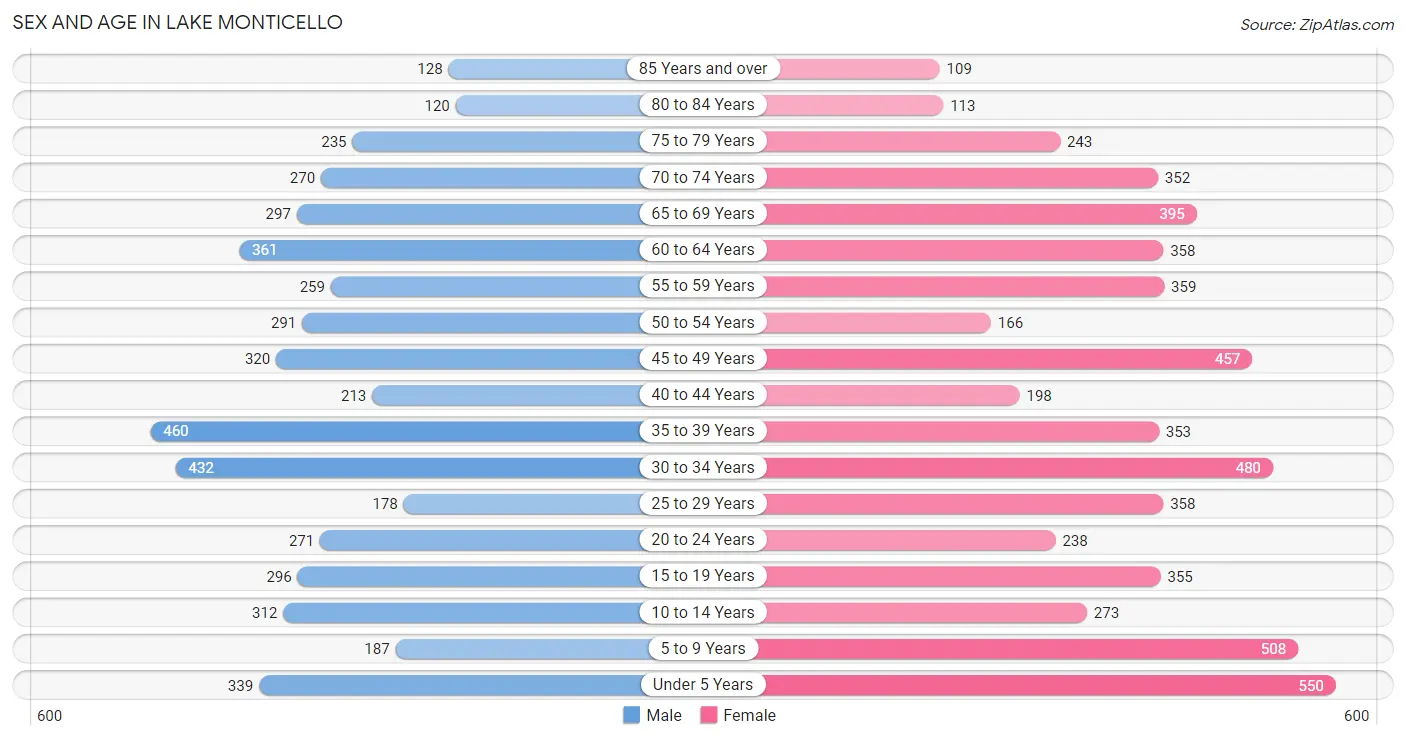
| Age Bracket | Male | Female |
| Under 5 Years | 339 (6.8%) | 550 (9.4%) |
| 5 to 9 Years | 187 (3.8%) | 508 (8.7%) |
| 10 to 14 Years | 312 (6.3%) | 273 (4.6%) |
| 15 to 19 Years | 296 (6.0%) | 355 (6.0%) |
| 20 to 24 Years | 271 (5.4%) | 238 (4.1%) |
| 25 to 29 Years | 178 (3.6%) | 358 (6.1%) |
| 30 to 34 Years | 432 (8.7%) | 480 (8.2%) |
| 35 to 39 Years | 460 (9.3%) | 353 (6.0%) |
| 40 to 44 Years | 213 (4.3%) | 198 (3.4%) |
| 45 to 49 Years | 320 (6.4%) | 457 (7.8%) |
| 50 to 54 Years | 291 (5.9%) | 166 (2.8%) |
| 55 to 59 Years | 259 (5.2%) | 359 (6.1%) |
| 60 to 64 Years | 361 (7.3%) | 358 (6.1%) |
| 65 to 69 Years | 297 (6.0%) | 395 (6.7%) |
| 70 to 74 Years | 270 (5.4%) | 352 (6.0%) |
| 75 to 79 Years | 235 (4.7%) | 243 (4.1%) |
| 80 to 84 Years | 120 (2.4%) | 113 (1.9%) |
| 85 Years and over | 128 (2.6%) | 109 (1.9%) |
| Total | 4,969 (100.0%) | 5,865 (100.0%) |
Families and Households in Lake Monticello
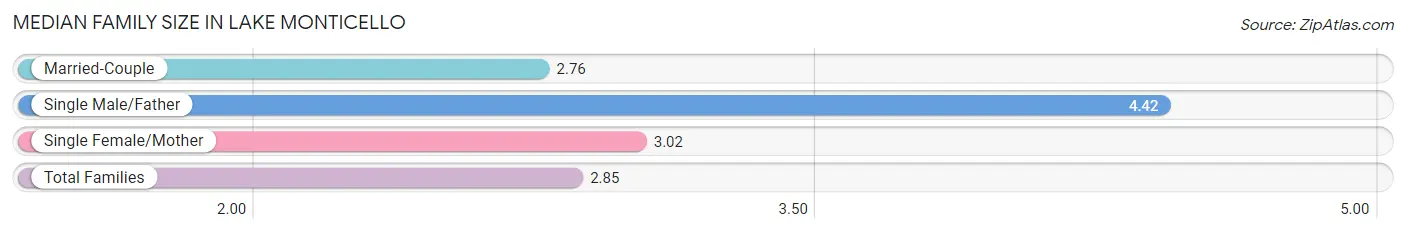
Median Family Size in Lake Monticello
The median family size in Lake Monticello is 2.85 persons per family, with single male/father families (95 | 3.0%) accounting for the largest median family size of 4.42 persons per family. On the other hand, married-couple families (2,579 | 81.5%) represent the smallest median family size with 2.76 persons per family.
| Family Type | # Families | Family Size |
| Married-Couple | 2,579 (81.5%) | 2.76 |
| Single Male/Father | 95 (3.0%) | 4.42 |
| Single Female/Mother | 491 (15.5%) | 3.02 |
| Total Families | 3,165 (100.0%) | 2.85 |
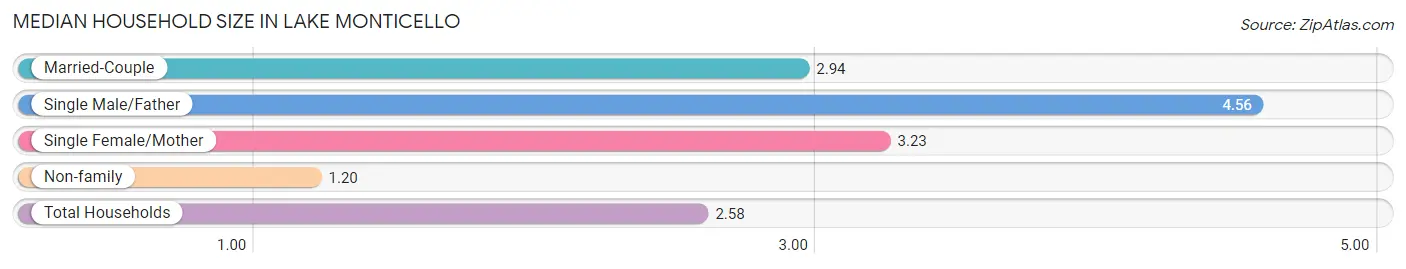
Median Household Size in Lake Monticello
The median household size in Lake Monticello is 2.58 persons per household, with single male/father households (95 | 2.3%) accounting for the largest median household size of 4.56 persons per household. non-family households (1,035 | 24.6%) represent the smallest median household size with 1.20 persons per household.
| Household Type | # Households | Household Size |
| Married-Couple | 2,579 (61.4%) | 2.94 |
| Single Male/Father | 95 (2.3%) | 4.56 |
| Single Female/Mother | 491 (11.7%) | 3.23 |
| Non-family | 1,035 (24.6%) | 1.20 |
| Total Households | 4,200 (100.0%) | 2.58 |
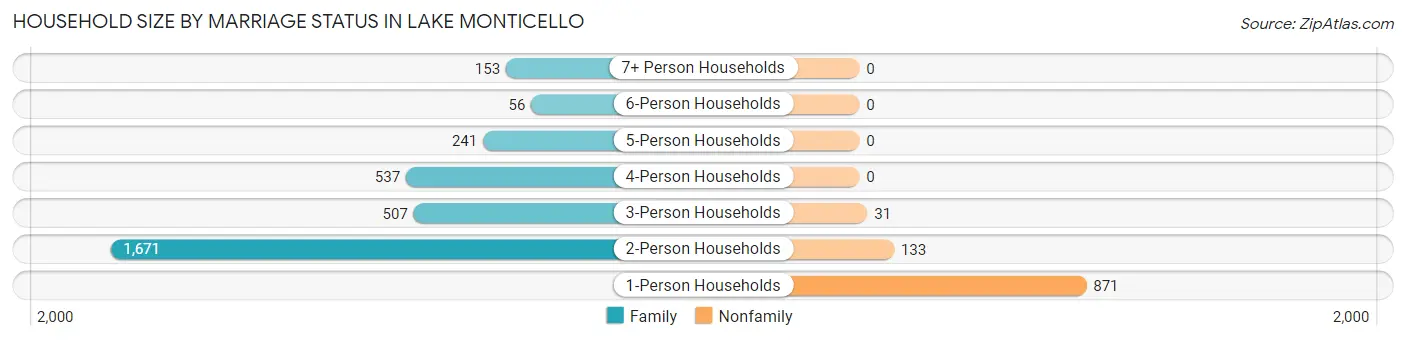
Household Size by Marriage Status in Lake Monticello
Out of a total of 4,200 households in Lake Monticello, 3,165 (75.4%) are family households, while 1,035 (24.6%) are nonfamily households. The most numerous type of family households are 2-person households, comprising 1,671, and the most common type of nonfamily households are 1-person households, comprising 871.
| Household Size | Family Households | Nonfamily Households |
| 1-Person Households | - | 871 (20.7%) |
| 2-Person Households | 1,671 (39.8%) | 133 (3.2%) |
| 3-Person Households | 507 (12.1%) | 31 (0.7%) |
| 4-Person Households | 537 (12.8%) | 0 (0.0%) |
| 5-Person Households | 241 (5.7%) | 0 (0.0%) |
| 6-Person Households | 56 (1.3%) | 0 (0.0%) |
| 7+ Person Households | 153 (3.6%) | 0 (0.0%) |
| Total | 3,165 (75.4%) | 1,035 (24.6%) |
Female Fertility in Lake Monticello
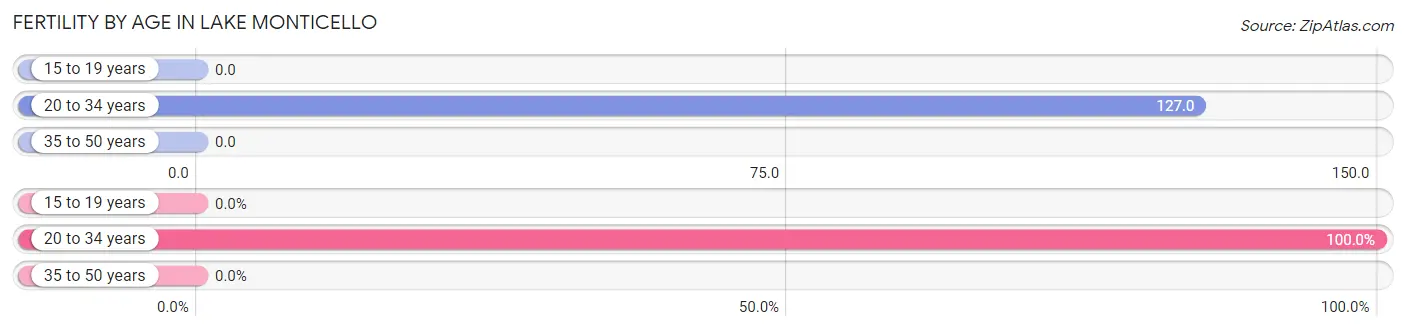
Fertility by Age in Lake Monticello
Average fertility rate in Lake Monticello is 56.0 births per 1,000 women. Women in the age bracket of 20 to 34 years have the highest fertility rate with 127.0 births per 1,000 women. Women in the age bracket of 20 to 34 years acount for 100.0% of all women with births.
| Age Bracket | Women with Births | Births / 1,000 Women |
| 15 to 19 years | 0 (0.0%) | 0.0 |
| 20 to 34 years | 137 (100.0%) | 127.0 |
| 35 to 50 years | 0 (0.0%) | 0.0 |
| Total | 137 (100.0%) | 56.0 |
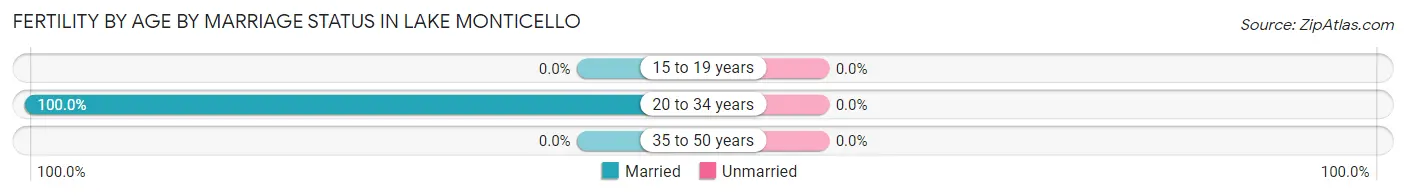
Fertility by Age by Marriage Status in Lake Monticello
| Age Bracket | Married | Unmarried |
| 15 to 19 years | 0 (0.0%) | 0 (0.0%) |
| 20 to 34 years | 137 (100.0%) | 0 (0.0%) |
| 35 to 50 years | 0 (0.0%) | 0 (0.0%) |
| Total | 137 (100.0%) | 0 (0.0%) |
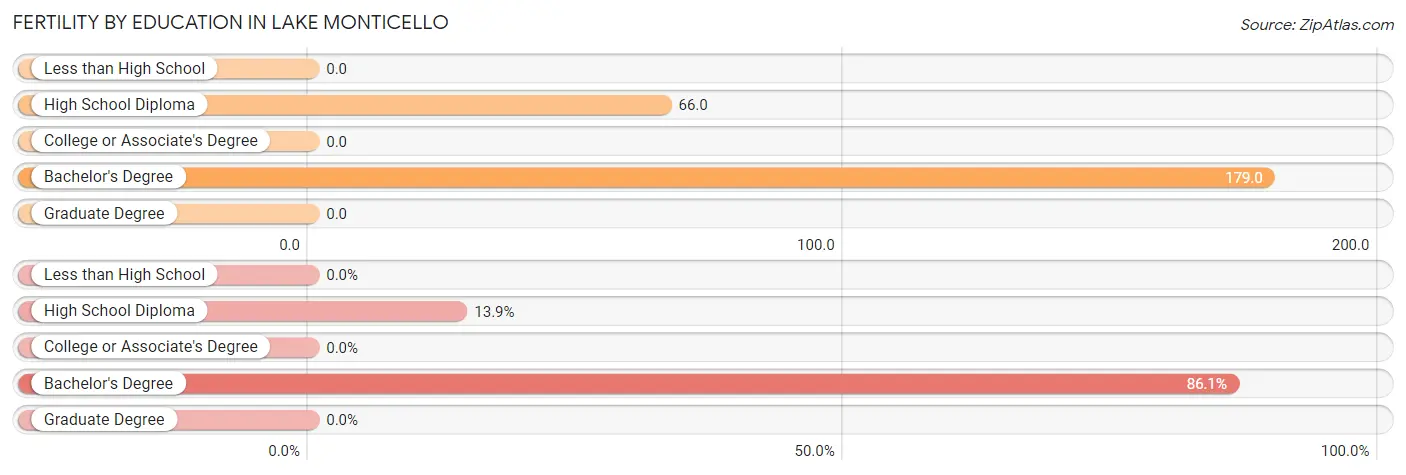
Fertility by Education in Lake Monticello
| Educational Attainment | Women with Births | Births / 1,000 Women |
| Less than High School | 0 (0.0%) | 0.0 |
| High School Diploma | 19 (13.9%) | 66.0 |
| College or Associate's Degree | 0 (0.0%) | 0.0 |
| Bachelor's Degree | 118 (86.1%) | 179.0 |
| Graduate Degree | 0 (0.0%) | 0.0 |
| Total | 137 (100.0%) | 56.0 |
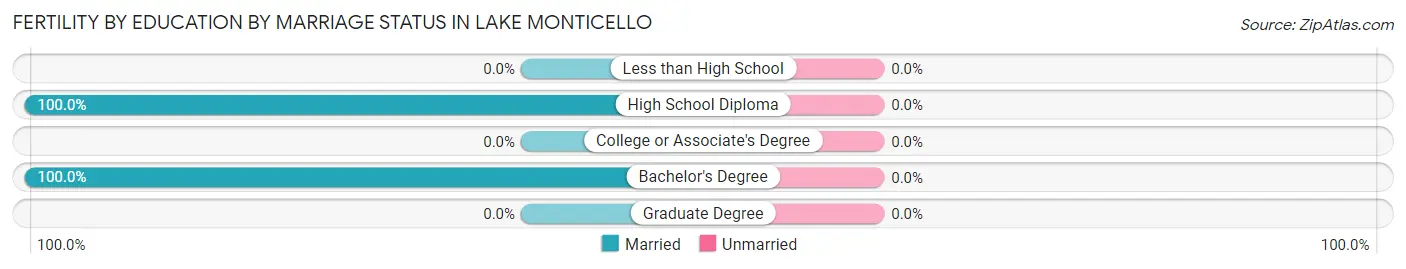
Fertility by Education by Marriage Status in Lake Monticello
| Educational Attainment | Married | Unmarried |
| Less than High School | 0 (0.0%) | 0 (0.0%) |
| High School Diploma | 19 (100.0%) | 0 (0.0%) |
| College or Associate's Degree | 0 (0.0%) | 0 (0.0%) |
| Bachelor's Degree | 118 (100.0%) | 0 (0.0%) |
| Graduate Degree | 0 (0.0%) | 0 (0.0%) |
| Total | 137 (100.0%) | 0 (0.0%) |
Income in Lake Monticello
Income Overview in Lake Monticello
Per Capita Income in Lake Monticello is $64,305, while median incomes of families and households are $103,860 and $98,848 respectively.
| Characteristic | Number | Measure |
| Per Capita Income | 10,834 | $64,305 |
| Median Family Income | 3,165 | $103,860 |
| Mean Family Income | 3,165 | $181,914 |
| Median Household Income | 4,200 | $98,848 |
| Mean Household Income | 4,200 | $159,210 |
| Income Deficit | 3,165 | $6,348 |
| Wage / Income Gap (%) | 10,834 | 42.36% |
| Wage / Income Gap ($) | 10,834 | 57.64¢ per $1 |
| Gini / Inequality Index | 10,834 | 0.53 |
Earnings by Sex in Lake Monticello
Average Earnings in Lake Monticello are $49,083, $69,250 for men and $39,915 for women, a difference of 42.4%.
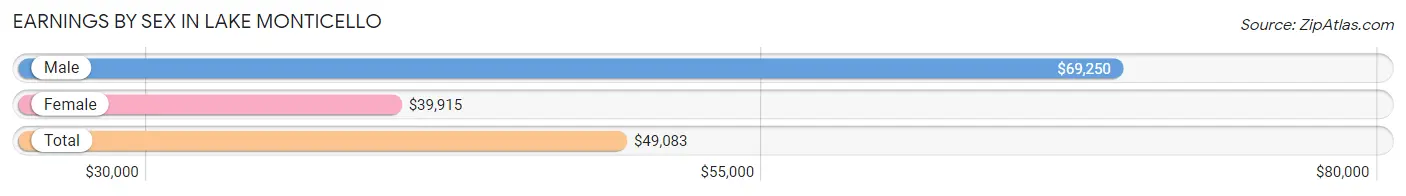
| Sex | Number | Average Earnings |
| Male | 2,837 (51.1%) | $69,250 |
| Female | 2,710 (48.9%) | $39,915 |
| Total | 5,547 (100.0%) | $49,083 |
Earnings by Sex by Income Bracket in Lake Monticello
The most common earnings brackets in Lake Monticello are $100,000+ for men (786 | 27.7%) and $50,000 to $54,999 for women (362 | 13.4%).
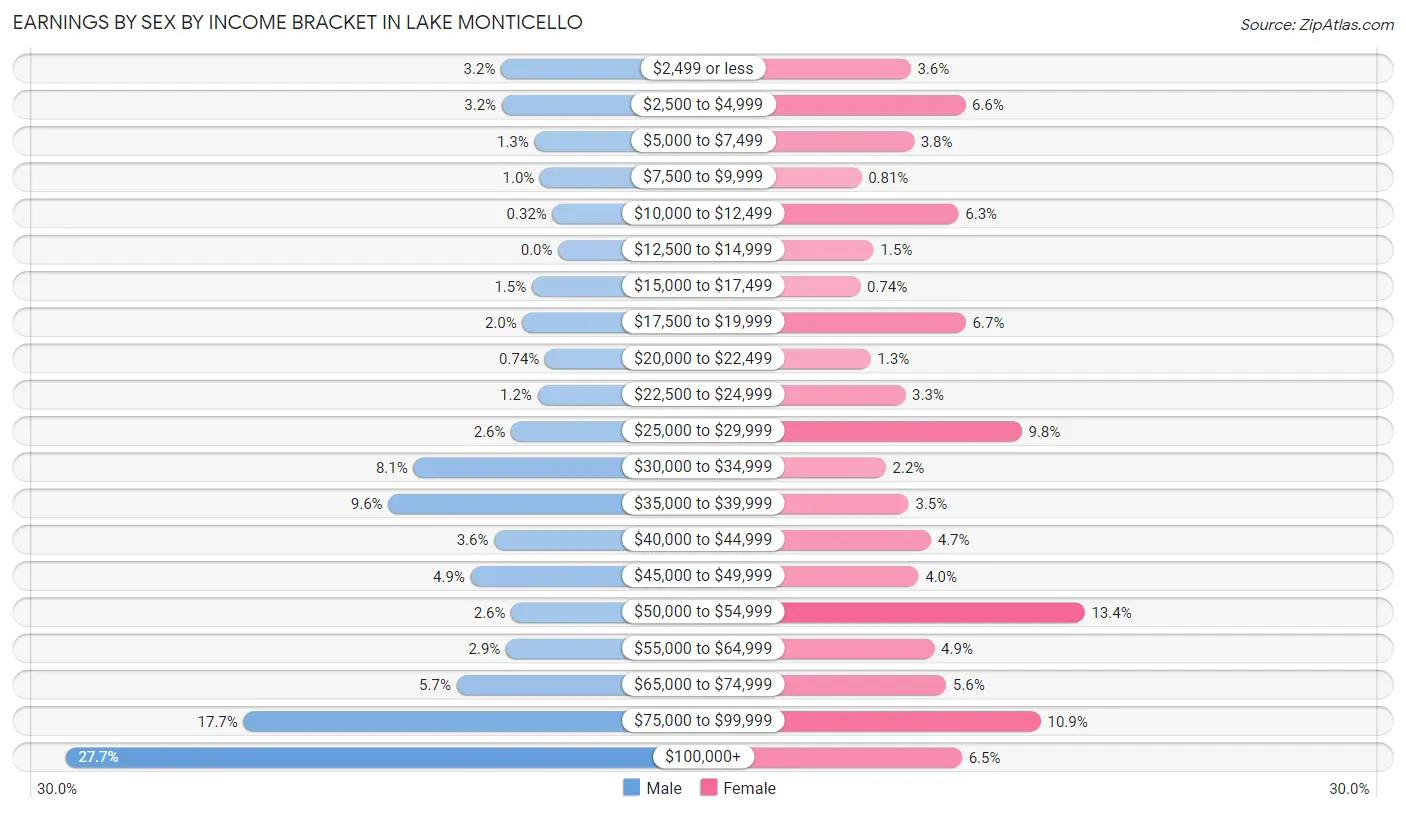
| Income | Male | Female |
| $2,499 or less | 91 (3.2%) | 97 (3.6%) |
| $2,500 to $4,999 | 90 (3.2%) | 180 (6.6%) |
| $5,000 to $7,499 | 38 (1.3%) | 102 (3.8%) |
| $7,500 to $9,999 | 29 (1.0%) | 22 (0.8%) |
| $10,000 to $12,499 | 9 (0.3%) | 170 (6.3%) |
| $12,500 to $14,999 | 0 (0.0%) | 41 (1.5%) |
| $15,000 to $17,499 | 42 (1.5%) | 20 (0.7%) |
| $17,500 to $19,999 | 57 (2.0%) | 181 (6.7%) |
| $20,000 to $22,499 | 21 (0.7%) | 36 (1.3%) |
| $22,500 to $24,999 | 33 (1.2%) | 89 (3.3%) |
| $25,000 to $29,999 | 75 (2.6%) | 266 (9.8%) |
| $30,000 to $34,999 | 231 (8.1%) | 59 (2.2%) |
| $35,000 to $39,999 | 271 (9.6%) | 94 (3.5%) |
| $40,000 to $44,999 | 102 (3.6%) | 128 (4.7%) |
| $45,000 to $49,999 | 140 (4.9%) | 109 (4.0%) |
| $50,000 to $54,999 | 75 (2.6%) | 362 (13.4%) |
| $55,000 to $64,999 | 83 (2.9%) | 133 (4.9%) |
| $65,000 to $74,999 | 162 (5.7%) | 151 (5.6%) |
| $75,000 to $99,999 | 502 (17.7%) | 295 (10.9%) |
| $100,000+ | 786 (27.7%) | 175 (6.5%) |
| Total | 2,837 (100.0%) | 2,710 (100.0%) |
Earnings by Sex by Educational Attainment in Lake Monticello
Average earnings in Lake Monticello are $77,880 for men and $49,114 for women, a difference of 36.9%. Men with an educational attainment of graduate degree enjoy the highest average annual earnings of $142,625, while those with college or associate's degree education earn the least with $44,893. Women with an educational attainment of graduate degree earn the most with the average annual earnings of $52,055, while those with high school diploma education have the smallest earnings of $35,521.
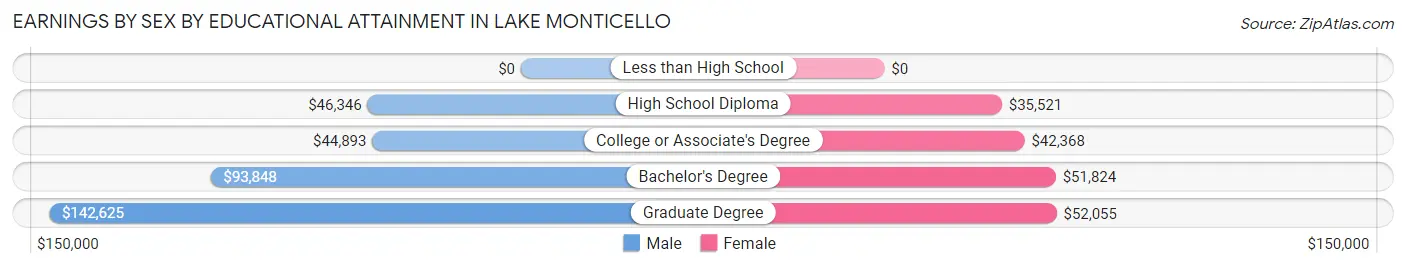
| Educational Attainment | Male Income | Female Income |
| Less than High School | - | - |
| High School Diploma | $46,346 | $35,521 |
| College or Associate's Degree | $44,893 | $42,368 |
| Bachelor's Degree | $93,848 | $51,824 |
| Graduate Degree | $142,625 | $52,055 |
| Total | $77,880 | $49,114 |
Family Income in Lake Monticello
Family Income Brackets in Lake Monticello
According to the Lake Monticello family income data, there are 766 families falling into the $100,000 to $149,999 income range, which is the most common income bracket and makes up 24.2% of all families.
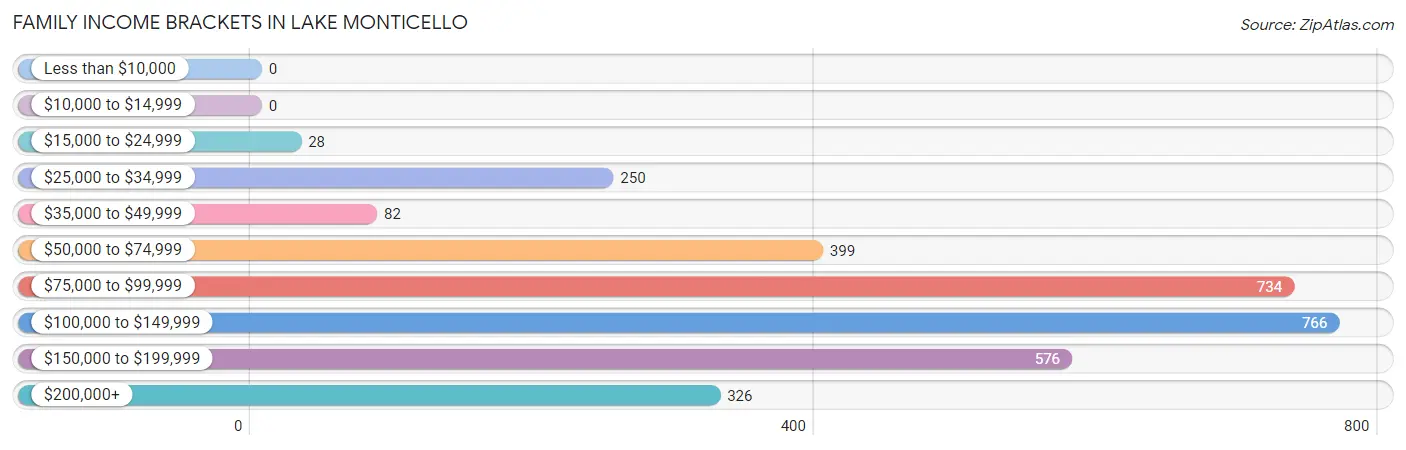
| Income Bracket | # Families | % Families |
| Less than $10,000 | 0 | 0.0% |
| $10,000 to $14,999 | 0 | 0.0% |
| $15,000 to $24,999 | 28 | 0.9% |
| $25,000 to $34,999 | 250 | 7.9% |
| $35,000 to $49,999 | 82 | 2.6% |
| $50,000 to $74,999 | 399 | 12.6% |
| $75,000 to $99,999 | 734 | 23.2% |
| $100,000 to $149,999 | 766 | 24.2% |
| $150,000 to $199,999 | 576 | 18.2% |
| $200,000+ | 326 | 10.3% |
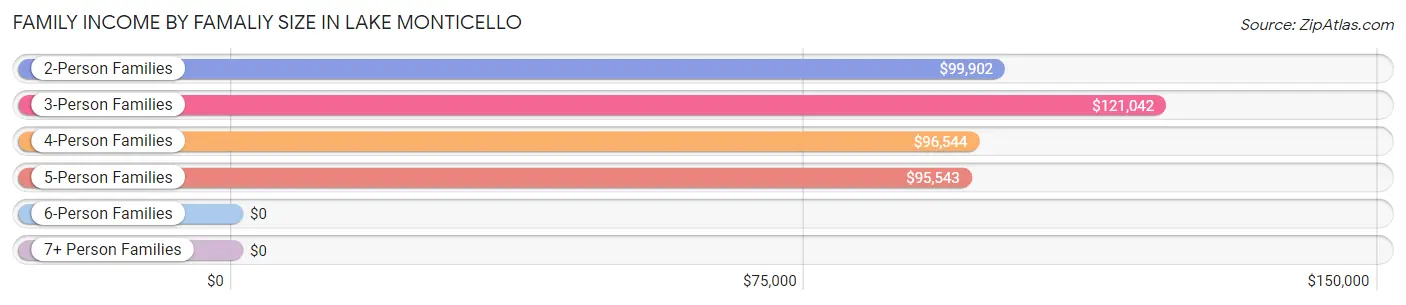
Family Income by Famaliy Size in Lake Monticello
3-person families (600 | 19.0%) account for the highest median family income in Lake Monticello with $121,042 per family, while 2-person families (1,729 | 54.6%) have the highest median income of $49,951 per family member.
| Income Bracket | # Families | Median Income |
| 2-Person Families | 1,729 (54.6%) | $99,902 |
| 3-Person Families | 600 (19.0%) | $121,042 |
| 4-Person Families | 520 (16.4%) | $96,544 |
| 5-Person Families | 244 (7.7%) | $95,543 |
| 6-Person Families | 10 (0.3%) | $0 |
| 7+ Person Families | 62 (2.0%) | $0 |
| Total | 3,165 (100.0%) | $103,860 |
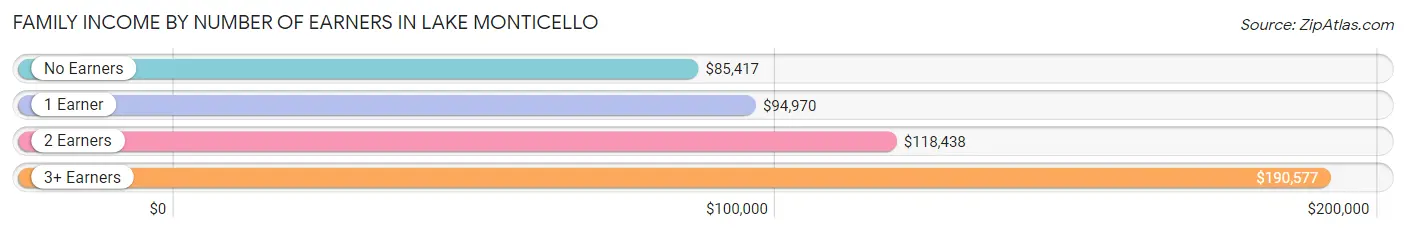
Family Income by Number of Earners in Lake Monticello
The median family income in Lake Monticello is $103,860, with families comprising 3+ earners (270) having the highest median family income of $190,577, while families with no earners (613) have the lowest median family income of $85,417, accounting for 8.5% and 19.4% of families, respectively.
| Number of Earners | # Families | Median Income |
| No Earners | 613 (19.4%) | $85,417 |
| 1 Earner | 1,003 (31.7%) | $94,970 |
| 2 Earners | 1,279 (40.4%) | $118,438 |
| 3+ Earners | 270 (8.5%) | $190,577 |
| Total | 3,165 (100.0%) | $103,860 |
Household Income in Lake Monticello
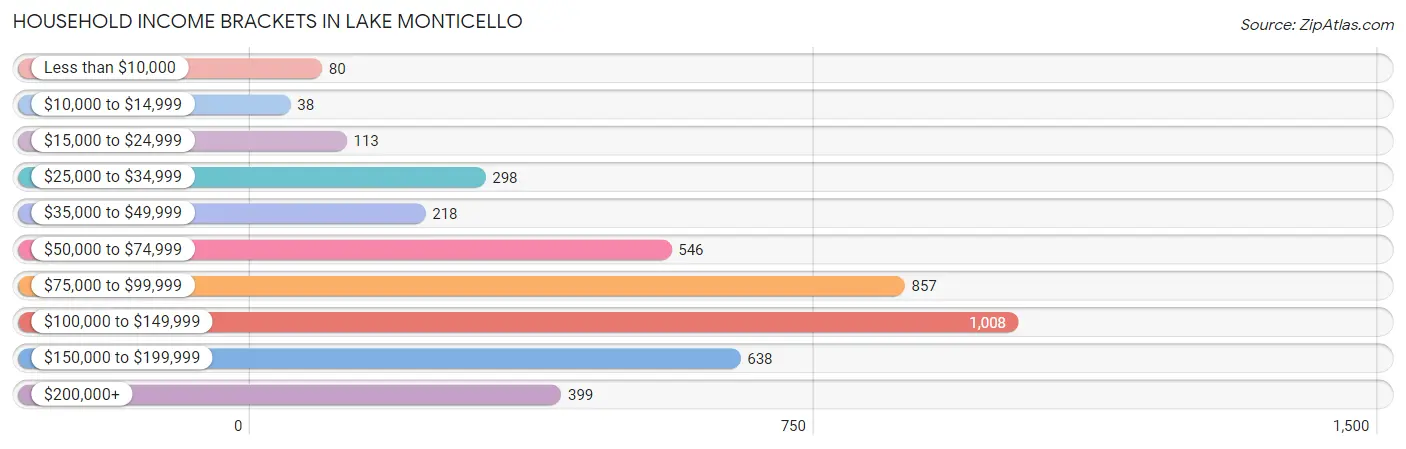
Household Income Brackets in Lake Monticello
With 1,008 households falling in the category, the $100,000 to $149,999 income range is the most frequent in Lake Monticello, accounting for 24.0% of all households. In contrast, only 38 households (0.9%) fall into the $10,000 to $14,999 income bracket, making it the least populous group.
| Income Bracket | # Households | % Households |
| Less than $10,000 | 80 | 1.9% |
| $10,000 to $14,999 | 38 | 0.9% |
| $15,000 to $24,999 | 113 | 2.7% |
| $25,000 to $34,999 | 298 | 7.1% |
| $35,000 to $49,999 | 218 | 5.2% |
| $50,000 to $74,999 | 546 | 13.0% |
| $75,000 to $99,999 | 857 | 20.4% |
| $100,000 to $149,999 | 1,008 | 24.0% |
| $150,000 to $199,999 | 638 | 15.2% |
| $200,000+ | 399 | 9.5% |
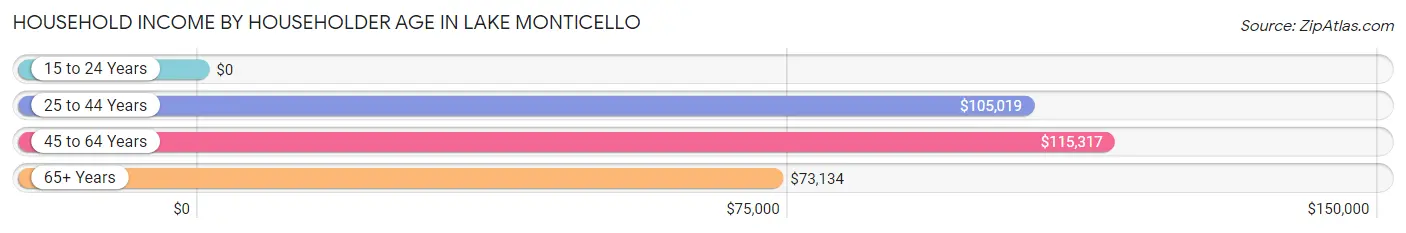
Household Income by Householder Age in Lake Monticello
The median household income in Lake Monticello is $98,848, with the highest median household income of $115,317 found in the 45 to 64 years age bracket for the primary householder. A total of 1,461 households (34.8%) fall into this category.
| Income Bracket | # Households | Median Income |
| 15 to 24 Years | 0 (0.0%) | $0 |
| 25 to 44 Years | 1,365 (32.5%) | $105,019 |
| 45 to 64 Years | 1,461 (34.8%) | $115,317 |
| 65+ Years | 1,374 (32.7%) | $73,134 |
| Total | 4,200 (100.0%) | $98,848 |
Poverty in Lake Monticello
Income Below Poverty by Sex and Age in Lake Monticello
With 6.9% poverty level for males and 6.1% for females among the residents of Lake Monticello, 15 year old males and 16 and 17 year old females are the most vulnerable to poverty, with 24 males (42.9%) and 35 females (19.9%) in their respective age groups living below the poverty level.
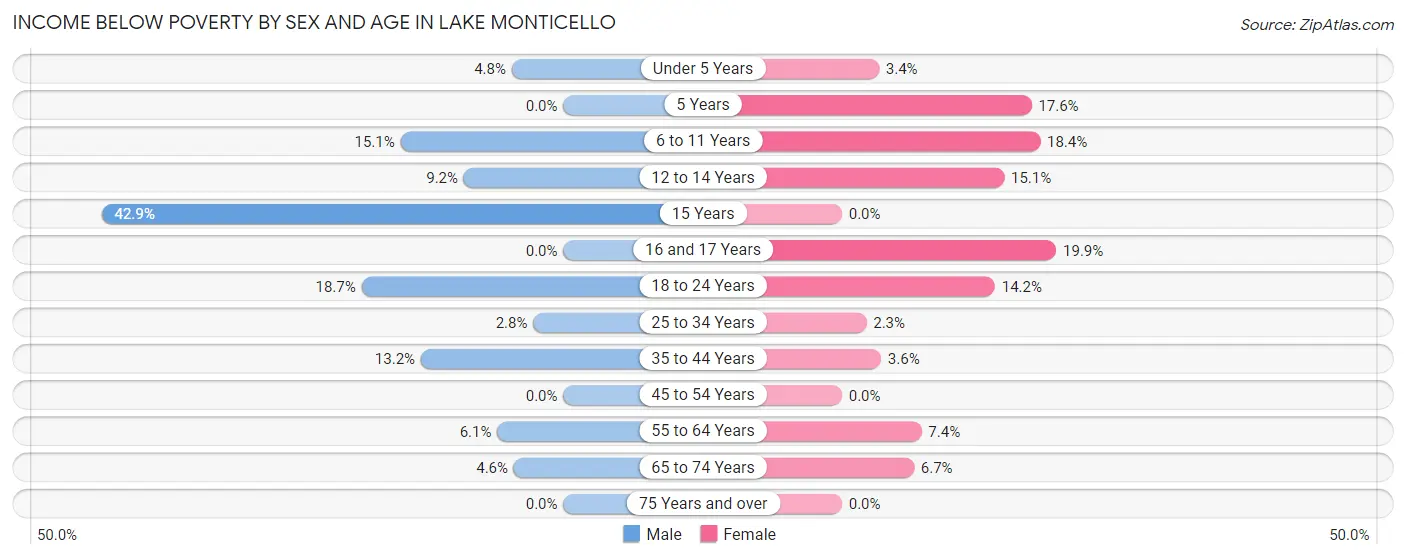
| Age Bracket | Male | Female |
| Under 5 Years | 13 (4.8%) | 16 (3.4%) |
| 5 Years | 0 (0.0%) | 22 (17.6%) |
| 6 to 11 Years | 42 (15.1%) | 46 (18.4%) |
| 12 to 14 Years | 18 (9.2%) | 25 (15.1%) |
| 15 Years | 24 (42.9%) | 0 (0.0%) |
| 16 and 17 Years | 0 (0.0%) | 35 (19.9%) |
| 18 to 24 Years | 71 (18.7%) | 50 (14.2%) |
| 25 to 34 Years | 17 (2.8%) | 19 (2.3%) |
| 35 to 44 Years | 89 (13.2%) | 20 (3.6%) |
| 45 to 54 Years | 0 (0.0%) | 0 (0.0%) |
| 55 to 64 Years | 38 (6.1%) | 53 (7.4%) |
| 65 to 74 Years | 26 (4.6%) | 50 (6.7%) |
| 75 Years and over | 0 (0.0%) | 0 (0.0%) |
| Total | 338 (6.9%) | 336 (6.1%) |
Income Above Poverty by Sex and Age in Lake Monticello
According to the poverty statistics in Lake Monticello, males aged 5 years and females aged 15 years are the age groups that are most secure financially, with 100.0% of males and 100.0% of females in these age groups living above the poverty line.
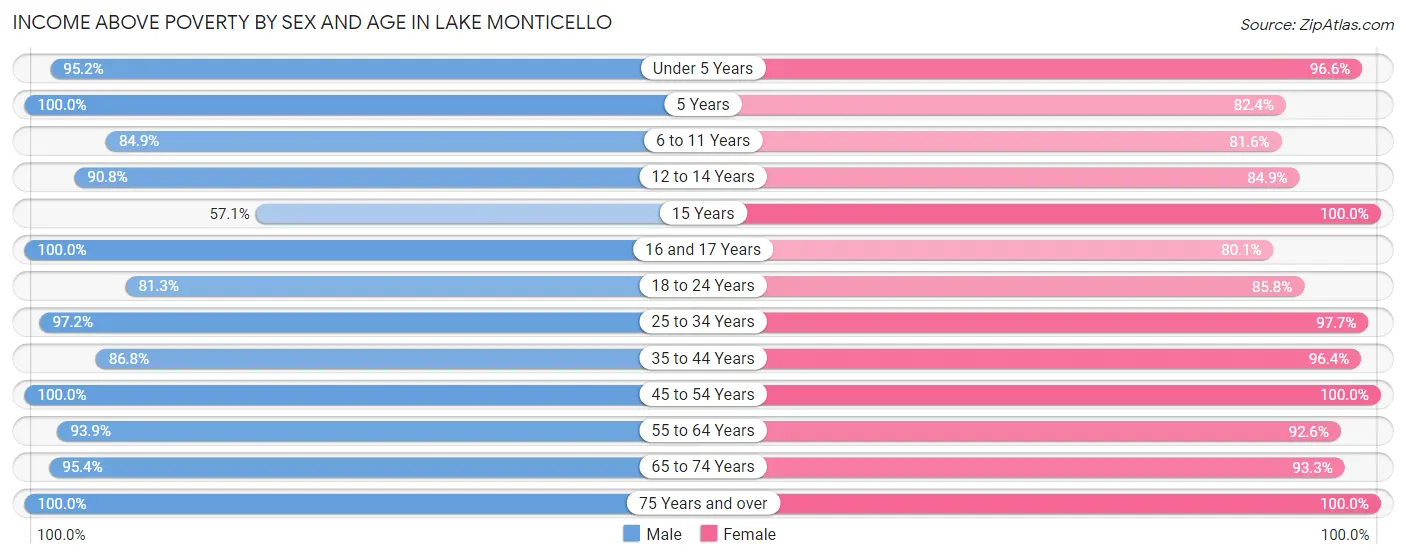
| Age Bracket | Male | Female |
| Under 5 Years | 259 (95.2%) | 449 (96.6%) |
| 5 Years | 26 (100.0%) | 103 (82.4%) |
| 6 to 11 Years | 236 (84.9%) | 204 (81.6%) |
| 12 to 14 Years | 177 (90.8%) | 141 (84.9%) |
| 15 Years | 32 (57.1%) | 65 (100.0%) |
| 16 and 17 Years | 132 (100.0%) | 141 (80.1%) |
| 18 to 24 Years | 308 (81.3%) | 302 (85.8%) |
| 25 to 34 Years | 593 (97.2%) | 819 (97.7%) |
| 35 to 44 Years | 584 (86.8%) | 531 (96.4%) |
| 45 to 54 Years | 611 (100.0%) | 623 (100.0%) |
| 55 to 64 Years | 582 (93.9%) | 664 (92.6%) |
| 65 to 74 Years | 541 (95.4%) | 697 (93.3%) |
| 75 Years and over | 483 (100.0%) | 465 (100.0%) |
| Total | 4,564 (93.1%) | 5,204 (93.9%) |
Income Below Poverty Among Married-Couple Families in Lake Monticello
The poverty statistics for married-couple families in Lake Monticello show that 4.2% or 107 of the total 2,579 families live below the poverty line. Families with 5 or more children have the highest poverty rate of 51.2%, comprising of 21 families. On the other hand, families with 1 or 2 children have the lowest poverty rate of 0.0%, which includes 0 families.
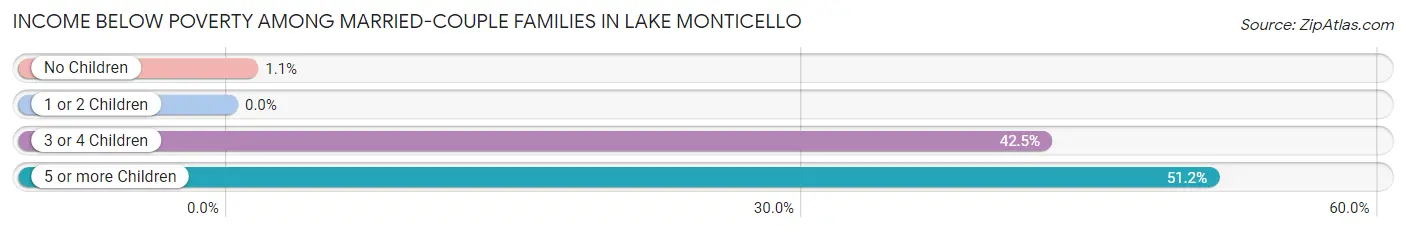
| Children | Above Poverty | Below Poverty |
| No Children | 1,678 (98.9%) | 18 (1.1%) |
| 1 or 2 Children | 682 (100.0%) | 0 (0.0%) |
| 3 or 4 Children | 92 (57.5%) | 68 (42.5%) |
| 5 or more Children | 20 (48.8%) | 21 (51.2%) |
| Total | 2,472 (95.9%) | 107 (4.2%) |
Income Below Poverty Among Single-Parent Households in Lake Monticello
| Children | Single Father | Single Mother |
| No Children | 0 (0.0%) | 0 (0.0%) |
| 1 or 2 Children | 0 (0.0%) | 0 (0.0%) |
| 3 or 4 Children | 0 (0.0%) | 0 (0.0%) |
| 5 or more Children | 0 (0.0%) | 0 (0.0%) |
| Total | 0 (0.0%) | 0 (0.0%) |
Income Below Poverty Among Married-Couple vs Single-Parent Households in Lake Monticello
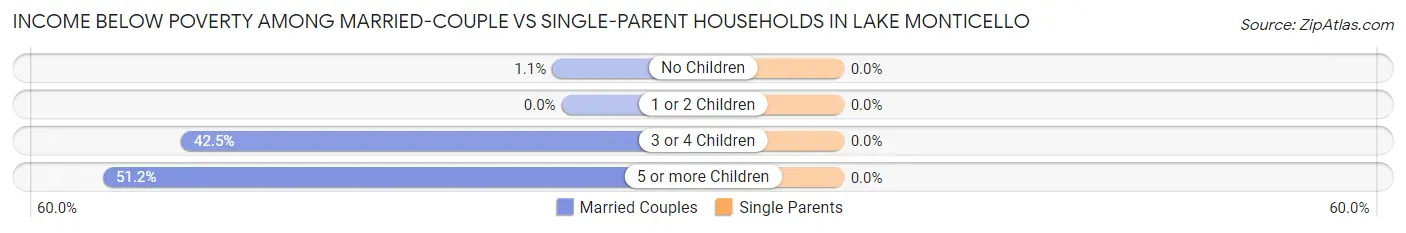
| Children | Married-Couple Families | Single-Parent Households |
| No Children | 18 (1.1%) | 0 (0.0%) |
| 1 or 2 Children | 0 (0.0%) | 0 (0.0%) |
| 3 or 4 Children | 68 (42.5%) | 0 (0.0%) |
| 5 or more Children | 21 (51.2%) | 0 (0.0%) |
| Total | 107 (4.2%) | 0 (0.0%) |
Employment Characteristics in Lake Monticello
Employment by Class of Employer in Lake Monticello
Among the 5,036 employed individuals in Lake Monticello, private company employees (3,217 | 63.9%), local government employees (567 | 11.3%), and state government employees (381 | 7.6%) make up the most common classes of employment.
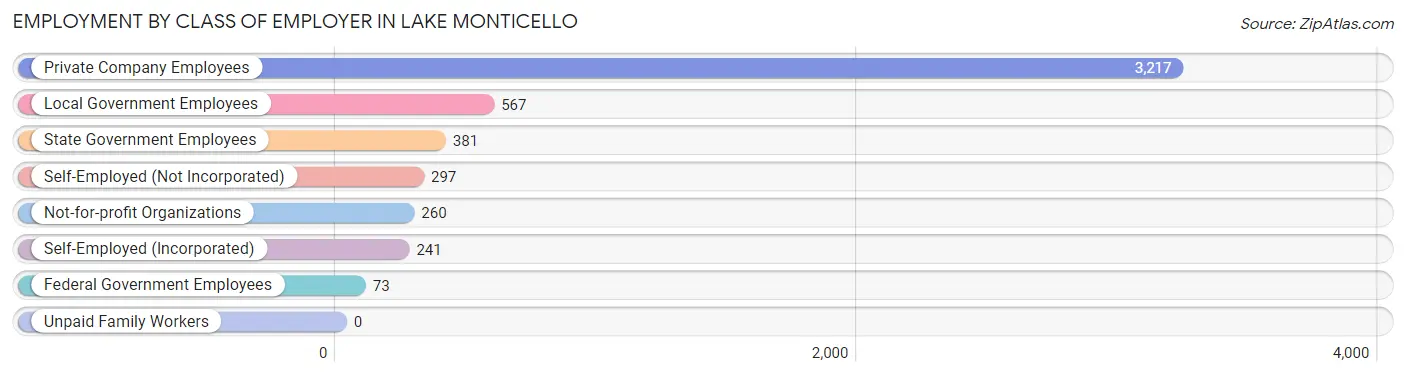
| Employer Class | # Employees | % Employees |
| Private Company Employees | 3,217 | 63.9% |
| Self-Employed (Incorporated) | 241 | 4.8% |
| Self-Employed (Not Incorporated) | 297 | 5.9% |
| Not-for-profit Organizations | 260 | 5.2% |
| Local Government Employees | 567 | 11.3% |
| State Government Employees | 381 | 7.6% |
| Federal Government Employees | 73 | 1.5% |
| Unpaid Family Workers | 0 | 0.0% |
| Total | 5,036 | 100.0% |
Employment Status by Age in Lake Monticello
According to the labor force statistics for Lake Monticello, out of the total population over 16 years of age (8,544), 61.2% or 5,229 individuals are in the labor force, with 1.6% or 84 of them unemployed. The age group with the highest labor force participation rate is 45 to 54 years, with 90.1% or 1,112 individuals in the labor force. Within the labor force, the 20 to 24 years age range has the highest percentage of unemployed individuals, with 14.7% or 65 of them being unemployed.
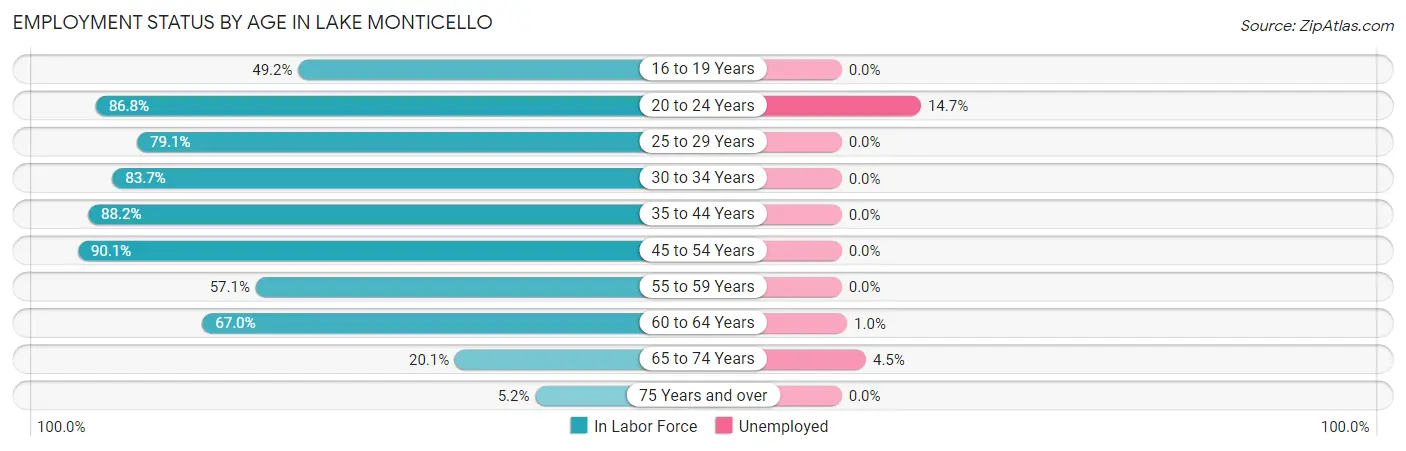
| Age Bracket | In Labor Force | Unemployed |
| 16 to 19 Years | 261 (49.2%) | 0 (0.0%) |
| 20 to 24 Years | 442 (86.8%) | 65 (14.7%) |
| 25 to 29 Years | 424 (79.1%) | 0 (0.0%) |
| 30 to 34 Years | 763 (83.7%) | 0 (0.0%) |
| 35 to 44 Years | 1,080 (88.2%) | 0 (0.0%) |
| 45 to 54 Years | 1,112 (90.1%) | 0 (0.0%) |
| 55 to 59 Years | 353 (57.1%) | 0 (0.0%) |
| 60 to 64 Years | 482 (67.0%) | 5 (1.0%) |
| 65 to 74 Years | 264 (20.1%) | 12 (4.5%) |
| 75 Years and over | 49 (5.2%) | 0 (0.0%) |
| Total | 5,229 (61.2%) | 84 (1.6%) |
Employment Status by Educational Attainment in Lake Monticello
According to labor force statistics for Lake Monticello, 80.4% of individuals (4,215) out of the total population between 25 and 64 years of age (5,243) are in the labor force, with 0.1% or 4 of them being unemployed. The group with the highest labor force participation rate are those with the educational attainment of college / associate degree, with 84.9% or 1,635 individuals in the labor force. Within the labor force, individuals with college / associate degree education have the highest percentage of unemployment, with 0.3% or 5 of them being unemployed.
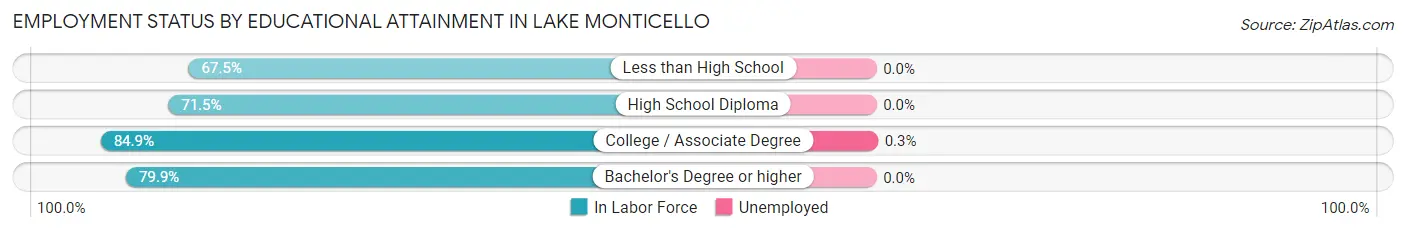
| Educational Attainment | In Labor Force | Unemployed |
| Less than High School | 52 (67.5%) | 0 (0.0%) |
| High School Diploma | 530 (71.5%) | 0 (0.0%) |
| College / Associate Degree | 1,635 (84.9%) | 6 (0.3%) |
| Bachelor's Degree or higher | 1,997 (79.9%) | 0 (0.0%) |
| Total | 4,215 (80.4%) | 5 (0.1%) |
Employment Occupations by Sex in Lake Monticello
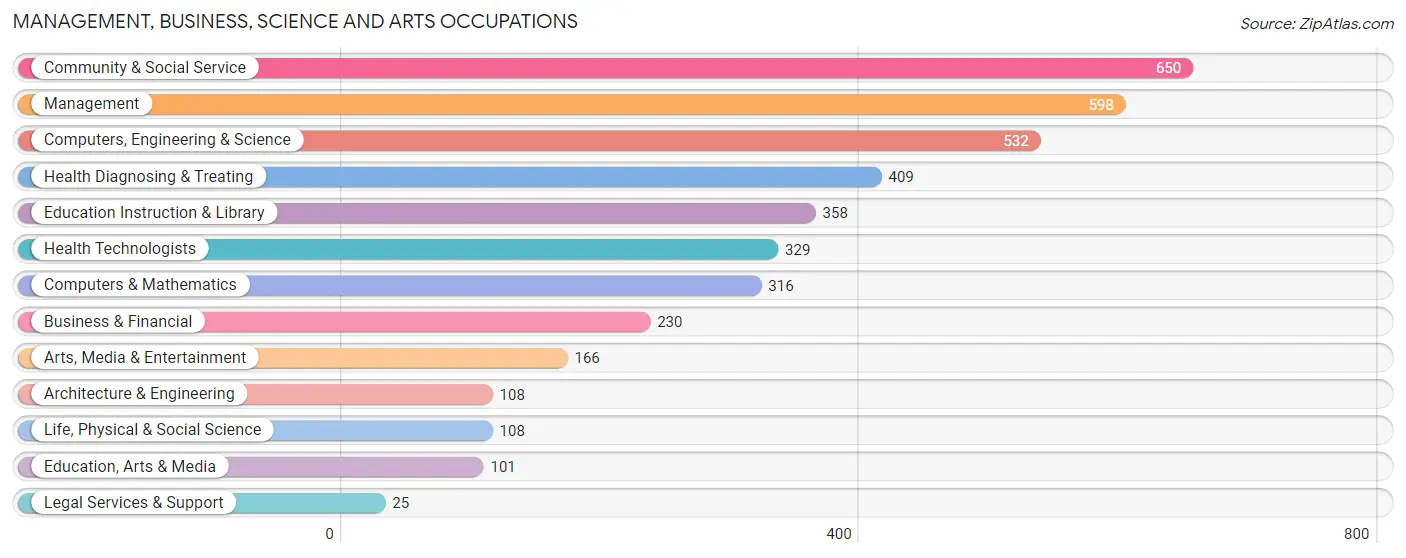
Management, Business, Science and Arts Occupations
The most common Management, Business, Science and Arts occupations in Lake Monticello are Community & Social Service (650 | 12.7%), Management (598 | 11.7%), Computers, Engineering & Science (532 | 10.4%), Health Diagnosing & Treating (409 | 8.0%), and Education Instruction & Library (358 | 7.0%).
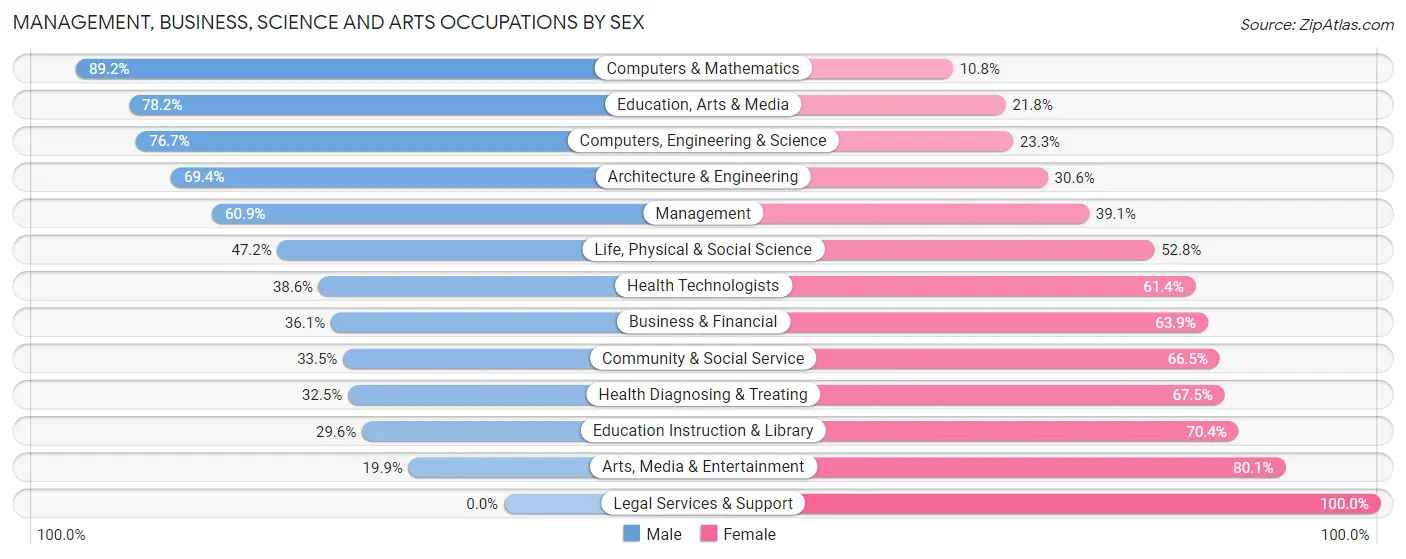
Management, Business, Science and Arts Occupations by Sex
Within the Management, Business, Science and Arts occupations in Lake Monticello, the most male-oriented occupations are Computers & Mathematics (89.2%), Education, Arts & Media (78.2%), and Computers, Engineering & Science (76.7%), while the most female-oriented occupations are Legal Services & Support (100.0%), Arts, Media & Entertainment (80.1%), and Education Instruction & Library (70.4%).
| Occupation | Male | Female |
| Management | 364 (60.9%) | 234 (39.1%) |
| Business & Financial | 83 (36.1%) | 147 (63.9%) |
| Computers, Engineering & Science | 408 (76.7%) | 124 (23.3%) |
| Computers & Mathematics | 282 (89.2%) | 34 (10.8%) |
| Architecture & Engineering | 75 (69.4%) | 33 (30.6%) |
| Life, Physical & Social Science | 51 (47.2%) | 57 (52.8%) |
| Community & Social Service | 218 (33.5%) | 432 (66.5%) |
| Education, Arts & Media | 79 (78.2%) | 22 (21.8%) |
| Legal Services & Support | 0 (0.0%) | 25 (100.0%) |
| Education Instruction & Library | 106 (29.6%) | 252 (70.4%) |
| Arts, Media & Entertainment | 33 (19.9%) | 133 (80.1%) |
| Health Diagnosing & Treating | 133 (32.5%) | 276 (67.5%) |
| Health Technologists | 127 (38.6%) | 202 (61.4%) |
| Total (Category) | 1,206 (49.9%) | 1,213 (50.1%) |
| Total (Overall) | 2,588 (50.6%) | 2,526 (49.4%) |
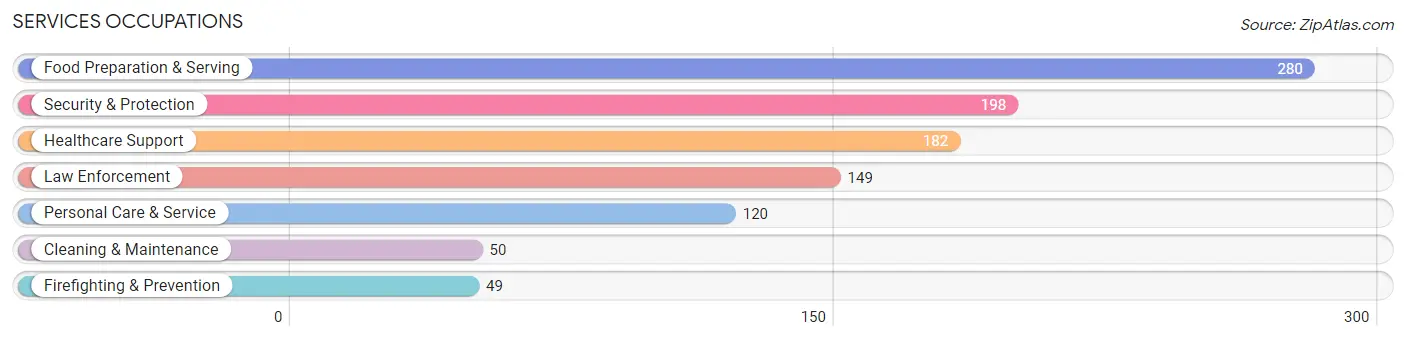
Services Occupations
The most common Services occupations in Lake Monticello are Food Preparation & Serving (280 | 5.5%), Security & Protection (198 | 3.9%), Healthcare Support (182 | 3.6%), Law Enforcement (149 | 2.9%), and Personal Care & Service (120 | 2.4%).
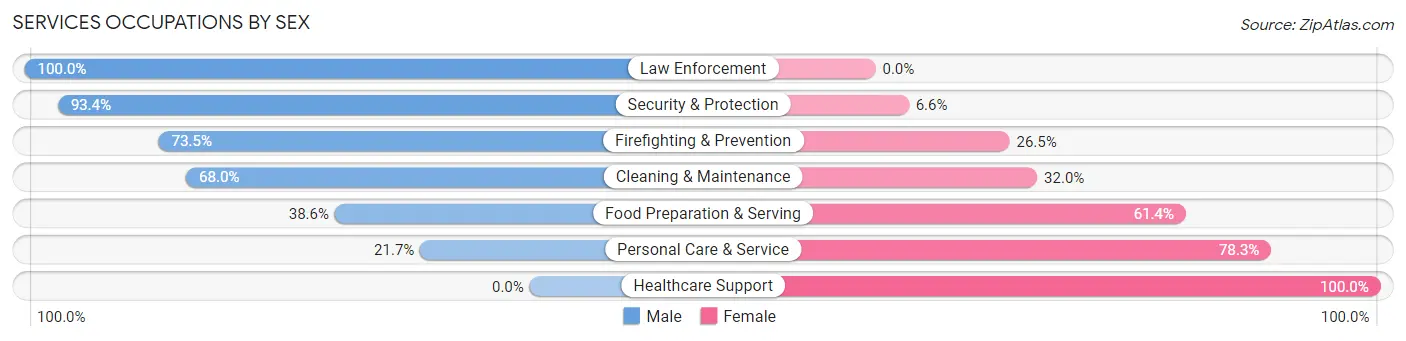
Services Occupations by Sex
Within the Services occupations in Lake Monticello, the most male-oriented occupations are Law Enforcement (100.0%), Security & Protection (93.4%), and Firefighting & Prevention (73.5%), while the most female-oriented occupations are Healthcare Support (100.0%), Personal Care & Service (78.3%), and Food Preparation & Serving (61.4%).
| Occupation | Male | Female |
| Healthcare Support | 0 (0.0%) | 182 (100.0%) |
| Security & Protection | 185 (93.4%) | 13 (6.6%) |
| Firefighting & Prevention | 36 (73.5%) | 13 (26.5%) |
| Law Enforcement | 149 (100.0%) | 0 (0.0%) |
| Food Preparation & Serving | 108 (38.6%) | 172 (61.4%) |
| Cleaning & Maintenance | 34 (68.0%) | 16 (32.0%) |
| Personal Care & Service | 26 (21.7%) | 94 (78.3%) |
| Total (Category) | 353 (42.5%) | 477 (57.5%) |
| Total (Overall) | 2,588 (50.6%) | 2,526 (49.4%) |
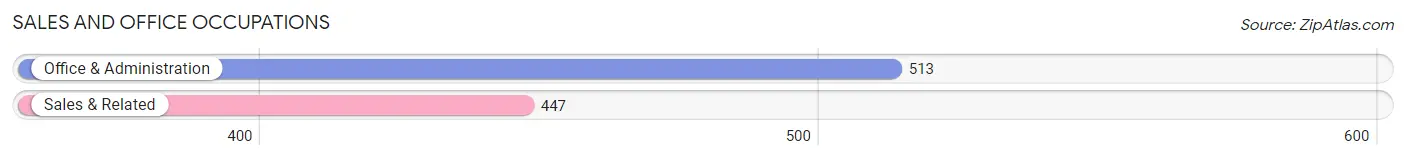
Sales and Office Occupations
The most common Sales and Office occupations in Lake Monticello are Office & Administration (513 | 10.0%), and Sales & Related (447 | 8.7%).
Sales and Office Occupations by Sex
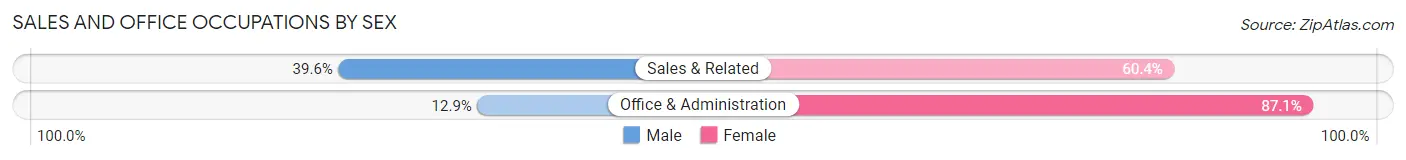
| Occupation | Male | Female |
| Sales & Related | 177 (39.6%) | 270 (60.4%) |
| Office & Administration | 66 (12.9%) | 447 (87.1%) |
| Total (Category) | 243 (25.3%) | 717 (74.7%) |
| Total (Overall) | 2,588 (50.6%) | 2,526 (49.4%) |
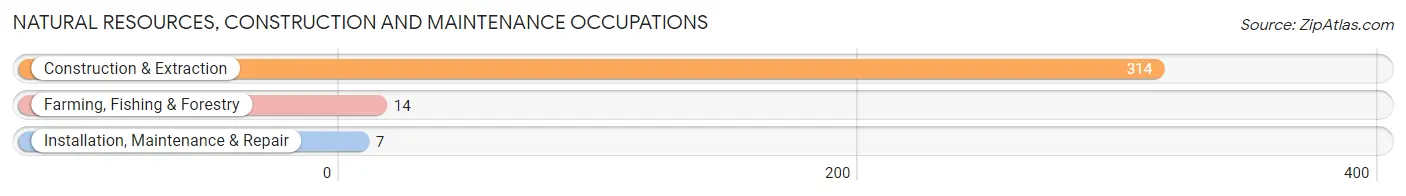
Natural Resources, Construction and Maintenance Occupations
The most common Natural Resources, Construction and Maintenance occupations in Lake Monticello are Construction & Extraction (314 | 6.1%), Farming, Fishing & Forestry (14 | 0.3%), and Installation, Maintenance & Repair (7 | 0.1%).
Natural Resources, Construction and Maintenance Occupations by Sex
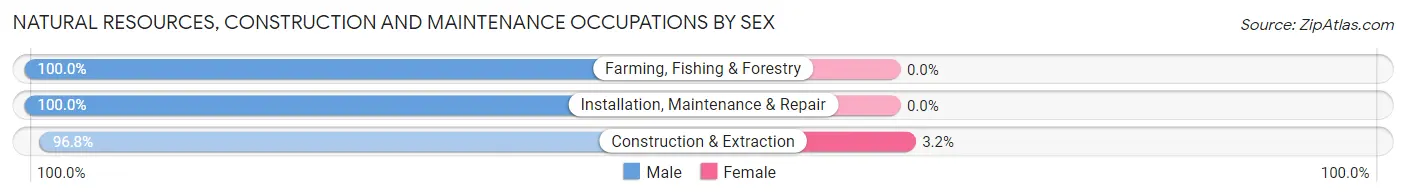
| Occupation | Male | Female |
| Farming, Fishing & Forestry | 14 (100.0%) | 0 (0.0%) |
| Construction & Extraction | 304 (96.8%) | 10 (3.2%) |
| Installation, Maintenance & Repair | 7 (100.0%) | 0 (0.0%) |
| Total (Category) | 325 (97.0%) | 10 (3.0%) |
| Total (Overall) | 2,588 (50.6%) | 2,526 (49.4%) |
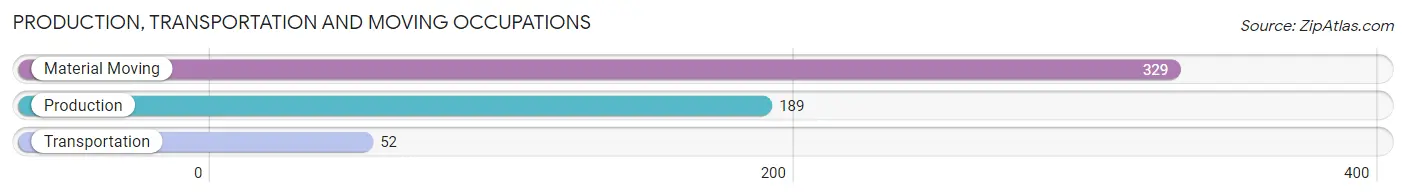
Production, Transportation and Moving Occupations
The most common Production, Transportation and Moving occupations in Lake Monticello are Material Moving (329 | 6.4%), Production (189 | 3.7%), and Transportation (52 | 1.0%).
Production, Transportation and Moving Occupations by Sex
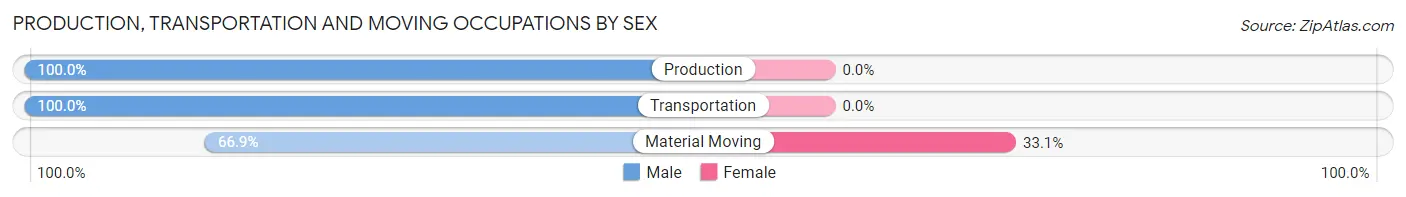
| Occupation | Male | Female |
| Production | 189 (100.0%) | 0 (0.0%) |
| Transportation | 52 (100.0%) | 0 (0.0%) |
| Material Moving | 220 (66.9%) | 109 (33.1%) |
| Total (Category) | 461 (80.9%) | 109 (19.1%) |
| Total (Overall) | 2,588 (50.6%) | 2,526 (49.4%) |
Employment Industries by Sex in Lake Monticello
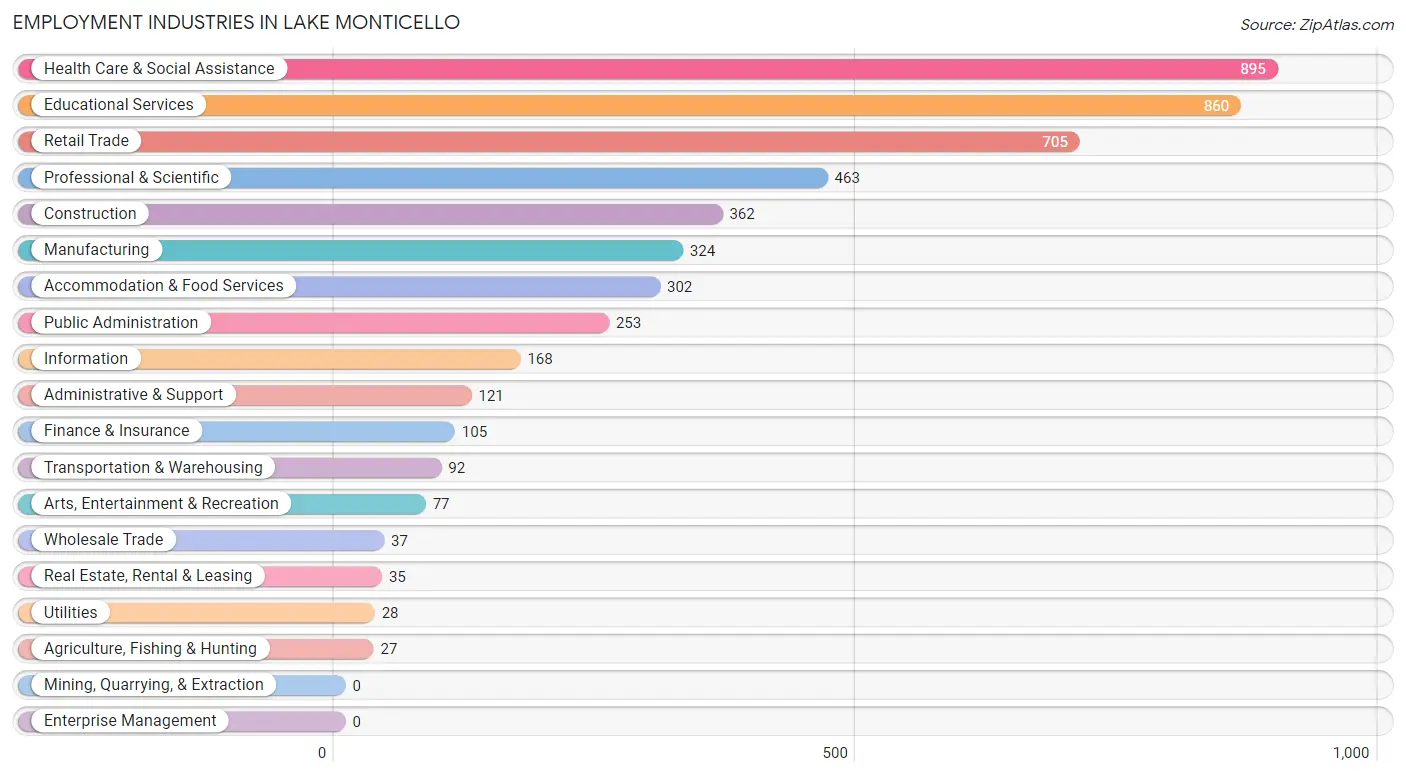
Employment Industries in Lake Monticello
The major employment industries in Lake Monticello include Health Care & Social Assistance (895 | 17.5%), Educational Services (860 | 16.8%), Retail Trade (705 | 13.8%), Professional & Scientific (463 | 9.0%), and Construction (362 | 7.1%).
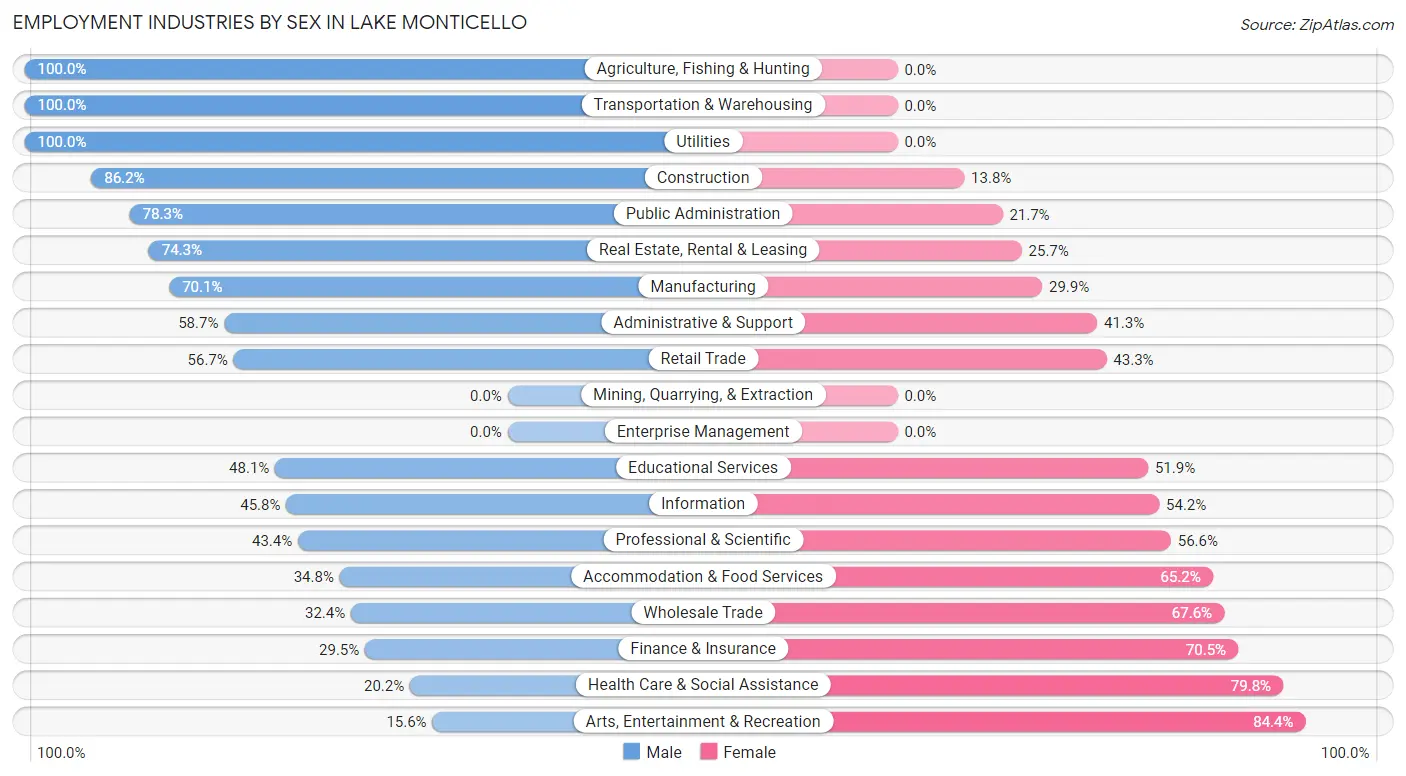
Employment Industries by Sex in Lake Monticello
The Lake Monticello industries that see more men than women are Agriculture, Fishing & Hunting (100.0%), Transportation & Warehousing (100.0%), and Utilities (100.0%), whereas the industries that tend to have a higher number of women are Arts, Entertainment & Recreation (84.4%), Health Care & Social Assistance (79.8%), and Finance & Insurance (70.5%).
| Industry | Male | Female |
| Agriculture, Fishing & Hunting | 27 (100.0%) | 0 (0.0%) |
| Mining, Quarrying, & Extraction | 0 (0.0%) | 0 (0.0%) |
| Construction | 312 (86.2%) | 50 (13.8%) |
| Manufacturing | 227 (70.1%) | 97 (29.9%) |
| Wholesale Trade | 12 (32.4%) | 25 (67.6%) |
| Retail Trade | 400 (56.7%) | 305 (43.3%) |
| Transportation & Warehousing | 92 (100.0%) | 0 (0.0%) |
| Utilities | 28 (100.0%) | 0 (0.0%) |
| Information | 77 (45.8%) | 91 (54.2%) |
| Finance & Insurance | 31 (29.5%) | 74 (70.5%) |
| Real Estate, Rental & Leasing | 26 (74.3%) | 9 (25.7%) |
| Professional & Scientific | 201 (43.4%) | 262 (56.6%) |
| Enterprise Management | 0 (0.0%) | 0 (0.0%) |
| Administrative & Support | 71 (58.7%) | 50 (41.3%) |
| Educational Services | 414 (48.1%) | 446 (51.9%) |
| Health Care & Social Assistance | 181 (20.2%) | 714 (79.8%) |
| Arts, Entertainment & Recreation | 12 (15.6%) | 65 (84.4%) |
| Accommodation & Food Services | 105 (34.8%) | 197 (65.2%) |
| Public Administration | 198 (78.3%) | 55 (21.7%) |
| Total | 2,588 (50.6%) | 2,526 (49.4%) |
Education in Lake Monticello
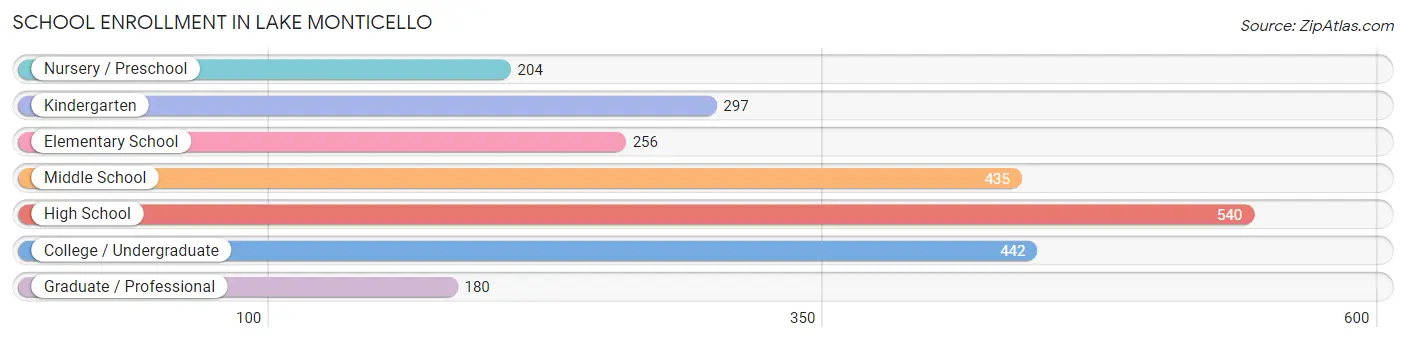
School Enrollment in Lake Monticello
The most common levels of schooling among the 2,354 students in Lake Monticello are high school (540 | 22.9%), college / undergraduate (442 | 18.8%), and middle school (435 | 18.5%).
| School Level | # Students | % Students |
| Nursery / Preschool | 204 | 8.7% |
| Kindergarten | 297 | 12.6% |
| Elementary School | 256 | 10.9% |
| Middle School | 435 | 18.5% |
| High School | 540 | 22.9% |
| College / Undergraduate | 442 | 18.8% |
| Graduate / Professional | 180 | 7.6% |
| Total | 2,354 | 100.0% |
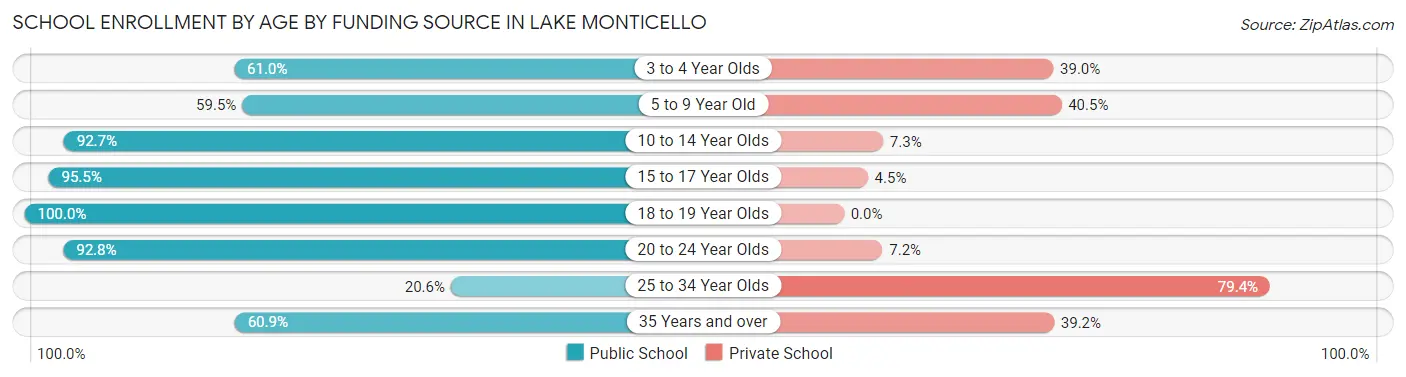
School Enrollment by Age by Funding Source in Lake Monticello
Out of a total of 2,354 students who are enrolled in schools in Lake Monticello, 584 (24.8%) attend a private institution, while the remaining 1,770 (75.2%) are enrolled in public schools. The age group of 25 to 34 year olds has the highest likelihood of being enrolled in private schools, with 104 (79.4% in the age bracket) enrolled. Conversely, the age group of 18 to 19 year olds has the lowest likelihood of being enrolled in a private school, with 36 (100.0% in the age bracket) attending a public institution.
| Age Bracket | Public School | Private School |
| 3 to 4 Year Olds | 111 (61.0%) | 71 (39.0%) |
| 5 to 9 Year Old | 342 (59.5%) | 233 (40.5%) |
| 10 to 14 Year Olds | 520 (92.7%) | 41 (7.3%) |
| 15 to 17 Year Olds | 385 (95.5%) | 18 (4.5%) |
| 18 to 19 Year Olds | 36 (100.0%) | 0 (0.0%) |
| 20 to 24 Year Olds | 193 (92.8%) | 15 (7.2%) |
| 25 to 34 Year Olds | 27 (20.6%) | 104 (79.4%) |
| 35 Years and over | 157 (60.9%) | 101 (39.2%) |
| Total | 1,770 (75.2%) | 584 (24.8%) |
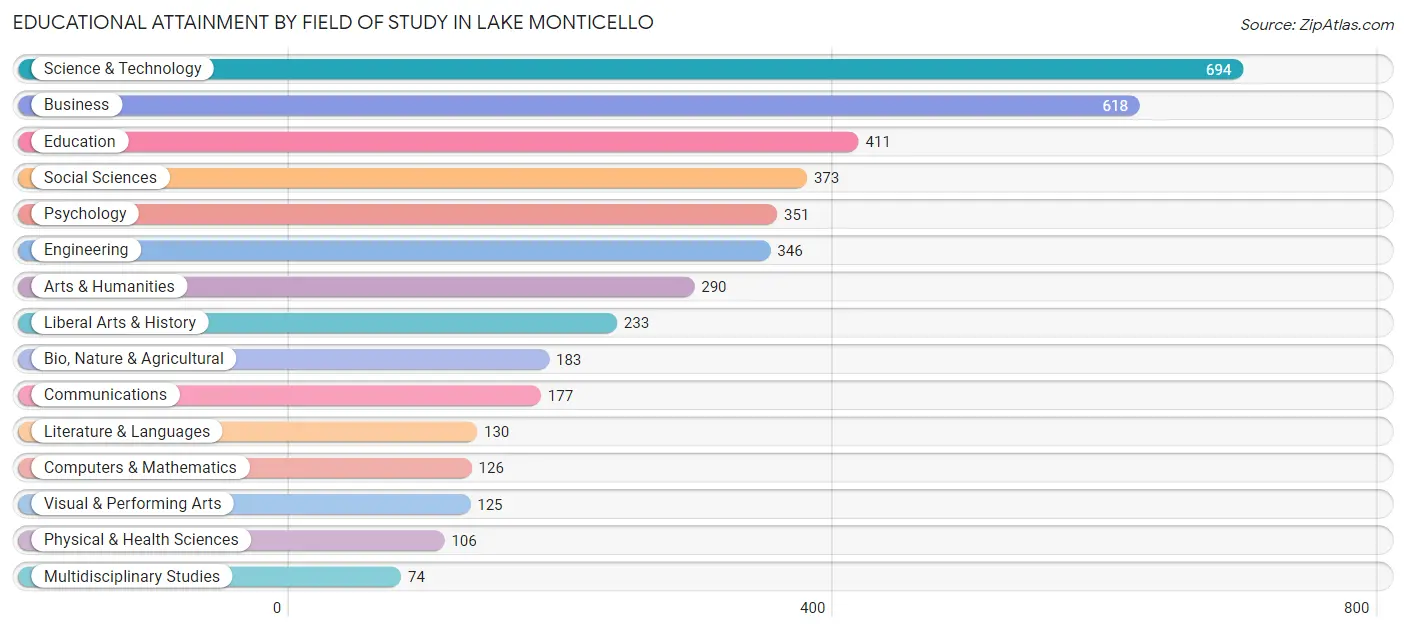
Educational Attainment by Field of Study in Lake Monticello
Science & technology (694 | 16.4%), business (618 | 14.6%), education (411 | 9.7%), social sciences (373 | 8.8%), and psychology (351 | 8.3%) are the most common fields of study among 4,237 individuals in Lake Monticello who have obtained a bachelor's degree or higher.
| Field of Study | # Graduates | % Graduates |
| Computers & Mathematics | 126 | 3.0% |
| Bio, Nature & Agricultural | 183 | 4.3% |
| Physical & Health Sciences | 106 | 2.5% |
| Psychology | 351 | 8.3% |
| Social Sciences | 373 | 8.8% |
| Engineering | 346 | 8.2% |
| Multidisciplinary Studies | 74 | 1.8% |
| Science & Technology | 694 | 16.4% |
| Business | 618 | 14.6% |
| Education | 411 | 9.7% |
| Literature & Languages | 130 | 3.1% |
| Liberal Arts & History | 233 | 5.5% |
| Visual & Performing Arts | 125 | 2.9% |
| Communications | 177 | 4.2% |
| Arts & Humanities | 290 | 6.8% |
| Total | 4,237 | 100.0% |
Transportation & Commute in Lake Monticello
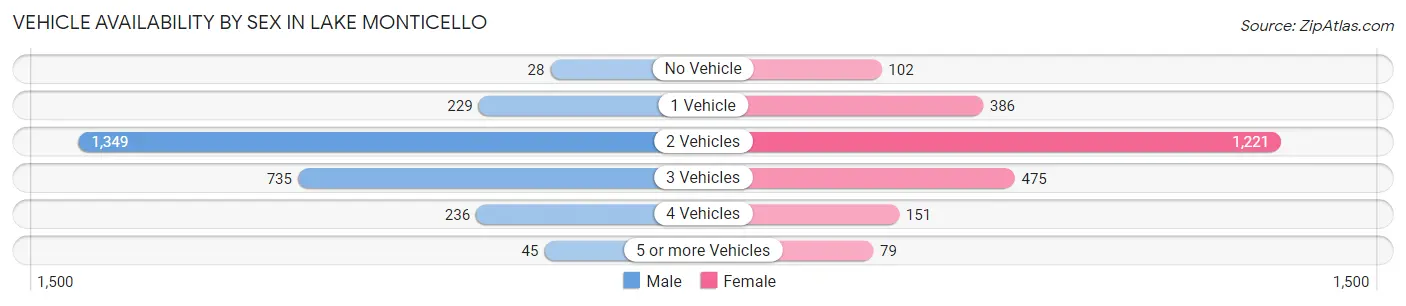
Vehicle Availability by Sex in Lake Monticello
The most prevalent vehicle ownership categories in Lake Monticello are males with 2 vehicles (1,349, accounting for 51.4%) and females with 2 vehicles (1,221, making up 55.9%).
| Vehicles Available | Male | Female |
| No Vehicle | 28 (1.1%) | 102 (4.2%) |
| 1 Vehicle | 229 (8.7%) | 386 (16.0%) |
| 2 Vehicles | 1,349 (51.4%) | 1,221 (50.6%) |
| 3 Vehicles | 735 (28.0%) | 475 (19.7%) |
| 4 Vehicles | 236 (9.0%) | 151 (6.3%) |
| 5 or more Vehicles | 45 (1.7%) | 79 (3.3%) |
| Total | 2,622 (100.0%) | 2,414 (100.0%) |
Commute Time in Lake Monticello
The most frequently occuring commute durations in Lake Monticello are 30 to 34 minutes (1,124 commuters, 26.1%), 25 to 29 minutes (561 commuters, 13.0%), and 40 to 44 minutes (504 commuters, 11.7%).
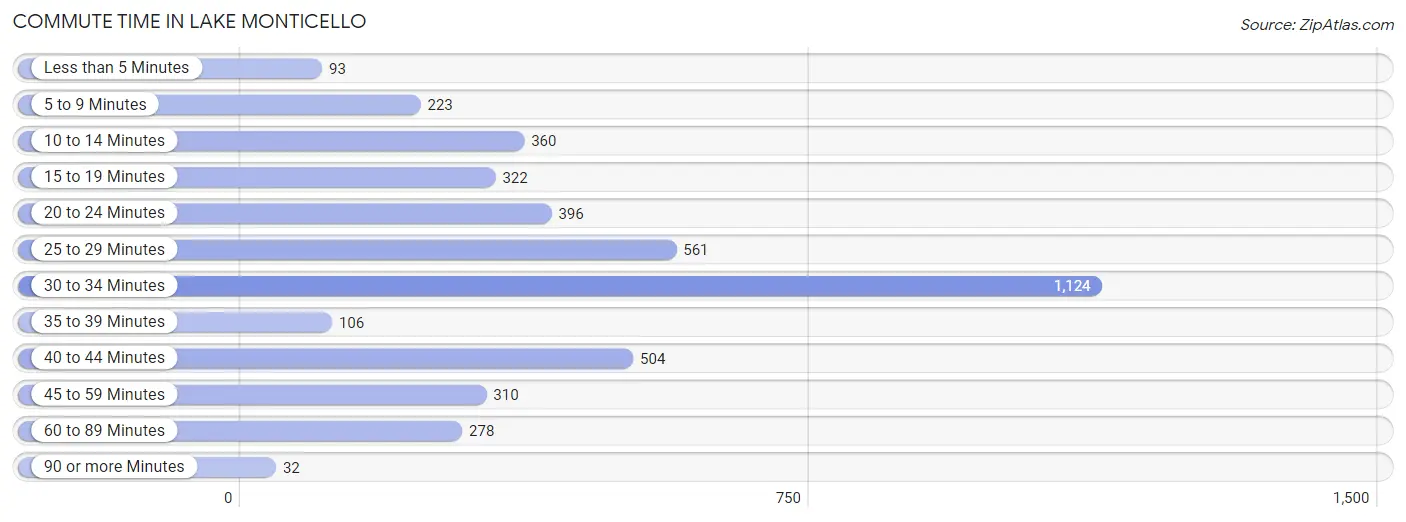
| Commute Time | # Commuters | % Commuters |
| Less than 5 Minutes | 93 | 2.2% |
| 5 to 9 Minutes | 223 | 5.2% |
| 10 to 14 Minutes | 360 | 8.4% |
| 15 to 19 Minutes | 322 | 7.5% |
| 20 to 24 Minutes | 396 | 9.2% |
| 25 to 29 Minutes | 561 | 13.0% |
| 30 to 34 Minutes | 1,124 | 26.1% |
| 35 to 39 Minutes | 106 | 2.5% |
| 40 to 44 Minutes | 504 | 11.7% |
| 45 to 59 Minutes | 310 | 7.2% |
| 60 to 89 Minutes | 278 | 6.5% |
| 90 or more Minutes | 32 | 0.7% |
Commute Time by Sex in Lake Monticello
The most common commute times in Lake Monticello are 30 to 34 minutes (580 commuters, 25.3%) for males and 30 to 34 minutes (544 commuters, 27.0%) for females.
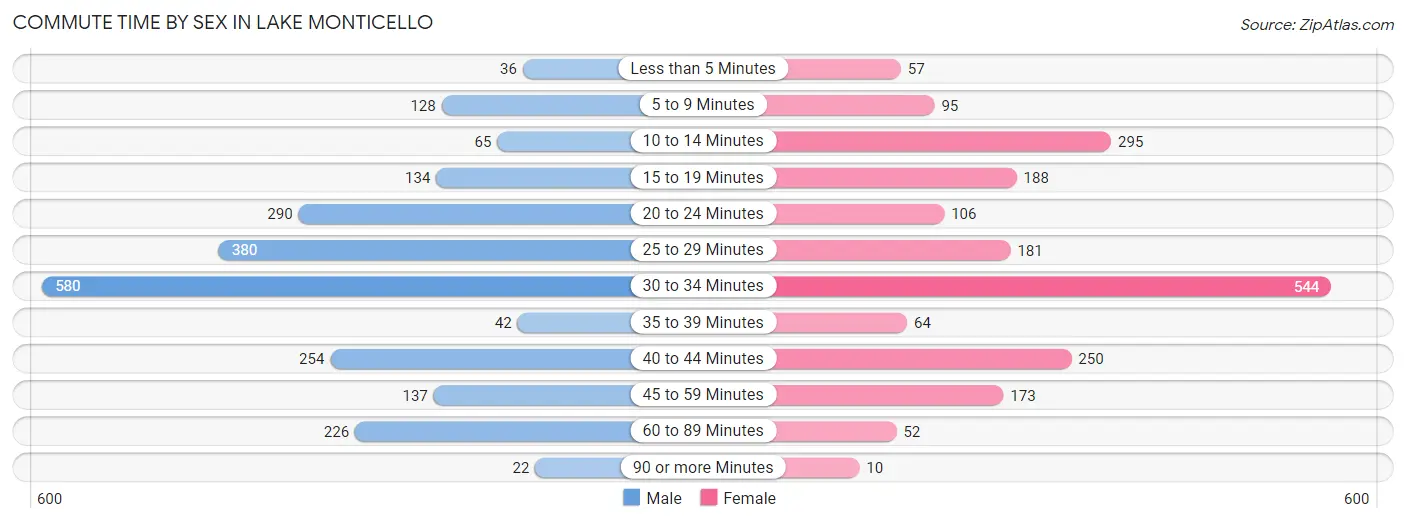
| Commute Time | Male | Female |
| Less than 5 Minutes | 36 (1.6%) | 57 (2.8%) |
| 5 to 9 Minutes | 128 (5.6%) | 95 (4.7%) |
| 10 to 14 Minutes | 65 (2.8%) | 295 (14.6%) |
| 15 to 19 Minutes | 134 (5.8%) | 188 (9.3%) |
| 20 to 24 Minutes | 290 (12.6%) | 106 (5.3%) |
| 25 to 29 Minutes | 380 (16.6%) | 181 (9.0%) |
| 30 to 34 Minutes | 580 (25.3%) | 544 (27.0%) |
| 35 to 39 Minutes | 42 (1.8%) | 64 (3.2%) |
| 40 to 44 Minutes | 254 (11.1%) | 250 (12.4%) |
| 45 to 59 Minutes | 137 (6.0%) | 173 (8.6%) |
| 60 to 89 Minutes | 226 (9.9%) | 52 (2.6%) |
| 90 or more Minutes | 22 (1.0%) | 10 (0.5%) |
Time of Departure to Work by Sex in Lake Monticello
The most frequent times of departure to work in Lake Monticello are 6:00 AM to 6:29 AM (632, 27.6%) for males and 8:00 AM to 8:29 AM (464, 23.0%) for females.
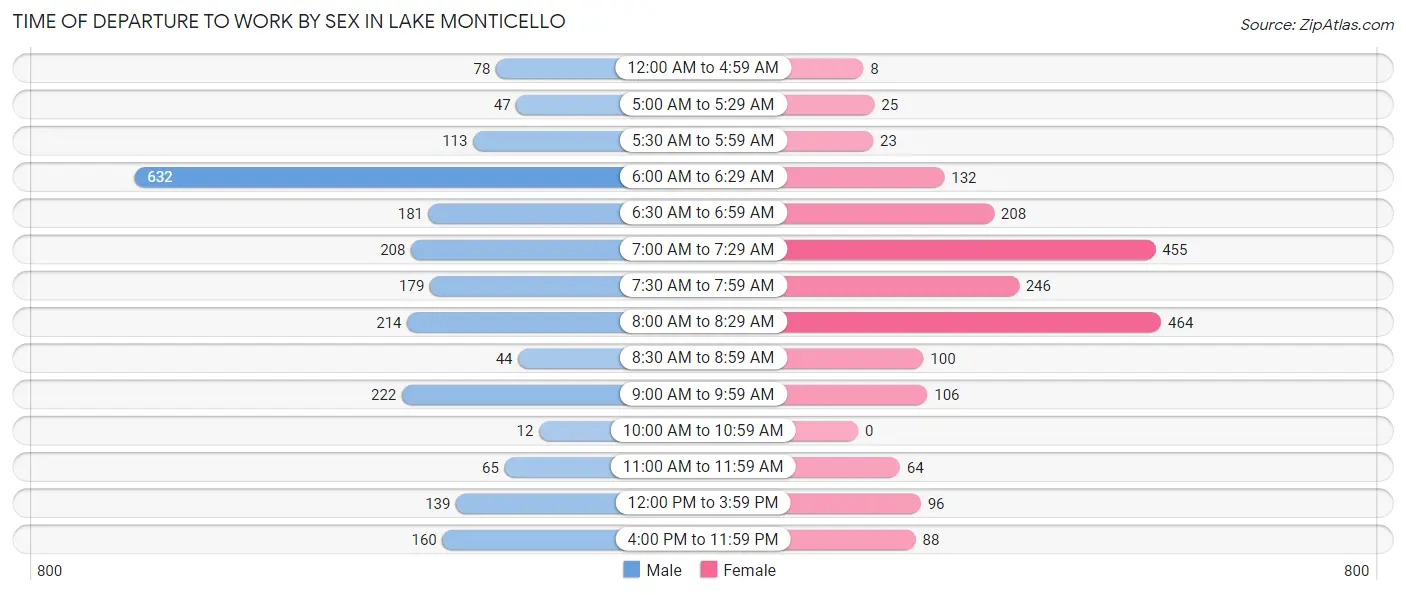
| Time of Departure | Male | Female |
| 12:00 AM to 4:59 AM | 78 (3.4%) | 8 (0.4%) |
| 5:00 AM to 5:29 AM | 47 (2.1%) | 25 (1.2%) |
| 5:30 AM to 5:59 AM | 113 (4.9%) | 23 (1.1%) |
| 6:00 AM to 6:29 AM | 632 (27.6%) | 132 (6.6%) |
| 6:30 AM to 6:59 AM | 181 (7.9%) | 208 (10.3%) |
| 7:00 AM to 7:29 AM | 208 (9.1%) | 455 (22.6%) |
| 7:30 AM to 7:59 AM | 179 (7.8%) | 246 (12.2%) |
| 8:00 AM to 8:29 AM | 214 (9.3%) | 464 (23.0%) |
| 8:30 AM to 8:59 AM | 44 (1.9%) | 100 (5.0%) |
| 9:00 AM to 9:59 AM | 222 (9.7%) | 106 (5.3%) |
| 10:00 AM to 10:59 AM | 12 (0.5%) | 0 (0.0%) |
| 11:00 AM to 11:59 AM | 65 (2.8%) | 64 (3.2%) |
| 12:00 PM to 3:59 PM | 139 (6.1%) | 96 (4.8%) |
| 4:00 PM to 11:59 PM | 160 (7.0%) | 88 (4.4%) |
| Total | 2,294 (100.0%) | 2,015 (100.0%) |
Housing Occupancy in Lake Monticello
Occupancy by Ownership in Lake Monticello
Of the total 4,200 dwellings in Lake Monticello, owner-occupied units account for 4,006 (95.4%), while renter-occupied units make up 194 (4.6%).
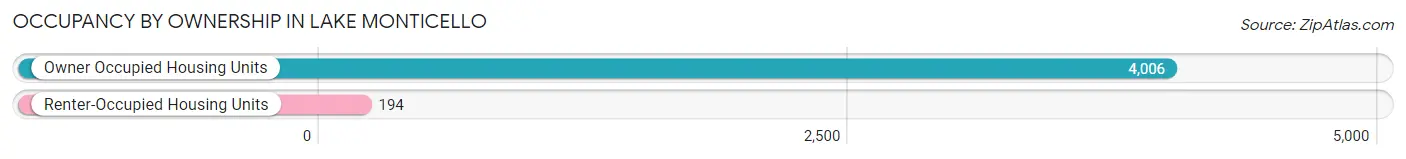
| Occupancy | # Housing Units | % Housing Units |
| Owner Occupied Housing Units | 4,006 | 95.4% |
| Renter-Occupied Housing Units | 194 | 4.6% |
| Total Occupied Housing Units | 4,200 | 100.0% |
Occupancy by Household Size in Lake Monticello
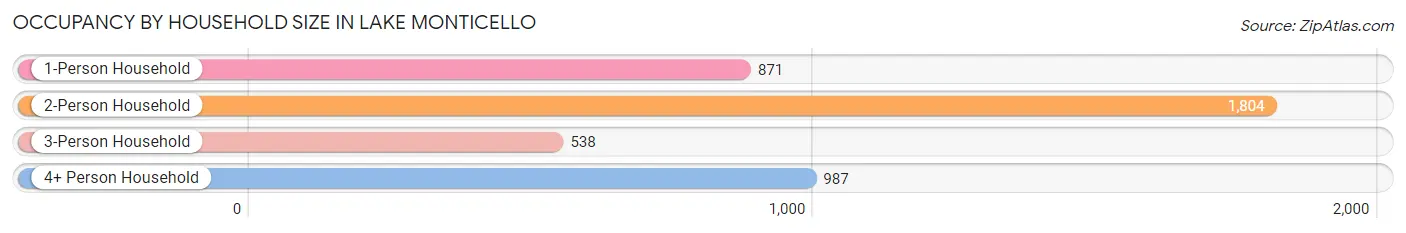
| Household Size | # Housing Units | % Housing Units |
| 1-Person Household | 871 | 20.7% |
| 2-Person Household | 1,804 | 42.9% |
| 3-Person Household | 538 | 12.8% |
| 4+ Person Household | 987 | 23.5% |
| Total Housing Units | 4,200 | 100.0% |
Occupancy by Ownership by Household Size in Lake Monticello
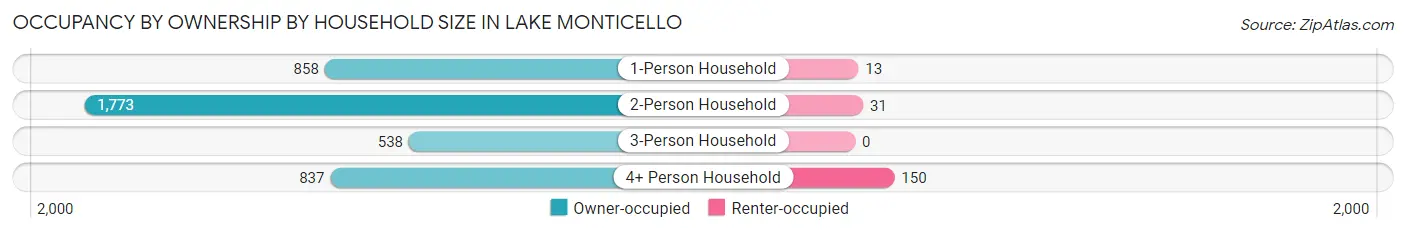
| Household Size | Owner-occupied | Renter-occupied |
| 1-Person Household | 858 (98.5%) | 13 (1.5%) |
| 2-Person Household | 1,773 (98.3%) | 31 (1.7%) |
| 3-Person Household | 538 (100.0%) | 0 (0.0%) |
| 4+ Person Household | 837 (84.8%) | 150 (15.2%) |
| Total Housing Units | 4,006 (95.4%) | 194 (4.6%) |
Occupancy by Educational Attainment in Lake Monticello
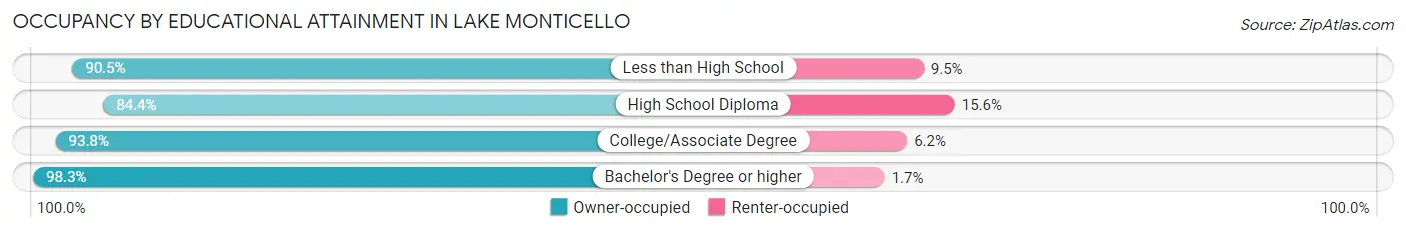
| Household Size | Owner-occupied | Renter-occupied |
| Less than High School | 67 (90.5%) | 7 (9.5%) |
| High School Diploma | 314 (84.4%) | 58 (15.6%) |
| College/Associate Degree | 1,372 (93.8%) | 90 (6.2%) |
| Bachelor's Degree or higher | 2,253 (98.3%) | 39 (1.7%) |
Occupancy by Age of Householder in Lake Monticello
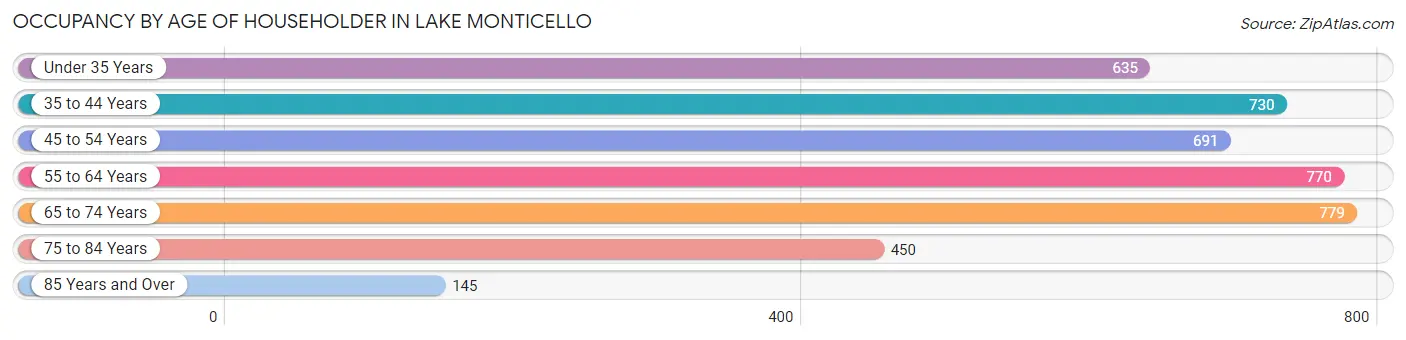
| Age Bracket | # Households | % Households |
| Under 35 Years | 635 | 15.1% |
| 35 to 44 Years | 730 | 17.4% |
| 45 to 54 Years | 691 | 16.5% |
| 55 to 64 Years | 770 | 18.3% |
| 65 to 74 Years | 779 | 18.5% |
| 75 to 84 Years | 450 | 10.7% |
| 85 Years and Over | 145 | 3.5% |
| Total | 4,200 | 100.0% |
Housing Finances in Lake Monticello
Median Income by Occupancy in Lake Monticello
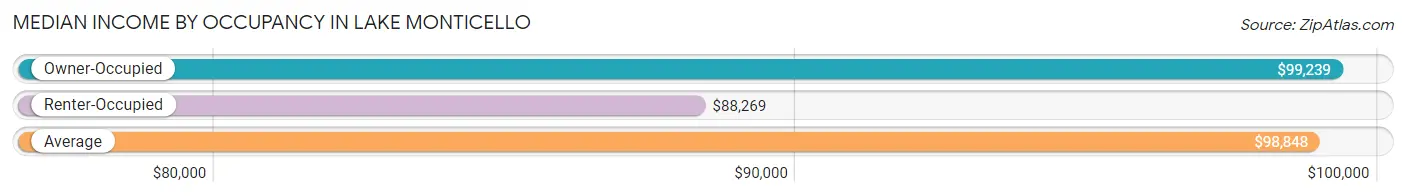
| Occupancy Type | # Households | Median Income |
| Owner-Occupied | 4,006 (95.4%) | $99,239 |
| Renter-Occupied | 194 (4.6%) | $88,269 |
| Average | 4,200 (100.0%) | $98,848 |
Occupancy by Householder Income Bracket in Lake Monticello
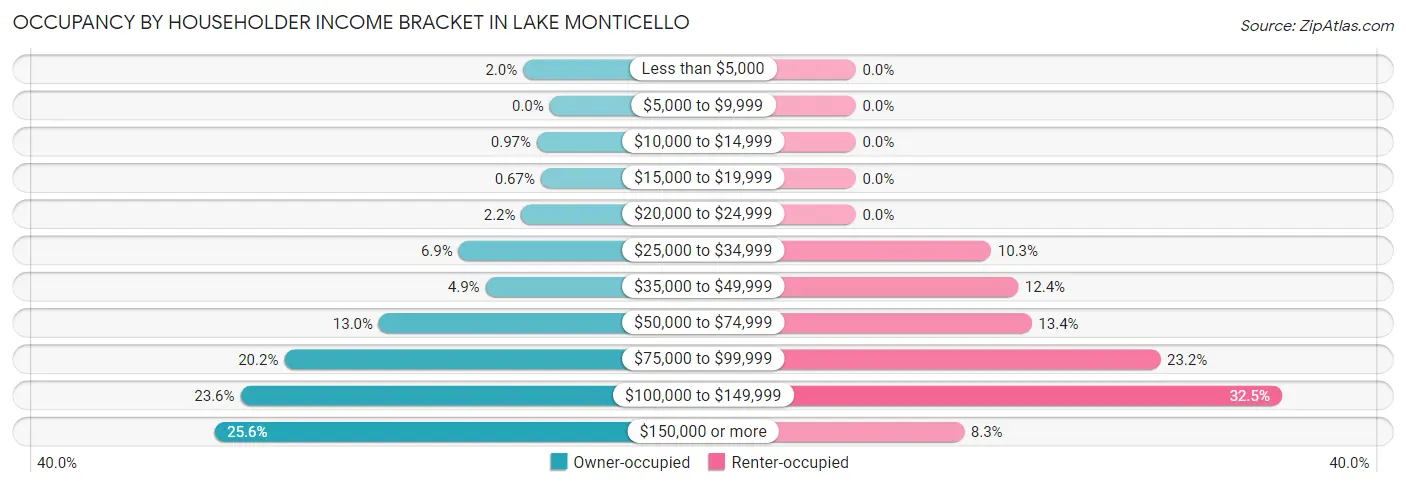
| Income Bracket | Owner-occupied | Renter-occupied |
| Less than $5,000 | 81 (2.0%) | 0 (0.0%) |
| $5,000 to $9,999 | 0 (0.0%) | 0 (0.0%) |
| $10,000 to $14,999 | 39 (1.0%) | 0 (0.0%) |
| $15,000 to $19,999 | 27 (0.7%) | 0 (0.0%) |
| $20,000 to $24,999 | 86 (2.1%) | 0 (0.0%) |
| $25,000 to $34,999 | 278 (6.9%) | 20 (10.3%) |
| $35,000 to $49,999 | 196 (4.9%) | 24 (12.4%) |
| $50,000 to $74,999 | 521 (13.0%) | 26 (13.4%) |
| $75,000 to $99,999 | 810 (20.2%) | 45 (23.2%) |
| $100,000 to $149,999 | 944 (23.6%) | 63 (32.5%) |
| $150,000 or more | 1,024 (25.6%) | 16 (8.3%) |
| Total | 4,006 (100.0%) | 194 (100.0%) |
Monthly Housing Cost Tiers in Lake Monticello
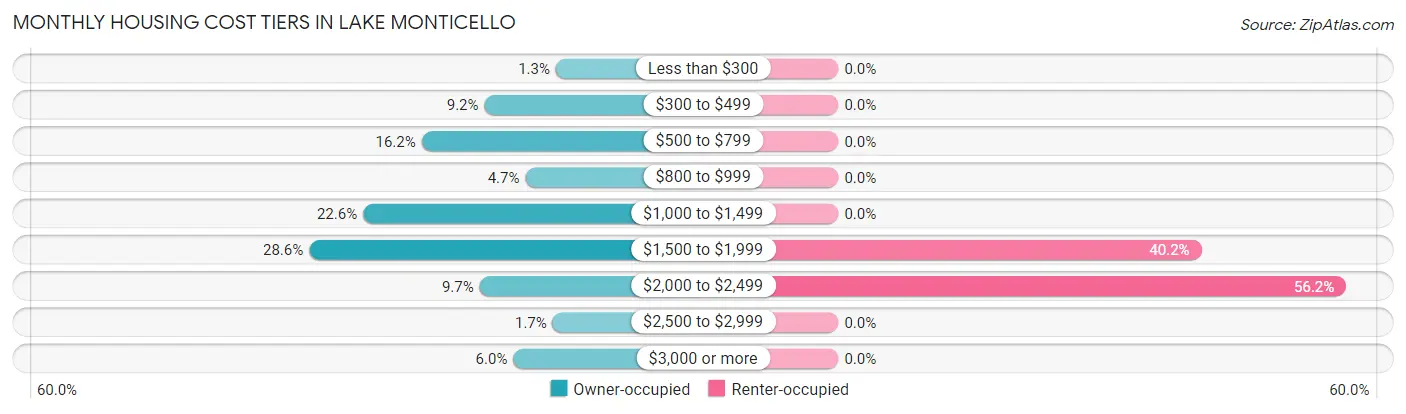
| Monthly Cost | Owner-occupied | Renter-occupied |
| Less than $300 | 53 (1.3%) | 0 (0.0%) |
| $300 to $499 | 369 (9.2%) | 0 (0.0%) |
| $500 to $799 | 647 (16.2%) | 0 (0.0%) |
| $800 to $999 | 188 (4.7%) | 0 (0.0%) |
| $1,000 to $1,499 | 906 (22.6%) | 0 (0.0%) |
| $1,500 to $1,999 | 1,145 (28.6%) | 78 (40.2%) |
| $2,000 to $2,499 | 390 (9.7%) | 109 (56.2%) |
| $2,500 to $2,999 | 67 (1.7%) | 0 (0.0%) |
| $3,000 or more | 241 (6.0%) | 0 (0.0%) |
| Total | 4,006 (100.0%) | 194 (100.0%) |
Physical Housing Characteristics in Lake Monticello
Housing Structures in Lake Monticello
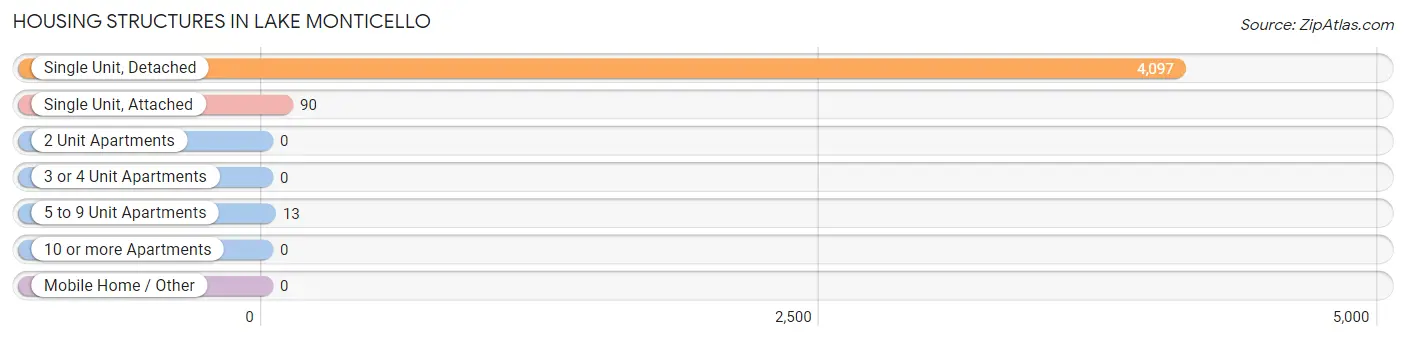
| Structure Type | # Housing Units | % Housing Units |
| Single Unit, Detached | 4,097 | 97.6% |
| Single Unit, Attached | 90 | 2.1% |
| 2 Unit Apartments | 0 | 0.0% |
| 3 or 4 Unit Apartments | 0 | 0.0% |
| 5 to 9 Unit Apartments | 13 | 0.3% |
| 10 or more Apartments | 0 | 0.0% |
| Mobile Home / Other | 0 | 0.0% |
| Total | 4,200 | 100.0% |
Housing Structures by Occupancy in Lake Monticello
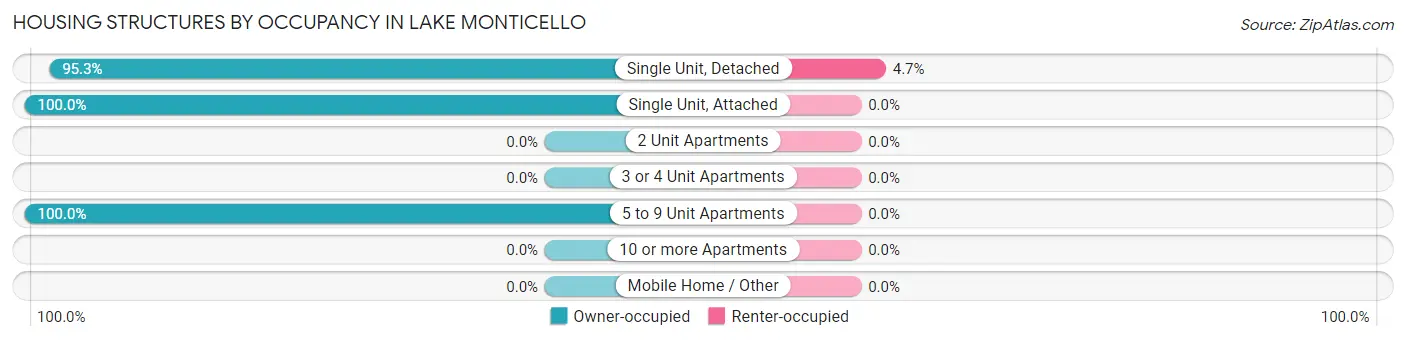
| Structure Type | Owner-occupied | Renter-occupied |
| Single Unit, Detached | 3,903 (95.3%) | 194 (4.7%) |
| Single Unit, Attached | 90 (100.0%) | 0 (0.0%) |
| 2 Unit Apartments | 0 (0.0%) | 0 (0.0%) |
| 3 or 4 Unit Apartments | 0 (0.0%) | 0 (0.0%) |
| 5 to 9 Unit Apartments | 13 (100.0%) | 0 (0.0%) |
| 10 or more Apartments | 0 (0.0%) | 0 (0.0%) |
| Mobile Home / Other | 0 (0.0%) | 0 (0.0%) |
| Total | 4,006 (95.4%) | 194 (4.6%) |
Housing Structures by Number of Rooms in Lake Monticello
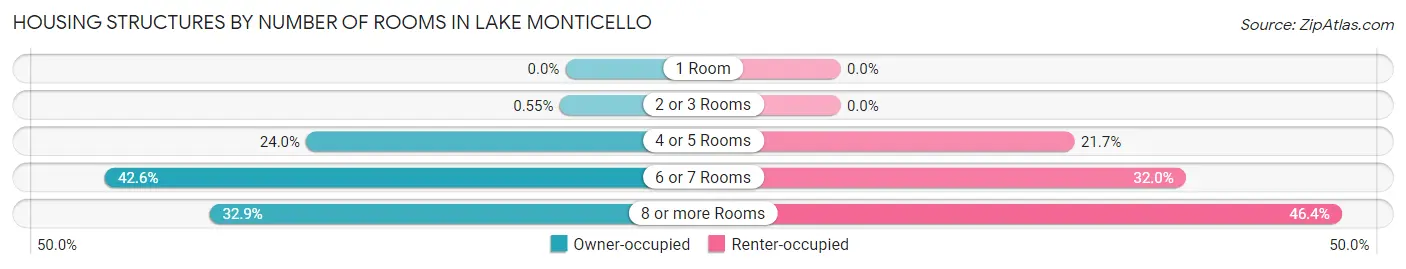
| Number of Rooms | Owner-occupied | Renter-occupied |
| 1 Room | 0 (0.0%) | 0 (0.0%) |
| 2 or 3 Rooms | 22 (0.5%) | 0 (0.0%) |
| 4 or 5 Rooms | 961 (24.0%) | 42 (21.6%) |
| 6 or 7 Rooms | 1,705 (42.6%) | 62 (32.0%) |
| 8 or more Rooms | 1,318 (32.9%) | 90 (46.4%) |
| Total | 4,006 (100.0%) | 194 (100.0%) |
Housing Structure by Heating Type in Lake Monticello
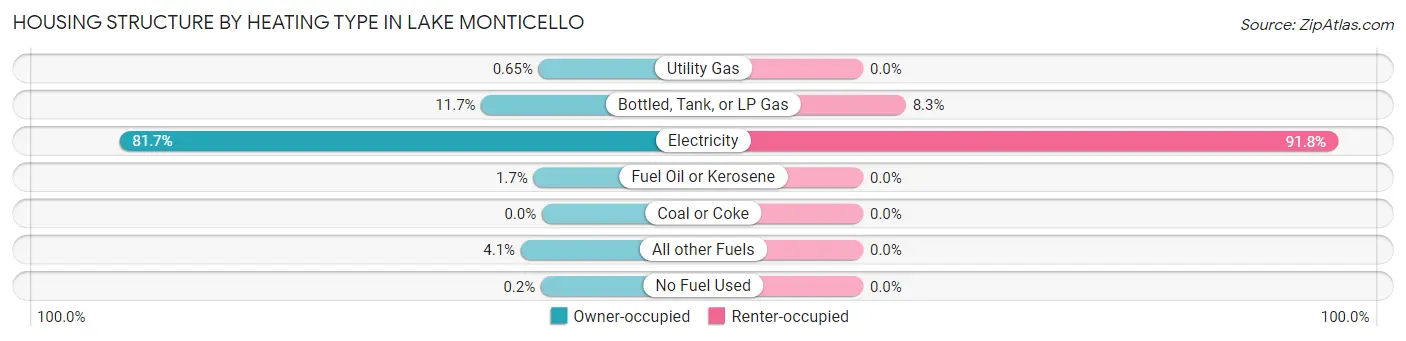
| Heating Type | Owner-occupied | Renter-occupied |
| Utility Gas | 26 (0.6%) | 0 (0.0%) |
| Bottled, Tank, or LP Gas | 470 (11.7%) | 16 (8.3%) |
| Electricity | 3,272 (81.7%) | 178 (91.7%) |
| Fuel Oil or Kerosene | 66 (1.7%) | 0 (0.0%) |
| Coal or Coke | 0 (0.0%) | 0 (0.0%) |
| All other Fuels | 164 (4.1%) | 0 (0.0%) |
| No Fuel Used | 8 (0.2%) | 0 (0.0%) |
| Total | 4,006 (100.0%) | 194 (100.0%) |
Household Vehicle Usage in Lake Monticello
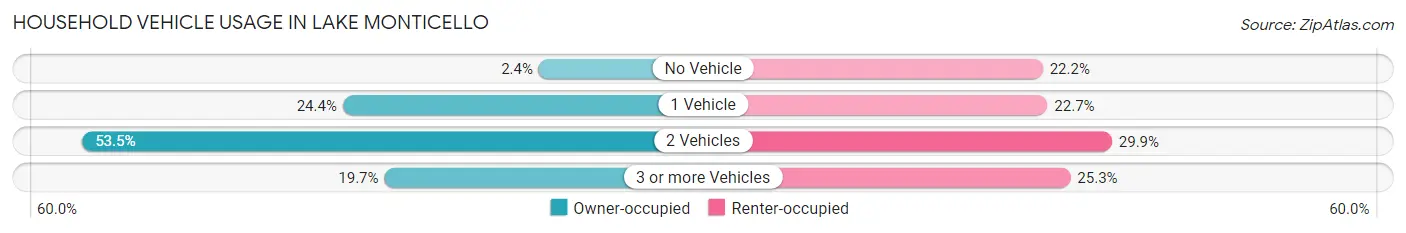
| Vehicles per Household | Owner-occupied | Renter-occupied |
| No Vehicle | 96 (2.4%) | 43 (22.2%) |
| 1 Vehicle | 976 (24.4%) | 44 (22.7%) |
| 2 Vehicles | 2,145 (53.5%) | 58 (29.9%) |
| 3 or more Vehicles | 789 (19.7%) | 49 (25.3%) |
| Total | 4,006 (100.0%) | 194 (100.0%) |
Real Estate & Mortgages in Lake Monticello
Real Estate and Mortgage Overview in Lake Monticello
| Characteristic | Without Mortgage | With Mortgage |
| Housing Units | 1,188 | 2,818 |
| Median Property Value | $336,100 | $257,800 |
| Median Household Income | $77,826 | $778 |
| Monthly Housing Costs | $630 | $241 |
| Real Estate Taxes | $2,415 | $55 |
Property Value by Mortgage Status in Lake Monticello
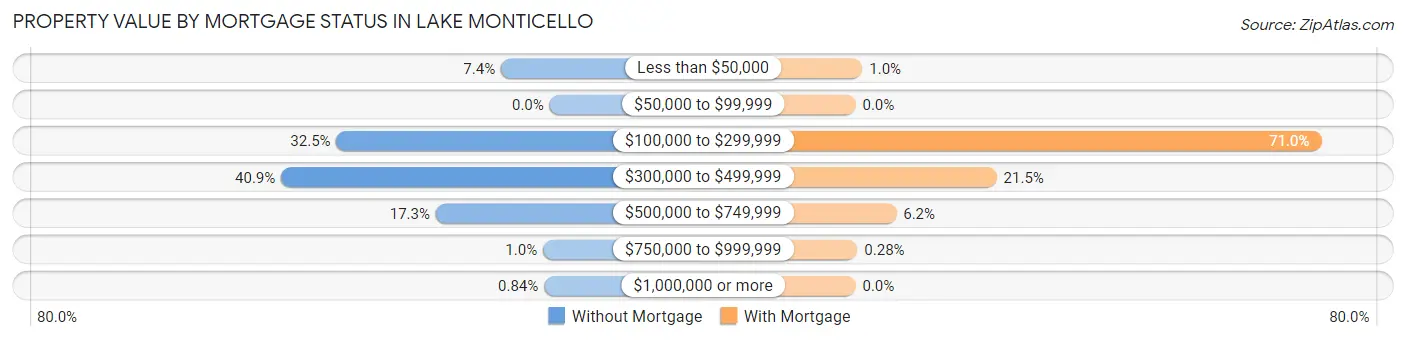
| Property Value | Without Mortgage | With Mortgage |
| Less than $50,000 | 88 (7.4%) | 29 (1.0%) |
| $50,000 to $99,999 | 0 (0.0%) | 0 (0.0%) |
| $100,000 to $299,999 | 386 (32.5%) | 2,000 (71.0%) |
| $300,000 to $499,999 | 486 (40.9%) | 606 (21.5%) |
| $500,000 to $749,999 | 206 (17.3%) | 175 (6.2%) |
| $750,000 to $999,999 | 12 (1.0%) | 8 (0.3%) |
| $1,000,000 or more | 10 (0.8%) | 0 (0.0%) |
| Total | 1,188 (100.0%) | 2,818 (100.0%) |
Household Income by Mortgage Status in Lake Monticello
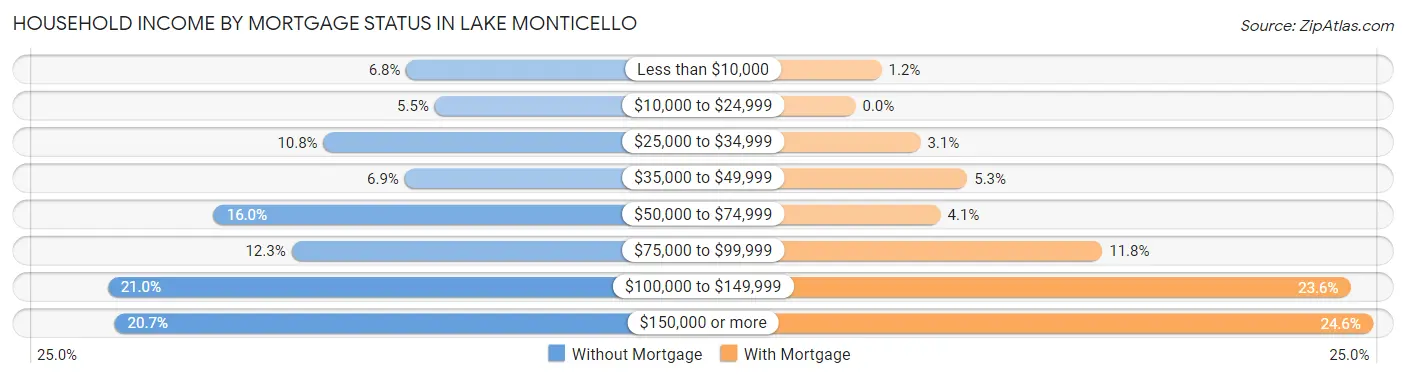
| Household Income | Without Mortgage | With Mortgage |
| Less than $10,000 | 81 (6.8%) | 35 (1.2%) |
| $10,000 to $24,999 | 65 (5.5%) | 0 (0.0%) |
| $25,000 to $34,999 | 128 (10.8%) | 87 (3.1%) |
| $35,000 to $49,999 | 82 (6.9%) | 150 (5.3%) |
| $50,000 to $74,999 | 190 (16.0%) | 114 (4.1%) |
| $75,000 to $99,999 | 146 (12.3%) | 331 (11.7%) |
| $100,000 to $149,999 | 250 (21.0%) | 664 (23.6%) |
| $150,000 or more | 246 (20.7%) | 694 (24.6%) |
| Total | 1,188 (100.0%) | 2,818 (100.0%) |
Property Value to Household Income Ratio in Lake Monticello
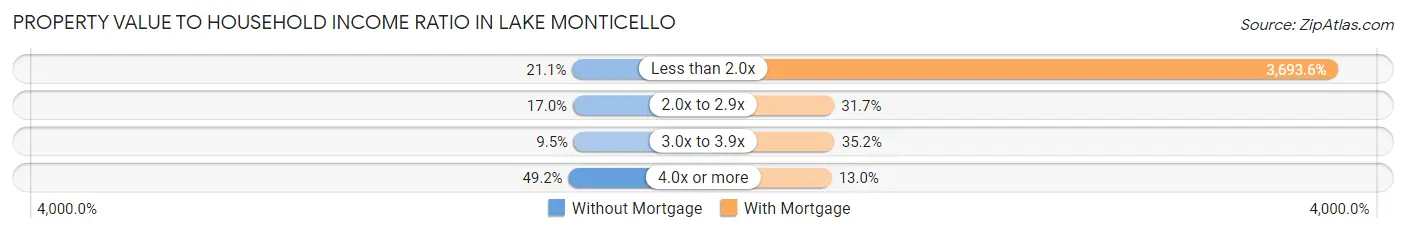
| Value-to-Income Ratio | Without Mortgage | With Mortgage |
| Less than 2.0x | 251 (21.1%) | 104,085 (3,693.6%) |
| 2.0x to 2.9x | 202 (17.0%) | 893 (31.7%) |
| 3.0x to 3.9x | 113 (9.5%) | 992 (35.2%) |
| 4.0x or more | 585 (49.2%) | 366 (13.0%) |
| Total | 1,188 (100.0%) | 2,818 (100.0%) |
Real Estate Taxes by Mortgage Status in Lake Monticello
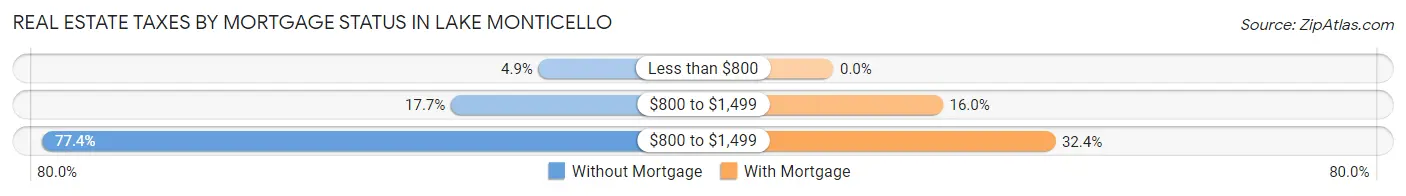
| Property Taxes | Without Mortgage | With Mortgage |
| Less than $800 | 58 (4.9%) | 0 (0.0%) |
| $800 to $1,499 | 210 (17.7%) | 451 (16.0%) |
| $800 to $1,499 | 920 (77.4%) | 914 (32.4%) |
| Total | 1,188 (100.0%) | 2,818 (100.0%) |
Health & Disability in Lake Monticello
Health Insurance Coverage by Age in Lake Monticello
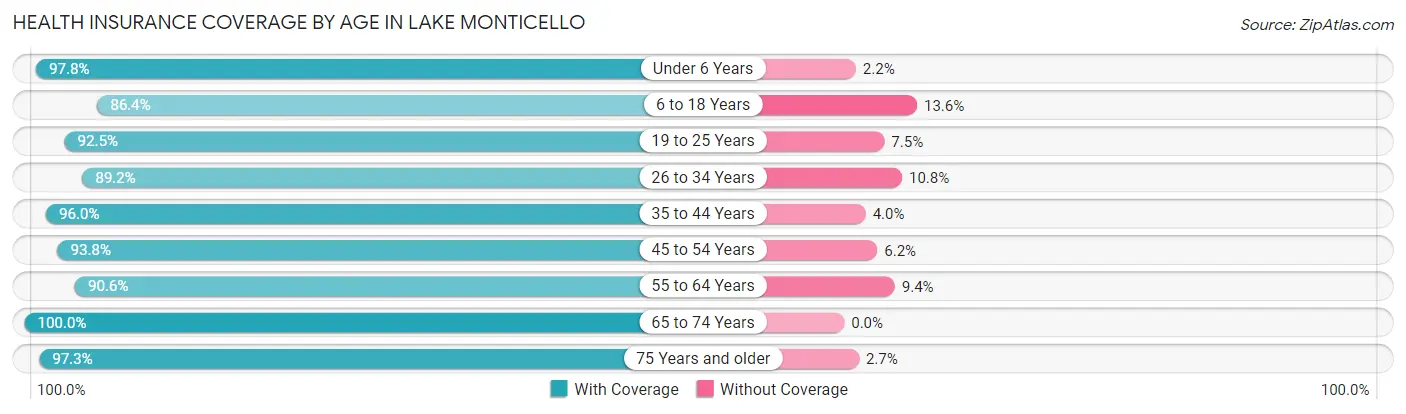
| Age Bracket | With Coverage | Without Coverage |
| Under 6 Years | 1,135 (97.8%) | 25 (2.2%) |
| 6 to 18 Years | 1,275 (86.4%) | 200 (13.6%) |
| 19 to 25 Years | 730 (92.5%) | 59 (7.5%) |
| 26 to 34 Years | 1,177 (89.2%) | 142 (10.8%) |
| 35 to 44 Years | 1,175 (96.0%) | 49 (4.0%) |
| 45 to 54 Years | 1,158 (93.8%) | 76 (6.2%) |
| 55 to 64 Years | 1,211 (90.6%) | 126 (9.4%) |
| 65 to 74 Years | 1,314 (100.0%) | 0 (0.0%) |
| 75 Years and older | 922 (97.3%) | 26 (2.7%) |
| Total | 10,097 (93.5%) | 703 (6.5%) |
Health Insurance Coverage by Citizenship Status in Lake Monticello
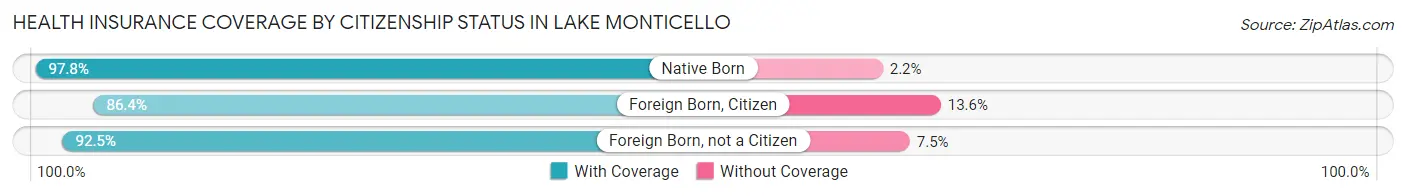
| Citizenship Status | With Coverage | Without Coverage |
| Native Born | 1,135 (97.8%) | 25 (2.2%) |
| Foreign Born, Citizen | 1,275 (86.4%) | 200 (13.6%) |
| Foreign Born, not a Citizen | 730 (92.5%) | 59 (7.5%) |
Health Insurance Coverage by Household Income in Lake Monticello
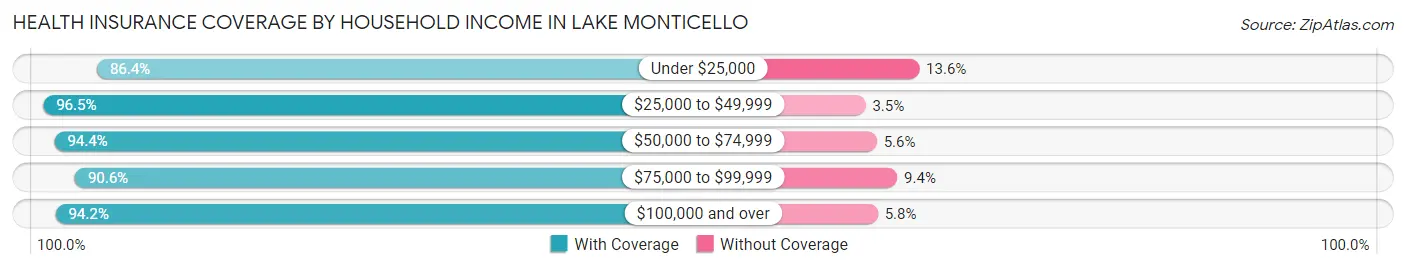
| Household Income | With Coverage | Without Coverage |
| Under $25,000 | 255 (86.4%) | 40 (13.6%) |
| $25,000 to $49,999 | 1,048 (96.5%) | 38 (3.5%) |
| $50,000 to $74,999 | 1,062 (94.4%) | 63 (5.6%) |
| $75,000 to $99,999 | 2,033 (90.6%) | 212 (9.4%) |
| $100,000 and over | 5,699 (94.2%) | 350 (5.8%) |
Public vs Private Health Insurance Coverage by Age in Lake Monticello
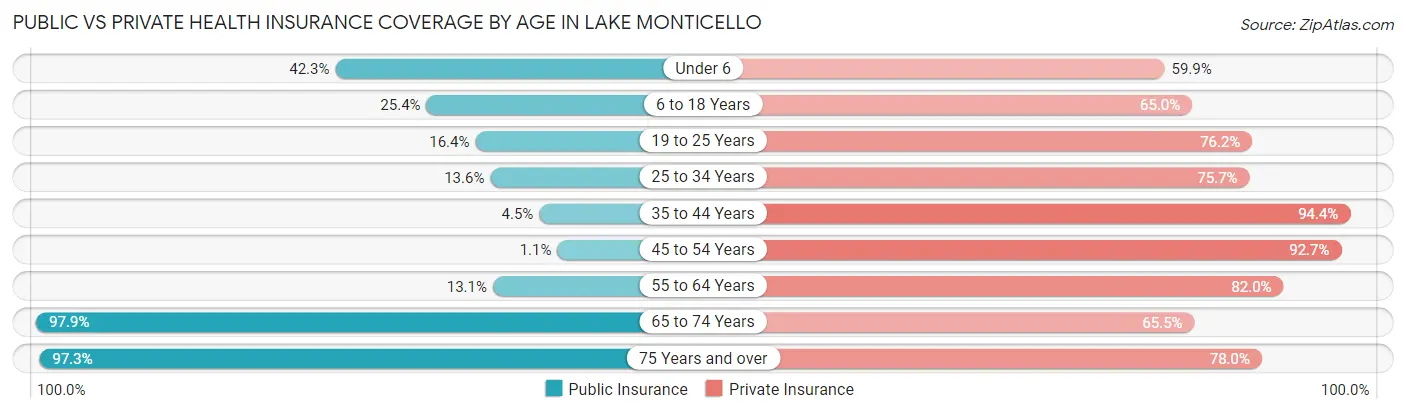
| Age Bracket | Public Insurance | Private Insurance |
| Under 6 | 491 (42.3%) | 695 (59.9%) |
| 6 to 18 Years | 375 (25.4%) | 959 (65.0%) |
| 19 to 25 Years | 129 (16.4%) | 601 (76.2%) |
| 25 to 34 Years | 179 (13.6%) | 998 (75.7%) |
| 35 to 44 Years | 55 (4.5%) | 1,155 (94.4%) |
| 45 to 54 Years | 14 (1.1%) | 1,144 (92.7%) |
| 55 to 64 Years | 175 (13.1%) | 1,096 (82.0%) |
| 65 to 74 Years | 1,286 (97.9%) | 860 (65.4%) |
| 75 Years and over | 922 (97.3%) | 739 (77.9%) |
| Total | 3,626 (33.6%) | 8,247 (76.4%) |
Disability Status by Sex by Age in Lake Monticello
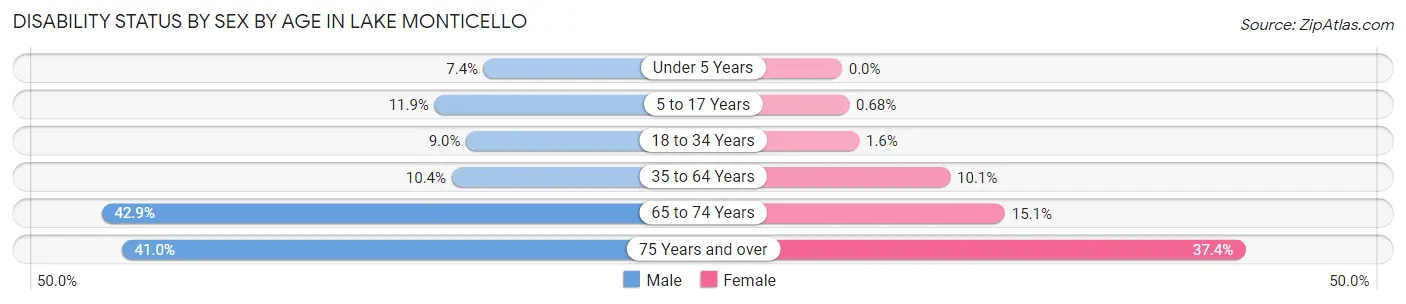
| Age Bracket | Male | Female |
| Under 5 Years | 25 (7.4%) | 0 (0.0%) |
| 5 to 17 Years | 82 (11.9%) | 7 (0.7%) |
| 18 to 34 Years | 86 (9.0%) | 19 (1.6%) |
| 35 to 64 Years | 197 (10.3%) | 190 (10.1%) |
| 65 to 74 Years | 243 (42.9%) | 113 (15.1%) |
| 75 Years and over | 198 (41.0%) | 174 (37.4%) |
Disability Class by Sex by Age in Lake Monticello
Disability Class: Hearing Difficulty
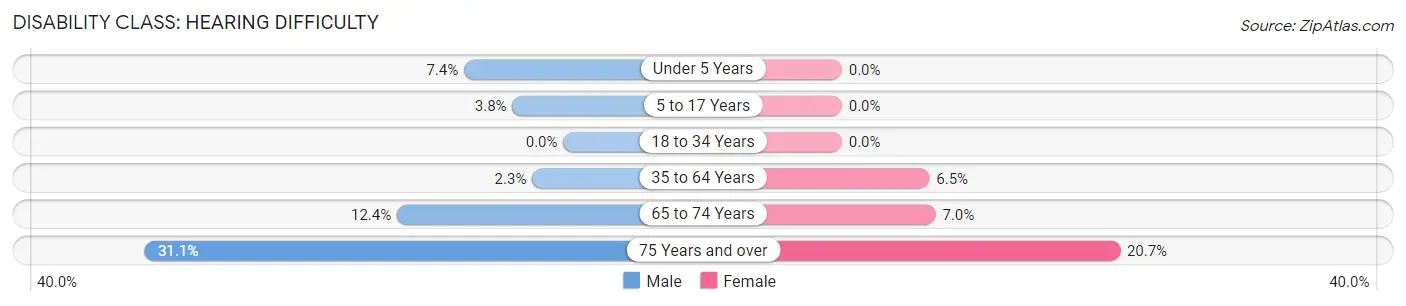
| Age Bracket | Male | Female |
| Under 5 Years | 25 (7.4%) | 0 (0.0%) |
| 5 to 17 Years | 26 (3.8%) | 0 (0.0%) |
| 18 to 34 Years | 0 (0.0%) | 0 (0.0%) |
| 35 to 64 Years | 44 (2.3%) | 123 (6.5%) |
| 65 to 74 Years | 70 (12.3%) | 52 (7.0%) |
| 75 Years and over | 150 (31.1%) | 96 (20.6%) |
Disability Class: Vision Difficulty
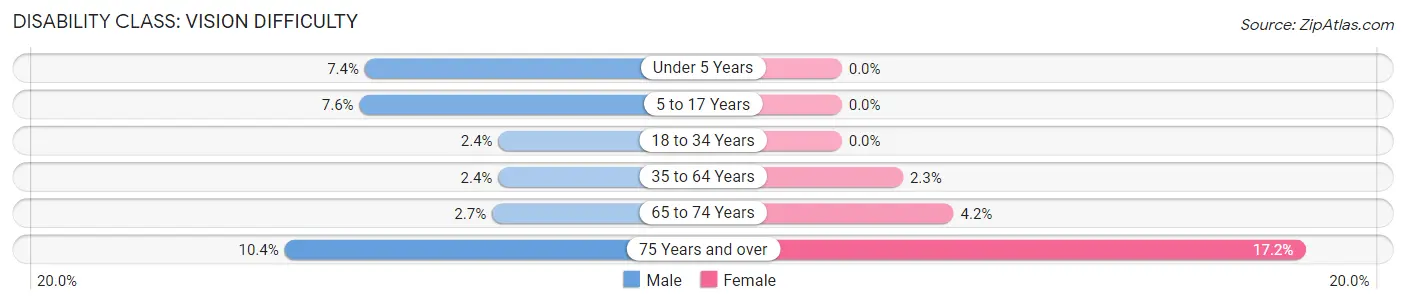
| Age Bracket | Male | Female |
| Under 5 Years | 25 (7.4%) | 0 (0.0%) |
| 5 to 17 Years | 52 (7.6%) | 0 (0.0%) |
| 18 to 34 Years | 23 (2.4%) | 0 (0.0%) |
| 35 to 64 Years | 46 (2.4%) | 43 (2.3%) |
| 65 to 74 Years | 15 (2.6%) | 31 (4.2%) |
| 75 Years and over | 50 (10.3%) | 80 (17.2%) |
Disability Class: Cognitive Difficulty
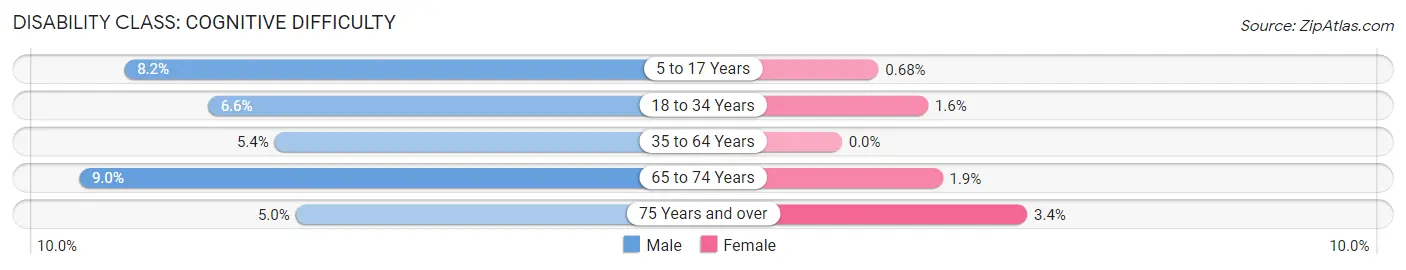
| Age Bracket | Male | Female |
| 5 to 17 Years | 56 (8.2%) | 7 (0.7%) |
| 18 to 34 Years | 63 (6.6%) | 19 (1.6%) |
| 35 to 64 Years | 102 (5.4%) | 0 (0.0%) |
| 65 to 74 Years | 51 (9.0%) | 14 (1.9%) |
| 75 Years and over | 24 (5.0%) | 16 (3.4%) |
Disability Class: Ambulatory Difficulty
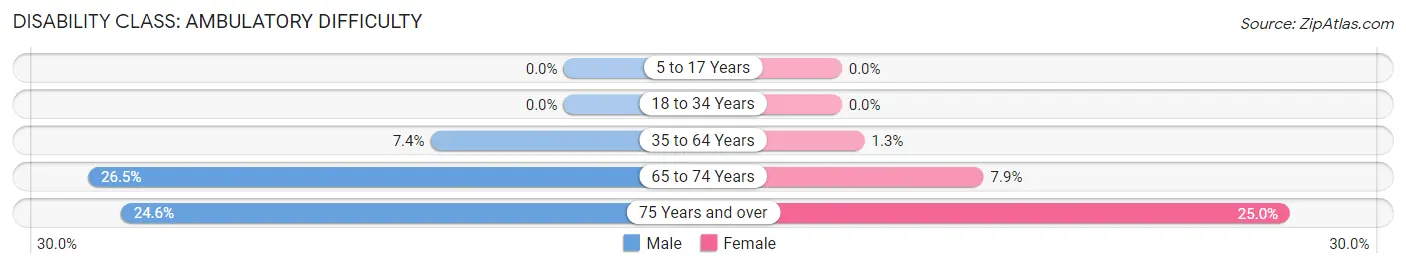
| Age Bracket | Male | Female |
| 5 to 17 Years | 0 (0.0%) | 0 (0.0%) |
| 18 to 34 Years | 0 (0.0%) | 0 (0.0%) |
| 35 to 64 Years | 141 (7.4%) | 24 (1.3%) |
| 65 to 74 Years | 150 (26.5%) | 59 (7.9%) |
| 75 Years and over | 119 (24.6%) | 116 (24.9%) |
Disability Class: Self-Care Difficulty
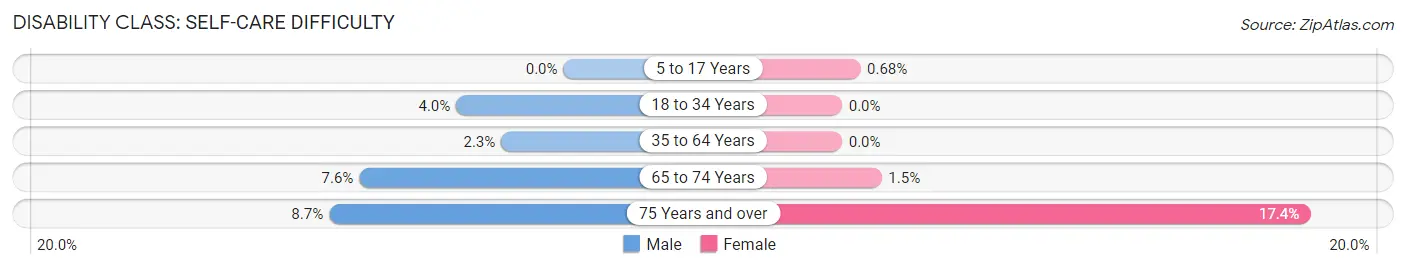
| Age Bracket | Male | Female |
| 5 to 17 Years | 0 (0.0%) | 7 (0.7%) |
| 18 to 34 Years | 38 (4.0%) | 0 (0.0%) |
| 35 to 64 Years | 44 (2.3%) | 0 (0.0%) |
| 65 to 74 Years | 43 (7.6%) | 11 (1.5%) |
| 75 Years and over | 42 (8.7%) | 81 (17.4%) |
Technology Access in Lake Monticello
Computing Device Access in Lake Monticello
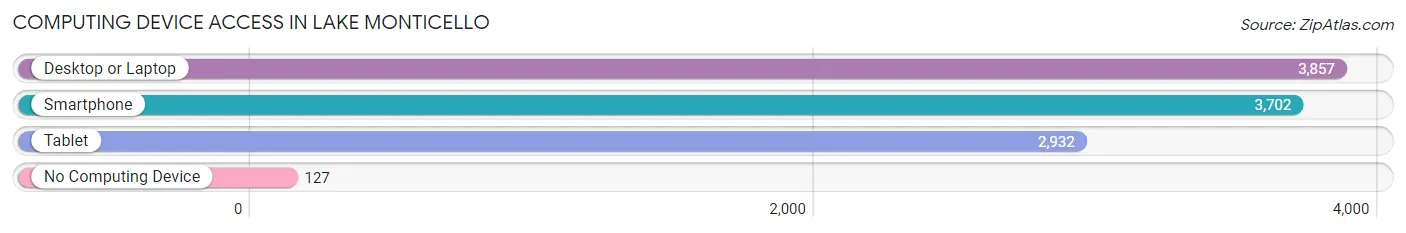
| Device Type | # Households | % Households |
| Desktop or Laptop | 3,857 | 91.8% |
| Smartphone | 3,702 | 88.1% |
| Tablet | 2,932 | 69.8% |
| No Computing Device | 127 | 3.0% |
| Total | 4,200 | 100.0% |
Internet Access in Lake Monticello
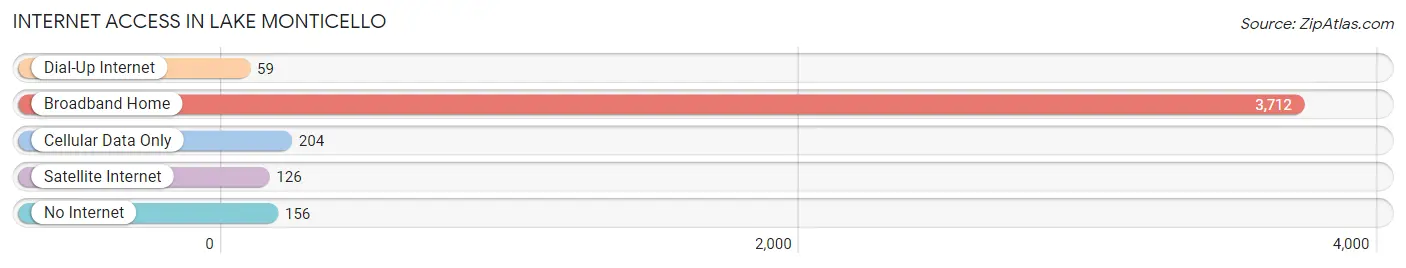
| Internet Type | # Households | % Households |
| Dial-Up Internet | 59 | 1.4% |
| Broadband Home | 3,712 | 88.4% |
| Cellular Data Only | 204 | 4.9% |
| Satellite Internet | 126 | 3.0% |
| No Internet | 156 | 3.7% |
| Total | 4,200 | 100.0% |
Lake Monticello Summary
Lake Monticello is a census-designated place (CDP) located in Fluvanna County, Virginia. It is situated on the eastern shore of Lake Monticello, a reservoir created by the damming of the Rivanna River. The CDP is located approximately 15 miles northeast of Charlottesville and is part of the Charlottesville Metropolitan Statistical Area. As of the 2010 census, the population of Lake Monticello was 4,845.
History
The area that is now Lake Monticello was originally inhabited by the Monacan Indians. The first European settlers arrived in the area in the late 1700s. The area was known as “Monticello” after Thomas Jefferson’s nearby estate. In the early 1900s, the area was developed as a resort community. The Rivanna River was dammed in the 1950s to create the Lake Monticello reservoir, and the area was incorporated as a CDP in the 1970s.
Geography
Lake Monticello is located at 38°2'25"N 78°20'25"W (38.040278, -78.340278). The CDP has a total area of 8.3 square miles, of which 8.2 square miles is land and 0.1 square miles is water. The terrain is mostly hilly and wooded, with the highest point being the dam at the northern end of the lake.
Economy
The economy of Lake Monticello is largely based on tourism and recreation. The lake is a popular destination for fishing, boating, and other water activities. There are also several golf courses in the area, as well as a number of restaurants and other businesses catering to tourists. The area is also home to a number of small businesses, including a winery, a brewery, and a distillery.
Demographics
As of the 2010 census, there were 4,845 people, 1,945 households, and 1,521 families residing in the CDP. The population density was 590.2 people per square mile. The racial makeup of the CDP was 87.2% White, 8.2% African American, 0.3% Native American, 0.7% Asian, 0.1% Pacific Islander, 1.2% from other races, and 2.3% from two or more races. Hispanic or Latino of any race were 3.2% of the population.
The median income for a household in the CDP was $60,938, and the median income for a family was $68,958. The per capita income for the CDP was $30,945. About 4.2% of families and 5.7% of the population were below the poverty line, including 8.2% of those under age 18 and 4.2% of those age 65 or over.
Common Questions
What is the Total Population of Lake Monticello?
Total Population of Lake Monticello is 10,834.
What is the Total Male Population of Lake Monticello?
Total Male Population of Lake Monticello is 4,969.
What is the Total Female Population of Lake Monticello?
Total Female Population of Lake Monticello is 5,865.
What is the Ratio of Males per 100 Females in Lake Monticello?
There are 84.72 Males per 100 Females in Lake Monticello.
What is the Ratio of Females per 100 Males in Lake Monticello?
There are 118.03 Females per 100 Males in Lake Monticello.
What is the Median Population Age in Lake Monticello?
Median Population Age in Lake Monticello is 38.7 Years.
What is the Average Family Size in Lake Monticello
Average Family Size in Lake Monticello is 2.9 People.
What is the Average Household Size in Lake Monticello
Average Household Size in Lake Monticello is 2.6 People.
What is Per Capita Income in Lake Monticello?
Per Capita income in Lake Monticello is $64,305.
What is the Median Family Income in Lake Monticello?
Median Family Income in Lake Monticello is $103,860.
What is the Median Household income in Lake Monticello?
Median Household Income in Lake Monticello is $98,848.
What is Income or Wage Gap in Lake Monticello?
Income or Wage Gap in Lake Monticello is 42.4%.
Women in Lake Monticello earn 57.6 cents for every dollar earned by a man.
What is Family Income Deficit in Lake Monticello?
Family Income Deficit in Lake Monticello is $6,348.
Families that are below poverty line in Lake Monticello earn $6,348 less on average than the poverty threshold level.
What is Inequality or Gini Index in Lake Monticello?
Inequality or Gini Index in Lake Monticello is 0.53.
How Large is the Labor Force in Lake Monticello?
There are 5,229 People in the Labor Forcein in Lake Monticello.
What is the Percentage of People in the Labor Force in Lake Monticello?
61.2% of People are in the Labor Force in Lake Monticello.
What is the Unemployment Rate in Lake Monticello?
Unemployment Rate in Lake Monticello is 1.6%.