Norfolk, VA
Norfolk Map
Norfolk Overview
236,973
TOTAL POPULATION
120,733
MALE POPULATION
116,240
FEMALE POPULATION
103.87
MALES / 100 FEMALES
96.28
FEMALES / 100 MALES
32.2
MEDIAN AGE
3.0
AVG FAMILY SIZE
2.3
AVG HOUSEHOLD SIZE
$35,761
PER CAPITA INCOME
$76,346
AVG FAMILY INCOME
$60,998
AVG HOUSEHOLD INCOME
25.6%
WAGE / INCOME GAP [ % ]
74.4¢/ $1
WAGE / INCOME GAP [ $ ]
$11,395
FAMILY INCOME DEFICIT
0.48
INEQUALITY / GINI INDEX
135,377
LABOR FORCE [ PEOPLE ]
70.0%
PERCENT IN LABOR FORCE
6.7%
UNEMPLOYMENT RATE
Norfolk Zip Codes
Norfolk Area Codes
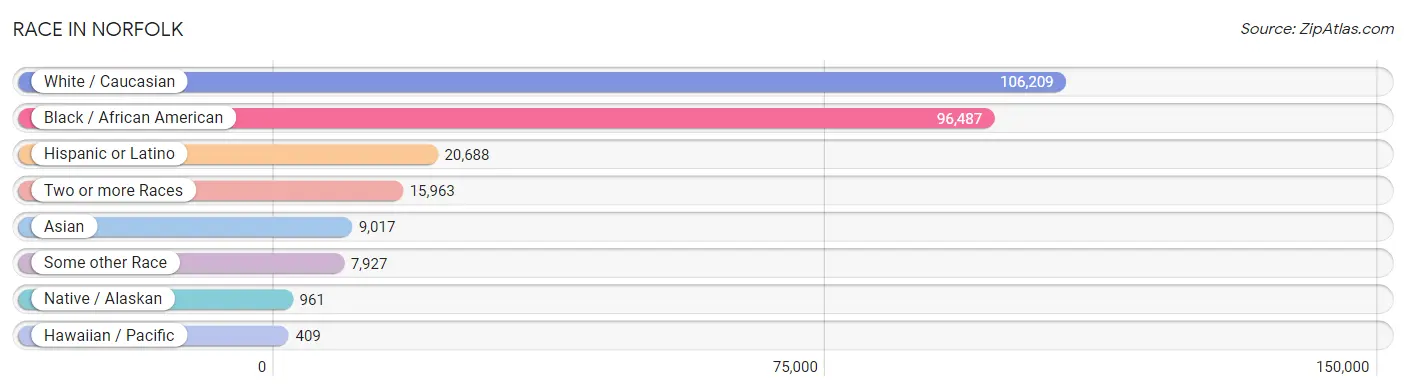
Race in Norfolk
The most populous races in Norfolk are White / Caucasian (106,209 | 44.8%), Black / African American (96,487 | 40.7%), and Hispanic or Latino (20,688 | 8.7%).
| Race | # Population | % Population |
| Asian | 9,017 | 3.8% |
| Black / African American | 96,487 | 40.7% |
| Hawaiian / Pacific | 409 | 0.2% |
| Hispanic or Latino | 20,688 | 8.7% |
| Native / Alaskan | 961 | 0.4% |
| White / Caucasian | 106,209 | 44.8% |
| Two or more Races | 15,963 | 6.7% |
| Some other Race | 7,927 | 3.4% |
| Total | 236,973 | 100.0% |
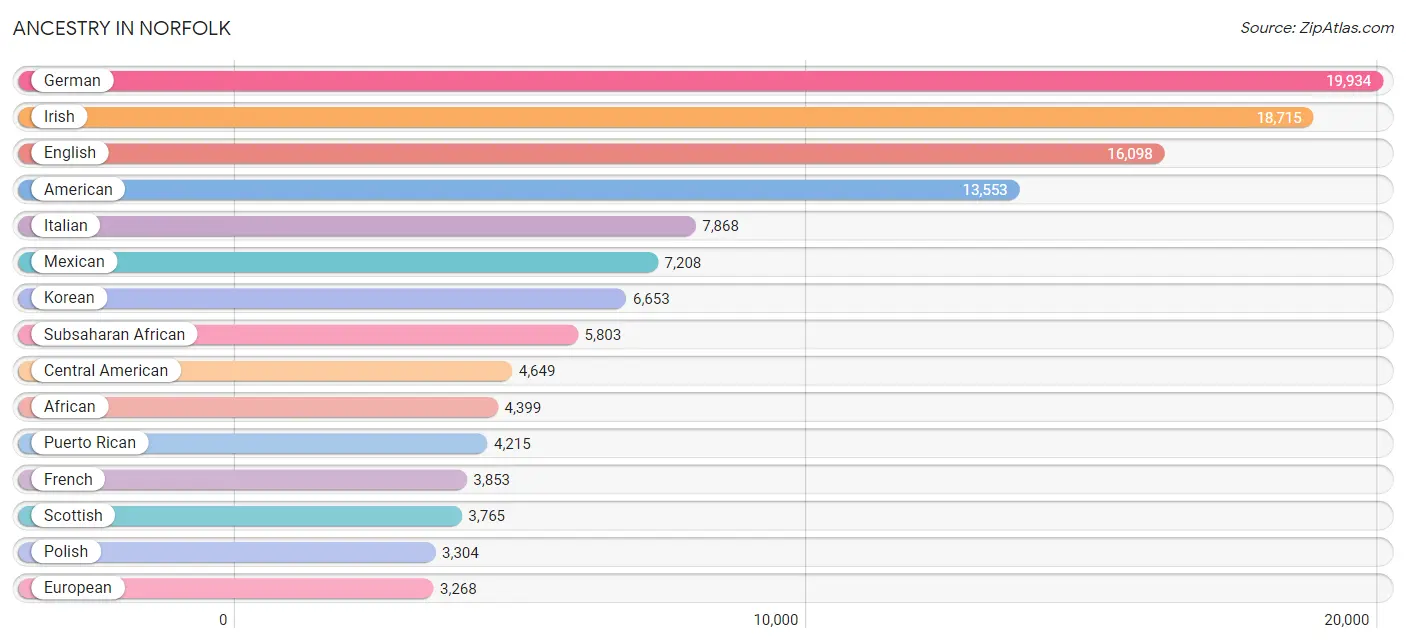
Ancestry in Norfolk
The most populous ancestries reported in Norfolk are German (19,934 | 8.4%), Irish (18,715 | 7.9%), English (16,098 | 6.8%), American (13,553 | 5.7%), and Italian (7,868 | 3.3%), together accounting for 32.1% of all Norfolk residents.
| Ancestry | # Population | % Population |
| Afghan | 95 | 0.0% |
| African | 4,399 | 1.9% |
| Alaska Native | 26 | 0.0% |
| Albanian | 12 | 0.0% |
| Alsatian | 5 | 0.0% |
| American | 13,553 | 5.7% |
| Apache | 89 | 0.0% |
| Arab | 881 | 0.4% |
| Argentinean | 58 | 0.0% |
| Armenian | 43 | 0.0% |
| Australian | 114 | 0.1% |
| Austrian | 311 | 0.1% |
| Bahamian | 75 | 0.0% |
| Bangladeshi | 8 | 0.0% |
| Barbadian | 85 | 0.0% |
| Belgian | 108 | 0.1% |
| Belizean | 268 | 0.1% |
| Bhutanese | 602 | 0.3% |
| Blackfeet | 172 | 0.1% |
| Bolivian | 44 | 0.0% |
| Brazilian | 100 | 0.0% |
| British | 1,346 | 0.6% |
| British West Indian | 17 | 0.0% |
| Bulgarian | 28 | 0.0% |
| Burmese | 721 | 0.3% |
| Cajun | 38 | 0.0% |
| Canadian | 238 | 0.1% |
| Cape Verdean | 43 | 0.0% |
| Celtic | 36 | 0.0% |
| Central American | 4,649 | 2.0% |
| Central American Indian | 167 | 0.1% |
| Cherokee | 802 | 0.3% |
| Chickasaw | 29 | 0.0% |
| Chilean | 21 | 0.0% |
| Chippewa | 15 | 0.0% |
| Choctaw | 104 | 0.0% |
| Colombian | 209 | 0.1% |
| Costa Rican | 90 | 0.0% |
| Creek | 59 | 0.0% |
| Croatian | 181 | 0.1% |
| Cuban | 954 | 0.4% |
| Cypriot | 19 | 0.0% |
| Czech | 321 | 0.1% |
| Czechoslovakian | 55 | 0.0% |
| Danish | 376 | 0.2% |
| Dominican | 1,040 | 0.4% |
| Dutch | 1,235 | 0.5% |
| Eastern European | 641 | 0.3% |
| Ecuadorian | 117 | 0.1% |
| Egyptian | 2 | 0.0% |
| English | 16,098 | 6.8% |
| Estonian | 110 | 0.1% |
| Ethiopian | 208 | 0.1% |
| European | 3,268 | 1.4% |
| Filipino | 124 | 0.1% |
| Finnish | 134 | 0.1% |
| French | 3,853 | 1.6% |
| French Canadian | 805 | 0.3% |
| German | 19,934 | 8.4% |
| Ghanaian | 131 | 0.1% |
| Greek | 1,011 | 0.4% |
| Guamanian / Chamorro | 132 | 0.1% |
| Guatemalan | 532 | 0.2% |
| Guyanese | 162 | 0.1% |
| Haitian | 371 | 0.2% |
| Honduran | 1,925 | 0.8% |
| Hungarian | 578 | 0.2% |
| Indian (Asian) | 1,173 | 0.5% |
| Indonesian | 25 | 0.0% |
| Iranian | 138 | 0.1% |
| Irish | 18,715 | 7.9% |
| Iroquois | 33 | 0.0% |
| Israeli | 57 | 0.0% |
| Italian | 7,868 | 3.3% |
| Jamaican | 974 | 0.4% |
| Japanese | 112 | 0.1% |
| Jordanian | 95 | 0.0% |
| Kiowa | 49 | 0.0% |
| Korean | 6,653 | 2.8% |
| Laotian | 178 | 0.1% |
| Lebanese | 444 | 0.2% |
| Liberian | 64 | 0.0% |
| Lithuanian | 307 | 0.1% |
| Lumbee | 208 | 0.1% |
| Malaysian | 71 | 0.0% |
| Maltese | 22 | 0.0% |
| Mexican | 7,208 | 3.0% |
| Mexican American Indian | 279 | 0.1% |
| Mongolian | 43 | 0.0% |
| Moroccan | 53 | 0.0% |
| Native Hawaiian | 235 | 0.1% |
| Navajo | 174 | 0.1% |
| Nicaraguan | 264 | 0.1% |
| Nigerian | 363 | 0.2% |
| Northern European | 339 | 0.1% |
| Norwegian | 1,604 | 0.7% |
| Pakistani | 218 | 0.1% |
| Palestinian | 105 | 0.0% |
| Panamanian | 395 | 0.2% |
| Paraguayan | 5 | 0.0% |
| Pennsylvania German | 102 | 0.0% |
| Peruvian | 142 | 0.1% |
| Polish | 3,304 | 1.4% |
| Portuguese | 521 | 0.2% |
| Puerto Rican | 4,215 | 1.8% |
| Romanian | 104 | 0.0% |
| Russian | 1,293 | 0.5% |
| Salvadoran | 1,443 | 0.6% |
| Samoan | 123 | 0.1% |
| Scandinavian | 440 | 0.2% |
| Scotch-Irish | 1,803 | 0.8% |
| Scottish | 3,765 | 1.6% |
| Senegalese | 44 | 0.0% |
| Serbian | 114 | 0.1% |
| Sierra Leonean | 98 | 0.0% |
| Sioux | 68 | 0.0% |
| Slavic | 80 | 0.0% |
| Slovak | 232 | 0.1% |
| Slovene | 67 | 0.0% |
| South African | 47 | 0.0% |
| South American | 905 | 0.4% |
| Spaniard | 621 | 0.3% |
| Spanish | 171 | 0.1% |
| Spanish American Indian | 15 | 0.0% |
| Sri Lankan | 710 | 0.3% |
| Subsaharan African | 5,803 | 2.5% |
| Swedish | 1,157 | 0.5% |
| Swiss | 232 | 0.1% |
| Syrian | 111 | 0.1% |
| Thai | 1,185 | 0.5% |
| Tohono O'Odham | 22 | 0.0% |
| Trinidadian and Tobagonian | 202 | 0.1% |
| Turkish | 359 | 0.2% |
| U.S. Virgin Islander | 78 | 0.0% |
| Ugandan | 12 | 0.0% |
| Ukrainian | 366 | 0.2% |
| Uruguayan | 6 | 0.0% |
| Venezuelan | 303 | 0.1% |
| Vietnamese | 125 | 0.1% |
| Welsh | 982 | 0.4% |
| West Indian | 315 | 0.1% |
| Yaqui | 6 | 0.0% |
| Yugoslavian | 111 | 0.1% |
| Zimbabwean | 22 | 0.0% | View All 144 Rows |
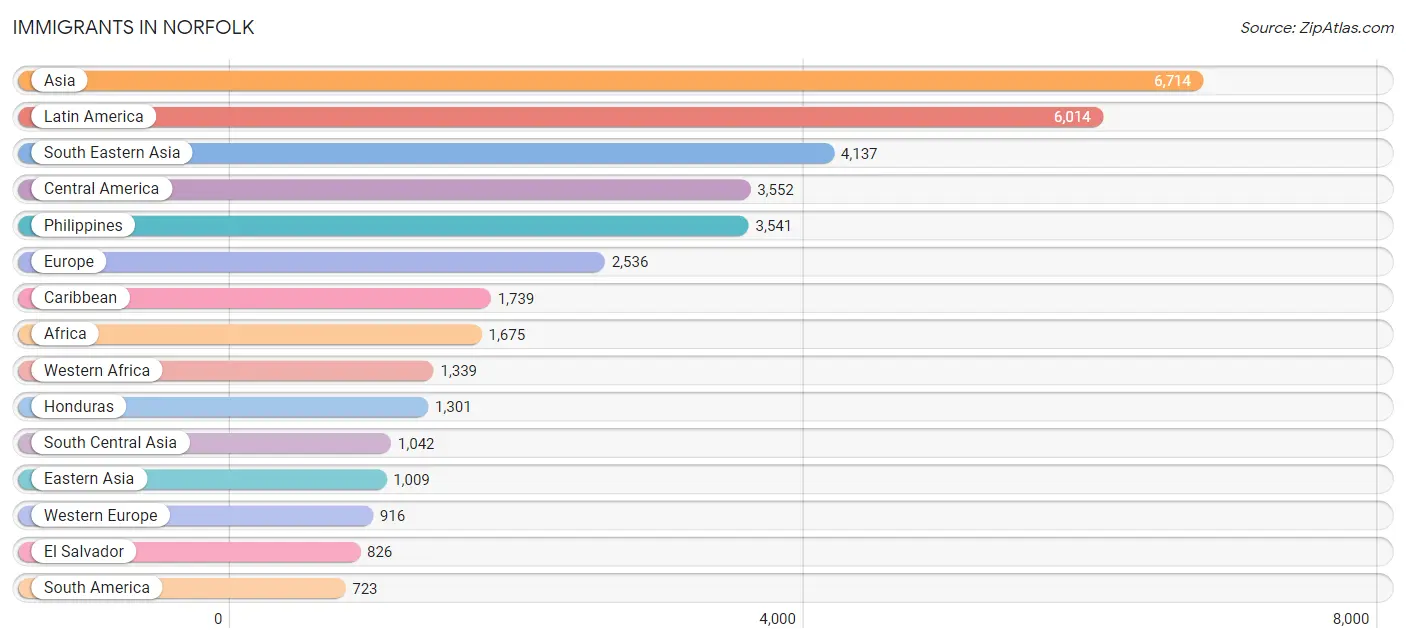
Immigrants in Norfolk
The most numerous immigrant groups reported in Norfolk came from Asia (6,714 | 2.8%), Latin America (6,014 | 2.5%), South Eastern Asia (4,137 | 1.8%), Central America (3,552 | 1.5%), and Philippines (3,541 | 1.5%), together accounting for 10.1% of all Norfolk residents.
| Immigration Origin | # Population | % Population |
| Afghanistan | 84 | 0.0% |
| Africa | 1,675 | 0.7% |
| Albania | 12 | 0.0% |
| Argentina | 51 | 0.0% |
| Armenia | 18 | 0.0% |
| Asia | 6,714 | 2.8% |
| Australia | 42 | 0.0% |
| Austria | 34 | 0.0% |
| Bahamas | 10 | 0.0% |
| Bangladesh | 79 | 0.0% |
| Barbados | 66 | 0.0% |
| Belarus | 75 | 0.0% |
| Belgium | 15 | 0.0% |
| Belize | 16 | 0.0% |
| Bolivia | 16 | 0.0% |
| Brazil | 149 | 0.1% |
| Bulgaria | 8 | 0.0% |
| Cabo Verde | 16 | 0.0% |
| Cambodia | 32 | 0.0% |
| Cameroon | 36 | 0.0% |
| Canada | 364 | 0.2% |
| Caribbean | 1,739 | 0.7% |
| Central America | 3,552 | 1.5% |
| Chile | 8 | 0.0% |
| China | 594 | 0.3% |
| Colombia | 149 | 0.1% |
| Costa Rica | 44 | 0.0% |
| Cuba | 97 | 0.0% |
| Czechoslovakia | 28 | 0.0% |
| Denmark | 52 | 0.0% |
| Dominica | 27 | 0.0% |
| Dominican Republic | 499 | 0.2% |
| Eastern Africa | 114 | 0.1% |
| Eastern Asia | 1,009 | 0.4% |
| Eastern Europe | 488 | 0.2% |
| Ecuador | 76 | 0.0% |
| Egypt | 6 | 0.0% |
| El Salvador | 826 | 0.4% |
| England | 130 | 0.1% |
| Ethiopia | 77 | 0.0% |
| Europe | 2,536 | 1.1% |
| Fiji | 32 | 0.0% |
| France | 258 | 0.1% |
| Germany | 480 | 0.2% |
| Ghana | 491 | 0.2% |
| Greece | 59 | 0.0% |
| Guatemala | 312 | 0.1% |
| Guyana | 40 | 0.0% |
| Haiti | 127 | 0.1% |
| Honduras | 1,301 | 0.5% |
| Hong Kong | 35 | 0.0% |
| Hungary | 16 | 0.0% |
| India | 514 | 0.2% |
| Indonesia | 22 | 0.0% |
| Iran | 57 | 0.0% |
| Iraq | 11 | 0.0% |
| Israel | 6 | 0.0% |
| Italy | 246 | 0.1% |
| Jamaica | 620 | 0.3% |
| Japan | 118 | 0.1% |
| Jordan | 46 | 0.0% |
| Kenya | 8 | 0.0% |
| Korea | 297 | 0.1% |
| Kuwait | 11 | 0.0% |
| Laos | 44 | 0.0% |
| Latin America | 6,014 | 2.5% |
| Lebanon | 29 | 0.0% |
| Liberia | 73 | 0.0% |
| Lithuania | 9 | 0.0% |
| Mexico | 704 | 0.3% |
| Micronesia | 85 | 0.0% |
| Middle Africa | 43 | 0.0% |
| Morocco | 24 | 0.0% |
| Nepal | 93 | 0.0% |
| Netherlands | 105 | 0.0% |
| Nicaragua | 218 | 0.1% |
| Nigeria | 365 | 0.2% |
| Northern Africa | 37 | 0.0% |
| Northern Europe | 712 | 0.3% |
| Oceania | 175 | 0.1% |
| Pakistan | 189 | 0.1% |
| Panama | 131 | 0.1% |
| Peru | 69 | 0.0% |
| Philippines | 3,541 | 1.5% |
| Poland | 42 | 0.0% |
| Portugal | 11 | 0.0% |
| Romania | 39 | 0.0% |
| Russia | 130 | 0.1% |
| Saudi Arabia | 31 | 0.0% |
| Scotland | 197 | 0.1% |
| Senegal | 97 | 0.0% |
| Serbia | 19 | 0.0% |
| South Africa | 34 | 0.0% |
| South America | 723 | 0.3% |
| South Central Asia | 1,042 | 0.4% |
| South Eastern Asia | 4,137 | 1.8% |
| Southern Europe | 420 | 0.2% |
| Spain | 104 | 0.0% |
| Sri Lanka | 26 | 0.0% |
| St. Vincent and the Grenadines | 8 | 0.0% |
| Sweden | 13 | 0.0% |
| Switzerland | 24 | 0.0% |
| Taiwan | 37 | 0.0% |
| Thailand | 84 | 0.0% |
| Trinidad and Tobago | 149 | 0.1% |
| Turkey | 167 | 0.1% |
| Uganda | 20 | 0.0% |
| Ukraine | 77 | 0.0% |
| Uruguay | 6 | 0.0% |
| Venezuela | 159 | 0.1% |
| Vietnam | 385 | 0.2% |
| Western Africa | 1,339 | 0.6% |
| Western Asia | 501 | 0.2% |
| Western Europe | 916 | 0.4% |
| Yemen | 8 | 0.0% | View All 115 Rows |
Sex and Age in Norfolk
Sex and Age in Norfolk
The most populous age groups in Norfolk are 20 to 24 Years (16,599 | 13.8%) for men and 20 to 24 Years (11,337 | 9.8%) for women.
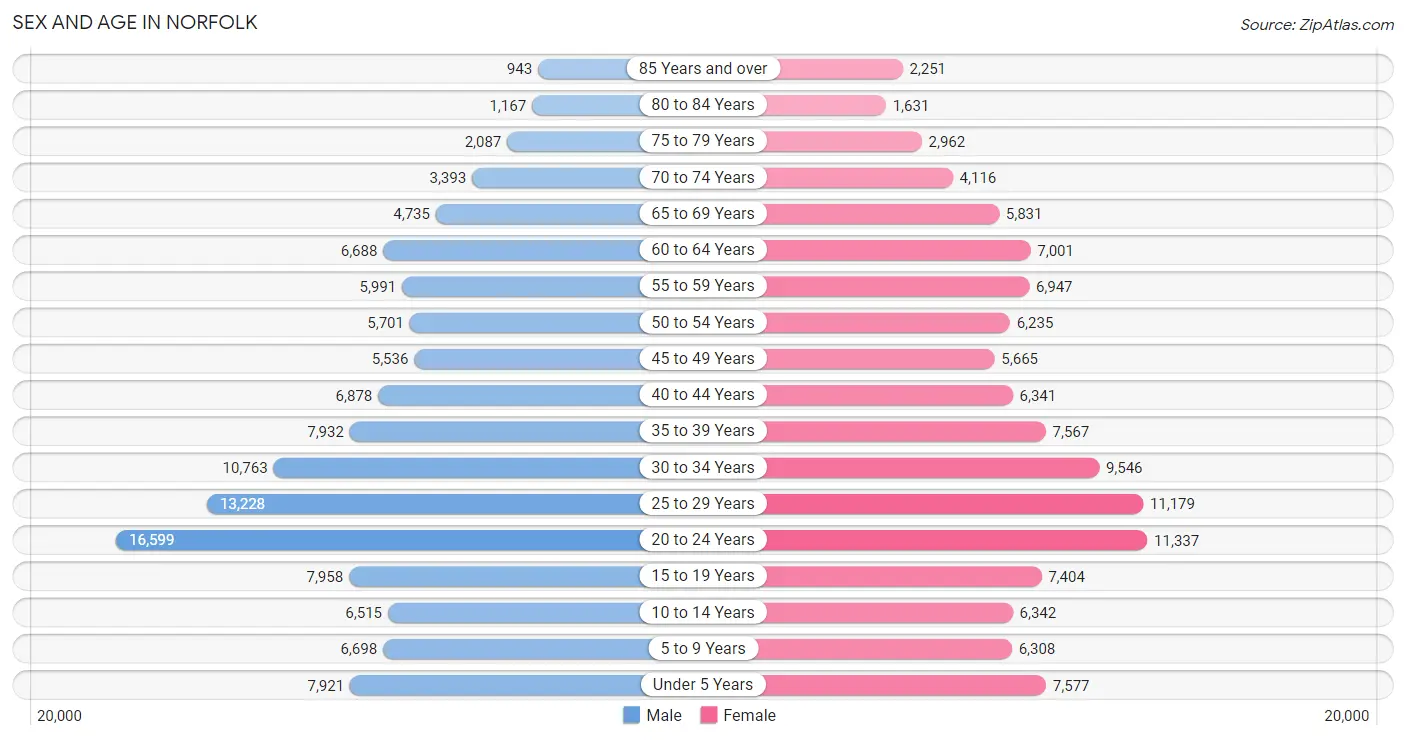
| Age Bracket | Male | Female |
| Under 5 Years | 7,921 (6.6%) | 7,577 (6.5%) |
| 5 to 9 Years | 6,698 (5.6%) | 6,308 (5.4%) |
| 10 to 14 Years | 6,515 (5.4%) | 6,342 (5.5%) |
| 15 to 19 Years | 7,958 (6.6%) | 7,404 (6.4%) |
| 20 to 24 Years | 16,599 (13.8%) | 11,337 (9.8%) |
| 25 to 29 Years | 13,228 (11.0%) | 11,179 (9.6%) |
| 30 to 34 Years | 10,763 (8.9%) | 9,546 (8.2%) |
| 35 to 39 Years | 7,932 (6.6%) | 7,567 (6.5%) |
| 40 to 44 Years | 6,878 (5.7%) | 6,341 (5.5%) |
| 45 to 49 Years | 5,536 (4.6%) | 5,665 (4.9%) |
| 50 to 54 Years | 5,701 (4.7%) | 6,235 (5.4%) |
| 55 to 59 Years | 5,991 (5.0%) | 6,947 (6.0%) |
| 60 to 64 Years | 6,688 (5.5%) | 7,001 (6.0%) |
| 65 to 69 Years | 4,735 (3.9%) | 5,831 (5.0%) |
| 70 to 74 Years | 3,393 (2.8%) | 4,116 (3.5%) |
| 75 to 79 Years | 2,087 (1.7%) | 2,962 (2.5%) |
| 80 to 84 Years | 1,167 (1.0%) | 1,631 (1.4%) |
| 85 Years and over | 943 (0.8%) | 2,251 (1.9%) |
| Total | 120,733 (100.0%) | 116,240 (100.0%) |
Families and Households in Norfolk
Median Family Size in Norfolk
The median family size in Norfolk is 2.98 persons per family, with single female/mother families (16,521 | 31.6%) accounting for the largest median family size of 3.04 persons per family. On the other hand, single male/father families (4,671 | 8.9%) represent the smallest median family size with 2.56 persons per family.
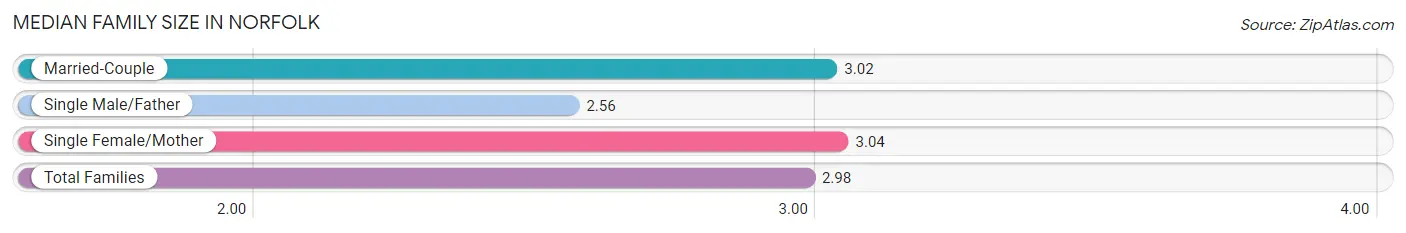
| Family Type | # Families | Family Size |
| Married-Couple | 31,153 (59.5%) | 3.02 |
| Single Male/Father | 4,671 (8.9%) | 2.56 |
| Single Female/Mother | 16,521 (31.6%) | 3.04 |
| Total Families | 52,345 (100.0%) | 2.98 |
Median Household Size in Norfolk
The median household size in Norfolk is 2.29 persons per household, with single female/mother households (16,521 | 17.6%) accounting for the largest median household size of 3.21 persons per household. non-family households (41,452 | 44.2%) represent the smallest median household size with 1.29 persons per household.
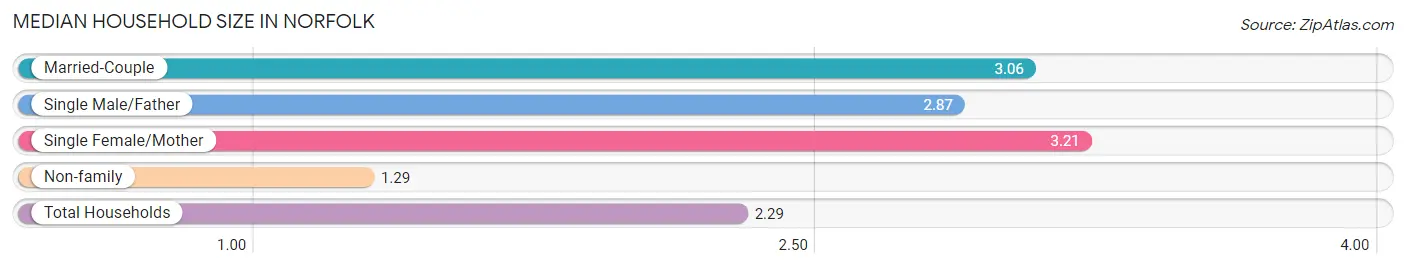
| Household Type | # Households | Household Size |
| Married-Couple | 31,153 (33.2%) | 3.06 |
| Single Male/Father | 4,671 (5.0%) | 2.87 |
| Single Female/Mother | 16,521 (17.6%) | 3.21 |
| Non-family | 41,452 (44.2%) | 1.29 |
| Total Households | 93,797 (100.0%) | 2.29 |
Household Size by Marriage Status in Norfolk
Out of a total of 93,797 households in Norfolk, 52,345 (55.8%) are family households, while 41,452 (44.2%) are nonfamily households. The most numerous type of family households are 2-person households, comprising 23,702, and the most common type of nonfamily households are 1-person households, comprising 32,445.
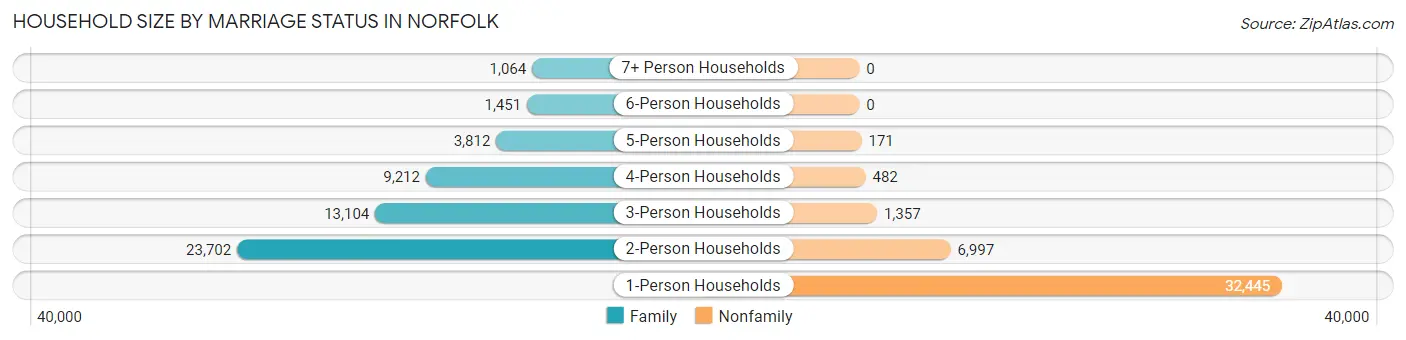
| Household Size | Family Households | Nonfamily Households |
| 1-Person Households | - | 32,445 (34.6%) |
| 2-Person Households | 23,702 (25.3%) | 6,997 (7.5%) |
| 3-Person Households | 13,104 (14.0%) | 1,357 (1.5%) |
| 4-Person Households | 9,212 (9.8%) | 482 (0.5%) |
| 5-Person Households | 3,812 (4.1%) | 171 (0.2%) |
| 6-Person Households | 1,451 (1.5%) | 0 (0.0%) |
| 7+ Person Households | 1,064 (1.1%) | 0 (0.0%) |
| Total | 52,345 (55.8%) | 41,452 (44.2%) |
Female Fertility in Norfolk
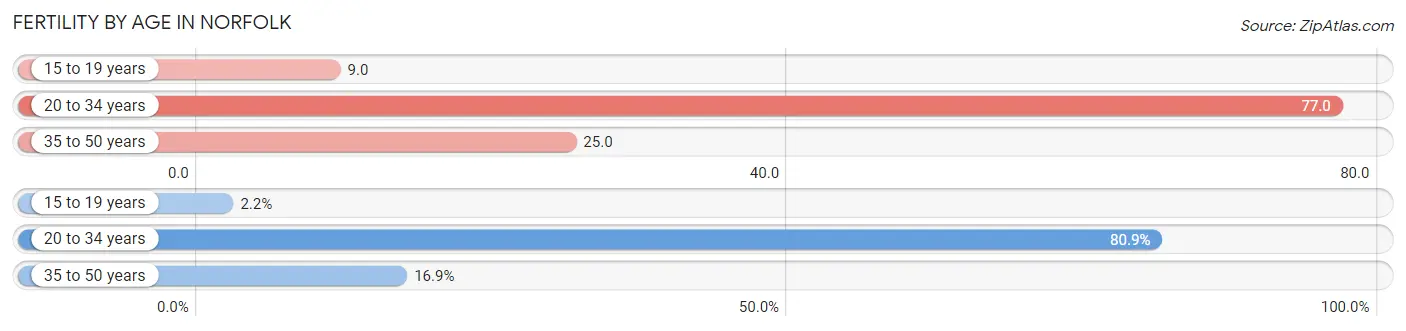
Fertility by Age in Norfolk
Average fertility rate in Norfolk is 51.0 births per 1,000 women. Women in the age bracket of 20 to 34 years have the highest fertility rate with 77.0 births per 1,000 women. Women in the age bracket of 20 to 34 years acount for 80.9% of all women with births.
| Age Bracket | Women with Births | Births / 1,000 Women |
| 15 to 19 years | 66 (2.2%) | 9.0 |
| 20 to 34 years | 2,471 (80.9%) | 77.0 |
| 35 to 50 years | 516 (16.9%) | 25.0 |
| Total | 3,053 (100.0%) | 51.0 |
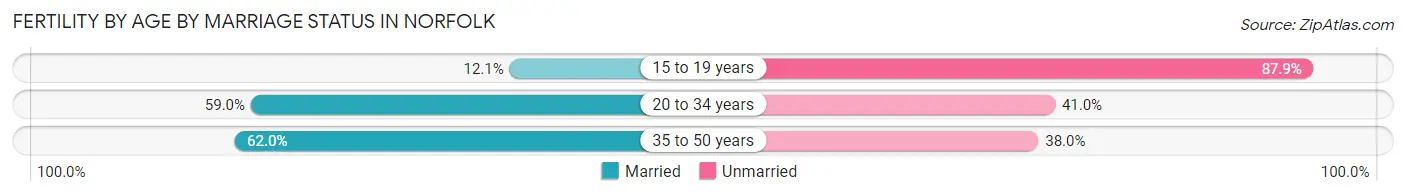
Fertility by Age by Marriage Status in Norfolk
58.5% of women with births (3,053) in Norfolk are married. The highest percentage of unmarried women with births falls into 15 to 19 years age bracket with 87.9% of them unmarried at the time of birth, while the lowest percentage of unmarried women with births belong to 35 to 50 years age bracket with 38.0% of them unmarried.
| Age Bracket | Married | Unmarried |
| 15 to 19 years | 8 (12.1%) | 58 (87.9%) |
| 20 to 34 years | 1,458 (59.0%) | 1,013 (41.0%) |
| 35 to 50 years | 320 (62.0%) | 196 (38.0%) |
| Total | 1,786 (58.5%) | 1,267 (41.5%) |
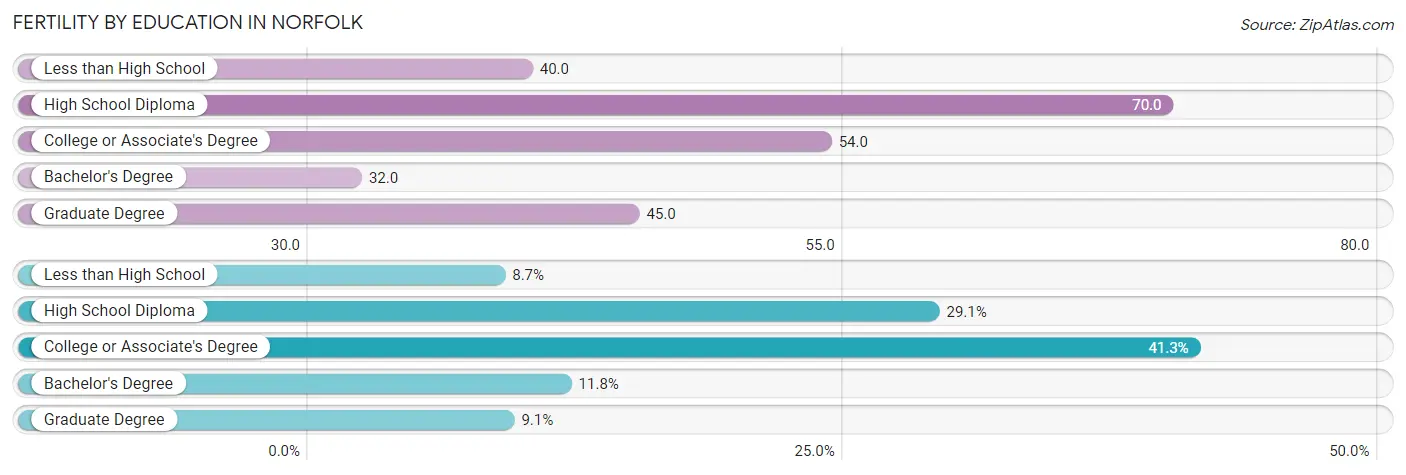
Fertility by Education in Norfolk
Average fertility rate in Norfolk is 51.0 births per 1,000 women. Women with the education attainment of high school diploma have the highest fertility rate of 70.0 births per 1,000 women, while women with the education attainment of bachelor's degree have the lowest fertility at 32.0 births per 1,000 women. Women with the education attainment of college or associate's degree represent 41.3% of all women with births.
| Educational Attainment | Women with Births | Births / 1,000 Women |
| Less than High School | 266 (8.7%) | 40.0 |
| High School Diploma | 887 (29.0%) | 70.0 |
| College or Associate's Degree | 1,260 (41.3%) | 54.0 |
| Bachelor's Degree | 361 (11.8%) | 32.0 |
| Graduate Degree | 279 (9.1%) | 45.0 |
| Total | 3,053 (100.0%) | 51.0 |
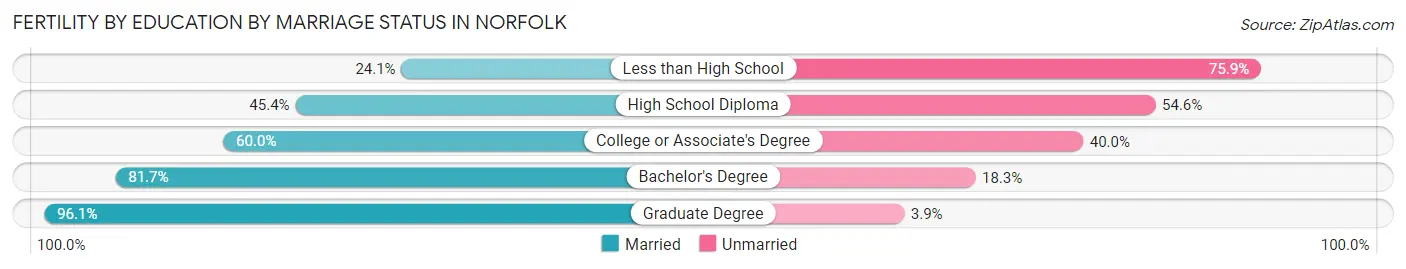
Fertility by Education by Marriage Status in Norfolk
41.5% of women with births in Norfolk are unmarried. Women with the educational attainment of graduate degree are most likely to be married with 96.1% of them married at childbirth, while women with the educational attainment of less than high school are least likely to be married with 75.9% of them unmarried at childbirth.
| Educational Attainment | Married | Unmarried |
| Less than High School | 64 (24.1%) | 202 (75.9%) |
| High School Diploma | 403 (45.4%) | 484 (54.6%) |
| College or Associate's Degree | 756 (60.0%) | 504 (40.0%) |
| Bachelor's Degree | 295 (81.7%) | 66 (18.3%) |
| Graduate Degree | 268 (96.1%) | 11 (3.9%) |
| Total | 1,786 (58.5%) | 1,267 (41.5%) |
Income in Norfolk
Income Overview in Norfolk
Per Capita Income in Norfolk is $35,761, while median incomes of families and households are $76,346 and $60,998 respectively.
| Characteristic | Number | Measure |
| Per Capita Income | 236,973 | $35,761 |
| Median Family Income | 52,345 | $76,346 |
| Mean Family Income | 52,345 | $99,885 |
| Median Household Income | 93,797 | $60,998 |
| Mean Household Income | 93,797 | $84,497 |
| Income Deficit | 52,345 | $11,395 |
| Wage / Income Gap (%) | 236,973 | 25.60% |
| Wage / Income Gap ($) | 236,973 | 74.40¢ per $1 |
| Gini / Inequality Index | 236,973 | 0.48 |
Earnings by Sex in Norfolk
Average Earnings in Norfolk are $34,181, $39,418 for men and $29,327 for women, a difference of 25.6%.
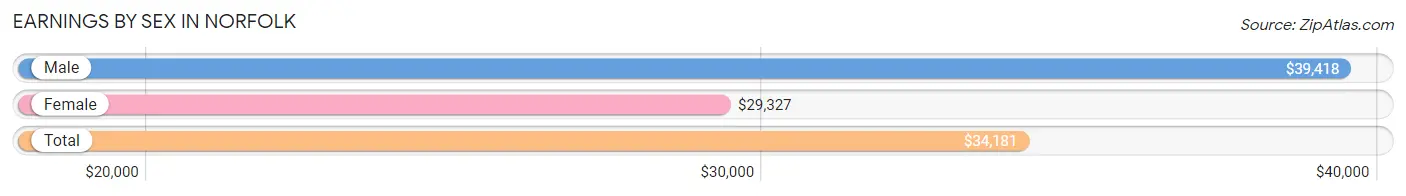
| Sex | Number | Average Earnings |
| Male | 76,447 (54.2%) | $39,418 |
| Female | 64,497 (45.8%) | $29,327 |
| Total | 140,944 (100.0%) | $34,181 |
Earnings by Sex by Income Bracket in Norfolk
The most common earnings brackets in Norfolk are $100,000+ for men (8,410 | 11.0%) and $25,000 to $29,999 for women (5,597 | 8.7%).
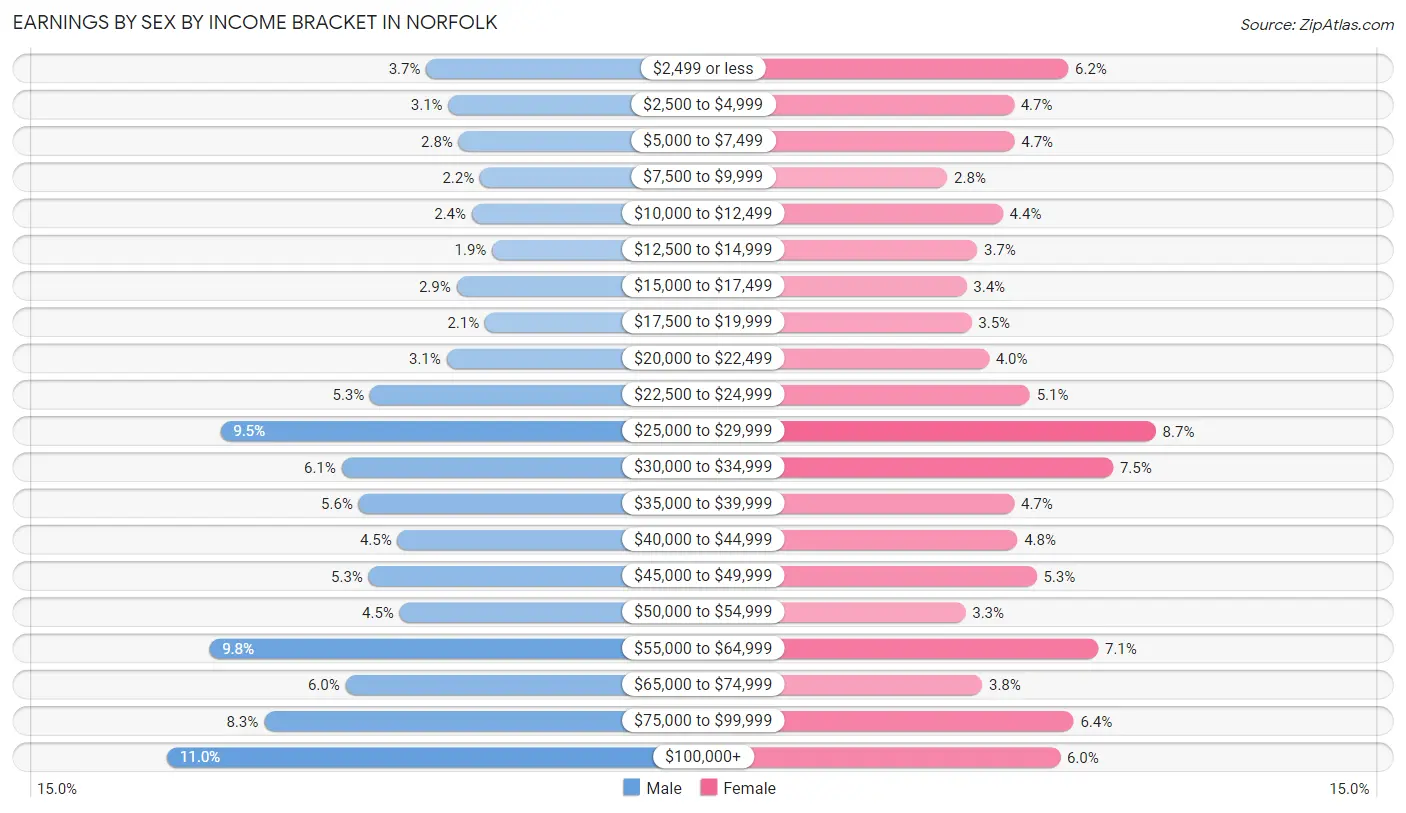
| Income | Male | Female |
| $2,499 or less | 2,837 (3.7%) | 4,009 (6.2%) |
| $2,500 to $4,999 | 2,360 (3.1%) | 3,023 (4.7%) |
| $5,000 to $7,499 | 2,144 (2.8%) | 3,040 (4.7%) |
| $7,500 to $9,999 | 1,683 (2.2%) | 1,821 (2.8%) |
| $10,000 to $12,499 | 1,859 (2.4%) | 2,826 (4.4%) |
| $12,500 to $14,999 | 1,422 (1.9%) | 2,362 (3.7%) |
| $15,000 to $17,499 | 2,185 (2.9%) | 2,164 (3.4%) |
| $17,500 to $19,999 | 1,571 (2.1%) | 2,256 (3.5%) |
| $20,000 to $22,499 | 2,400 (3.1%) | 2,574 (4.0%) |
| $22,500 to $24,999 | 4,044 (5.3%) | 3,315 (5.1%) |
| $25,000 to $29,999 | 7,260 (9.5%) | 5,597 (8.7%) |
| $30,000 to $34,999 | 4,656 (6.1%) | 4,824 (7.5%) |
| $35,000 to $39,999 | 4,292 (5.6%) | 3,034 (4.7%) |
| $40,000 to $44,999 | 3,455 (4.5%) | 3,087 (4.8%) |
| $45,000 to $49,999 | 4,074 (5.3%) | 3,436 (5.3%) |
| $50,000 to $54,999 | 3,407 (4.5%) | 2,150 (3.3%) |
| $55,000 to $64,999 | 7,501 (9.8%) | 4,554 (7.1%) |
| $65,000 to $74,999 | 4,568 (6.0%) | 2,451 (3.8%) |
| $75,000 to $99,999 | 6,319 (8.3%) | 4,111 (6.4%) |
| $100,000+ | 8,410 (11.0%) | 3,863 (6.0%) |
| Total | 76,447 (100.0%) | 64,497 (100.0%) |
Earnings by Sex by Educational Attainment in Norfolk
Average earnings in Norfolk are $49,905 for men and $34,878 for women, a difference of 30.1%. Men with an educational attainment of graduate degree enjoy the highest average annual earnings of $88,579, while those with less than high school education earn the least with $29,061. Women with an educational attainment of graduate degree earn the most with the average annual earnings of $62,957, while those with less than high school education have the smallest earnings of $22,214.
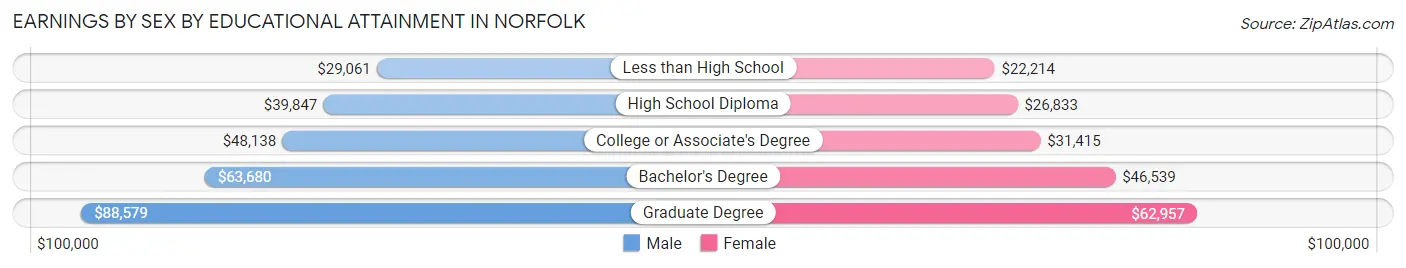
| Educational Attainment | Male Income | Female Income |
| Less than High School | $29,061 | $22,214 |
| High School Diploma | $39,847 | $26,833 |
| College or Associate's Degree | $48,138 | $31,415 |
| Bachelor's Degree | $63,680 | $46,539 |
| Graduate Degree | $88,579 | $62,957 |
| Total | $49,905 | $34,878 |
Family Income in Norfolk
Family Income Brackets in Norfolk
According to the Norfolk family income data, there are 9,998 families falling into the $100,000 to $149,999 income range, which is the most common income bracket and makes up 19.1% of all families. Conversely, the $10,000 to $14,999 income bracket is the least frequent group with only 1,413 families (2.7%) belonging to this category.
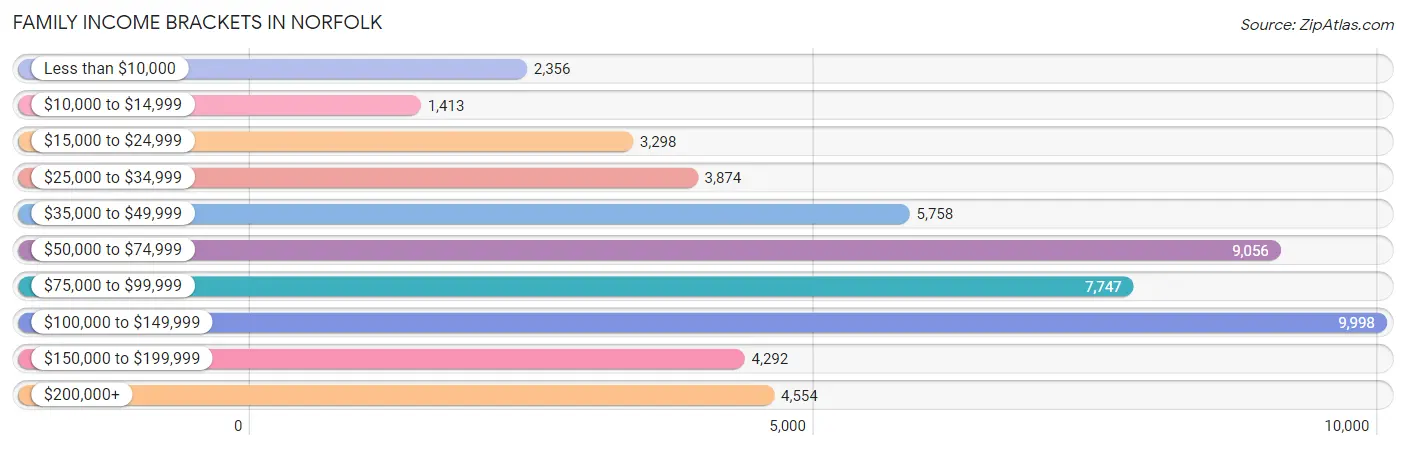
| Income Bracket | # Families | % Families |
| Less than $10,000 | 2,356 | 4.5% |
| $10,000 to $14,999 | 1,413 | 2.7% |
| $15,000 to $24,999 | 3,298 | 6.3% |
| $25,000 to $34,999 | 3,874 | 7.4% |
| $35,000 to $49,999 | 5,758 | 11.0% |
| $50,000 to $74,999 | 9,056 | 17.3% |
| $75,000 to $99,999 | 7,747 | 14.8% |
| $100,000 to $149,999 | 9,998 | 19.1% |
| $150,000 to $199,999 | 4,292 | 8.2% |
| $200,000+ | 4,554 | 8.7% |
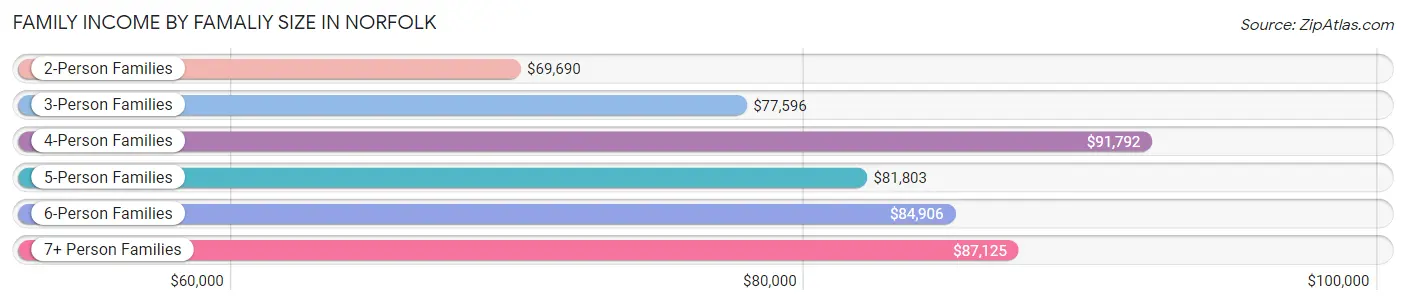
Family Income by Famaliy Size in Norfolk
4-person families (8,573 | 16.4%) account for the highest median family income in Norfolk with $91,792 per family, while 2-person families (25,888 | 49.5%) have the highest median income of $34,845 per family member.
| Income Bracket | # Families | Median Income |
| 2-Person Families | 25,888 (49.5%) | $69,690 |
| 3-Person Families | 12,353 (23.6%) | $77,596 |
| 4-Person Families | 8,573 (16.4%) | $91,792 |
| 5-Person Families | 3,376 (6.5%) | $81,803 |
| 6-Person Families | 1,290 (2.5%) | $84,906 |
| 7+ Person Families | 865 (1.7%) | $87,125 |
| Total | 52,345 (100.0%) | $76,346 |
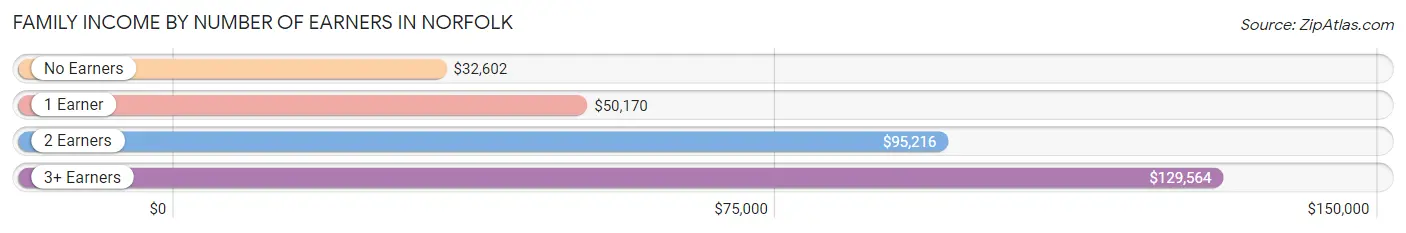
Family Income by Number of Earners in Norfolk
The median family income in Norfolk is $76,346, with families comprising 3+ earners (4,553) having the highest median family income of $129,564, while families with no earners (5,773) have the lowest median family income of $32,602, accounting for 8.7% and 11.0% of families, respectively.
| Number of Earners | # Families | Median Income |
| No Earners | 5,773 (11.0%) | $32,602 |
| 1 Earner | 19,153 (36.6%) | $50,170 |
| 2 Earners | 22,866 (43.7%) | $95,216 |
| 3+ Earners | 4,553 (8.7%) | $129,564 |
| Total | 52,345 (100.0%) | $76,346 |
Household Income in Norfolk
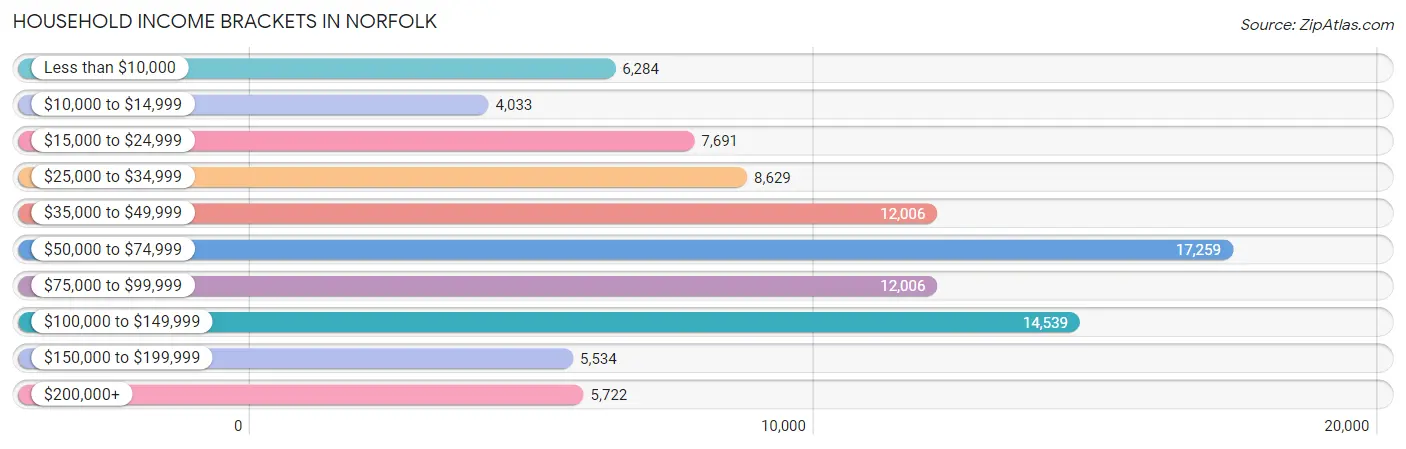
Household Income Brackets in Norfolk
With 17,259 households falling in the category, the $50,000 to $74,999 income range is the most frequent in Norfolk, accounting for 18.4% of all households. In contrast, only 4,033 households (4.3%) fall into the $10,000 to $14,999 income bracket, making it the least populous group.
| Income Bracket | # Households | % Households |
| Less than $10,000 | 6,284 | 6.7% |
| $10,000 to $14,999 | 4,033 | 4.3% |
| $15,000 to $24,999 | 7,691 | 8.2% |
| $25,000 to $34,999 | 8,629 | 9.2% |
| $35,000 to $49,999 | 12,006 | 12.8% |
| $50,000 to $74,999 | 17,259 | 18.4% |
| $75,000 to $99,999 | 12,006 | 12.8% |
| $100,000 to $149,999 | 14,539 | 15.5% |
| $150,000 to $199,999 | 5,534 | 5.9% |
| $200,000+ | 5,722 | 6.1% |
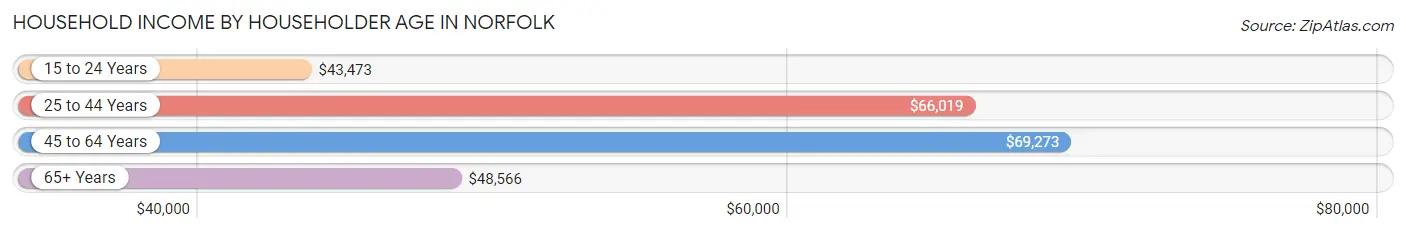
Household Income by Householder Age in Norfolk
The median household income in Norfolk is $60,998, with the highest median household income of $69,273 found in the 45 to 64 years age bracket for the primary householder. A total of 29,169 households (31.1%) fall into this category. Meanwhile, the 15 to 24 years age bracket for the primary householder has the lowest median household income of $43,473, with 6,254 households (6.7%) in this group.
| Income Bracket | # Households | Median Income |
| 15 to 24 Years | 6,254 (6.7%) | $43,473 |
| 25 to 44 Years | 38,520 (41.1%) | $66,019 |
| 45 to 64 Years | 29,169 (31.1%) | $69,273 |
| 65+ Years | 19,854 (21.2%) | $48,566 |
| Total | 93,797 (100.0%) | $60,998 |
Poverty in Norfolk
Income Below Poverty by Sex and Age in Norfolk
With 14.4% poverty level for males and 19.3% for females among the residents of Norfolk, 5 year old males and under 5 year old females are the most vulnerable to poverty, with 422 males (27.9%) and 2,358 females (31.5%) in their respective age groups living below the poverty level.
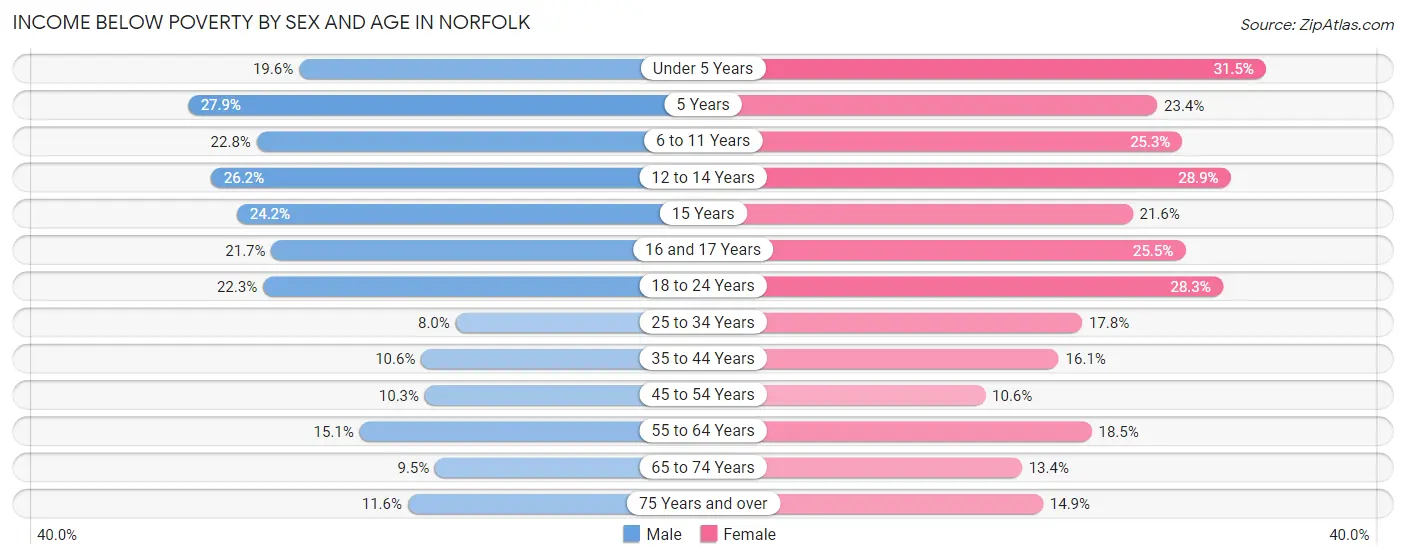
| Age Bracket | Male | Female |
| Under 5 Years | 1,526 (19.6%) | 2,358 (31.5%) |
| 5 Years | 422 (27.9%) | 397 (23.4%) |
| 6 to 11 Years | 1,789 (22.8%) | 1,762 (25.3%) |
| 12 to 14 Years | 954 (26.2%) | 1,126 (28.8%) |
| 15 Years | 295 (24.2%) | 215 (21.6%) |
| 16 and 17 Years | 458 (21.7%) | 580 (25.5%) |
| 18 to 24 Years | 2,437 (22.3%) | 2,535 (28.3%) |
| 25 to 34 Years | 1,772 (8.0%) | 3,599 (17.8%) |
| 35 to 44 Years | 1,518 (10.5%) | 2,225 (16.1%) |
| 45 to 54 Years | 1,139 (10.3%) | 1,262 (10.6%) |
| 55 to 64 Years | 1,887 (15.1%) | 2,572 (18.5%) |
| 65 to 74 Years | 756 (9.5%) | 1,310 (13.4%) |
| 75 Years and over | 465 (11.6%) | 983 (14.9%) |
| Total | 15,418 (14.4%) | 20,924 (19.3%) |
Income Above Poverty by Sex and Age in Norfolk
According to the poverty statistics in Norfolk, males aged 25 to 34 years and females aged 45 to 54 years are the age groups that are most secure financially, with 92.0% of males and 89.4% of females in these age groups living above the poverty line.
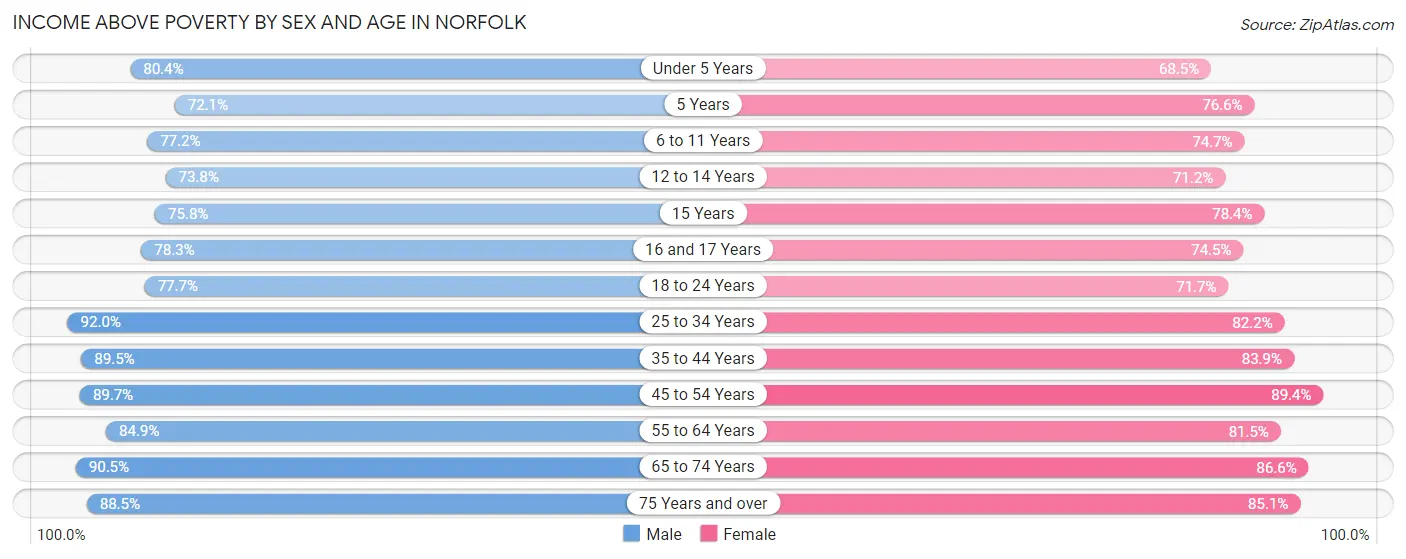
| Age Bracket | Male | Female |
| Under 5 Years | 6,246 (80.4%) | 5,135 (68.5%) |
| 5 Years | 1,091 (72.1%) | 1,299 (76.6%) |
| 6 to 11 Years | 6,068 (77.2%) | 5,212 (74.7%) |
| 12 to 14 Years | 2,692 (73.8%) | 2,777 (71.2%) |
| 15 Years | 922 (75.8%) | 781 (78.4%) |
| 16 and 17 Years | 1,655 (78.3%) | 1,696 (74.5%) |
| 18 to 24 Years | 8,493 (77.7%) | 6,431 (71.7%) |
| 25 to 34 Years | 20,387 (92.0%) | 16,570 (82.2%) |
| 35 to 44 Years | 12,868 (89.4%) | 11,593 (83.9%) |
| 45 to 54 Years | 9,938 (89.7%) | 10,603 (89.4%) |
| 55 to 64 Years | 10,586 (84.9%) | 11,301 (81.5%) |
| 65 to 74 Years | 7,183 (90.5%) | 8,492 (86.6%) |
| 75 Years and over | 3,562 (88.4%) | 5,600 (85.1%) |
| Total | 91,691 (85.6%) | 87,490 (80.7%) |
Income Below Poverty Among Married-Couple Families in Norfolk
The poverty statistics for married-couple families in Norfolk show that 4.0% or 1,245 of the total 31,153 families live below the poverty line. Families with 3 or 4 children have the highest poverty rate of 16.3%, comprising of 374 families. On the other hand, families with 1 or 2 children have the lowest poverty rate of 2.8%, which includes 280 families.
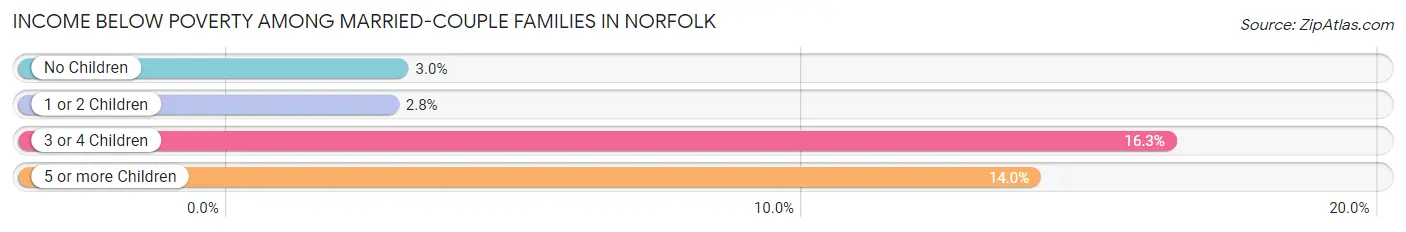
| Children | Above Poverty | Below Poverty |
| No Children | 18,019 (97.0%) | 552 (3.0%) |
| 1 or 2 Children | 9,734 (97.2%) | 280 (2.8%) |
| 3 or 4 Children | 1,915 (83.7%) | 374 (16.3%) |
| 5 or more Children | 240 (86.0%) | 39 (14.0%) |
| Total | 29,908 (96.0%) | 1,245 (4.0%) |
Income Below Poverty Among Single-Parent Households in Norfolk
According to the poverty data in Norfolk, 10.4% or 487 single-father households and 28.6% or 4,727 single-mother households are living below the poverty line. Among single-father households, those with 5 or more children have the highest poverty rate, with 23 households (79.3%) experiencing poverty. Likewise, among single-mother households, those with 5 or more children have the highest poverty rate, with 247 households (100.0%) falling below the poverty line.
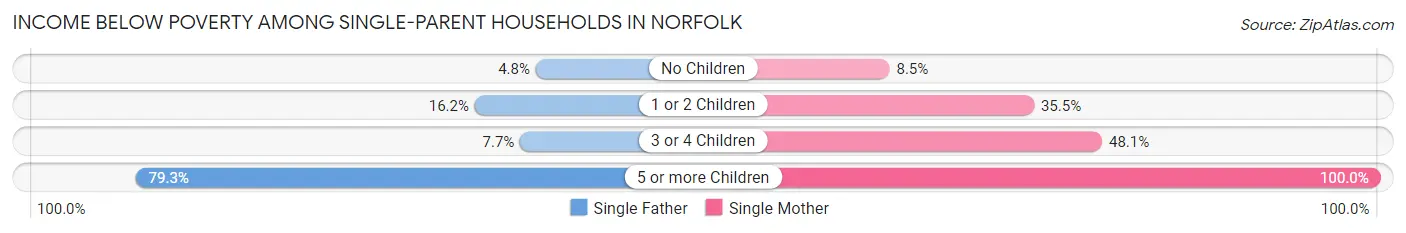
| Children | Single Father | Single Mother |
| No Children | 111 (4.8%) | 494 (8.5%) |
| 1 or 2 Children | 333 (16.2%) | 2,971 (35.4%) |
| 3 or 4 Children | 20 (7.7%) | 1,015 (48.1%) |
| 5 or more Children | 23 (79.3%) | 247 (100.0%) |
| Total | 487 (10.4%) | 4,727 (28.6%) |
Income Below Poverty Among Married-Couple vs Single-Parent Households in Norfolk
The poverty data for Norfolk shows that 1,245 of the married-couple family households (4.0%) and 5,214 of the single-parent households (24.6%) are living below the poverty level. Within the married-couple family households, those with 3 or 4 children have the highest poverty rate, with 374 households (16.3%) falling below the poverty line. Among the single-parent households, those with 5 or more children have the highest poverty rate, with 270 household (97.8%) living below poverty.
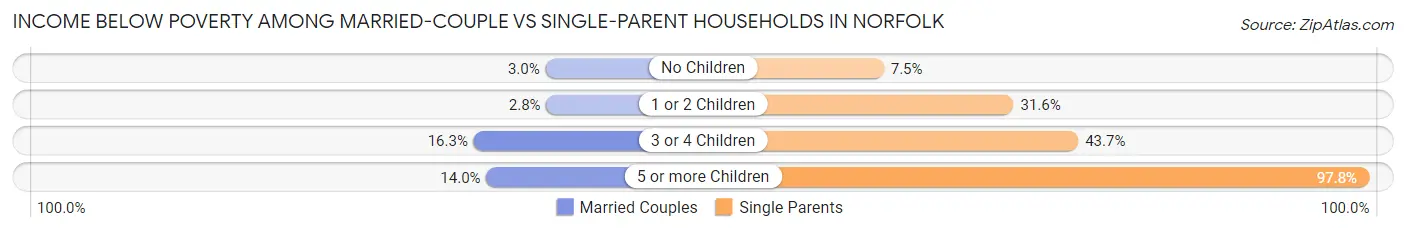
| Children | Married-Couple Families | Single-Parent Households |
| No Children | 552 (3.0%) | 605 (7.5%) |
| 1 or 2 Children | 280 (2.8%) | 3,304 (31.6%) |
| 3 or 4 Children | 374 (16.3%) | 1,035 (43.7%) |
| 5 or more Children | 39 (14.0%) | 270 (97.8%) |
| Total | 1,245 (4.0%) | 5,214 (24.6%) |
Employment Characteristics in Norfolk
Employment by Class of Employer in Norfolk
Among the 125,430 employed individuals in Norfolk, private company employees (64,279 | 51.2%), federal government employees (33,969 | 27.1%), and not-for-profit organizations (8,541 | 6.8%) make up the most common classes of employment.
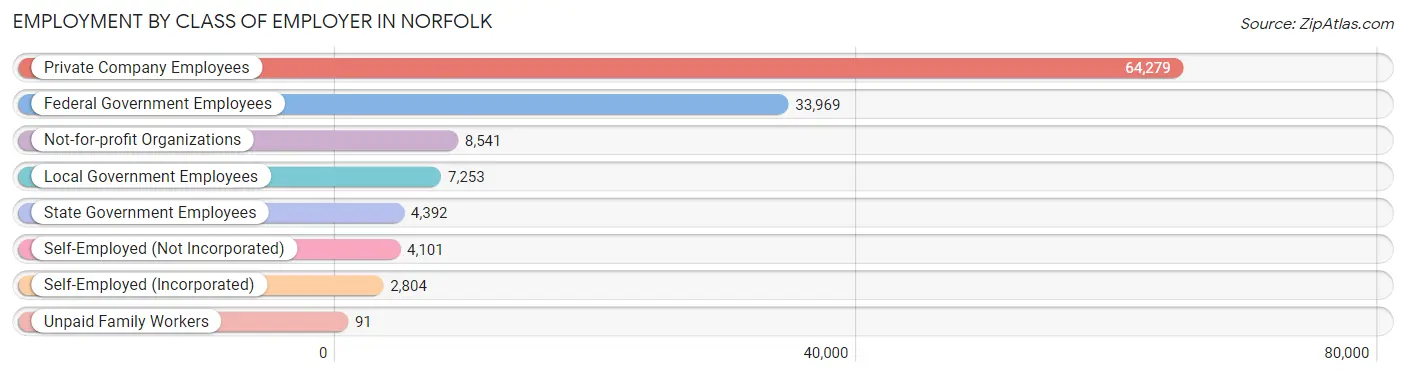
| Employer Class | # Employees | % Employees |
| Private Company Employees | 64,279 | 51.2% |
| Self-Employed (Incorporated) | 2,804 | 2.2% |
| Self-Employed (Not Incorporated) | 4,101 | 3.3% |
| Not-for-profit Organizations | 8,541 | 6.8% |
| Local Government Employees | 7,253 | 5.8% |
| State Government Employees | 4,392 | 3.5% |
| Federal Government Employees | 33,969 | 27.1% |
| Unpaid Family Workers | 91 | 0.1% |
| Total | 125,430 | 100.0% |
Employment Status by Age in Norfolk
According to the labor force statistics for Norfolk, out of the total population over 16 years of age (193,396), 70.0% or 135,377 individuals are in the labor force, with 6.7% or 9,070 of them unemployed. The age group with the highest labor force participation rate is 25 to 29 years, with 88.0% or 21,478 individuals in the labor force. Within the labor force, the 16 to 19 years age range has the highest percentage of unemployed individuals, with 19.4% or 1,211 of them being unemployed.
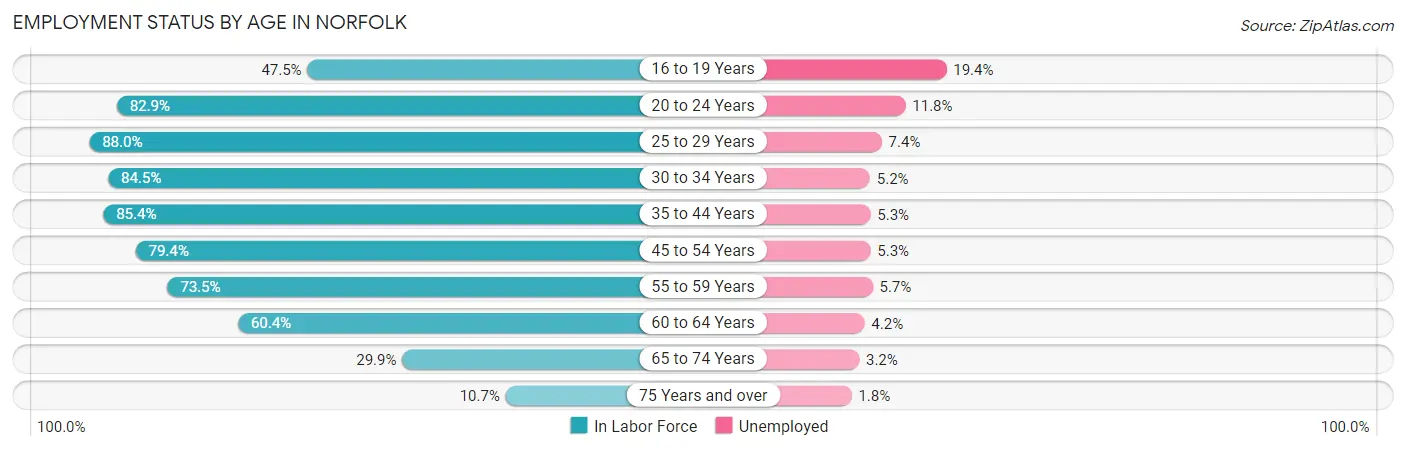
| Age Bracket | In Labor Force | Unemployed |
| 16 to 19 Years | 6,244 (47.5%) | 1,211 (19.4%) |
| 20 to 24 Years | 23,159 (82.9%) | 2,733 (11.8%) |
| 25 to 29 Years | 21,478 (88.0%) | 1,589 (7.4%) |
| 30 to 34 Years | 17,161 (84.5%) | 892 (5.2%) |
| 35 to 44 Years | 24,525 (85.4%) | 1,300 (5.3%) |
| 45 to 54 Years | 18,371 (79.4%) | 974 (5.3%) |
| 55 to 59 Years | 9,509 (73.5%) | 542 (5.7%) |
| 60 to 64 Years | 8,268 (60.4%) | 347 (4.2%) |
| 65 to 74 Years | 5,404 (29.9%) | 173 (3.2%) |
| 75 Years and over | 1,181 (10.7%) | 21 (1.8%) |
| Total | 135,377 (70.0%) | 9,070 (6.7%) |
Employment Status by Educational Attainment in Norfolk
According to labor force statistics for Norfolk, 80.6% of individuals (99,298) out of the total population between 25 and 64 years of age (123,198) are in the labor force, with 5.6% or 5,561 of them being unemployed. The group with the highest labor force participation rate are those with the educational attainment of bachelor's degree or higher, with 87.8% or 35,236 individuals in the labor force. Within the labor force, individuals with high school diploma education have the highest percentage of unemployment, with 8.1% or 1,796 of them being unemployed.
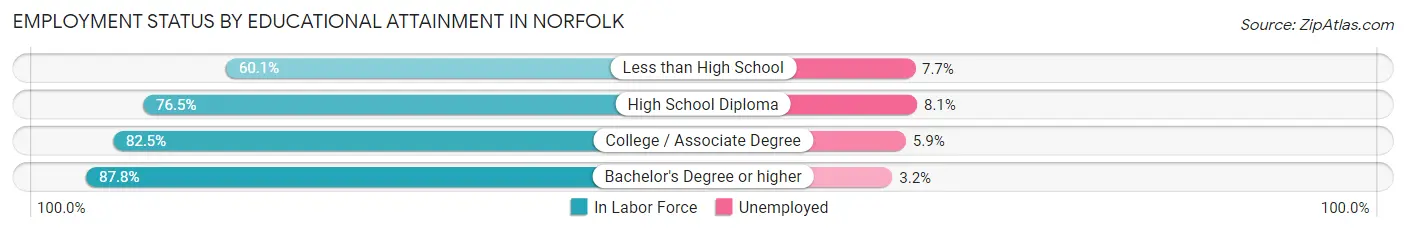
| Educational Attainment | In Labor Force | Unemployed |
| Less than High School | 7,267 (60.1%) | 931 (7.7%) |
| High School Diploma | 22,168 (76.5%) | 2,347 (8.1%) |
| College / Associate Degree | 34,647 (82.5%) | 2,478 (5.9%) |
| Bachelor's Degree or higher | 35,236 (87.8%) | 1,284 (3.2%) |
| Total | 99,298 (80.6%) | 6,899 (5.6%) |
Employment Occupations by Sex in Norfolk
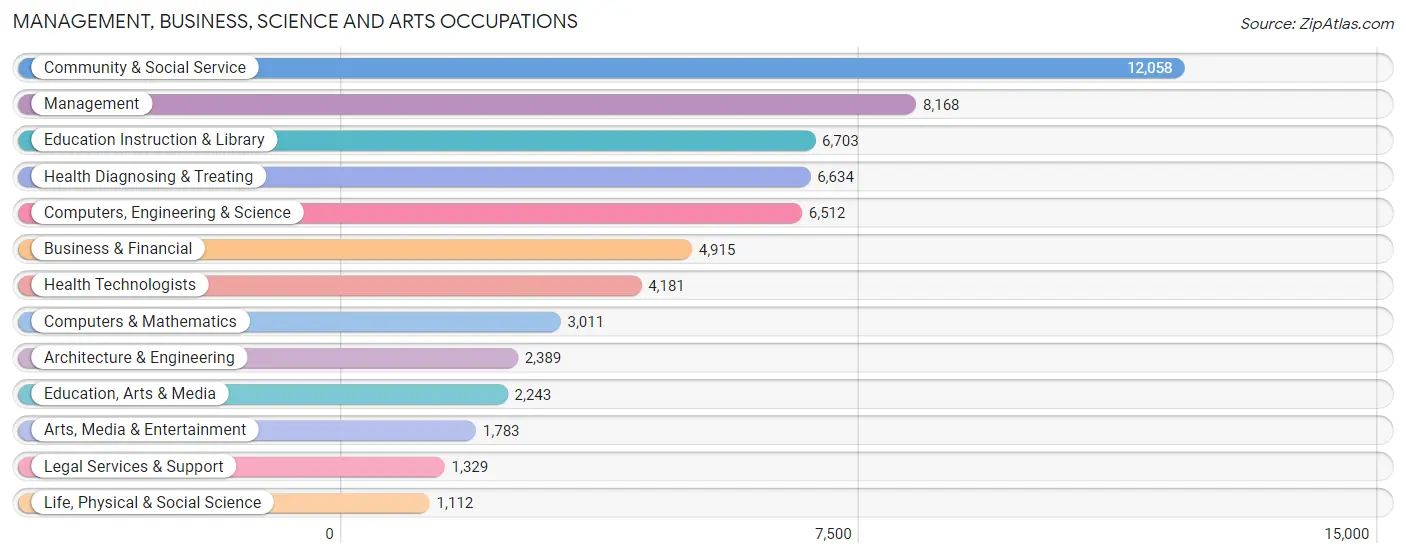
Management, Business, Science and Arts Occupations
The most common Management, Business, Science and Arts occupations in Norfolk are Community & Social Service (12,058 | 11.7%), Management (8,168 | 8.0%), Education Instruction & Library (6,703 | 6.5%), Health Diagnosing & Treating (6,634 | 6.5%), and Computers, Engineering & Science (6,512 | 6.4%).
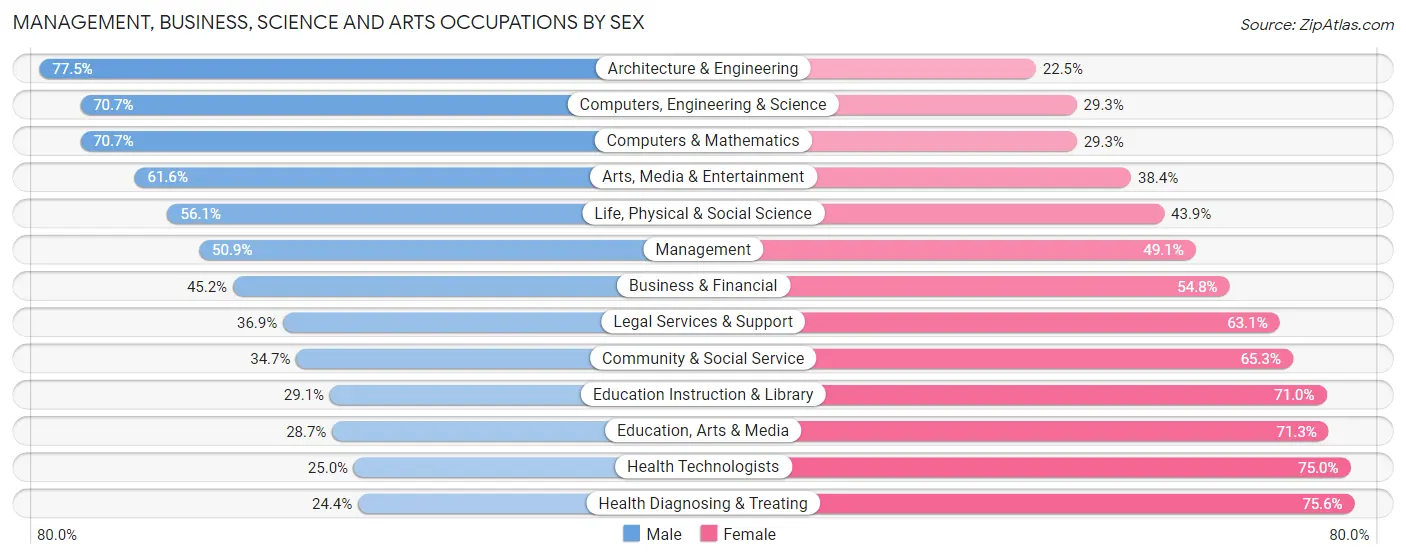
Management, Business, Science and Arts Occupations by Sex
Within the Management, Business, Science and Arts occupations in Norfolk, the most male-oriented occupations are Architecture & Engineering (77.5%), Computers, Engineering & Science (70.7%), and Computers & Mathematics (70.7%), while the most female-oriented occupations are Health Diagnosing & Treating (75.6%), Health Technologists (75.0%), and Education, Arts & Media (71.3%).
| Occupation | Male | Female |
| Management | 4,156 (50.9%) | 4,012 (49.1%) |
| Business & Financial | 2,223 (45.2%) | 2,692 (54.8%) |
| Computers, Engineering & Science | 4,605 (70.7%) | 1,907 (29.3%) |
| Computers & Mathematics | 2,129 (70.7%) | 882 (29.3%) |
| Architecture & Engineering | 1,852 (77.5%) | 537 (22.5%) |
| Life, Physical & Social Science | 624 (56.1%) | 488 (43.9%) |
| Community & Social Service | 4,179 (34.7%) | 7,879 (65.3%) |
| Education, Arts & Media | 643 (28.7%) | 1,600 (71.3%) |
| Legal Services & Support | 490 (36.9%) | 839 (63.1%) |
| Education Instruction & Library | 1,947 (29.0%) | 4,756 (71.0%) |
| Arts, Media & Entertainment | 1,099 (61.6%) | 684 (38.4%) |
| Health Diagnosing & Treating | 1,616 (24.4%) | 5,018 (75.6%) |
| Health Technologists | 1,047 (25.0%) | 3,134 (75.0%) |
| Total (Category) | 16,779 (43.8%) | 21,508 (56.2%) |
| Total (Overall) | 50,505 (49.2%) | 52,101 (50.8%) |
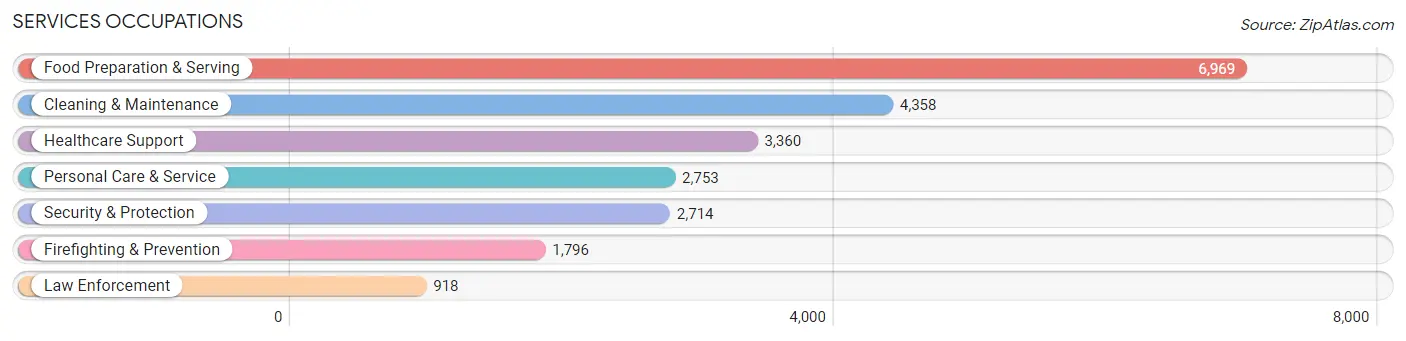
Services Occupations
The most common Services occupations in Norfolk are Food Preparation & Serving (6,969 | 6.8%), Cleaning & Maintenance (4,358 | 4.3%), Healthcare Support (3,360 | 3.3%), Personal Care & Service (2,753 | 2.7%), and Security & Protection (2,714 | 2.6%).
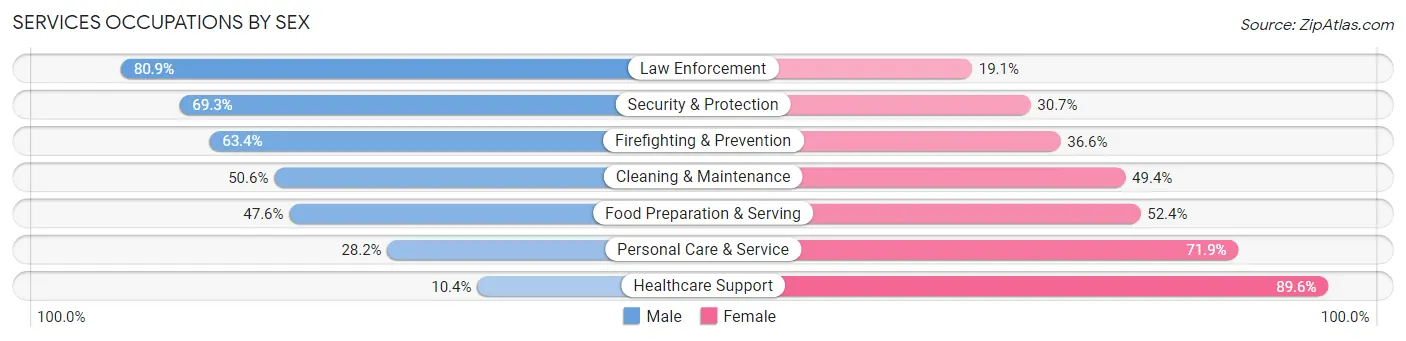
Services Occupations by Sex
Within the Services occupations in Norfolk, the most male-oriented occupations are Law Enforcement (80.9%), Security & Protection (69.3%), and Firefighting & Prevention (63.4%), while the most female-oriented occupations are Healthcare Support (89.6%), Personal Care & Service (71.9%), and Food Preparation & Serving (52.4%).
| Occupation | Male | Female |
| Healthcare Support | 348 (10.4%) | 3,012 (89.6%) |
| Security & Protection | 1,882 (69.3%) | 832 (30.7%) |
| Firefighting & Prevention | 1,139 (63.4%) | 657 (36.6%) |
| Law Enforcement | 743 (80.9%) | 175 (19.1%) |
| Food Preparation & Serving | 3,315 (47.6%) | 3,654 (52.4%) |
| Cleaning & Maintenance | 2,204 (50.6%) | 2,154 (49.4%) |
| Personal Care & Service | 775 (28.1%) | 1,978 (71.9%) |
| Total (Category) | 8,524 (42.3%) | 11,630 (57.7%) |
| Total (Overall) | 50,505 (49.2%) | 52,101 (50.8%) |
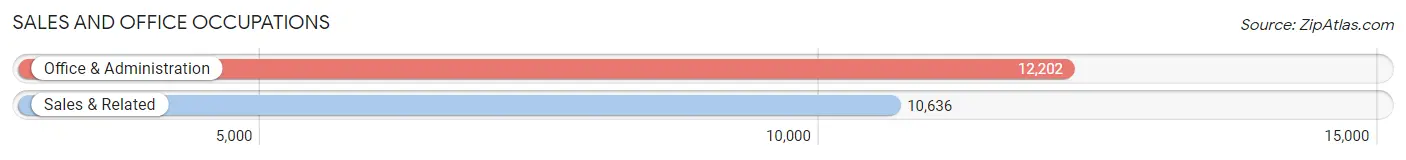
Sales and Office Occupations
The most common Sales and Office occupations in Norfolk are Office & Administration (12,202 | 11.9%), and Sales & Related (10,636 | 10.4%).
Sales and Office Occupations by Sex
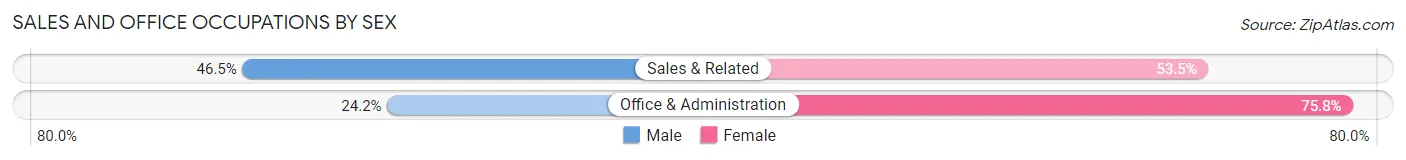
| Occupation | Male | Female |
| Sales & Related | 4,941 (46.5%) | 5,695 (53.5%) |
| Office & Administration | 2,951 (24.2%) | 9,251 (75.8%) |
| Total (Category) | 7,892 (34.6%) | 14,946 (65.4%) |
| Total (Overall) | 50,505 (49.2%) | 52,101 (50.8%) |
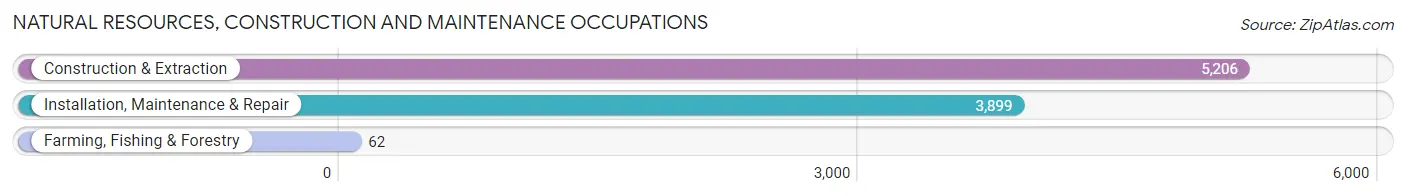
Natural Resources, Construction and Maintenance Occupations
The most common Natural Resources, Construction and Maintenance occupations in Norfolk are Construction & Extraction (5,206 | 5.1%), Installation, Maintenance & Repair (3,899 | 3.8%), and Farming, Fishing & Forestry (62 | 0.1%).
Natural Resources, Construction and Maintenance Occupations by Sex
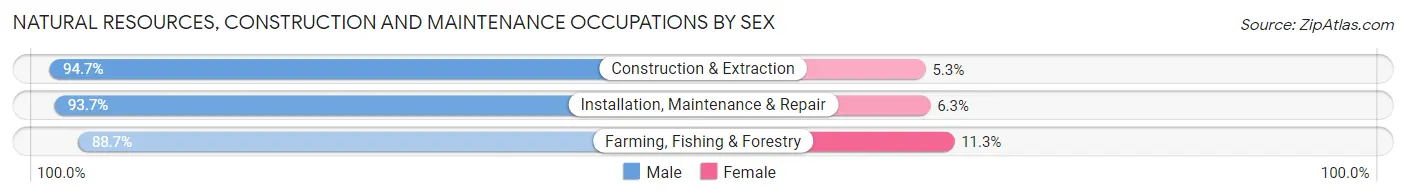
| Occupation | Male | Female |
| Farming, Fishing & Forestry | 55 (88.7%) | 7 (11.3%) |
| Construction & Extraction | 4,929 (94.7%) | 277 (5.3%) |
| Installation, Maintenance & Repair | 3,653 (93.7%) | 246 (6.3%) |
| Total (Category) | 8,637 (94.2%) | 530 (5.8%) |
| Total (Overall) | 50,505 (49.2%) | 52,101 (50.8%) |
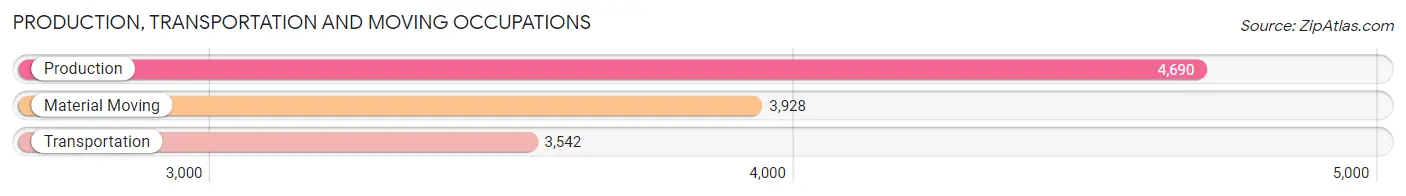
Production, Transportation and Moving Occupations
The most common Production, Transportation and Moving occupations in Norfolk are Production (4,690 | 4.6%), Material Moving (3,928 | 3.8%), and Transportation (3,542 | 3.5%).
Production, Transportation and Moving Occupations by Sex
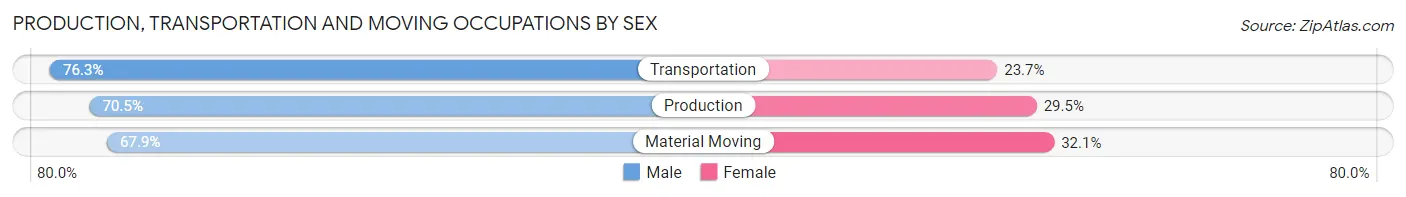
| Occupation | Male | Female |
| Production | 3,305 (70.5%) | 1,385 (29.5%) |
| Transportation | 2,701 (76.3%) | 841 (23.7%) |
| Material Moving | 2,667 (67.9%) | 1,261 (32.1%) |
| Total (Category) | 8,673 (71.3%) | 3,487 (28.7%) |
| Total (Overall) | 50,505 (49.2%) | 52,101 (50.8%) |
Employment Industries by Sex in Norfolk
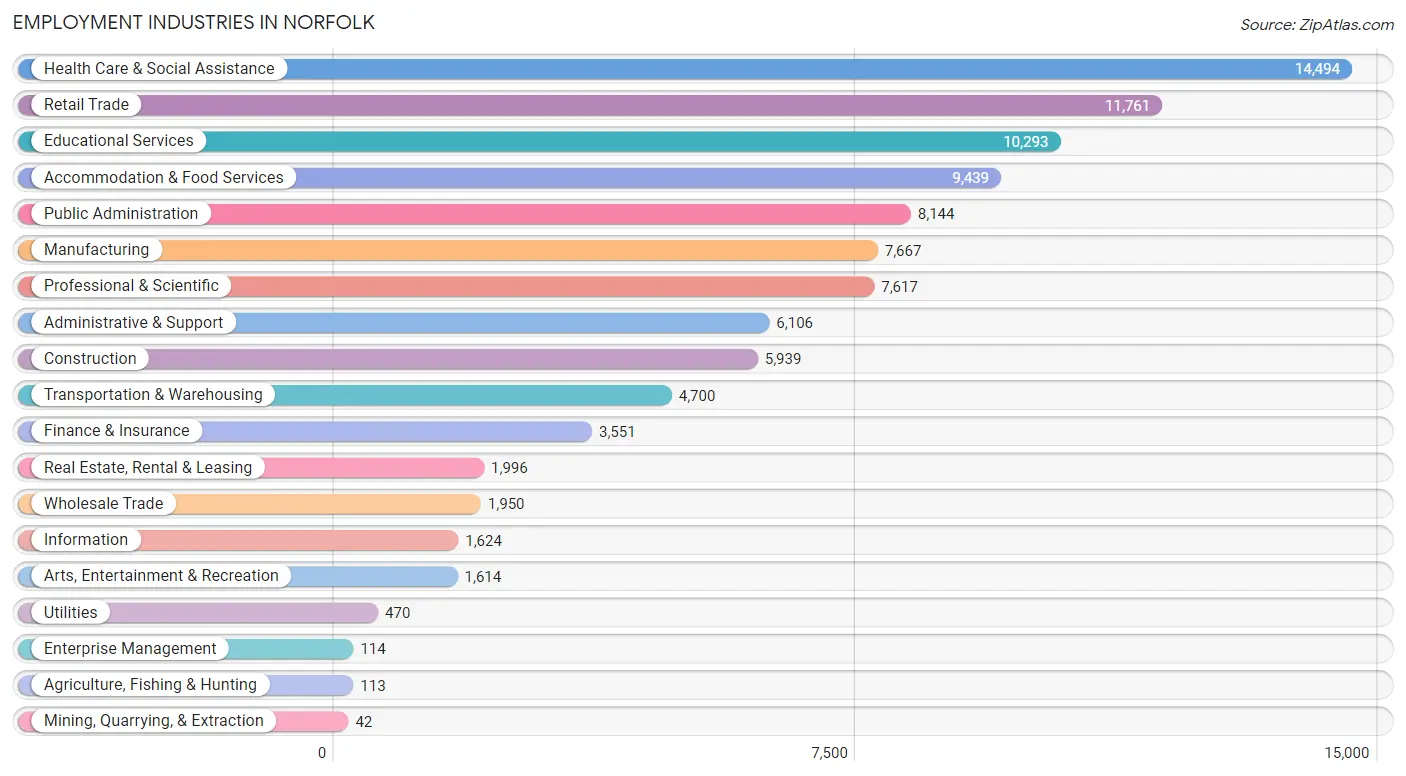
Employment Industries in Norfolk
The major employment industries in Norfolk include Health Care & Social Assistance (14,494 | 14.1%), Retail Trade (11,761 | 11.5%), Educational Services (10,293 | 10.0%), Accommodation & Food Services (9,439 | 9.2%), and Public Administration (8,144 | 7.9%).
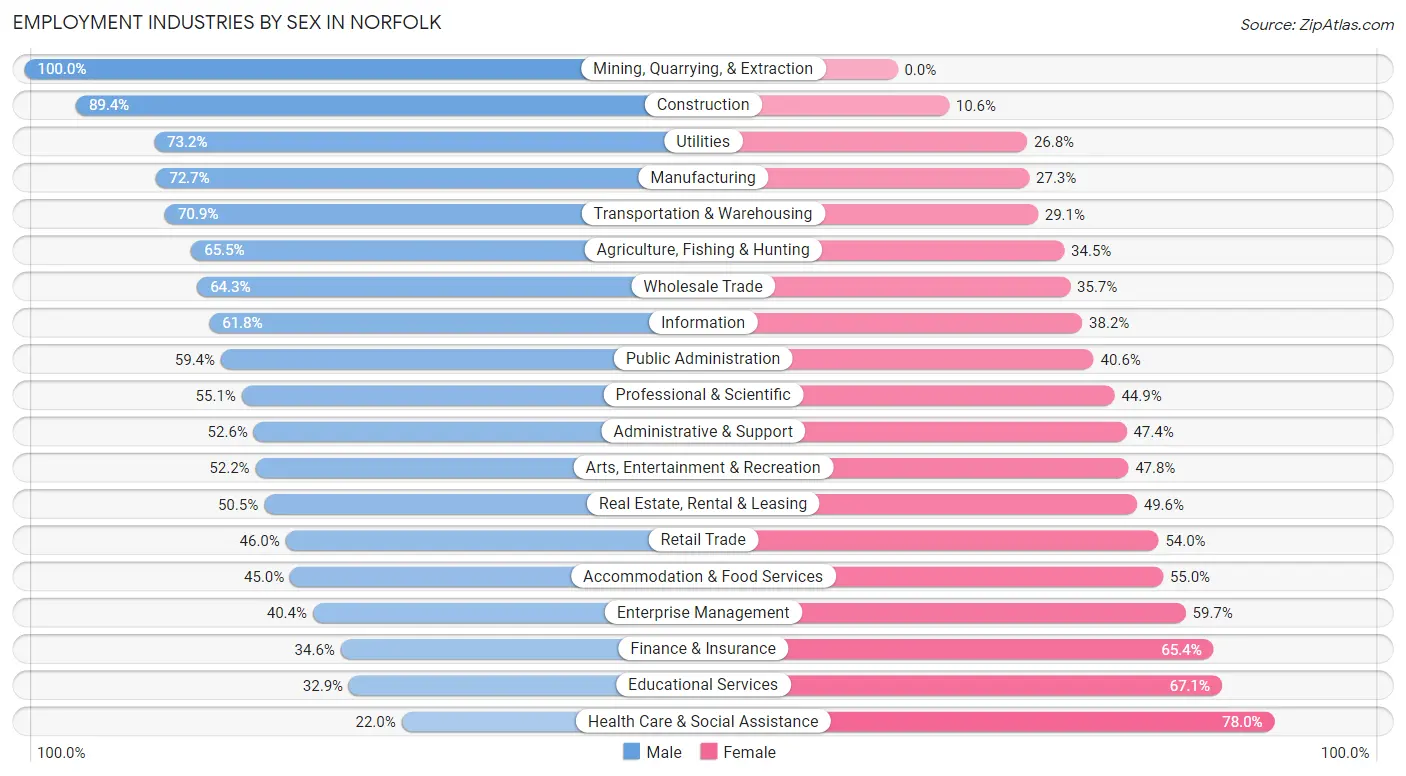
Employment Industries by Sex in Norfolk
The Norfolk industries that see more men than women are Mining, Quarrying, & Extraction (100.0%), Construction (89.4%), and Utilities (73.2%), whereas the industries that tend to have a higher number of women are Health Care & Social Assistance (78.0%), Educational Services (67.1%), and Finance & Insurance (65.4%).
| Industry | Male | Female |
| Agriculture, Fishing & Hunting | 74 (65.5%) | 39 (34.5%) |
| Mining, Quarrying, & Extraction | 42 (100.0%) | 0 (0.0%) |
| Construction | 5,307 (89.4%) | 632 (10.6%) |
| Manufacturing | 5,577 (72.7%) | 2,090 (27.3%) |
| Wholesale Trade | 1,253 (64.3%) | 697 (35.7%) |
| Retail Trade | 5,406 (46.0%) | 6,355 (54.0%) |
| Transportation & Warehousing | 3,334 (70.9%) | 1,366 (29.1%) |
| Utilities | 344 (73.2%) | 126 (26.8%) |
| Information | 1,003 (61.8%) | 621 (38.2%) |
| Finance & Insurance | 1,228 (34.6%) | 2,323 (65.4%) |
| Real Estate, Rental & Leasing | 1,007 (50.4%) | 989 (49.5%) |
| Professional & Scientific | 4,195 (55.1%) | 3,422 (44.9%) |
| Enterprise Management | 46 (40.4%) | 68 (59.7%) |
| Administrative & Support | 3,211 (52.6%) | 2,895 (47.4%) |
| Educational Services | 3,383 (32.9%) | 6,910 (67.1%) |
| Health Care & Social Assistance | 3,186 (22.0%) | 11,308 (78.0%) |
| Arts, Entertainment & Recreation | 843 (52.2%) | 771 (47.8%) |
| Accommodation & Food Services | 4,251 (45.0%) | 5,188 (55.0%) |
| Public Administration | 4,836 (59.4%) | 3,308 (40.6%) |
| Total | 50,505 (49.2%) | 52,101 (50.8%) |
Education in Norfolk
School Enrollment in Norfolk
The most common levels of schooling among the 60,674 students in Norfolk are college / undergraduate (20,479 | 33.8%), middle school (10,156 | 16.7%), and elementary school (9,880 | 16.3%).
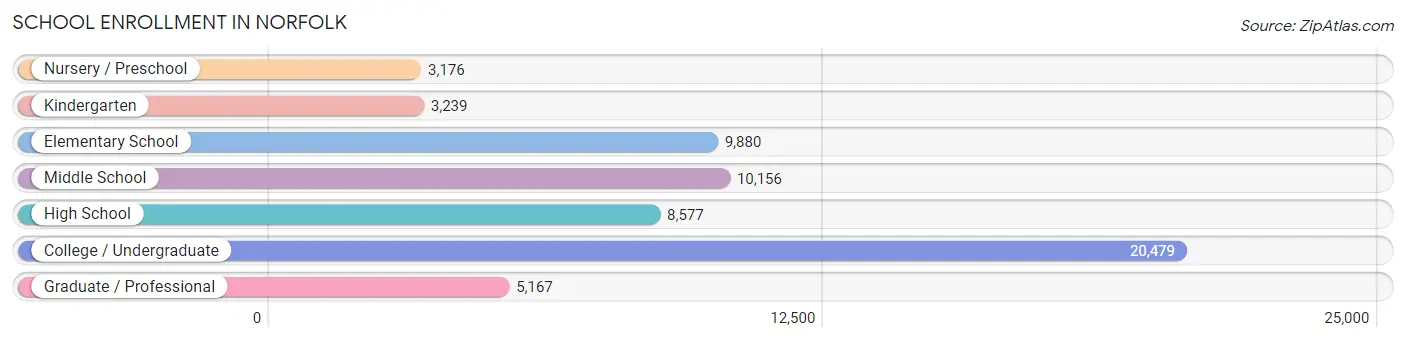
| School Level | # Students | % Students |
| Nursery / Preschool | 3,176 | 5.2% |
| Kindergarten | 3,239 | 5.3% |
| Elementary School | 9,880 | 16.3% |
| Middle School | 10,156 | 16.7% |
| High School | 8,577 | 14.1% |
| College / Undergraduate | 20,479 | 33.8% |
| Graduate / Professional | 5,167 | 8.5% |
| Total | 60,674 | 100.0% |
School Enrollment by Age by Funding Source in Norfolk
Out of a total of 60,674 students who are enrolled in schools in Norfolk, 9,283 (15.3%) attend a private institution, while the remaining 51,391 (84.7%) are enrolled in public schools. The age group of 3 to 4 year olds has the highest likelihood of being enrolled in private schools, with 1,085 (42.1% in the age bracket) enrolled. Conversely, the age group of 18 to 19 year olds has the lowest likelihood of being enrolled in a private school, with 5,419 (94.9% in the age bracket) attending a public institution.
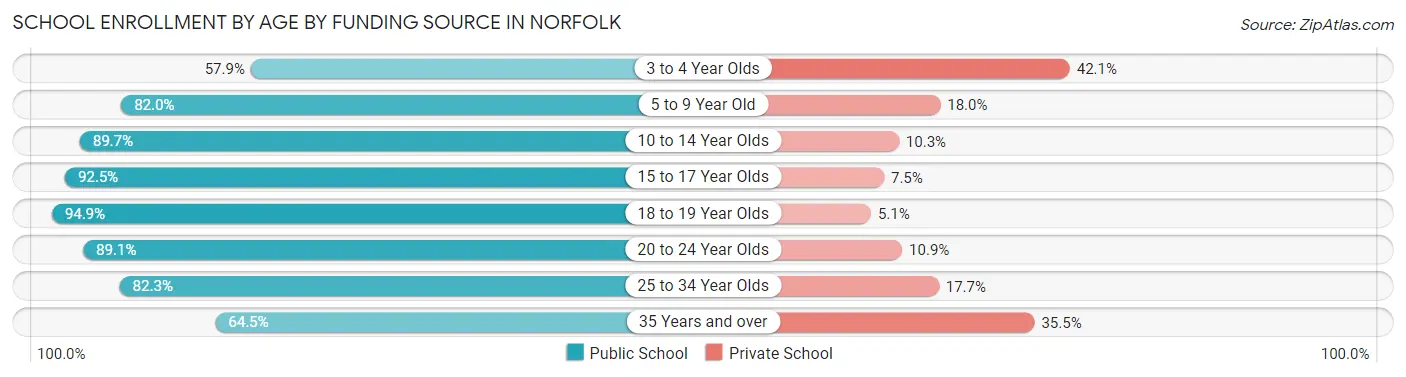
| Age Bracket | Public School | Private School |
| 3 to 4 Year Olds | 1,491 (57.9%) | 1,085 (42.1%) |
| 5 to 9 Year Old | 10,165 (82.0%) | 2,231 (18.0%) |
| 10 to 14 Year Olds | 11,226 (89.7%) | 1,288 (10.3%) |
| 15 to 17 Year Olds | 6,025 (92.5%) | 490 (7.5%) |
| 18 to 19 Year Olds | 5,419 (94.9%) | 290 (5.1%) |
| 20 to 24 Year Olds | 8,357 (89.1%) | 1,021 (10.9%) |
| 25 to 34 Year Olds | 5,711 (82.3%) | 1,229 (17.7%) |
| 35 Years and over | 2,995 (64.5%) | 1,651 (35.5%) |
| Total | 51,391 (84.7%) | 9,283 (15.3%) |
Educational Attainment by Field of Study in Norfolk
Business (7,612 | 14.2%), social sciences (5,975 | 11.1%), arts & humanities (4,681 | 8.7%), education (4,439 | 8.3%), and engineering (4,042 | 7.5%) are the most common fields of study among 53,766 individuals in Norfolk who have obtained a bachelor's degree or higher.
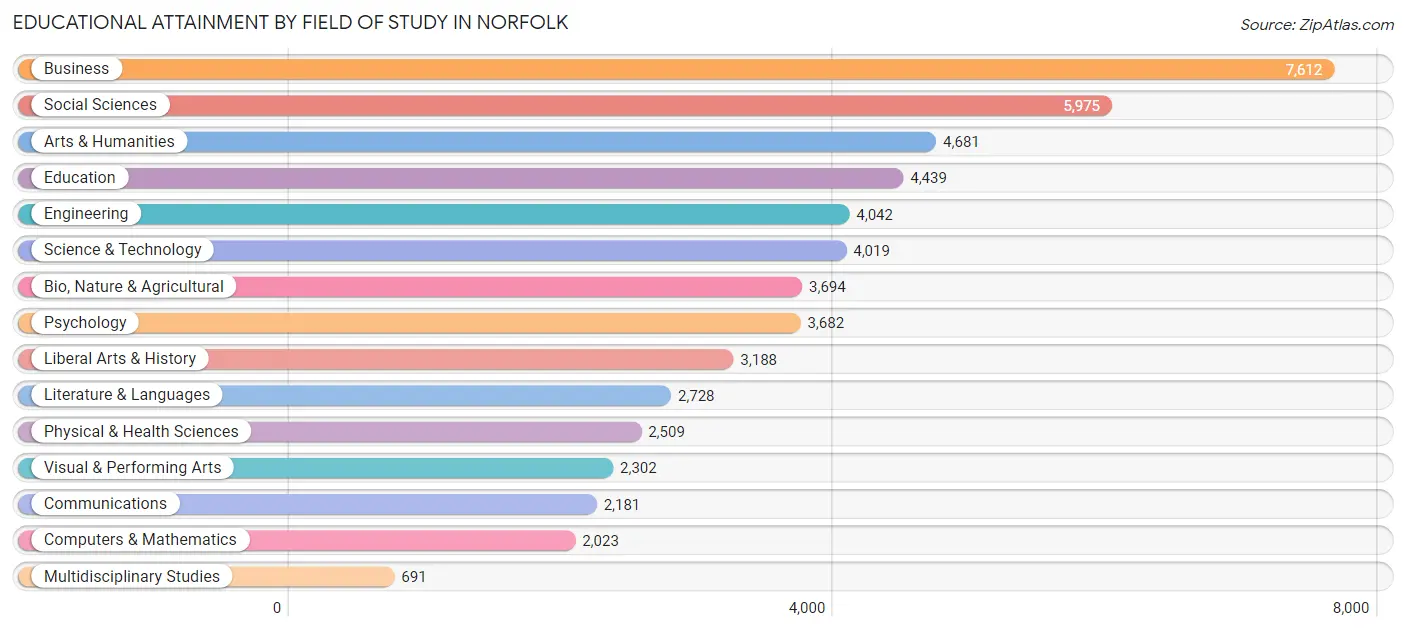
| Field of Study | # Graduates | % Graduates |
| Computers & Mathematics | 2,023 | 3.8% |
| Bio, Nature & Agricultural | 3,694 | 6.9% |
| Physical & Health Sciences | 2,509 | 4.7% |
| Psychology | 3,682 | 6.9% |
| Social Sciences | 5,975 | 11.1% |
| Engineering | 4,042 | 7.5% |
| Multidisciplinary Studies | 691 | 1.3% |
| Science & Technology | 4,019 | 7.5% |
| Business | 7,612 | 14.2% |
| Education | 4,439 | 8.3% |
| Literature & Languages | 2,728 | 5.1% |
| Liberal Arts & History | 3,188 | 5.9% |
| Visual & Performing Arts | 2,302 | 4.3% |
| Communications | 2,181 | 4.1% |
| Arts & Humanities | 4,681 | 8.7% |
| Total | 53,766 | 100.0% |
Transportation & Commute in Norfolk
Vehicle Availability by Sex in Norfolk
The most prevalent vehicle ownership categories in Norfolk are males with 2 vehicles (24,427, accounting for 41.4%) and females with 2 vehicles (19,157, making up 47.1%).
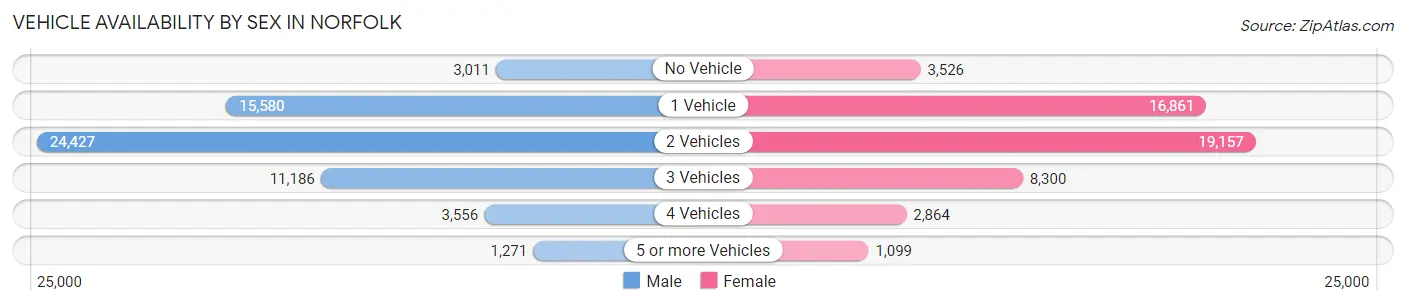
| Vehicles Available | Male | Female |
| No Vehicle | 3,011 (5.1%) | 3,526 (6.8%) |
| 1 Vehicle | 15,580 (26.4%) | 16,861 (32.6%) |
| 2 Vehicles | 24,427 (41.4%) | 19,157 (37.0%) |
| 3 Vehicles | 11,186 (19.0%) | 8,300 (16.0%) |
| 4 Vehicles | 3,556 (6.0%) | 2,864 (5.5%) |
| 5 or more Vehicles | 1,271 (2.1%) | 1,099 (2.1%) |
| Total | 59,031 (100.0%) | 51,807 (100.0%) |
Commute Time in Norfolk
The most frequently occuring commute durations in Norfolk are 15 to 19 minutes (22,193 commuters, 19.1%), 20 to 24 minutes (20,187 commuters, 17.4%), and 30 to 34 minutes (17,364 commuters, 14.9%).
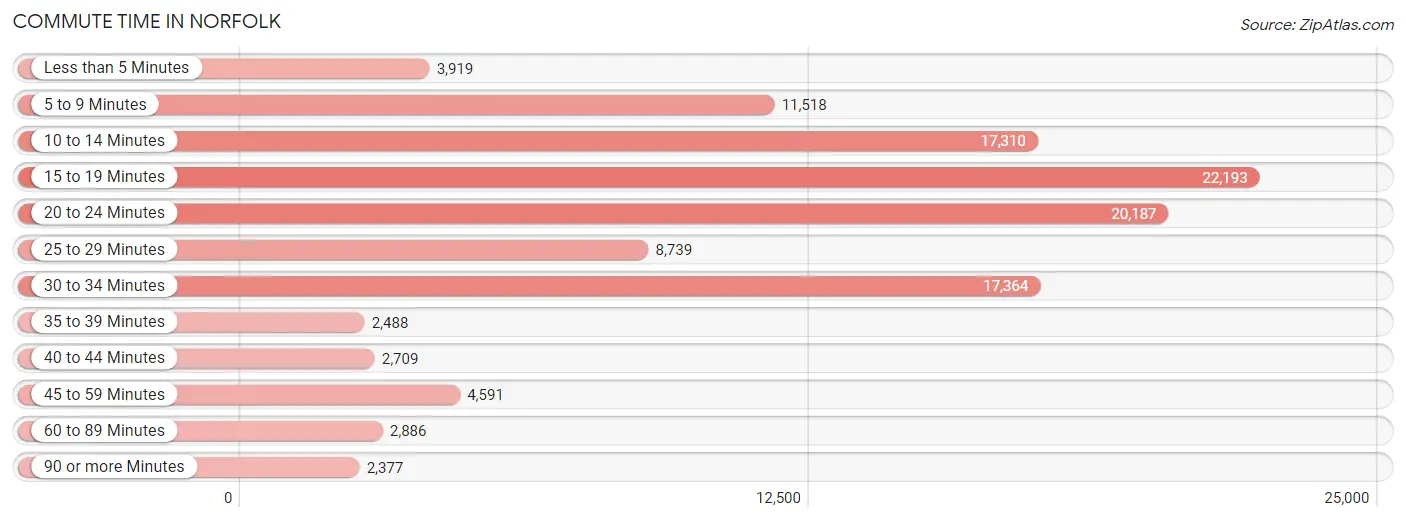
| Commute Time | # Commuters | % Commuters |
| Less than 5 Minutes | 3,919 | 3.4% |
| 5 to 9 Minutes | 11,518 | 9.9% |
| 10 to 14 Minutes | 17,310 | 14.9% |
| 15 to 19 Minutes | 22,193 | 19.1% |
| 20 to 24 Minutes | 20,187 | 17.4% |
| 25 to 29 Minutes | 8,739 | 7.5% |
| 30 to 34 Minutes | 17,364 | 14.9% |
| 35 to 39 Minutes | 2,488 | 2.1% |
| 40 to 44 Minutes | 2,709 | 2.3% |
| 45 to 59 Minutes | 4,591 | 4.0% |
| 60 to 89 Minutes | 2,886 | 2.5% |
| 90 or more Minutes | 2,377 | 2.0% |
Commute Time by Sex in Norfolk
The most common commute times in Norfolk are 15 to 19 minutes (12,178 commuters, 18.5%) for males and 15 to 19 minutes (10,015 commuters, 19.9%) for females.
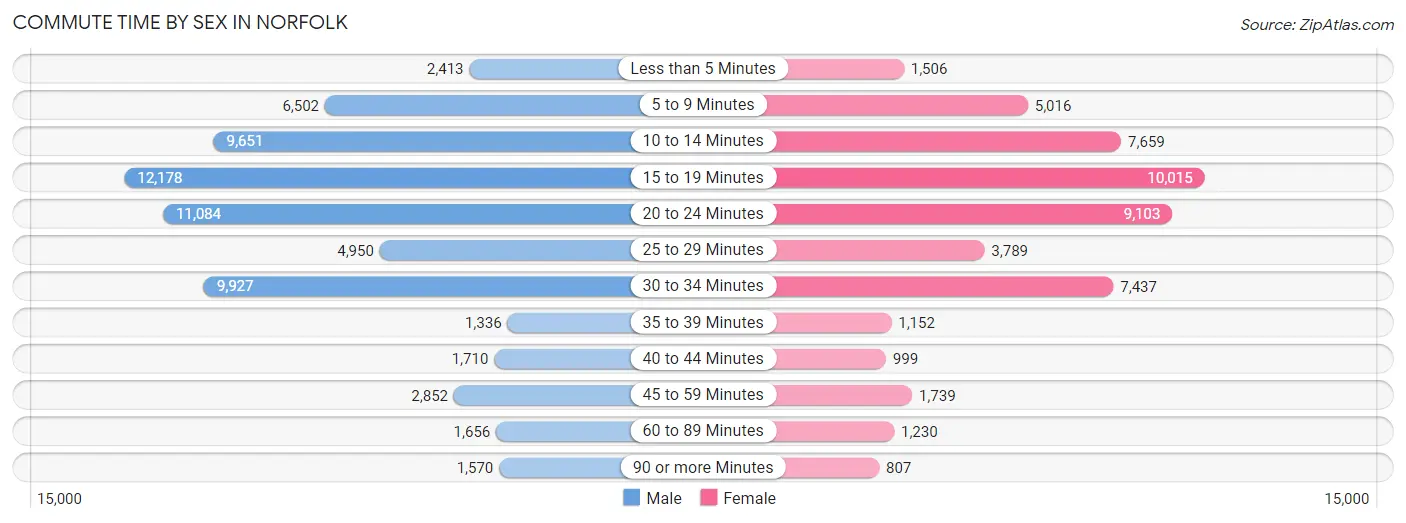
| Commute Time | Male | Female |
| Less than 5 Minutes | 2,413 (3.7%) | 1,506 (3.0%) |
| 5 to 9 Minutes | 6,502 (9.9%) | 5,016 (9.9%) |
| 10 to 14 Minutes | 9,651 (14.7%) | 7,659 (15.2%) |
| 15 to 19 Minutes | 12,178 (18.5%) | 10,015 (19.9%) |
| 20 to 24 Minutes | 11,084 (16.8%) | 9,103 (18.0%) |
| 25 to 29 Minutes | 4,950 (7.5%) | 3,789 (7.5%) |
| 30 to 34 Minutes | 9,927 (15.1%) | 7,437 (14.7%) |
| 35 to 39 Minutes | 1,336 (2.0%) | 1,152 (2.3%) |
| 40 to 44 Minutes | 1,710 (2.6%) | 999 (2.0%) |
| 45 to 59 Minutes | 2,852 (4.3%) | 1,739 (3.5%) |
| 60 to 89 Minutes | 1,656 (2.5%) | 1,230 (2.4%) |
| 90 or more Minutes | 1,570 (2.4%) | 807 (1.6%) |
Time of Departure to Work by Sex in Norfolk
The most frequent times of departure to work in Norfolk are 6:00 AM to 6:29 AM (8,483, 12.9%) for males and 7:00 AM to 7:29 AM (6,236, 12.4%) for females.
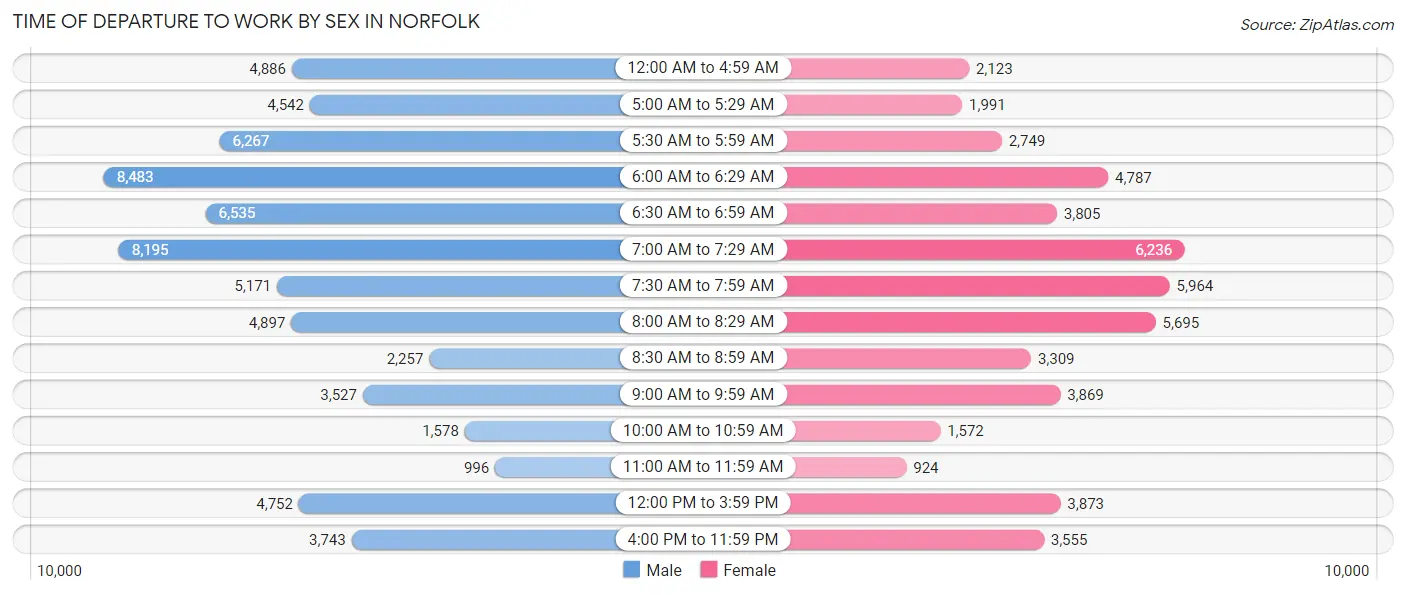
| Time of Departure | Male | Female |
| 12:00 AM to 4:59 AM | 4,886 (7.4%) | 2,123 (4.2%) |
| 5:00 AM to 5:29 AM | 4,542 (6.9%) | 1,991 (4.0%) |
| 5:30 AM to 5:59 AM | 6,267 (9.5%) | 2,749 (5.4%) |
| 6:00 AM to 6:29 AM | 8,483 (12.9%) | 4,787 (9.5%) |
| 6:30 AM to 6:59 AM | 6,535 (9.9%) | 3,805 (7.5%) |
| 7:00 AM to 7:29 AM | 8,195 (12.4%) | 6,236 (12.4%) |
| 7:30 AM to 7:59 AM | 5,171 (7.9%) | 5,964 (11.8%) |
| 8:00 AM to 8:29 AM | 4,897 (7.4%) | 5,695 (11.3%) |
| 8:30 AM to 8:59 AM | 2,257 (3.4%) | 3,309 (6.6%) |
| 9:00 AM to 9:59 AM | 3,527 (5.4%) | 3,869 (7.7%) |
| 10:00 AM to 10:59 AM | 1,578 (2.4%) | 1,572 (3.1%) |
| 11:00 AM to 11:59 AM | 996 (1.5%) | 924 (1.8%) |
| 12:00 PM to 3:59 PM | 4,752 (7.2%) | 3,873 (7.7%) |
| 4:00 PM to 11:59 PM | 3,743 (5.7%) | 3,555 (7.0%) |
| Total | 65,829 (100.0%) | 50,452 (100.0%) |
Housing Occupancy in Norfolk
Occupancy by Ownership in Norfolk
Of the total 93,797 dwellings in Norfolk, owner-occupied units account for 42,001 (44.8%), while renter-occupied units make up 51,796 (55.2%).
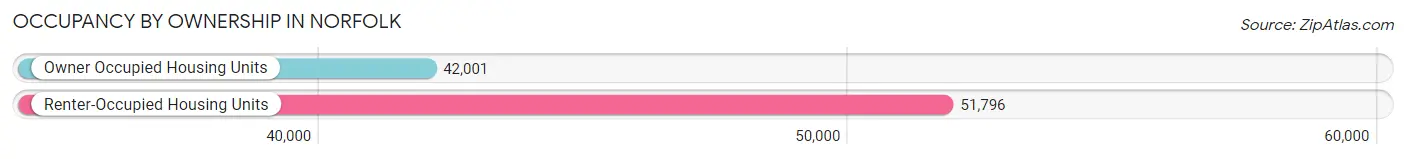
| Occupancy | # Housing Units | % Housing Units |
| Owner Occupied Housing Units | 42,001 | 44.8% |
| Renter-Occupied Housing Units | 51,796 | 55.2% |
| Total Occupied Housing Units | 93,797 | 100.0% |
Occupancy by Household Size in Norfolk
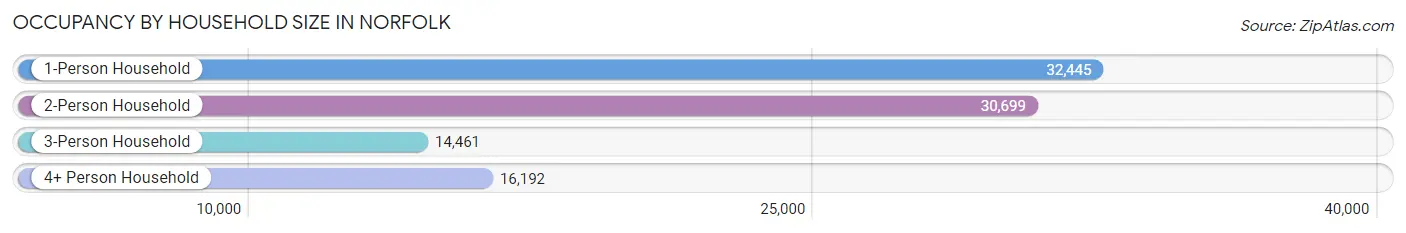
| Household Size | # Housing Units | % Housing Units |
| 1-Person Household | 32,445 | 34.6% |
| 2-Person Household | 30,699 | 32.7% |
| 3-Person Household | 14,461 | 15.4% |
| 4+ Person Household | 16,192 | 17.3% |
| Total Housing Units | 93,797 | 100.0% |
Occupancy by Ownership by Household Size in Norfolk
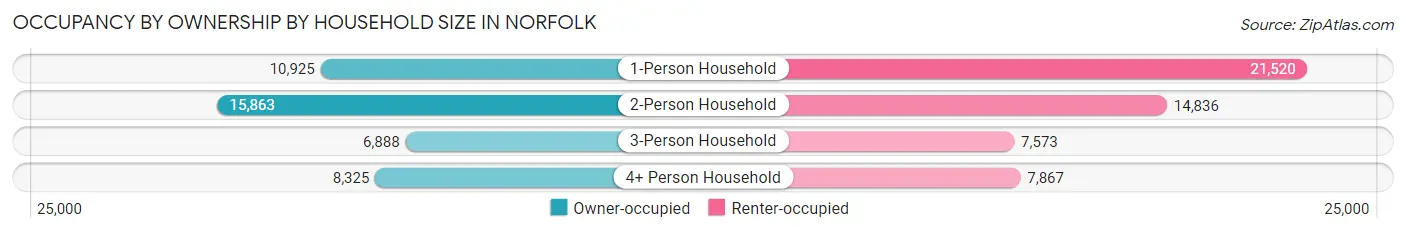
| Household Size | Owner-occupied | Renter-occupied |
| 1-Person Household | 10,925 (33.7%) | 21,520 (66.3%) |
| 2-Person Household | 15,863 (51.7%) | 14,836 (48.3%) |
| 3-Person Household | 6,888 (47.6%) | 7,573 (52.4%) |
| 4+ Person Household | 8,325 (51.4%) | 7,867 (48.6%) |
| Total Housing Units | 42,001 (44.8%) | 51,796 (55.2%) |
Occupancy by Educational Attainment in Norfolk
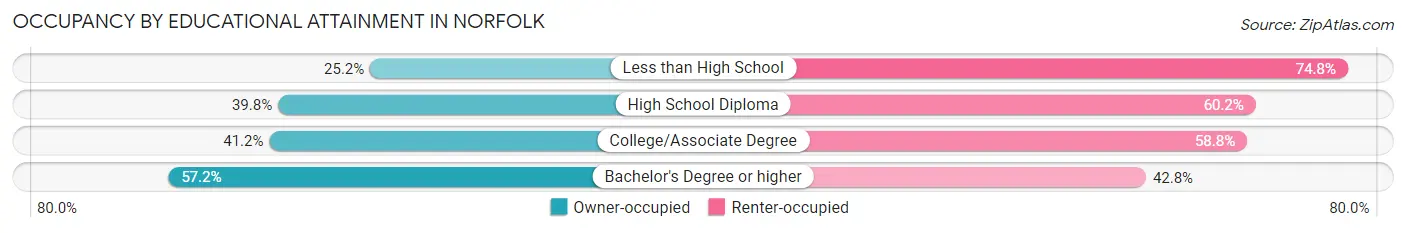
| Household Size | Owner-occupied | Renter-occupied |
| Less than High School | 2,193 (25.2%) | 6,508 (74.8%) |
| High School Diploma | 8,556 (39.8%) | 12,937 (60.2%) |
| College/Associate Degree | 13,207 (41.2%) | 18,857 (58.8%) |
| Bachelor's Degree or higher | 18,045 (57.2%) | 13,494 (42.8%) |
Occupancy by Age of Householder in Norfolk
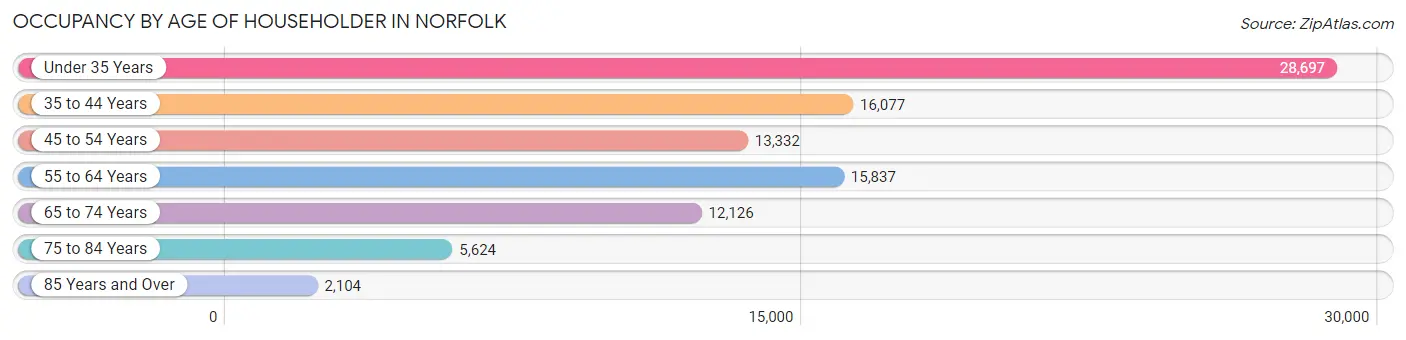
| Age Bracket | # Households | % Households |
| Under 35 Years | 28,697 | 30.6% |
| 35 to 44 Years | 16,077 | 17.1% |
| 45 to 54 Years | 13,332 | 14.2% |
| 55 to 64 Years | 15,837 | 16.9% |
| 65 to 74 Years | 12,126 | 12.9% |
| 75 to 84 Years | 5,624 | 6.0% |
| 85 Years and Over | 2,104 | 2.2% |
| Total | 93,797 | 100.0% |
Housing Finances in Norfolk
Median Income by Occupancy in Norfolk
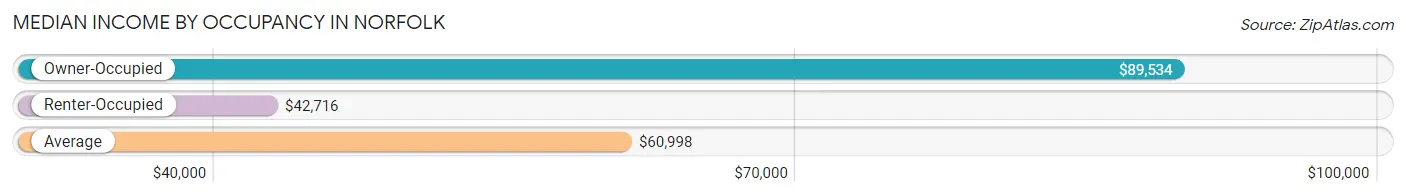
| Occupancy Type | # Households | Median Income |
| Owner-Occupied | 42,001 (44.8%) | $89,534 |
| Renter-Occupied | 51,796 (55.2%) | $42,716 |
| Average | 93,797 (100.0%) | $60,998 |
Occupancy by Householder Income Bracket in Norfolk
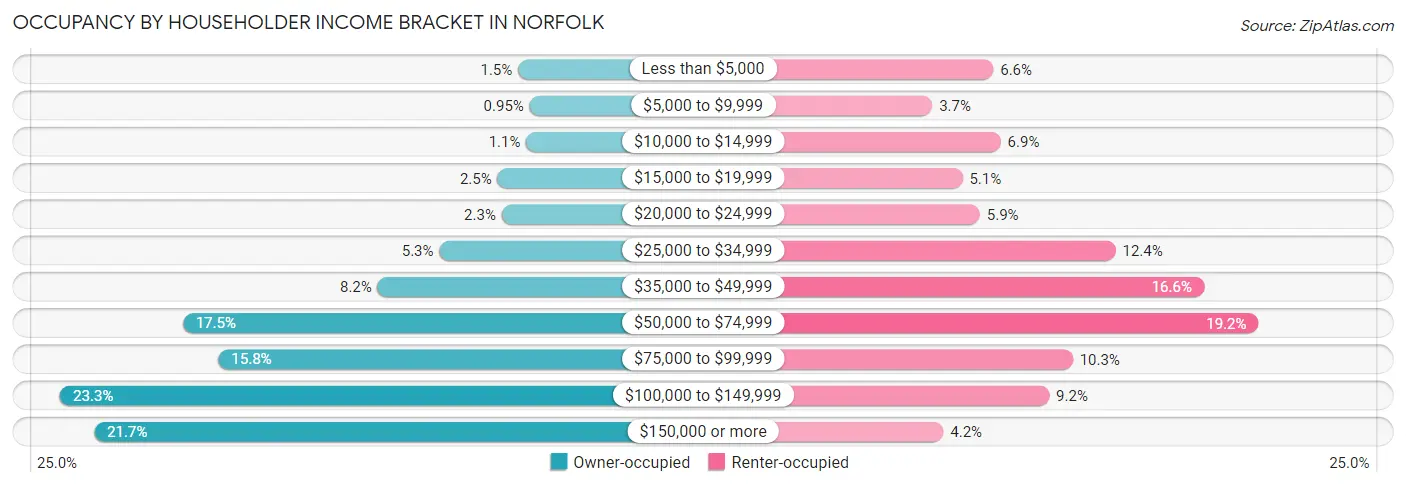
| Income Bracket | Owner-occupied | Renter-occupied |
| Less than $5,000 | 631 (1.5%) | 3,397 (6.6%) |
| $5,000 to $9,999 | 399 (0.9%) | 1,888 (3.6%) |
| $10,000 to $14,999 | 467 (1.1%) | 3,578 (6.9%) |
| $15,000 to $19,999 | 1,041 (2.5%) | 2,637 (5.1%) |
| $20,000 to $24,999 | 959 (2.3%) | 3,064 (5.9%) |
| $25,000 to $34,999 | 2,203 (5.2%) | 6,412 (12.4%) |
| $35,000 to $49,999 | 3,438 (8.2%) | 8,586 (16.6%) |
| $50,000 to $74,999 | 7,337 (17.5%) | 9,936 (19.2%) |
| $75,000 to $99,999 | 6,624 (15.8%) | 5,357 (10.3%) |
| $100,000 to $149,999 | 9,790 (23.3%) | 4,777 (9.2%) |
| $150,000 or more | 9,112 (21.7%) | 2,164 (4.2%) |
| Total | 42,001 (100.0%) | 51,796 (100.0%) |
Monthly Housing Cost Tiers in Norfolk
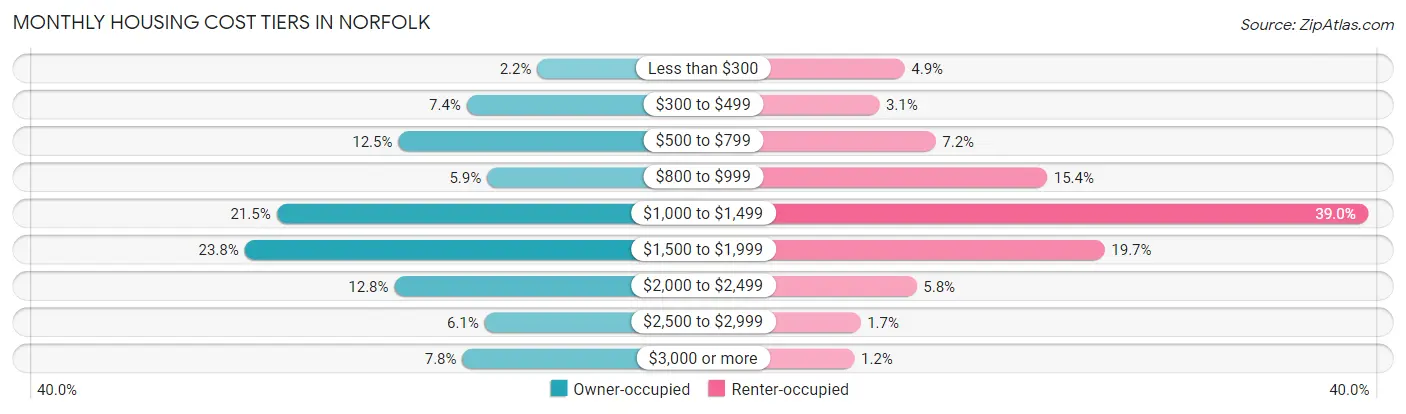
| Monthly Cost | Owner-occupied | Renter-occupied |
| Less than $300 | 942 (2.2%) | 2,553 (4.9%) |
| $300 to $499 | 3,123 (7.4%) | 1,587 (3.1%) |
| $500 to $799 | 5,241 (12.5%) | 3,737 (7.2%) |
| $800 to $999 | 2,496 (5.9%) | 7,987 (15.4%) |
| $1,000 to $1,499 | 9,008 (21.4%) | 20,222 (39.0%) |
| $1,500 to $1,999 | 9,995 (23.8%) | 10,184 (19.7%) |
| $2,000 to $2,499 | 5,365 (12.8%) | 3,010 (5.8%) |
| $2,500 to $2,999 | 2,571 (6.1%) | 869 (1.7%) |
| $3,000 or more | 3,260 (7.8%) | 639 (1.2%) |
| Total | 42,001 (100.0%) | 51,796 (100.0%) |
Physical Housing Characteristics in Norfolk
Housing Structures in Norfolk
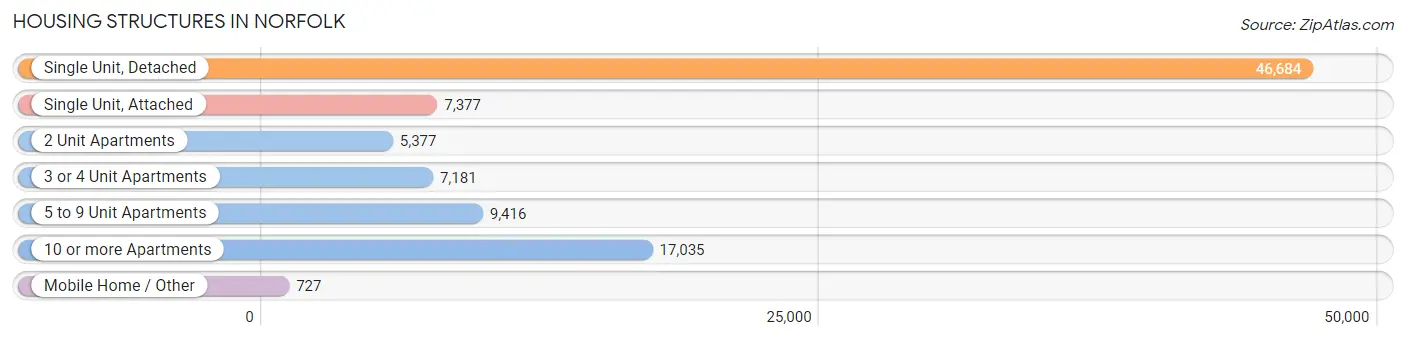
| Structure Type | # Housing Units | % Housing Units |
| Single Unit, Detached | 46,684 | 49.8% |
| Single Unit, Attached | 7,377 | 7.9% |
| 2 Unit Apartments | 5,377 | 5.7% |
| 3 or 4 Unit Apartments | 7,181 | 7.7% |
| 5 to 9 Unit Apartments | 9,416 | 10.0% |
| 10 or more Apartments | 17,035 | 18.2% |
| Mobile Home / Other | 727 | 0.8% |
| Total | 93,797 | 100.0% |
Housing Structures by Occupancy in Norfolk
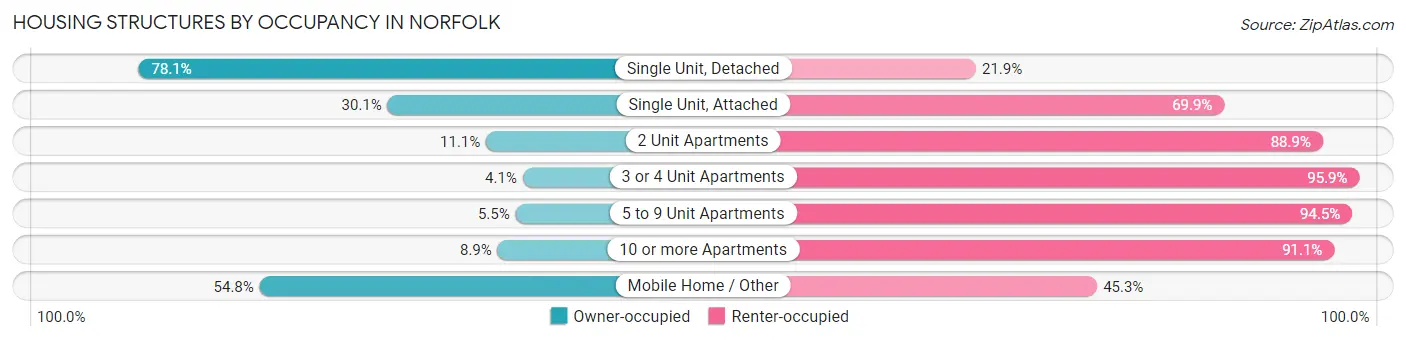
| Structure Type | Owner-occupied | Renter-occupied |
| Single Unit, Detached | 36,453 (78.1%) | 10,231 (21.9%) |
| Single Unit, Attached | 2,221 (30.1%) | 5,156 (69.9%) |
| 2 Unit Apartments | 599 (11.1%) | 4,778 (88.9%) |
| 3 or 4 Unit Apartments | 294 (4.1%) | 6,887 (95.9%) |
| 5 to 9 Unit Apartments | 515 (5.5%) | 8,901 (94.5%) |
| 10 or more Apartments | 1,521 (8.9%) | 15,514 (91.1%) |
| Mobile Home / Other | 398 (54.7%) | 329 (45.3%) |
| Total | 42,001 (44.8%) | 51,796 (55.2%) |
Housing Structures by Number of Rooms in Norfolk
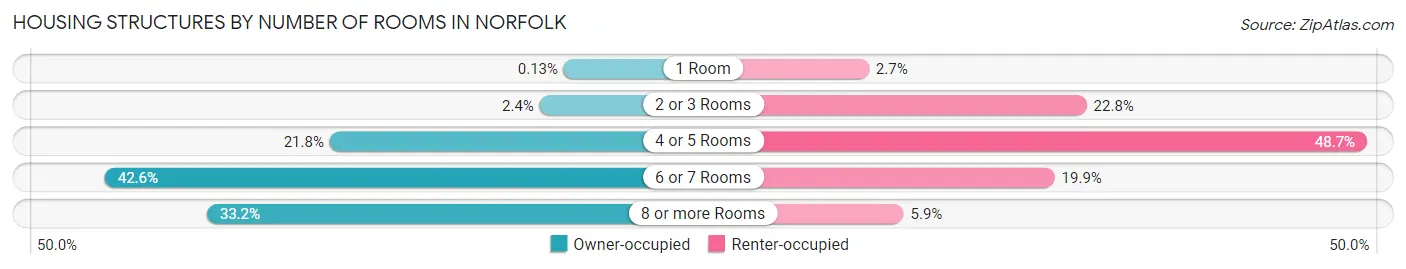
| Number of Rooms | Owner-occupied | Renter-occupied |
| 1 Room | 56 (0.1%) | 1,390 (2.7%) |
| 2 or 3 Rooms | 991 (2.4%) | 11,820 (22.8%) |
| 4 or 5 Rooms | 9,146 (21.8%) | 25,246 (48.7%) |
| 6 or 7 Rooms | 17,886 (42.6%) | 10,287 (19.9%) |
| 8 or more Rooms | 13,922 (33.2%) | 3,053 (5.9%) |
| Total | 42,001 (100.0%) | 51,796 (100.0%) |
Housing Structure by Heating Type in Norfolk
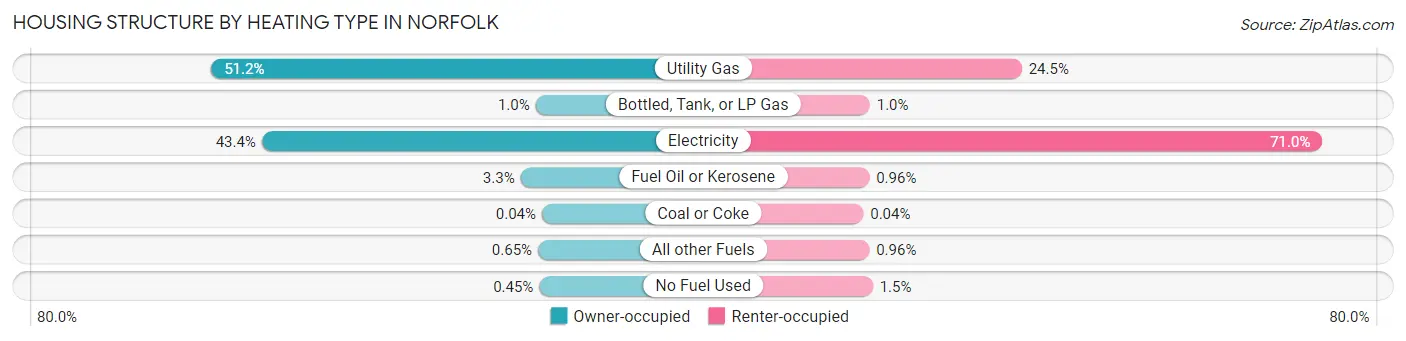
| Heating Type | Owner-occupied | Renter-occupied |
| Utility Gas | 21,485 (51.1%) | 12,706 (24.5%) |
| Bottled, Tank, or LP Gas | 426 (1.0%) | 537 (1.0%) |
| Electricity | 18,208 (43.3%) | 36,766 (71.0%) |
| Fuel Oil or Kerosene | 1,404 (3.3%) | 499 (1.0%) |
| Coal or Coke | 16 (0.0%) | 19 (0.0%) |
| All other Fuels | 275 (0.6%) | 496 (1.0%) |
| No Fuel Used | 187 (0.4%) | 773 (1.5%) |
| Total | 42,001 (100.0%) | 51,796 (100.0%) |
Household Vehicle Usage in Norfolk
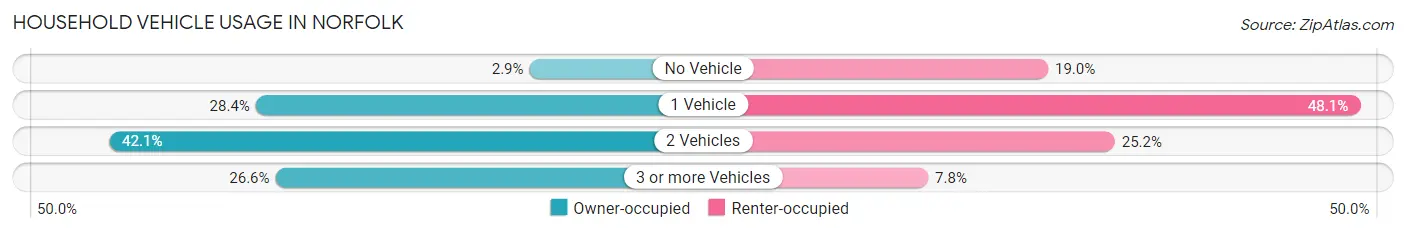
| Vehicles per Household | Owner-occupied | Renter-occupied |
| No Vehicle | 1,208 (2.9%) | 9,820 (19.0%) |
| 1 Vehicle | 11,939 (28.4%) | 24,904 (48.1%) |
| 2 Vehicles | 17,688 (42.1%) | 13,046 (25.2%) |
| 3 or more Vehicles | 11,166 (26.6%) | 4,026 (7.8%) |
| Total | 42,001 (100.0%) | 51,796 (100.0%) |
Real Estate & Mortgages in Norfolk
Real Estate and Mortgage Overview in Norfolk
| Characteristic | Without Mortgage | With Mortgage |
| Housing Units | 11,296 | 30,705 |
| Median Property Value | $239,100 | $260,000 |
| Median Household Income | $72,511 | $7,462 |
| Monthly Housing Costs | $624 | $3,248 |
| Real Estate Taxes | $2,567 | $1,617 |
Property Value by Mortgage Status in Norfolk
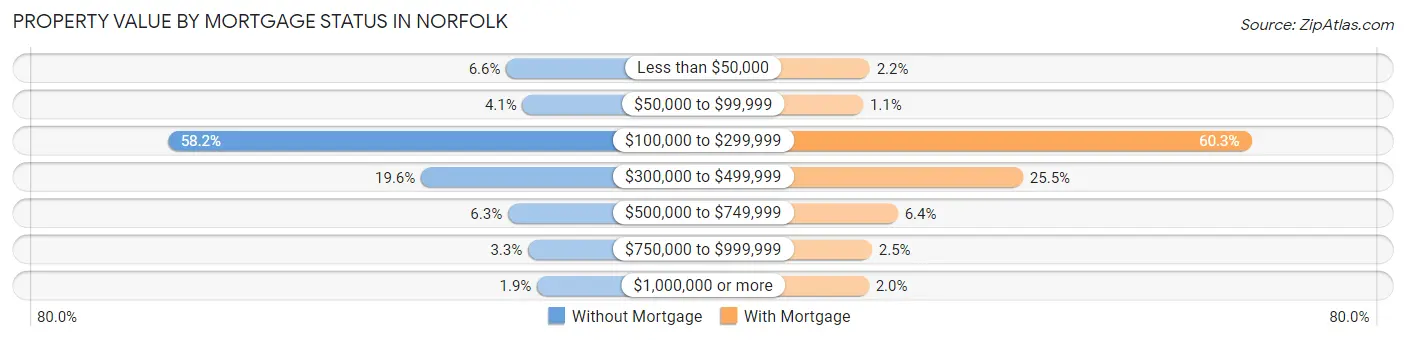
| Property Value | Without Mortgage | With Mortgage |
| Less than $50,000 | 745 (6.6%) | 663 (2.2%) |
| $50,000 to $99,999 | 465 (4.1%) | 348 (1.1%) |
| $100,000 to $299,999 | 6,573 (58.2%) | 18,514 (60.3%) |
| $300,000 to $499,999 | 2,212 (19.6%) | 7,831 (25.5%) |
| $500,000 to $749,999 | 716 (6.3%) | 1,971 (6.4%) |
| $750,000 to $999,999 | 371 (3.3%) | 760 (2.5%) |
| $1,000,000 or more | 214 (1.9%) | 618 (2.0%) |
| Total | 11,296 (100.0%) | 30,705 (100.0%) |
Household Income by Mortgage Status in Norfolk
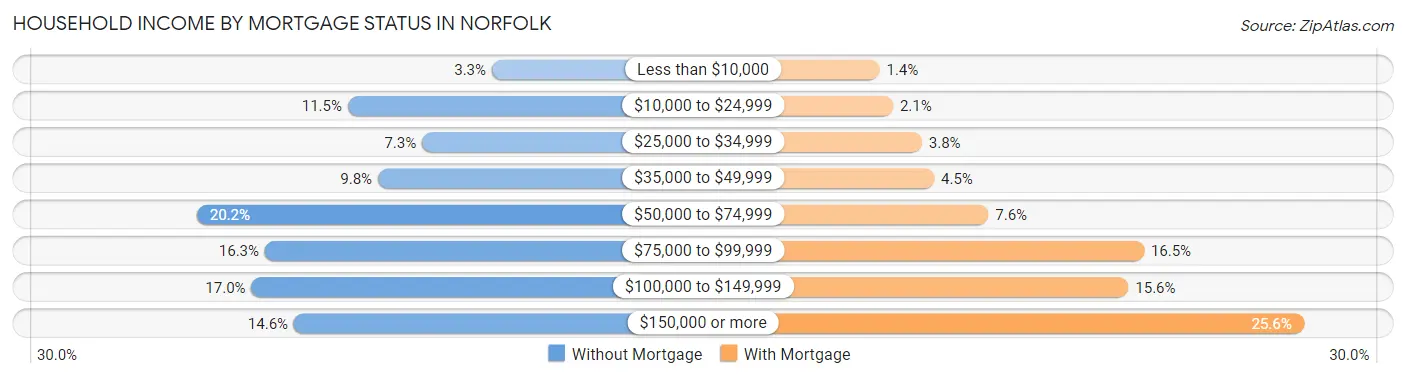
| Household Income | Without Mortgage | With Mortgage |
| Less than $10,000 | 373 (3.3%) | 422 (1.4%) |
| $10,000 to $24,999 | 1,302 (11.5%) | 657 (2.1%) |
| $25,000 to $34,999 | 823 (7.3%) | 1,165 (3.8%) |
| $35,000 to $49,999 | 1,108 (9.8%) | 1,380 (4.5%) |
| $50,000 to $74,999 | 2,277 (20.2%) | 2,330 (7.6%) |
| $75,000 to $99,999 | 1,838 (16.3%) | 5,060 (16.5%) |
| $100,000 to $149,999 | 1,925 (17.0%) | 4,786 (15.6%) |
| $150,000 or more | 1,650 (14.6%) | 7,865 (25.6%) |
| Total | 11,296 (100.0%) | 30,705 (100.0%) |
Property Value to Household Income Ratio in Norfolk
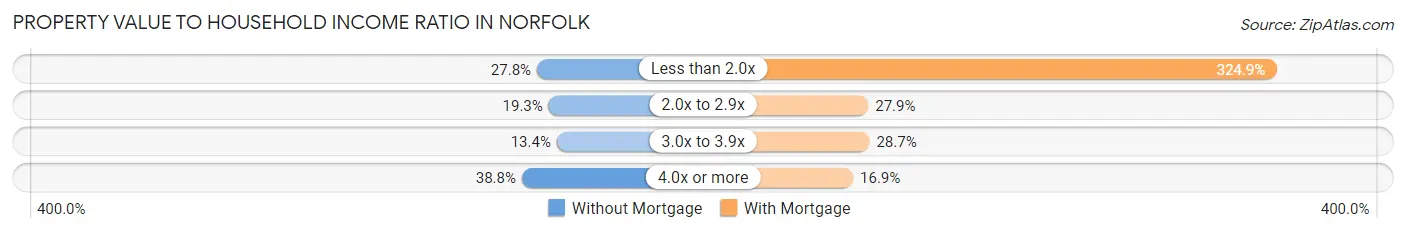
| Value-to-Income Ratio | Without Mortgage | With Mortgage |
| Less than 2.0x | 3,144 (27.8%) | 99,766 (324.9%) |
| 2.0x to 2.9x | 2,184 (19.3%) | 8,554 (27.9%) |
| 3.0x to 3.9x | 1,517 (13.4%) | 8,826 (28.7%) |
| 4.0x or more | 4,383 (38.8%) | 5,179 (16.9%) |
| Total | 11,296 (100.0%) | 30,705 (100.0%) |
Real Estate Taxes by Mortgage Status in Norfolk
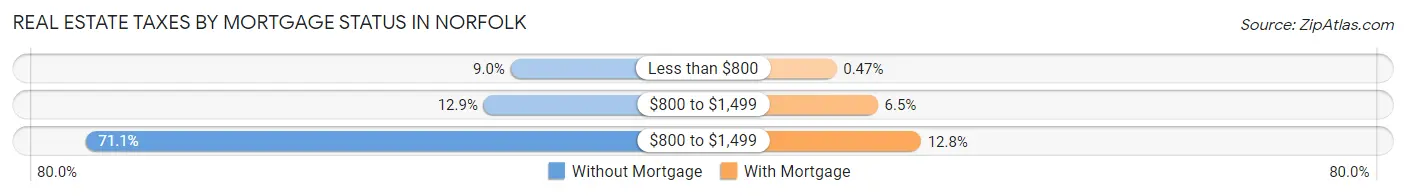
| Property Taxes | Without Mortgage | With Mortgage |
| Less than $800 | 1,013 (9.0%) | 145 (0.5%) |
| $800 to $1,499 | 1,458 (12.9%) | 1,999 (6.5%) |
| $800 to $1,499 | 8,033 (71.1%) | 3,932 (12.8%) |
| Total | 11,296 (100.0%) | 30,705 (100.0%) |
Health & Disability in Norfolk
Health Insurance Coverage by Age in Norfolk
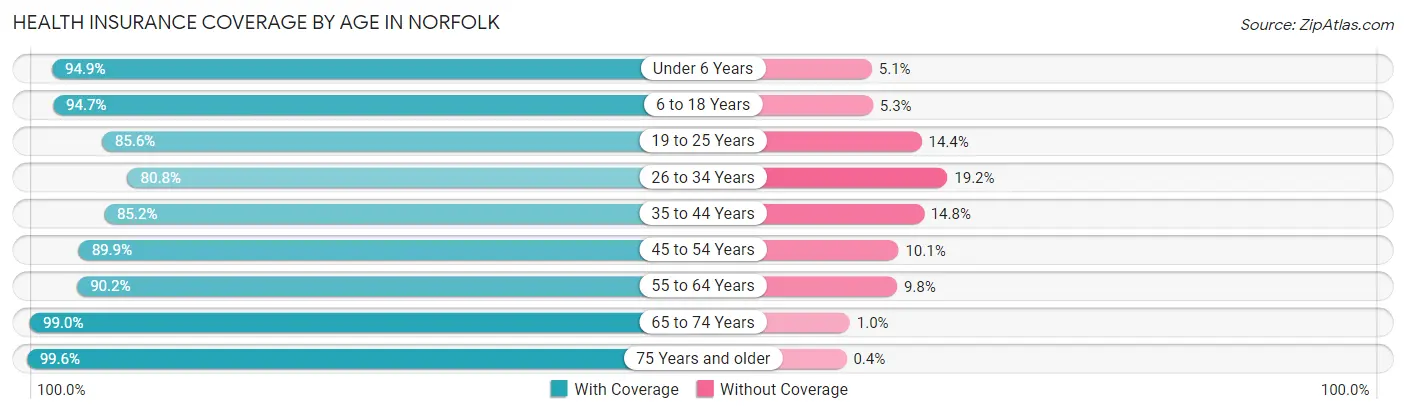
| Age Bracket | With Coverage | Without Coverage |
| Under 6 Years | 17,746 (94.9%) | 961 (5.1%) |
| 6 to 18 Years | 31,075 (94.7%) | 1,749 (5.3%) |
| 19 to 25 Years | 20,792 (85.6%) | 3,503 (14.4%) |
| 26 to 34 Years | 25,132 (80.8%) | 5,978 (19.2%) |
| 35 to 44 Years | 21,842 (85.2%) | 3,798 (14.8%) |
| 45 to 54 Years | 20,212 (89.9%) | 2,270 (10.1%) |
| 55 to 64 Years | 23,703 (90.2%) | 2,582 (9.8%) |
| 65 to 74 Years | 17,558 (99.0%) | 183 (1.0%) |
| 75 Years and older | 10,568 (99.6%) | 42 (0.4%) |
| Total | 188,628 (89.9%) | 21,066 (10.1%) |
Health Insurance Coverage by Citizenship Status in Norfolk
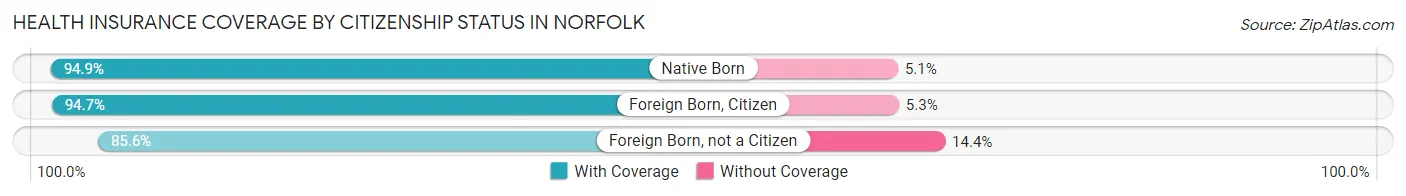
| Citizenship Status | With Coverage | Without Coverage |
| Native Born | 17,746 (94.9%) | 961 (5.1%) |
| Foreign Born, Citizen | 31,075 (94.7%) | 1,749 (5.3%) |
| Foreign Born, not a Citizen | 20,792 (85.6%) | 3,503 (14.4%) |
Health Insurance Coverage by Household Income in Norfolk
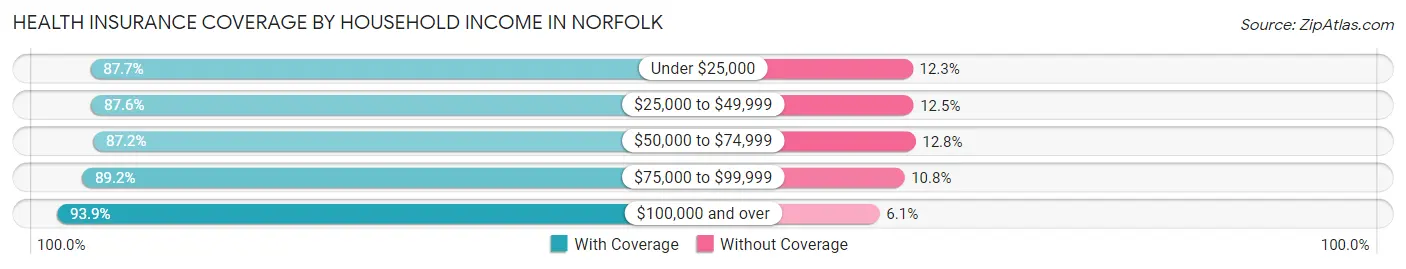
| Household Income | With Coverage | Without Coverage |
| Under $25,000 | 28,681 (87.7%) | 4,030 (12.3%) |
| $25,000 to $49,999 | 33,390 (87.5%) | 4,750 (12.4%) |
| $50,000 to $74,999 | 31,106 (87.2%) | 4,577 (12.8%) |
| $75,000 to $99,999 | 24,831 (89.2%) | 2,994 (10.8%) |
| $100,000 and over | 63,354 (93.9%) | 4,120 (6.1%) |
Public vs Private Health Insurance Coverage by Age in Norfolk
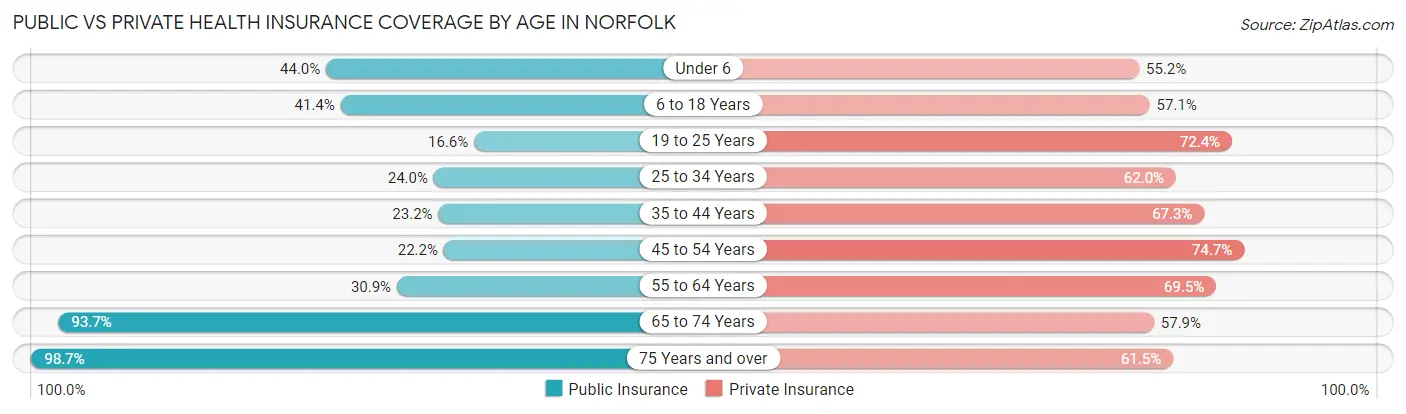
| Age Bracket | Public Insurance | Private Insurance |
| Under 6 | 8,236 (44.0%) | 10,325 (55.2%) |
| 6 to 18 Years | 13,573 (41.3%) | 18,754 (57.1%) |
| 19 to 25 Years | 4,027 (16.6%) | 17,593 (72.4%) |
| 25 to 34 Years | 7,480 (24.0%) | 19,290 (62.0%) |
| 35 to 44 Years | 5,945 (23.2%) | 17,245 (67.3%) |
| 45 to 54 Years | 4,989 (22.2%) | 16,788 (74.7%) |
| 55 to 64 Years | 8,120 (30.9%) | 18,263 (69.5%) |
| 65 to 74 Years | 16,627 (93.7%) | 10,276 (57.9%) |
| 75 Years and over | 10,476 (98.7%) | 6,524 (61.5%) |
| Total | 79,473 (37.9%) | 135,058 (64.4%) |
Disability Status by Sex by Age in Norfolk
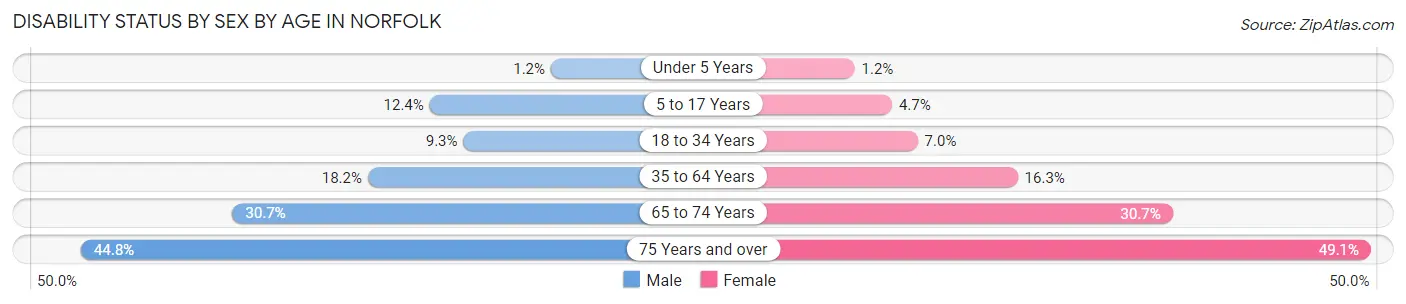
| Age Bracket | Male | Female |
| Under 5 Years | 92 (1.2%) | 90 (1.2%) |
| 5 to 17 Years | 2,056 (12.4%) | 743 (4.7%) |
| 18 to 34 Years | 2,599 (9.3%) | 2,175 (7.0%) |
| 35 to 64 Years | 6,382 (18.1%) | 6,405 (16.3%) |
| 65 to 74 Years | 2,438 (30.7%) | 3,009 (30.7%) |
| 75 Years and over | 1,803 (44.8%) | 3,232 (49.1%) |
Disability Class by Sex by Age in Norfolk
Disability Class: Hearing Difficulty
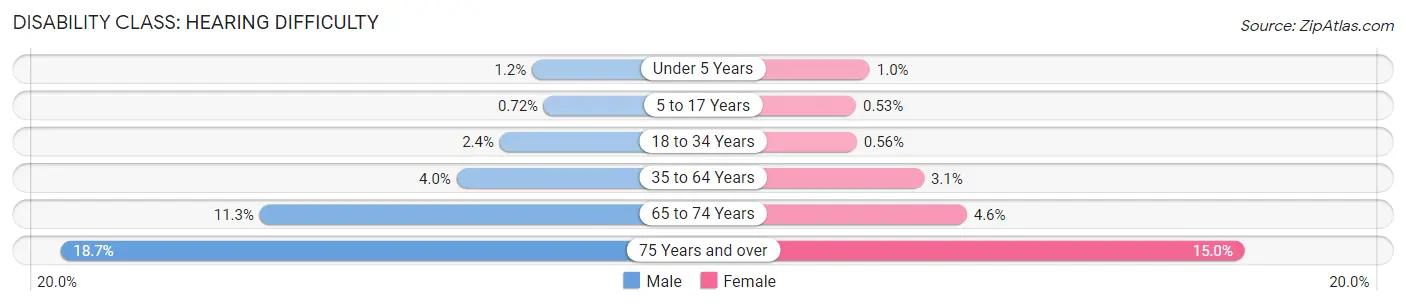
| Age Bracket | Male | Female |
| Under 5 Years | 92 (1.2%) | 79 (1.0%) |
| 5 to 17 Years | 119 (0.7%) | 85 (0.5%) |
| 18 to 34 Years | 661 (2.4%) | 173 (0.6%) |
| 35 to 64 Years | 1,393 (4.0%) | 1,196 (3.0%) |
| 65 to 74 Years | 895 (11.3%) | 455 (4.6%) |
| 75 Years and over | 752 (18.7%) | 985 (15.0%) |
Disability Class: Vision Difficulty
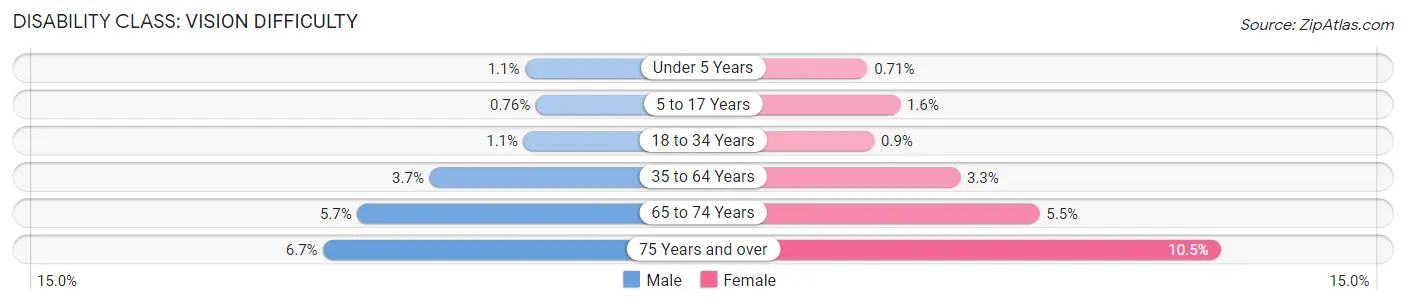
| Age Bracket | Male | Female |
| Under 5 Years | 84 (1.1%) | 54 (0.7%) |
| 5 to 17 Years | 126 (0.8%) | 259 (1.6%) |
| 18 to 34 Years | 308 (1.1%) | 279 (0.9%) |
| 35 to 64 Years | 1,308 (3.7%) | 1,291 (3.3%) |
| 65 to 74 Years | 455 (5.7%) | 539 (5.5%) |
| 75 Years and over | 269 (6.7%) | 694 (10.5%) |
Disability Class: Cognitive Difficulty
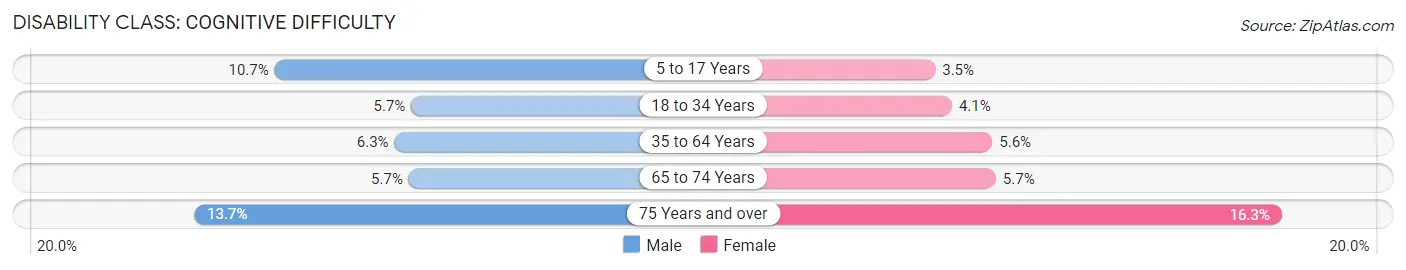
| Age Bracket | Male | Female |
| 5 to 17 Years | 1,775 (10.7%) | 553 (3.5%) |
| 18 to 34 Years | 1,582 (5.7%) | 1,264 (4.1%) |
| 35 to 64 Years | 2,204 (6.3%) | 2,193 (5.6%) |
| 65 to 74 Years | 456 (5.7%) | 561 (5.7%) |
| 75 Years and over | 552 (13.7%) | 1,075 (16.3%) |
Disability Class: Ambulatory Difficulty
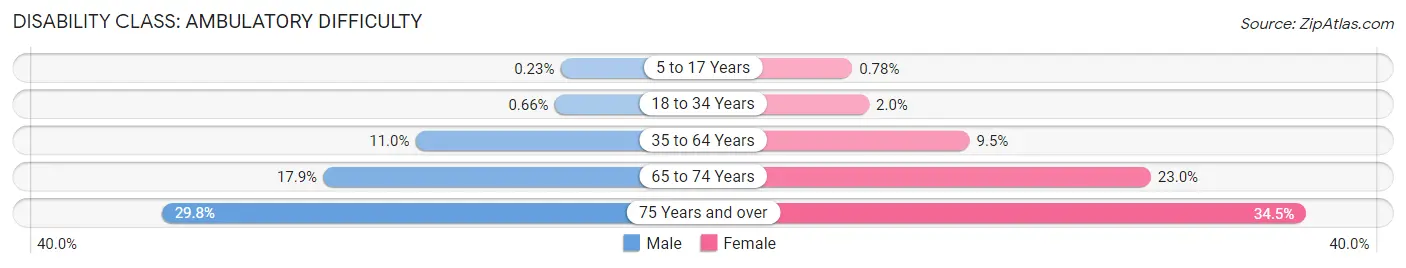
| Age Bracket | Male | Female |
| 5 to 17 Years | 38 (0.2%) | 124 (0.8%) |
| 18 to 34 Years | 186 (0.7%) | 628 (2.0%) |
| 35 to 64 Years | 3,864 (11.0%) | 3,724 (9.5%) |
| 65 to 74 Years | 1,417 (17.8%) | 2,250 (23.0%) |
| 75 Years and over | 1,201 (29.8%) | 2,269 (34.5%) |
Disability Class: Self-Care Difficulty
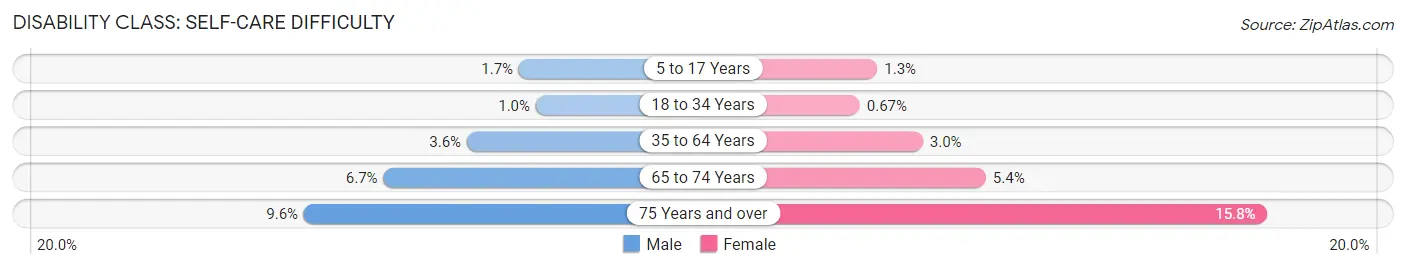
| Age Bracket | Male | Female |
| 5 to 17 Years | 274 (1.7%) | 211 (1.3%) |
| 18 to 34 Years | 287 (1.0%) | 207 (0.7%) |
| 35 to 64 Years | 1,260 (3.6%) | 1,183 (3.0%) |
| 65 to 74 Years | 530 (6.7%) | 524 (5.3%) |
| 75 Years and over | 388 (9.6%) | 1,040 (15.8%) |
Technology Access in Norfolk
Computing Device Access in Norfolk
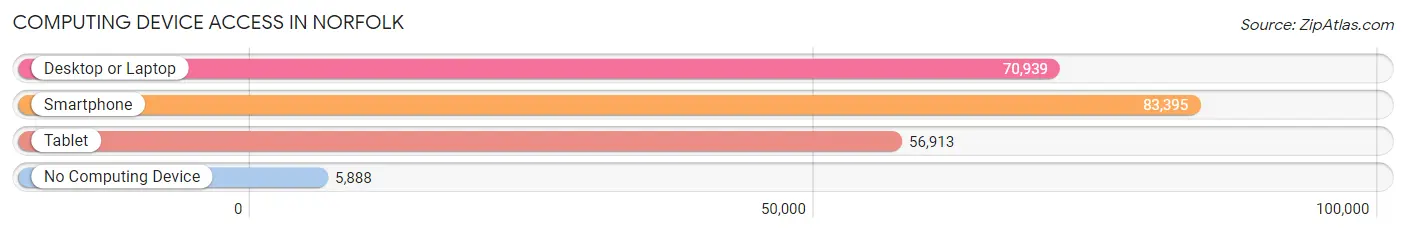
| Device Type | # Households | % Households |
| Desktop or Laptop | 70,939 | 75.6% |
| Smartphone | 83,395 | 88.9% |
| Tablet | 56,913 | 60.7% |
| No Computing Device | 5,888 | 6.3% |
| Total | 93,797 | 100.0% |
Internet Access in Norfolk
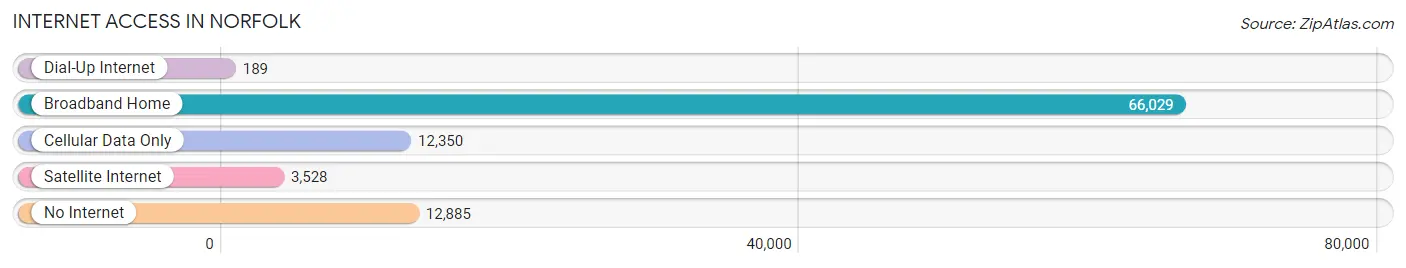
| Internet Type | # Households | % Households |
| Dial-Up Internet | 189 | 0.2% |
| Broadband Home | 66,029 | 70.4% |
| Cellular Data Only | 12,350 | 13.2% |
| Satellite Internet | 3,528 | 3.8% |
| No Internet | 12,885 | 13.7% |
| Total | 93,797 | 100.0% |
Norfolk Summary
Norfolk, Virginia is a city located in the southeastern part of the state, on the Elizabeth River. It is the second-largest city in Virginia, and the 44th-largest city in the United States. Norfolk is a major port city, and is home to the world’s largest naval base, Naval Station Norfolk. The city has a population of approximately 244,000 people, and is the core of the Hampton Roads metropolitan area, which has a population of 1.7 million people.
History
The area that is now Norfolk was first settled by Native Americans in the late 1600s. The first European settlers arrived in the early 1700s, and the city was officially founded in 1705. The city was named after Norfolk, England, and was initially a port town. During the American Revolution, Norfolk was a major port for the British, and was the site of several battles.
In the 19th century, Norfolk became an important port for the Confederacy during the Civil War. The city was the site of several battles, and was occupied by Union forces in 1862. After the war, Norfolk was a major center of commerce and industry, and was home to several large shipyards.
Geography
Norfolk is located in the southeastern part of Virginia, on the Elizabeth River. The city is bordered by the cities of Chesapeake, Portsmouth, and Virginia Beach. The city is located at the mouth of the Chesapeake Bay, and is part of the Hampton Roads metropolitan area. The city has a total area of 96.3 square miles, of which, 90.3 square miles is land and 6.0 square miles is water.
Economy
Norfolk’s economy is largely based on the military, shipping, and tourism. The city is home to the world’s largest naval base, Naval Station Norfolk, which is the largest employer in the city. The city is also home to several large shipyards, and is a major port for cargo and cruise ships. The city is also a major tourist destination, with attractions such as the Virginia Zoo, the Chrysler Museum of Art, and the Nauticus Maritime Center.
Demographics
As of the 2010 census, Norfolk had a population of 244,000 people. The racial makeup of the city was 57.2% African American, 33.3% White, 5.2% Hispanic or Latino, 2.2% Asian, and 1.3% other. The median household income was $41,000, and the median family income was $50,000. The city’s poverty rate was 22.3%.
Common Questions
What is the Total Population of Norfolk?
Total Population of Norfolk is 236,973.
What is the Total Male Population of Norfolk?
Total Male Population of Norfolk is 120,733.
What is the Total Female Population of Norfolk?
Total Female Population of Norfolk is 116,240.
What is the Ratio of Males per 100 Females in Norfolk?
There are 103.87 Males per 100 Females in Norfolk.
What is the Ratio of Females per 100 Males in Norfolk?
There are 96.28 Females per 100 Males in Norfolk.
What is the Median Population Age in Norfolk?
Median Population Age in Norfolk is 32.2 Years.
What is the Average Family Size in Norfolk
Average Family Size in Norfolk is 3.0 People.
What is the Average Household Size in Norfolk
Average Household Size in Norfolk is 2.3 People.
What is Per Capita Income in Norfolk?
Per Capita income in Norfolk is $35,761.
What is the Median Family Income in Norfolk?
Median Family Income in Norfolk is $76,346.
What is the Median Household income in Norfolk?
Median Household Income in Norfolk is $60,998.
What is Income or Wage Gap in Norfolk?
Income or Wage Gap in Norfolk is 25.6%.
Women in Norfolk earn 74.4 cents for every dollar earned by a man.
What is Family Income Deficit in Norfolk?
Family Income Deficit in Norfolk is $11,395.
Families that are below poverty line in Norfolk earn $11,395 less on average than the poverty threshold level.
What is Inequality or Gini Index in Norfolk?
Inequality or Gini Index in Norfolk is 0.48.
How Large is the Labor Force in Norfolk?
There are 135,377 People in the Labor Forcein in Norfolk.
What is the Percentage of People in the Labor Force in Norfolk?
70.0% of People are in the Labor Force in Norfolk.
What is the Unemployment Rate in Norfolk?
Unemployment Rate in Norfolk is 6.7%.