Cities with the Most Immigrants from Italy in Virginia
RELATED REPORTS & OPTIONS
Italy
Virginia
Compare Cities
Map of Cities with the Most Immigrants from Italy in Virginia
0
400
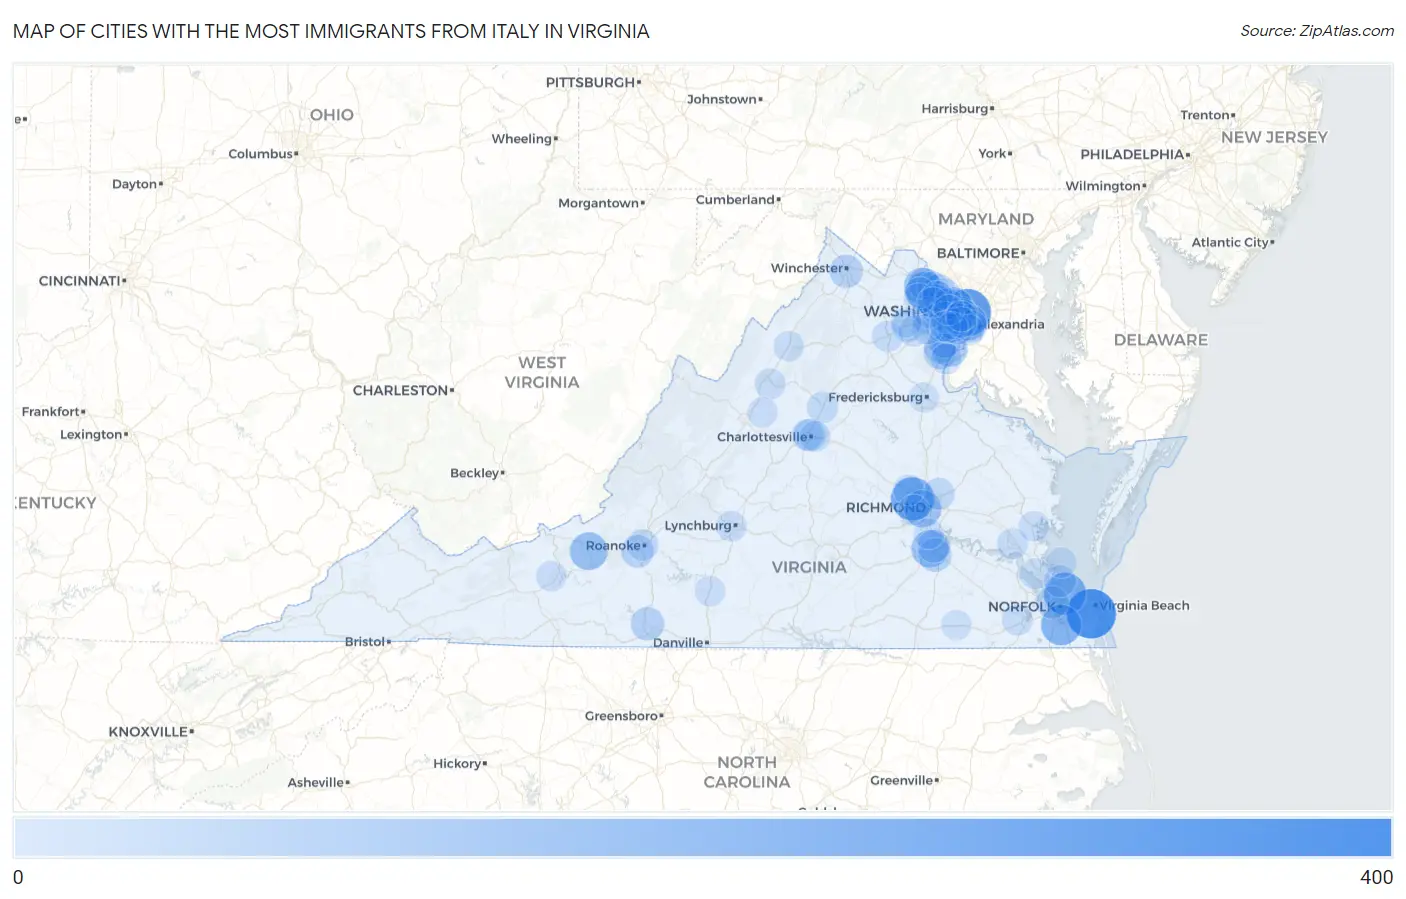
Cities with the Most Immigrants from Italy in Virginia
| City | Italy | vs State | vs National | |
| 1. | Virginia Beach | 400 | 5,147(7.77%)#1 | 312,941(0.13%)#62 |
| 2. | Arlington | 346 | 5,147(6.72%)#2 | 312,941(0.11%)#79 |
| 3. | Tuckahoe | 266 | 5,147(5.17%)#3 | 312,941(0.09%)#126 |
| 4. | Norfolk | 246 | 5,147(4.78%)#4 | 312,941(0.08%)#151 |
| 5. | Chesapeake | 211 | 5,147(4.10%)#5 | 312,941(0.07%)#187 |
| 6. | Tysons | 207 | 5,147(4.02%)#6 | 312,941(0.07%)#195 |
| 7. | Ashburn | 177 | 5,147(3.44%)#7 | 312,941(0.06%)#241 |
| 8. | Blacksburg | 151 | 5,147(2.93%)#8 | 312,941(0.05%)#308 |
| 9. | Richmond | 147 | 5,147(2.86%)#9 | 312,941(0.05%)#326 |
| 10. | Ettrick | 142 | 5,147(2.76%)#10 | 312,941(0.05%)#335 |
| 11. | Belmont | 141 | 5,147(2.74%)#11 | 312,941(0.05%)#341 |
| 12. | Alexandria | 116 | 5,147(2.25%)#12 | 312,941(0.04%)#414 |
| 13. | Woodbridge | 112 | 5,147(2.18%)#13 | 312,941(0.04%)#438 |
| 14. | Reston | 92 | 5,147(1.79%)#14 | 312,941(0.03%)#554 |
| 15. | Rose Hill Cdp Fairfax County | 90 | 5,147(1.75%)#15 | 312,941(0.03%)#568 |
| 16. | Petersburg | 69 | 5,147(1.34%)#16 | 312,941(0.02%)#742 |
| 17. | Collinsville | 67 | 5,147(1.30%)#17 | 312,941(0.02%)#770 |
| 18. | Winchester | 65 | 5,147(1.26%)#18 | 312,941(0.02%)#790 |
| 19. | Montclair | 58 | 5,147(1.13%)#19 | 312,941(0.02%)#875 |
| 20. | Lake Ridge | 57 | 5,147(1.11%)#20 | 312,941(0.02%)#889 |
| 21. | Merrifield | 54 | 5,147(1.05%)#21 | 312,941(0.02%)#933 |
| 22. | Cave Spring | 52 | 5,147(1.01%)#22 | 312,941(0.02%)#956 |
| 23. | Colonial Heights | 51 | 5,147(0.99%)#23 | 312,941(0.02%)#983 |
| 24. | Falls Church | 47 | 5,147(0.91%)#24 | 312,941(0.02%)#1,057 |
| 25. | Portsmouth | 46 | 5,147(0.89%)#25 | 312,941(0.01%)#1,065 |
| 26. | Fair Oaks | 46 | 5,147(0.89%)#26 | 312,941(0.01%)#1,068 |
| 27. | Dale City | 42 | 5,147(0.82%)#27 | 312,941(0.01%)#1,137 |
| 28. | Charlottesville | 41 | 5,147(0.80%)#28 | 312,941(0.01%)#1,163 |
| 29. | Oakton | 40 | 5,147(0.78%)#29 | 312,941(0.01%)#1,181 |
| 30. | Lowes Island | 39 | 5,147(0.76%)#30 | 312,941(0.01%)#1,217 |
| 31. | Centreville | 38 | 5,147(0.74%)#31 | 312,941(0.01%)#1,230 |
| 32. | Mechanicsville | 36 | 5,147(0.70%)#32 | 312,941(0.01%)#1,280 |
| 33. | Hampton | 35 | 5,147(0.68%)#33 | 312,941(0.01%)#1,306 |
| 34. | Huntington | 34 | 5,147(0.66%)#34 | 312,941(0.01%)#1,334 |
| 35. | Countryside | 33 | 5,147(0.64%)#35 | 312,941(0.01%)#1,365 |
| 36. | University Of Virginia | 30 | 5,147(0.58%)#36 | 312,941(0.01%)#1,467 |
| 37. | Seven Corners | 29 | 5,147(0.56%)#37 | 312,941(0.01%)#1,509 |
| 38. | Leesylvania | 28 | 5,147(0.54%)#38 | 312,941(0.01%)#1,541 |
| 39. | Roanoke | 27 | 5,147(0.52%)#39 | 312,941(0.01%)#1,560 |
| 40. | Herndon | 27 | 5,147(0.52%)#40 | 312,941(0.01%)#1,569 |
| 41. | Ruckersville | 24 | 5,147(0.47%)#41 | 312,941(0.01%)#1,713 |
| 42. | Springfield | 21 | 5,147(0.41%)#42 | 312,941(0.01%)#1,820 |
| 43. | Fairfax Station | 21 | 5,147(0.41%)#43 | 312,941(0.01%)#1,830 |
| 44. | Burke | 20 | 5,147(0.39%)#44 | 312,941(0.01%)#1,853 |
| 45. | Gainesville | 20 | 5,147(0.39%)#45 | 312,941(0.01%)#1,860 |
| 46. | Difficult Run | 20 | 5,147(0.39%)#46 | 312,941(0.01%)#1,867 |
| 47. | Lansdowne | 19 | 5,147(0.37%)#47 | 312,941(0.01%)#1,921 |
| 48. | Warrenton | 19 | 5,147(0.37%)#48 | 312,941(0.01%)#1,924 |
| 49. | Kings Park | 19 | 5,147(0.37%)#49 | 312,941(0.01%)#1,943 |
| 50. | Mclean | 18 | 5,147(0.35%)#50 | 312,941(0.01%)#1,963 |
| 51. | Short Pump | 17 | 5,147(0.33%)#51 | 312,941(0.01%)#2,046 |
| 52. | Chantilly | 17 | 5,147(0.33%)#52 | 312,941(0.01%)#2,049 |
| 53. | Manassas Park | 17 | 5,147(0.33%)#53 | 312,941(0.01%)#2,056 |
| 54. | Annandale | 16 | 5,147(0.31%)#54 | 312,941(0.01%)#2,106 |
| 55. | Wolf Trap | 16 | 5,147(0.31%)#55 | 312,941(0.01%)#2,123 |
| 56. | Williamsburg | 16 | 5,147(0.31%)#56 | 312,941(0.01%)#2,124 |
| 57. | Cherry Hill | 15 | 5,147(0.29%)#57 | 312,941(0.00%)#2,187 |
| 58. | Suffolk | 14 | 5,147(0.27%)#58 | 312,941(0.00%)#2,246 |
| 59. | Linton Hall | 13 | 5,147(0.25%)#59 | 312,941(0.00%)#2,323 |
| 60. | Fairfax | 13 | 5,147(0.25%)#60 | 312,941(0.00%)#2,336 |
| 61. | Bon Air | 13 | 5,147(0.25%)#61 | 312,941(0.00%)#2,341 |
| 62. | Pantops | 13 | 5,147(0.25%)#62 | 312,941(0.00%)#2,375 |
| 63. | Newport News | 12 | 5,147(0.23%)#63 | 312,941(0.00%)#2,401 |
| 64. | Brambleton | 12 | 5,147(0.23%)#64 | 312,941(0.00%)#2,425 |
| 65. | Groveton | 11 | 5,147(0.21%)#65 | 312,941(0.00%)#2,515 |
| 66. | Lincolnia | 10 | 5,147(0.19%)#66 | 312,941(0.00%)#2,618 |
| 67. | Great Falls | 10 | 5,147(0.19%)#67 | 312,941(0.00%)#2,634 |
| 68. | Broadlands | 10 | 5,147(0.19%)#68 | 312,941(0.00%)#2,636 |
| 69. | Dranesville | 10 | 5,147(0.19%)#69 | 312,941(0.00%)#2,643 |
| 70. | Massanetta Springs | 10 | 5,147(0.19%)#70 | 312,941(0.00%)#2,669 |
| 71. | Lynchburg | 9 | 5,147(0.17%)#71 | 312,941(0.00%)#2,722 |
| 72. | Chester | 9 | 5,147(0.17%)#72 | 312,941(0.00%)#2,744 |
| 73. | Pulaski | 9 | 5,147(0.17%)#73 | 312,941(0.00%)#2,767 |
| 74. | West Springfield | 8 | 5,147(0.16%)#74 | 312,941(0.00%)#2,857 |
| 75. | Gretna | 8 | 5,147(0.16%)#75 | 312,941(0.00%)#2,936 |
| 76. | Mcnair | 7 | 5,147(0.14%)#76 | 312,941(0.00%)#2,978 |
| 77. | Poquoson | 7 | 5,147(0.14%)#77 | 312,941(0.00%)#2,998 |
| 78. | Gloucester Courthouse | 7 | 5,147(0.14%)#78 | 312,941(0.00%)#3,036 |
| 79. | Union Mill | 6 | 5,147(0.12%)#79 | 312,941(0.00%)#3,124 |
| 80. | New Market | 6 | 5,147(0.12%)#80 | 312,941(0.00%)#3,146 |
| 81. | Vienna | 4 | 5,147(0.08%)#81 | 312,941(0.00%)#3,300 |
| 82. | New Hope | 4 | 5,147(0.08%)#82 | 312,941(0.00%)#3,365 |
| 83. | Fredericksburg | 3 | 5,147(0.06%)#83 | 312,941(0.00%)#3,385 |
| 84. | Burke Centre | 3 | 5,147(0.06%)#84 | 312,941(0.00%)#3,390 |
| 85. | Lake Barcroft | 3 | 5,147(0.06%)#85 | 312,941(0.00%)#3,393 |
| 86. | Haymarket | 3 | 5,147(0.06%)#86 | 312,941(0.00%)#3,429 |
| 87. | Capron | 1 | 5,147(0.02%)#87 | 312,941(0.00%)#3,629 |
Common Questions
What are the Top 10 Cities with the Most Immigrants from Italy in Virginia?
Top 10 Cities with the Most Immigrants from Italy in Virginia are:
#1
400
#2
346
#3
266
#4
246
#5
211
#6
207
#7
177
#8
151
#9
147
#10
142
What city has the Most Immigrants from Italy in Virginia?
Virginia Beach has the Most Immigrants from Italy in Virginia with 400.
What is the Total Immigrants from Italy in the State of Virginia?
Total Immigrants from Italy in Virginia is 5,147.
What is the Total Immigrants from Italy in the United States?
Total Immigrants from Italy in the United States is 312,941.