Cities with the Highest Percentage of Malaysian Population in Virginia
RELATED REPORTS & OPTIONS
Malaysian
Virginia
Compare Cities
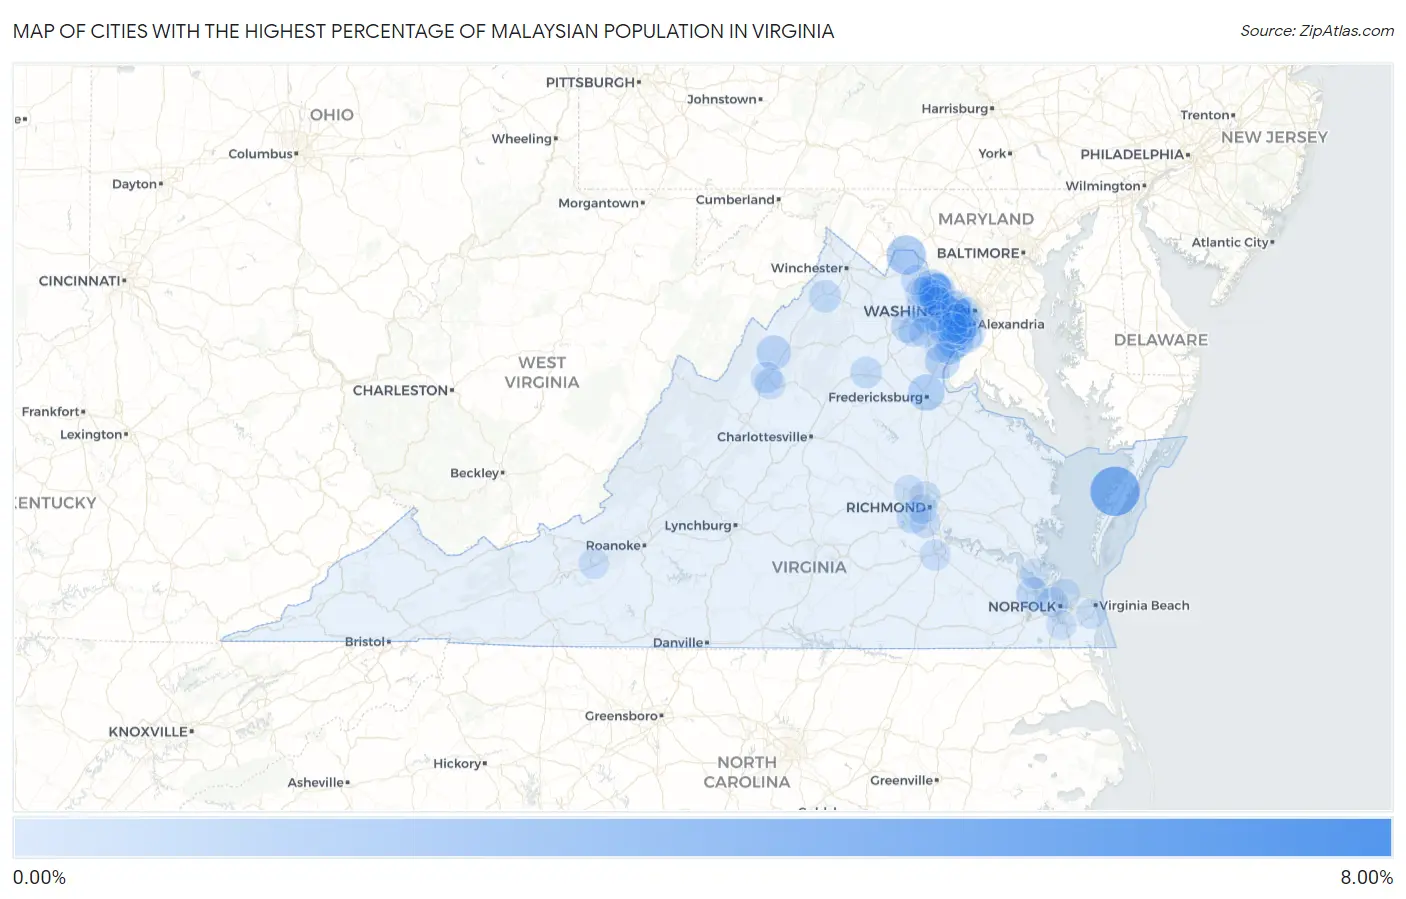
Map of Cities with the Highest Percentage of Malaysian Population in Virginia
0.00%
8.00%
Cities with the Highest Percentage of Malaysian Population in Virginia
| City | Malaysian | vs State | vs National | |
| 1. | Great Falls Crossing | 6.43% | 0.055%(+6.37)#1 | 0.076%(+6.35)#22 |
| 2. | Hutchison | 4.56% | 0.055%(+4.51)#2 | 0.076%(+4.49)#42 |
| 3. | Bobtown | 3.74% | 0.055%(+3.68)#3 | 0.076%(+3.66)#48 |
| 4. | Union Mill | 2.35% | 0.055%(+2.29)#4 | 0.076%(+2.27)#93 |
| 5. | Lovettsville | 1.73% | 0.055%(+1.67)#5 | 0.076%(+1.65)#139 |
| 6. | Lorton | 1.35% | 0.055%(+1.29)#6 | 0.076%(+1.27)#185 |
| 7. | Falmouth | 1.22% | 0.055%(+1.16)#7 | 0.076%(+1.14)#208 |
| 8. | Countryside | 1.12% | 0.055%(+1.06)#8 | 0.076%(+1.04)#239 |
| 9. | Triangle | 0.91% | 0.055%(+0.854)#9 | 0.076%(+0.834)#279 |
| 10. | Broadway | 0.84% | 0.055%(+0.784)#10 | 0.076%(+0.764)#302 |
| 11. | Sugarland Run | 0.83% | 0.055%(+0.772)#11 | 0.076%(+0.751)#306 |
| 12. | Newington | 0.57% | 0.055%(+0.513)#12 | 0.076%(+0.492)#413 |
| 13. | Gainesville | 0.55% | 0.055%(+0.499)#13 | 0.076%(+0.478)#423 |
| 14. | Lowes Island | 0.55% | 0.055%(+0.495)#14 | 0.076%(+0.475)#427 |
| 15. | Cascades | 0.55% | 0.055%(+0.495)#15 | 0.076%(+0.474)#428 |
| 16. | Carrollton | 0.53% | 0.055%(+0.477)#16 | 0.076%(+0.456)#442 |
| 17. | Strasburg | 0.48% | 0.055%(+0.423)#17 | 0.076%(+0.403)#478 |
| 18. | West Falls Church | 0.47% | 0.055%(+0.411)#18 | 0.076%(+0.390)#488 |
| 19. | Rockwood | 0.38% | 0.055%(+0.329)#19 | 0.076%(+0.308)#556 |
| 20. | Tysons | 0.38% | 0.055%(+0.321)#20 | 0.076%(+0.301)#561 |
| 21. | Woodbridge | 0.38% | 0.055%(+0.320)#21 | 0.076%(+0.300)#563 |
| 22. | Fair Oaks | 0.36% | 0.055%(+0.304)#22 | 0.076%(+0.283)#582 |
| 23. | Mcnair | 0.34% | 0.055%(+0.283)#23 | 0.076%(+0.262)#599 |
| 24. | Seven Corners | 0.32% | 0.055%(+0.262)#24 | 0.076%(+0.241)#625 |
| 25. | Culpeper | 0.31% | 0.055%(+0.258)#25 | 0.076%(+0.238)#632 |
| 26. | Centreville | 0.28% | 0.055%(+0.223)#26 | 0.076%(+0.202)#687 |
| 27. | Harrisonburg | 0.26% | 0.055%(+0.209)#27 | 0.076%(+0.189)#712 |
| 28. | Oakton | 0.24% | 0.055%(+0.183)#28 | 0.076%(+0.162)#765 |
| 29. | Kings Park | 0.22% | 0.055%(+0.170)#29 | 0.076%(+0.149)#791 |
| 30. | Hybla Valley | 0.20% | 0.055%(+0.144)#30 | 0.076%(+0.123)#849 |
| 31. | Massanetta Springs | 0.19% | 0.055%(+0.137)#31 | 0.076%(+0.116)#877 |
| 32. | Linton Hall | 0.18% | 0.055%(+0.128)#32 | 0.076%(+0.107)#901 |
| 33. | Reston | 0.18% | 0.055%(+0.126)#33 | 0.076%(+0.105)#906 |
| 34. | Fairfax Station | 0.18% | 0.055%(+0.124)#34 | 0.076%(+0.103)#914 |
| 35. | Sterling | 0.18% | 0.055%(+0.122)#35 | 0.076%(+0.101)#918 |
| 36. | Kingstowne | 0.16% | 0.055%(+0.109)#36 | 0.076%(+0.089)#948 |
| 37. | Petersburg | 0.16% | 0.055%(+0.104)#37 | 0.076%(+0.084)#967 |
| 38. | South Riding | 0.15% | 0.055%(+0.098)#38 | 0.076%(+0.077)#988 |
| 39. | Merrifield | 0.15% | 0.055%(+0.090)#39 | 0.076%(+0.070)#1,011 |
| 40. | Burke Centre | 0.15% | 0.055%(+0.090)#40 | 0.076%(+0.069)#1,013 |
| 41. | Mount Vernon | 0.14% | 0.055%(+0.088)#41 | 0.076%(+0.067)#1,019 |
| 42. | Portsmouth | 0.13% | 0.055%(+0.074)#42 | 0.076%(+0.054)#1,056 |
| 43. | Franconia | 0.12% | 0.055%(+0.068)#43 | 0.076%(+0.047)#1,080 |
| 44. | Dale City | 0.11% | 0.055%(+0.056)#44 | 0.076%(+0.035)#1,125 |
| 45. | Broadlands | 0.11% | 0.055%(+0.055)#45 | 0.076%(+0.034)#1,131 |
| 46. | Herndon | 0.10% | 0.055%(+0.047)#46 | 0.076%(+0.026)#1,161 |
| 47. | Leesburg | 0.10% | 0.055%(+0.046)#47 | 0.076%(+0.025)#1,163 |
| 48. | Newington Forest | 0.079% | 0.055%(+0.024)#48 | 0.076%(+0.003)#1,262 |
| 49. | Idylwood | 0.079% | 0.055%(+0.024)#49 | 0.076%(+0.003)#1,264 |
| 50. | Meadowbrook | 0.075% | 0.055%(+0.020)#50 | 0.076%(-0.001)#1,286 |
| 51. | Mclean | 0.075% | 0.055%(+0.019)#51 | 0.076%(-0.001)#1,288 |
| 52. | Christiansburg | 0.074% | 0.055%(+0.019)#52 | 0.076%(-0.002)#1,292 |
| 53. | Springfield | 0.071% | 0.055%(+0.016)#53 | 0.076%(-0.005)#1,306 |
| 54. | Fair Lakes | 0.067% | 0.055%(+0.012)#54 | 0.076%(-0.009)#1,319 |
| 55. | Lakeside | 0.058% | 0.055%(+0.003)#55 | 0.076%(-0.018)#1,367 |
| 56. | Alexandria | 0.049% | 0.055%(-0.006)#56 | 0.076%(-0.027)#1,413 |
| 57. | Short Pump | 0.039% | 0.055%(-0.016)#57 | 0.076%(-0.037)#1,497 |
| 58. | Manassas | 0.038% | 0.055%(-0.018)#58 | 0.076%(-0.038)#1,505 |
| 59. | Newport News | 0.035% | 0.055%(-0.021)#59 | 0.076%(-0.041)#1,521 |
| 60. | Annandale | 0.031% | 0.055%(-0.024)#60 | 0.076%(-0.045)#1,550 |
| 61. | Norfolk | 0.030% | 0.055%(-0.025)#61 | 0.076%(-0.046)#1,558 |
| 62. | West Springfield | 0.021% | 0.055%(-0.034)#62 | 0.076%(-0.054)#1,622 |
| 63. | Richmond | 0.018% | 0.055%(-0.037)#63 | 0.076%(-0.057)#1,654 |
| 64. | Virginia Beach | 0.018% | 0.055%(-0.037)#64 | 0.076%(-0.058)#1,661 |
| 65. | Ashburn | 0.018% | 0.055%(-0.038)#65 | 0.076%(-0.058)#1,663 |
| 66. | Arlington | 0.017% | 0.055%(-0.039)#66 | 0.076%(-0.059)#1,670 |
| 67. | Chesapeake | 0.0076% | 0.055%(-0.048)#67 | 0.076%(-0.068)#1,753 |
Common Questions
What are the Top 10 Cities with the Highest Percentage of Malaysian Population in Virginia?
Top 10 Cities with the Highest Percentage of Malaysian Population in Virginia are:
#1
3.74%
#2
1.73%
#3
1.35%
#4
1.22%
#5
1.12%
#6
0.91%
#7
0.84%
#8
0.83%
#9
0.57%
#10
0.55%
What city has the Highest Percentage of Malaysian Population in Virginia?
Bobtown has the Highest Percentage of Malaysian Population in Virginia with 3.74%.
What is the Percentage of Malaysian Population in the State of Virginia?
Percentage of Malaysian Population in Virginia is 0.055%.
What is the Percentage of Malaysian Population in the United States?
Percentage of Malaysian Population in the United States is 0.076%.