Cities with the Most Immigrants from Nigeria in Virginia
RELATED REPORTS & OPTIONS
Nigeria
Virginia
Compare Cities
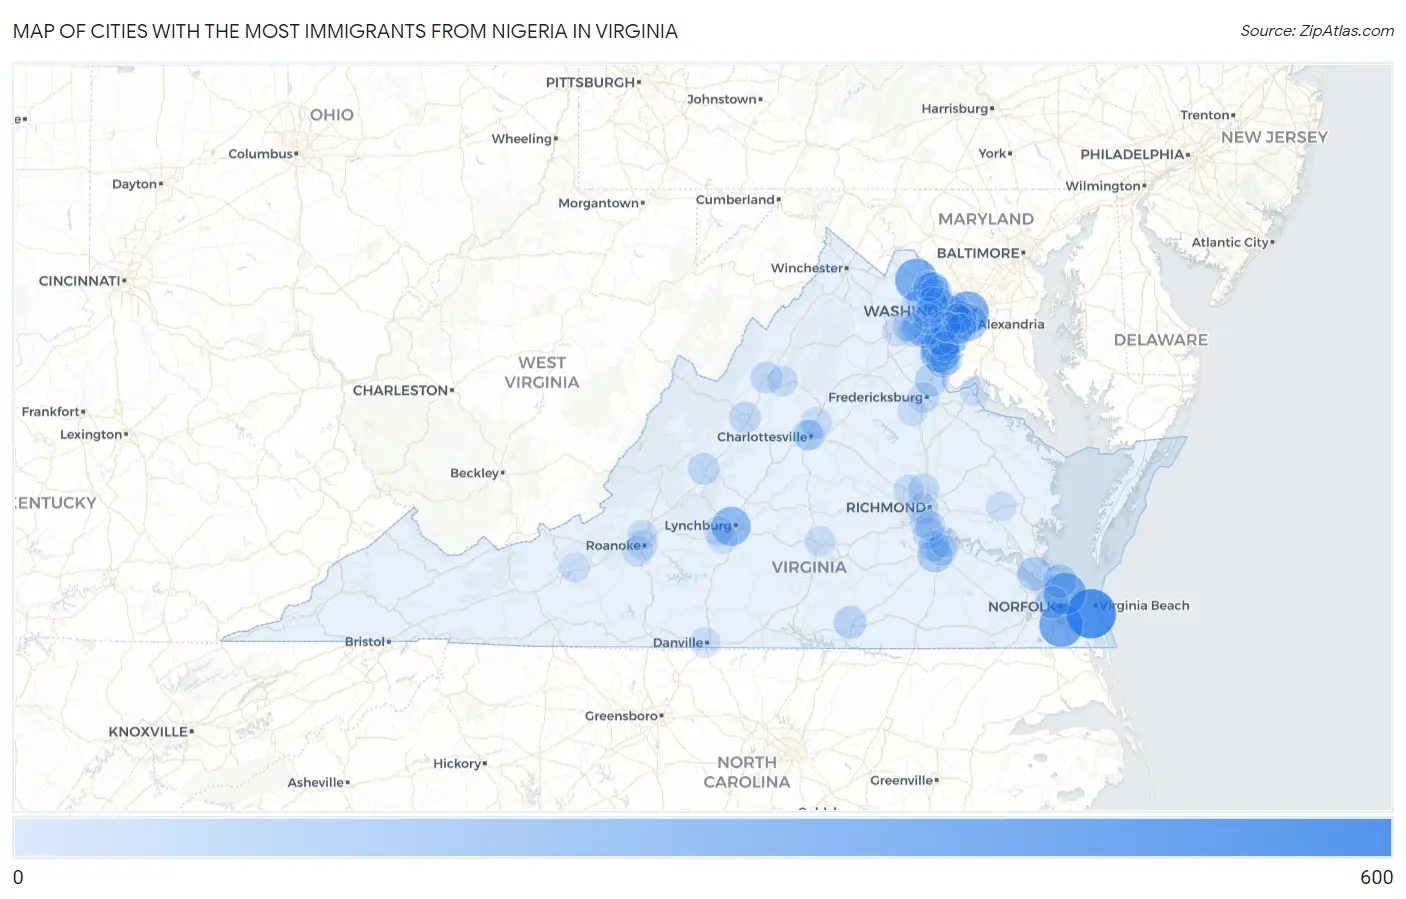
Map of Cities with the Most Immigrants from Nigeria in Virginia
0
600
Cities with the Most Immigrants from Nigeria in Virginia
| City | Nigeria | vs State | vs National | |
| 1. | Virginia Beach | 598 | 6,956(8.60%)#1 | 416,418(0.14%)#97 |
| 2. | Chesapeake | 424 | 6,956(6.10%)#2 | 416,418(0.10%)#149 |
| 3. | Leesburg | 378 | 6,956(5.43%)#3 | 416,418(0.09%)#162 |
| 4. | Arlington | 371 | 6,956(5.33%)#4 | 416,418(0.09%)#164 |
| 5. | Norfolk | 365 | 6,956(5.25%)#5 | 416,418(0.09%)#169 |
| 6. | Montclair | 281 | 6,956(4.04%)#6 | 416,418(0.07%)#221 |
| 7. | Lynchburg | 267 | 6,956(3.84%)#7 | 416,418(0.06%)#232 |
| 8. | Dale City | 230 | 6,956(3.31%)#8 | 416,418(0.06%)#270 |
| 9. | Dulles Town Center | 212 | 6,956(3.05%)#9 | 416,418(0.05%)#294 |
| 10. | Alexandria | 202 | 6,956(2.90%)#10 | 416,418(0.05%)#313 |
| 11. | Merrifield | 169 | 6,956(2.43%)#11 | 416,418(0.04%)#374 |
| 12. | Bull Run | 147 | 6,956(2.11%)#12 | 416,418(0.04%)#434 |
| 13. | Petersburg | 142 | 6,956(2.04%)#13 | 416,418(0.03%)#447 |
| 14. | Lake Ridge | 136 | 6,956(1.96%)#14 | 416,418(0.03%)#461 |
| 15. | Newport News | 119 | 6,956(1.71%)#15 | 416,418(0.03%)#519 |
| 16. | Hampton | 108 | 6,956(1.55%)#16 | 416,418(0.03%)#565 |
| 17. | Stafford Courthouse | 83 | 6,956(1.19%)#17 | 416,418(0.02%)#676 |
| 18. | South Hill | 83 | 6,956(1.19%)#18 | 416,418(0.02%)#677 |
| 19. | Triangle | 82 | 6,956(1.18%)#19 | 416,418(0.02%)#680 |
| 20. | Cherry Hill | 81 | 6,956(1.16%)#20 | 416,418(0.02%)#687 |
| 21. | Lincolnia | 78 | 6,956(1.12%)#21 | 416,418(0.02%)#703 |
| 22. | Portsmouth | 73 | 6,956(1.05%)#22 | 416,418(0.02%)#730 |
| 23. | Manassas Park | 59 | 6,956(0.85%)#23 | 416,418(0.01%)#850 |
| 24. | Kings Park West | 53 | 6,956(0.76%)#24 | 416,418(0.01%)#919 |
| 25. | Fort Lee | 53 | 6,956(0.76%)#25 | 416,418(0.01%)#922 |
| 26. | East Lexington | 52 | 6,956(0.75%)#26 | 416,418(0.01%)#937 |
| 27. | Chester | 50 | 6,956(0.72%)#27 | 416,418(0.01%)#955 |
| 28. | Staunton | 48 | 6,956(0.69%)#28 | 416,418(0.01%)#980 |
| 29. | Harrisonburg | 46 | 6,956(0.66%)#29 | 416,418(0.01%)#999 |
| 30. | Linton Hall | 45 | 6,956(0.65%)#30 | 416,418(0.01%)#1,012 |
| 31. | Sterling | 42 | 6,956(0.60%)#31 | 416,418(0.01%)#1,052 |
| 32. | Richmond | 41 | 6,956(0.59%)#32 | 416,418(0.01%)#1,063 |
| 33. | Laurel Hill | 37 | 6,956(0.53%)#33 | 416,418(0.01%)#1,128 |
| 34. | Manassas | 36 | 6,956(0.52%)#34 | 416,418(0.01%)#1,141 |
| 35. | Loudoun Valley Estates | 33 | 6,956(0.47%)#35 | 416,418(0.01%)#1,197 |
| 36. | Hollymead | 32 | 6,956(0.46%)#36 | 416,418(0.01%)#1,218 |
| 37. | Charlottesville | 27 | 6,956(0.39%)#37 | 416,418(0.01%)#1,300 |
| 38. | Colonial Heights | 27 | 6,956(0.39%)#38 | 416,418(0.01%)#1,304 |
| 39. | Countryside | 27 | 6,956(0.39%)#39 | 416,418(0.01%)#1,308 |
| 40. | Glen Allen | 26 | 6,956(0.37%)#40 | 416,418(0.01%)#1,324 |
| 41. | Short Pump | 25 | 6,956(0.36%)#41 | 416,418(0.01%)#1,344 |
| 42. | Fredericksburg | 25 | 6,956(0.36%)#42 | 416,418(0.01%)#1,345 |
| 43. | Franklin Farm | 25 | 6,956(0.36%)#43 | 416,418(0.01%)#1,350 |
| 44. | Lake Barcroft | 25 | 6,956(0.36%)#44 | 416,418(0.01%)#1,353 |
| 45. | University Of Virginia | 24 | 6,956(0.35%)#45 | 416,418(0.01%)#1,375 |
| 46. | Stone Ridge | 21 | 6,956(0.30%)#46 | 416,418(0.01%)#1,452 |
| 47. | Herndon | 20 | 6,956(0.29%)#47 | 416,418(0.00%)#1,475 |
| 48. | Meadowbrook | 20 | 6,956(0.29%)#48 | 416,418(0.00%)#1,476 |
| 49. | Cave Spring | 19 | 6,956(0.27%)#49 | 416,418(0.00%)#1,500 |
| 50. | Tysons | 18 | 6,956(0.26%)#50 | 416,418(0.00%)#1,531 |
| 51. | Sugarland Run | 18 | 6,956(0.26%)#51 | 416,418(0.00%)#1,539 |
| 52. | New Baltimore | 17 | 6,956(0.24%)#52 | 416,418(0.00%)#1,569 |
| 53. | Massanutten | 16 | 6,956(0.23%)#53 | 416,418(0.00%)#1,609 |
| 54. | Reston | 15 | 6,956(0.22%)#54 | 416,418(0.00%)#1,618 |
| 55. | Mcnair | 15 | 6,956(0.22%)#55 | 416,418(0.00%)#1,630 |
| 56. | County Center | 15 | 6,956(0.22%)#56 | 416,418(0.00%)#1,643 |
| 57. | Timberlake | 14 | 6,956(0.20%)#57 | 416,418(0.00%)#1,679 |
| 58. | Centreville | 11 | 6,956(0.16%)#58 | 416,418(0.00%)#1,765 |
| 59. | Burke | 11 | 6,956(0.16%)#59 | 416,418(0.00%)#1,768 |
| 60. | Danville | 11 | 6,956(0.16%)#60 | 416,418(0.00%)#1,770 |
| 61. | Hopewell | 11 | 6,956(0.16%)#61 | 416,418(0.00%)#1,785 |
| 62. | Chantilly | 10 | 6,956(0.14%)#62 | 416,418(0.00%)#1,833 |
| 63. | Farmville | 10 | 6,956(0.14%)#63 | 416,418(0.00%)#1,849 |
| 64. | University Center | 10 | 6,956(0.14%)#64 | 416,418(0.00%)#1,854 |
| 65. | Springfield | 8 | 6,956(0.12%)#65 | 416,418(0.00%)#1,926 |
| 66. | Bellwood | 8 | 6,956(0.12%)#66 | 416,418(0.00%)#1,948 |
| 67. | Spotsylvania Courthouse | 8 | 6,956(0.12%)#67 | 416,418(0.00%)#1,950 |
| 68. | Roanoke | 7 | 6,956(0.10%)#68 | 416,418(0.00%)#1,964 |
| 69. | Annandale | 7 | 6,956(0.10%)#69 | 416,418(0.00%)#1,970 |
| 70. | Leesylvania | 7 | 6,956(0.10%)#70 | 416,418(0.00%)#1,981 |
| 71. | Gainesville | 7 | 6,956(0.10%)#71 | 416,418(0.00%)#1,987 |
| 72. | Hollins | 7 | 6,956(0.10%)#72 | 416,418(0.00%)#1,989 |
| 73. | Potomac Mills | 7 | 6,956(0.10%)#73 | 416,418(0.00%)#2,002 |
| 74. | Burke Centre | 6 | 6,956(0.09%)#74 | 416,418(0.00%)#2,039 |
| 75. | Franconia | 5 | 6,956(0.07%)#75 | 416,418(0.00%)#2,067 |
| 76. | Forest | 5 | 6,956(0.07%)#76 | 416,418(0.00%)#2,072 |
| 77. | Radford | 4 | 6,956(0.06%)#77 | 416,418(0.00%)#2,101 |
| 78. | West Point | 4 | 6,956(0.06%)#78 | 416,418(0.00%)#2,114 |
| 79. | Dahlgren Center | 3 | 6,956(0.04%)#79 | 416,418(0.00%)#2,163 |
Common Questions
What are the Top 10 Cities with the Most Immigrants from Nigeria in Virginia?
Top 10 Cities with the Most Immigrants from Nigeria in Virginia are:
#1
598
#2
424
#3
378
#4
371
#5
365
#6
281
#7
267
#8
230
#9
212
#10
202
What city has the Most Immigrants from Nigeria in Virginia?
Virginia Beach has the Most Immigrants from Nigeria in Virginia with 598.
What is the Total Immigrants from Nigeria in the State of Virginia?
Total Immigrants from Nigeria in Virginia is 6,956.
What is the Total Immigrants from Nigeria in the United States?
Total Immigrants from Nigeria in the United States is 416,418.