Dulles Town Center, VA
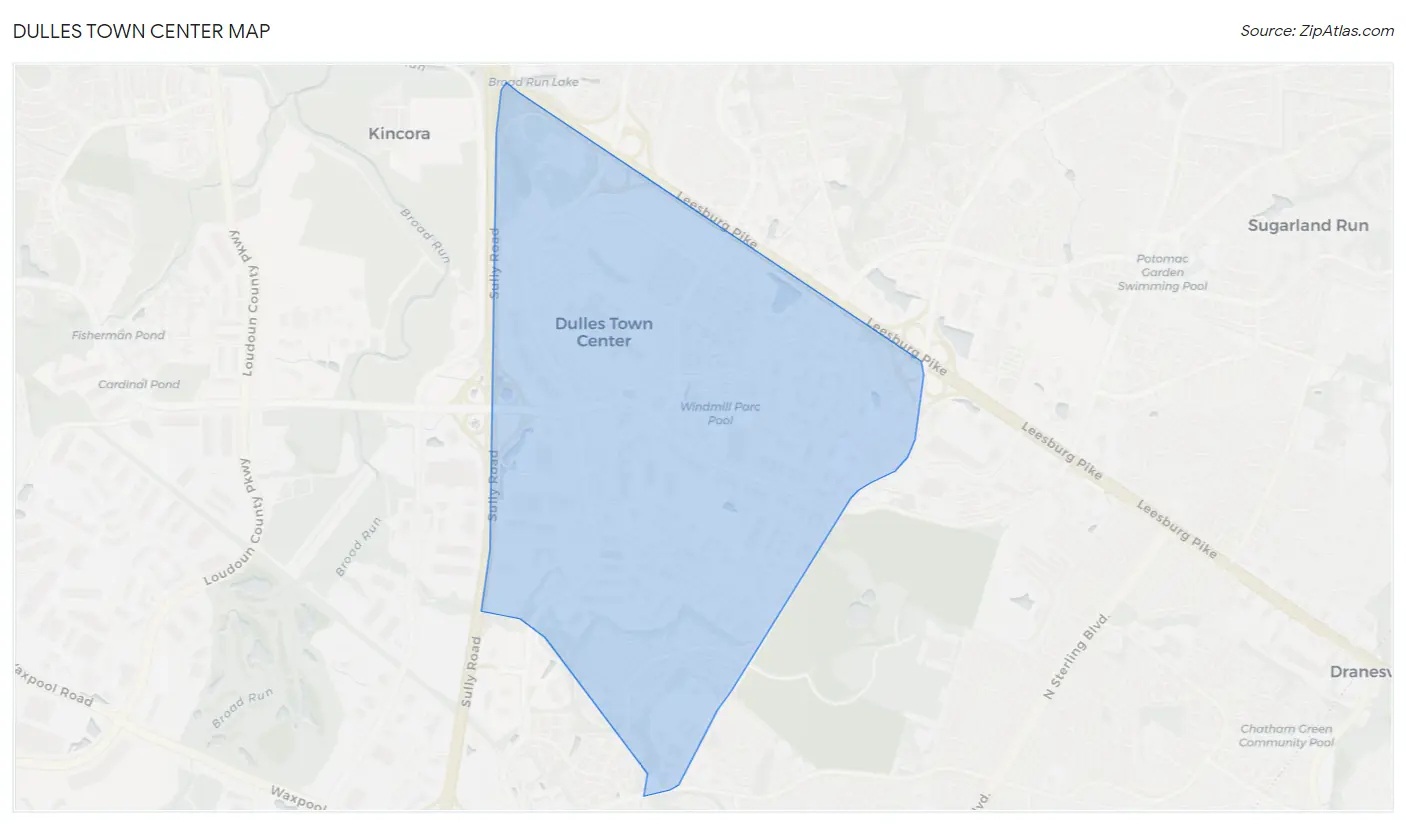
Dulles Town Center Map
Dulles Town Center Overview
5,884
TOTAL POPULATION
3,109
MALE POPULATION
2,775
FEMALE POPULATION
112.04
MALES / 100 FEMALES
89.26
FEMALES / 100 MALES
34.7
MEDIAN AGE
3.1
AVG FAMILY SIZE
2.6
AVG HOUSEHOLD SIZE
$50,758
PER CAPITA INCOME
$118,528
AVG FAMILY INCOME
$114,034
AVG HOUSEHOLD INCOME
12.3%
WAGE / INCOME GAP [ % ]
87.7¢/ $1
WAGE / INCOME GAP [ $ ]
0.41
INEQUALITY / GINI INDEX
3,879
LABOR FORCE [ PEOPLE ]
83.0%
PERCENT IN LABOR FORCE
4.1%
UNEMPLOYMENT RATE
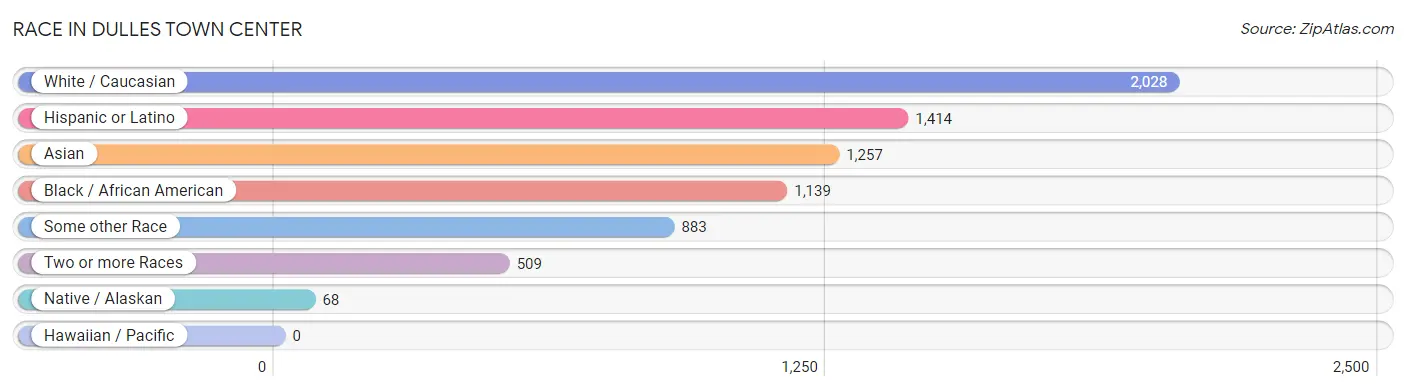
Race in Dulles Town Center
The most populous races in Dulles Town Center are White / Caucasian (2,028 | 34.5%), Hispanic or Latino (1,414 | 24.0%), and Asian (1,257 | 21.4%).
| Race | # Population | % Population |
| Asian | 1,257 | 21.4% |
| Black / African American | 1,139 | 19.4% |
| Hawaiian / Pacific | 0 | 0.0% |
| Hispanic or Latino | 1,414 | 24.0% |
| Native / Alaskan | 68 | 1.2% |
| White / Caucasian | 2,028 | 34.5% |
| Two or more Races | 509 | 8.6% |
| Some other Race | 883 | 15.0% |
| Total | 5,884 | 100.0% |
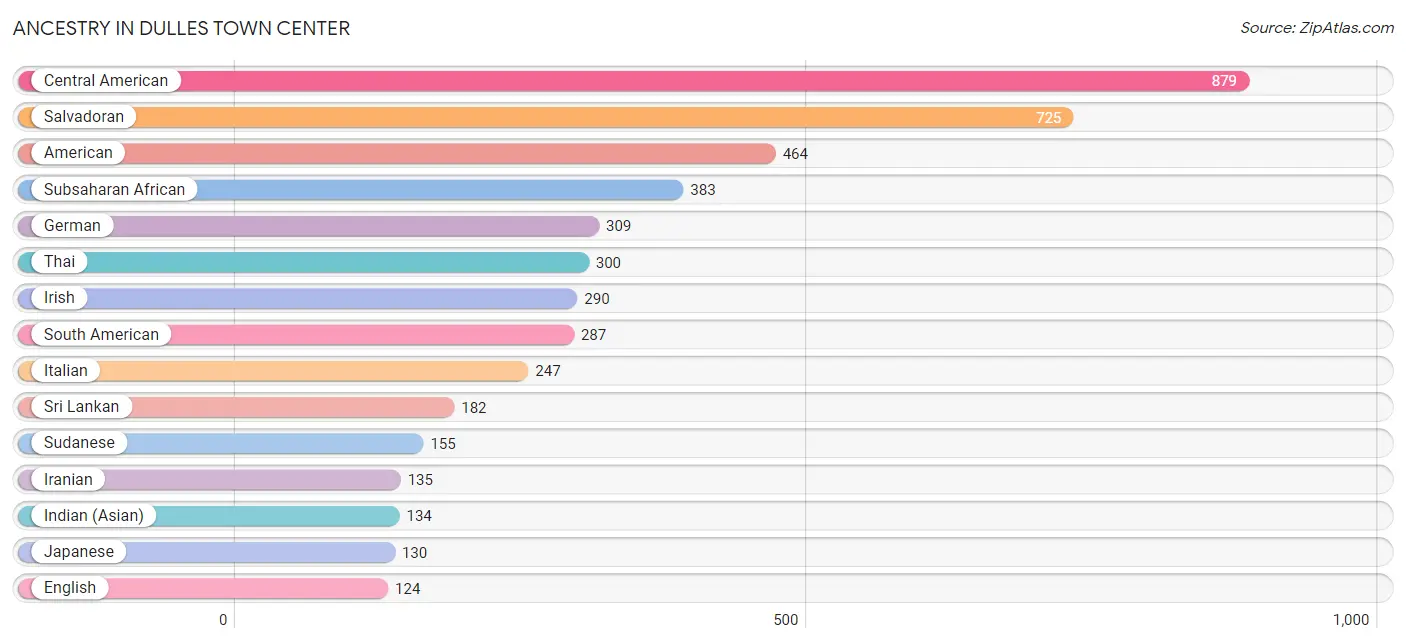
Ancestry in Dulles Town Center
The most populous ancestries reported in Dulles Town Center are Central American (879 | 14.9%), Salvadoran (725 | 12.3%), American (464 | 7.9%), Subsaharan African (383 | 6.5%), and German (309 | 5.2%), together accounting for 46.9% of all Dulles Town Center residents.
| Ancestry | # Population | % Population |
| Afghan | 84 | 1.4% |
| African | 25 | 0.4% |
| Albanian | 121 | 2.1% |
| American | 464 | 7.9% |
| Arab | 17 | 0.3% |
| Argentinean | 55 | 0.9% |
| Bhutanese | 30 | 0.5% |
| Bolivian | 22 | 0.4% |
| Brazilian | 40 | 0.7% |
| British | 78 | 1.3% |
| Burmese | 58 | 1.0% |
| Central American | 879 | 14.9% |
| Colombian | 100 | 1.7% |
| Costa Rican | 31 | 0.5% |
| Dominican | 7 | 0.1% |
| Dutch | 16 | 0.3% |
| Egyptian | 17 | 0.3% |
| English | 124 | 2.1% |
| Ethiopian | 13 | 0.2% |
| European | 45 | 0.8% |
| French | 43 | 0.7% |
| German | 309 | 5.2% |
| Ghanaian | 52 | 0.9% |
| Greek | 6 | 0.1% |
| Honduran | 31 | 0.5% |
| Hungarian | 87 | 1.5% |
| Indian (Asian) | 134 | 2.3% |
| Iranian | 135 | 2.3% |
| Irish | 290 | 4.9% |
| Italian | 247 | 4.2% |
| Japanese | 130 | 2.2% |
| Kenyan | 21 | 0.4% |
| Korean | 114 | 1.9% |
| Laotian | 8 | 0.1% |
| Lithuanian | 19 | 0.3% |
| Mexican | 51 | 0.9% |
| Native Hawaiian | 27 | 0.5% |
| Nicaraguan | 33 | 0.6% |
| Nigerian | 117 | 2.0% |
| Norwegian | 10 | 0.2% |
| Panamanian | 59 | 1.0% |
| Peruvian | 103 | 1.8% |
| Polish | 66 | 1.1% |
| Portuguese | 30 | 0.5% |
| Puerto Rican | 100 | 1.7% |
| Salvadoran | 725 | 12.3% |
| Scotch-Irish | 32 | 0.5% |
| Scottish | 33 | 0.6% |
| Slovak | 10 | 0.2% |
| South American | 287 | 4.9% |
| Spanish | 21 | 0.4% |
| Sri Lankan | 182 | 3.1% |
| Subsaharan African | 383 | 6.5% |
| Sudanese | 155 | 2.6% |
| Swedish | 71 | 1.2% |
| Thai | 300 | 5.1% |
| Trinidadian and Tobagonian | 6 | 0.1% |
| Turkish | 14 | 0.2% |
| Venezuelan | 7 | 0.1% |
| Vietnamese | 66 | 1.1% |
| Welsh | 60 | 1.0% |
| West Indian | 19 | 0.3% | View All 62 Rows |
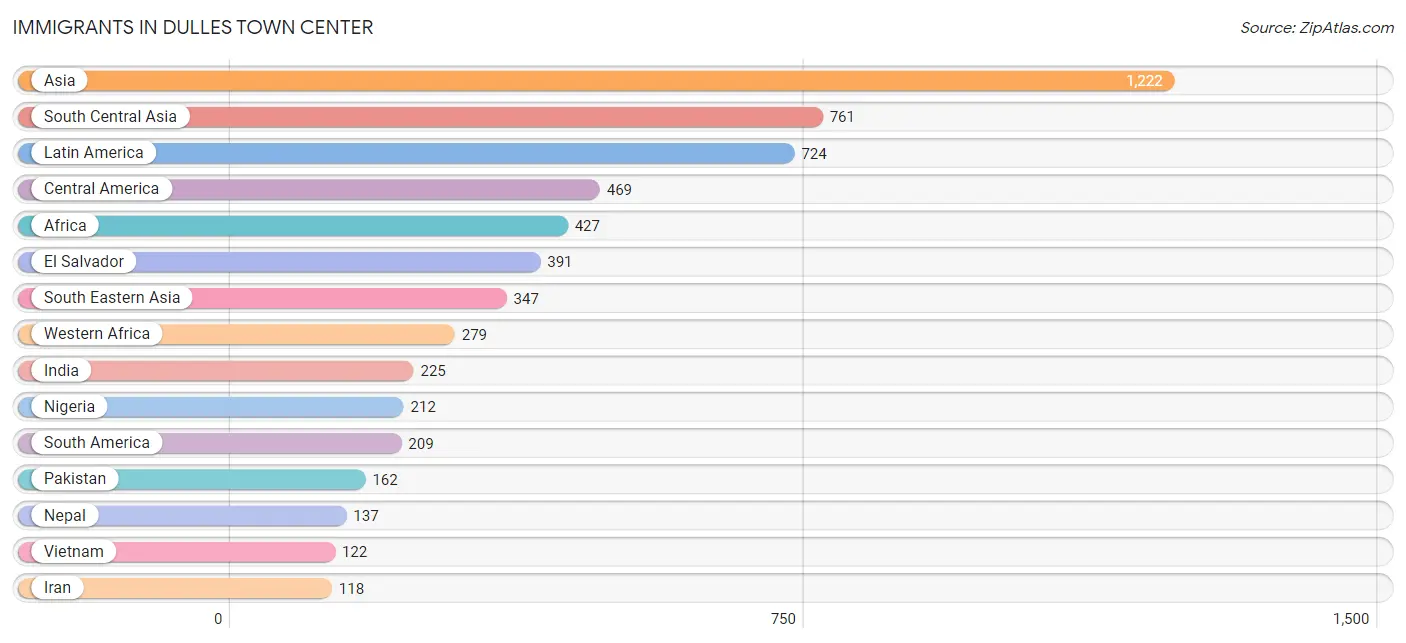
Immigrants in Dulles Town Center
The most numerous immigrant groups reported in Dulles Town Center came from Asia (1,222 | 20.8%), South Central Asia (761 | 12.9%), Latin America (724 | 12.3%), Central America (469 | 8.0%), and Africa (427 | 7.3%), together accounting for 61.2% of all Dulles Town Center residents.
| Immigration Origin | # Population | % Population |
| Afghanistan | 84 | 1.4% |
| Africa | 427 | 7.3% |
| Albania | 53 | 0.9% |
| Asia | 1,222 | 20.8% |
| Bangladesh | 35 | 0.6% |
| Bolivia | 40 | 0.7% |
| Brazil | 26 | 0.4% |
| Cambodia | 94 | 1.6% |
| Caribbean | 46 | 0.8% |
| Central America | 469 | 8.0% |
| Colombia | 60 | 1.0% |
| Dominican Republic | 7 | 0.1% |
| Eastern Africa | 51 | 0.9% |
| Eastern Asia | 15 | 0.3% |
| Eastern Europe | 76 | 1.3% |
| Egypt | 10 | 0.2% |
| El Salvador | 391 | 6.7% |
| Ethiopia | 23 | 0.4% |
| Europe | 101 | 1.7% |
| Germany | 15 | 0.3% |
| Ghana | 67 | 1.1% |
| Honduras | 31 | 0.5% |
| India | 225 | 3.8% |
| Iran | 118 | 2.0% |
| Iraq | 51 | 0.9% |
| Jamaica | 33 | 0.6% |
| Japan | 3 | 0.1% |
| Jordan | 8 | 0.1% |
| Kenya | 21 | 0.4% |
| Korea | 12 | 0.2% |
| Latin America | 724 | 12.3% |
| Mexico | 9 | 0.2% |
| Nepal | 137 | 2.3% |
| Nigeria | 212 | 3.6% |
| Northern Africa | 97 | 1.7% |
| Pakistan | 162 | 2.8% |
| Panama | 38 | 0.6% |
| Peru | 76 | 1.3% |
| Philippines | 103 | 1.8% |
| Poland | 11 | 0.2% |
| Portugal | 10 | 0.2% |
| Saudi Arabia | 26 | 0.4% |
| South America | 209 | 3.5% |
| South Central Asia | 761 | 12.9% |
| South Eastern Asia | 347 | 5.9% |
| Southern Europe | 10 | 0.2% |
| Sudan | 87 | 1.5% |
| Thailand | 14 | 0.2% |
| Trinidad and Tobago | 6 | 0.1% |
| Turkey | 14 | 0.2% |
| Uganda | 7 | 0.1% |
| Venezuela | 7 | 0.1% |
| Vietnam | 122 | 2.1% |
| Western Africa | 279 | 4.7% |
| Western Asia | 99 | 1.7% |
| Western Europe | 15 | 0.3% | View All 56 Rows |
Sex and Age in Dulles Town Center
Sex and Age in Dulles Town Center
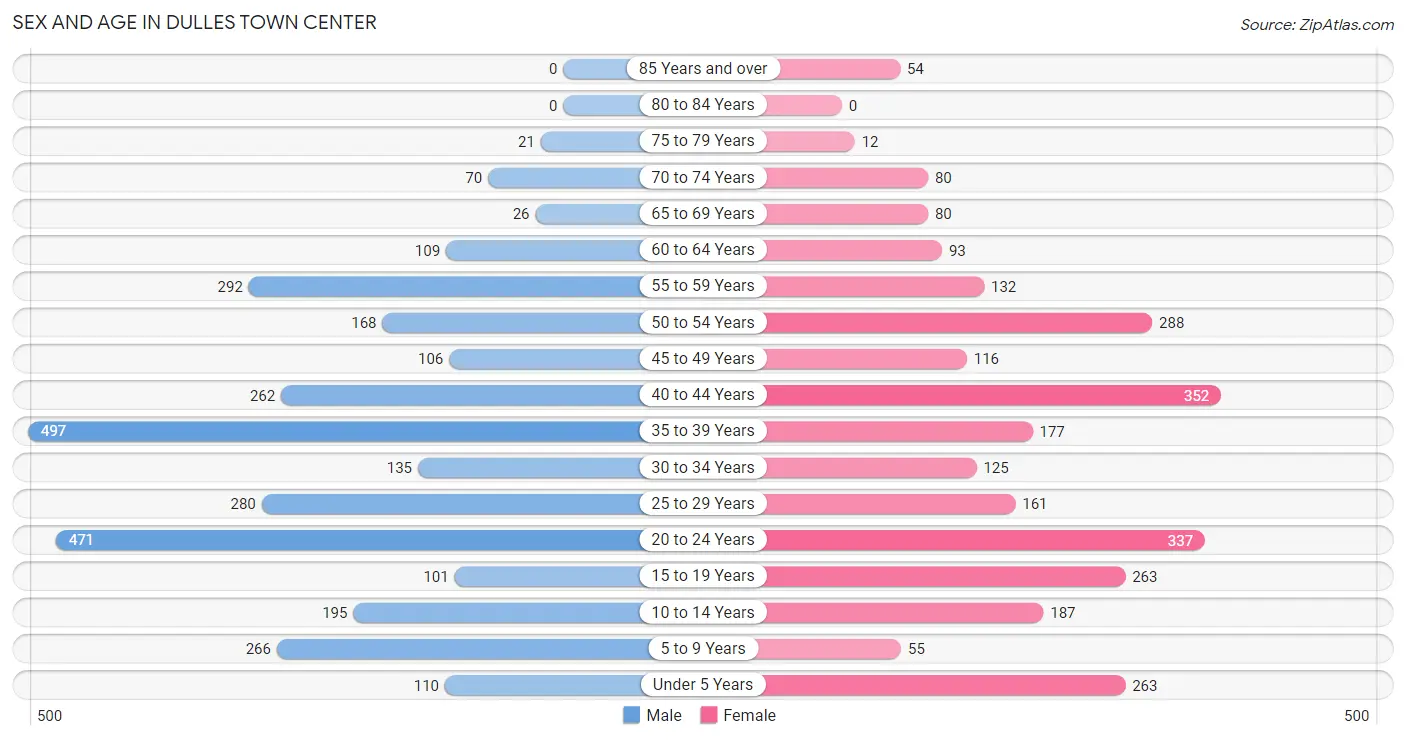
The most populous age groups in Dulles Town Center are 35 to 39 Years (497 | 16.0%) for men and 40 to 44 Years (352 | 12.7%) for women.
| Age Bracket | Male | Female |
| Under 5 Years | 110 (3.5%) | 263 (9.5%) |
| 5 to 9 Years | 266 (8.6%) | 55 (2.0%) |
| 10 to 14 Years | 195 (6.3%) | 187 (6.7%) |
| 15 to 19 Years | 101 (3.3%) | 263 (9.5%) |
| 20 to 24 Years | 471 (15.1%) | 337 (12.1%) |
| 25 to 29 Years | 280 (9.0%) | 161 (5.8%) |
| 30 to 34 Years | 135 (4.3%) | 125 (4.5%) |
| 35 to 39 Years | 497 (16.0%) | 177 (6.4%) |
| 40 to 44 Years | 262 (8.4%) | 352 (12.7%) |
| 45 to 49 Years | 106 (3.4%) | 116 (4.2%) |
| 50 to 54 Years | 168 (5.4%) | 288 (10.4%) |
| 55 to 59 Years | 292 (9.4%) | 132 (4.8%) |
| 60 to 64 Years | 109 (3.5%) | 93 (3.4%) |
| 65 to 69 Years | 26 (0.8%) | 80 (2.9%) |
| 70 to 74 Years | 70 (2.2%) | 80 (2.9%) |
| 75 to 79 Years | 21 (0.7%) | 12 (0.4%) |
| 80 to 84 Years | 0 (0.0%) | 0 (0.0%) |
| 85 Years and over | 0 (0.0%) | 54 (1.9%) |
| Total | 3,109 (100.0%) | 2,775 (100.0%) |
Families and Households in Dulles Town Center
Median Family Size in Dulles Town Center
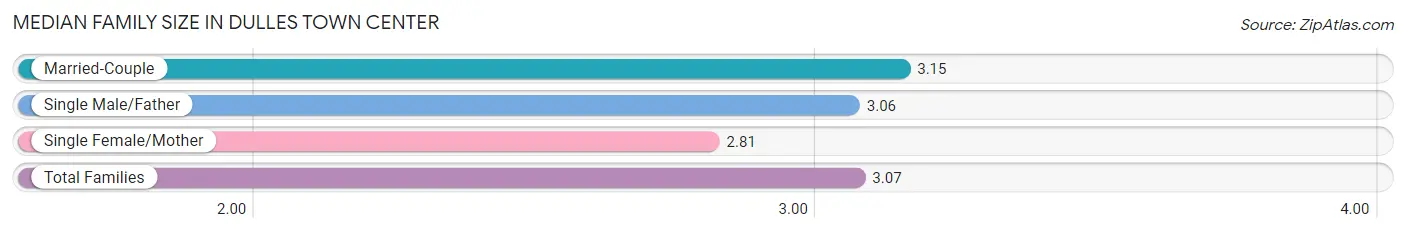
The median family size in Dulles Town Center is 3.07 persons per family, with married-couple families (1,041 | 67.5%) accounting for the largest median family size of 3.15 persons per family. On the other hand, single female/mother families (279 | 18.1%) represent the smallest median family size with 2.81 persons per family.
| Family Type | # Families | Family Size |
| Married-Couple | 1,041 (67.5%) | 3.15 |
| Single Male/Father | 223 (14.4%) | 3.06 |
| Single Female/Mother | 279 (18.1%) | 2.81 |
| Total Families | 1,543 (100.0%) | 3.07 |
Median Household Size in Dulles Town Center
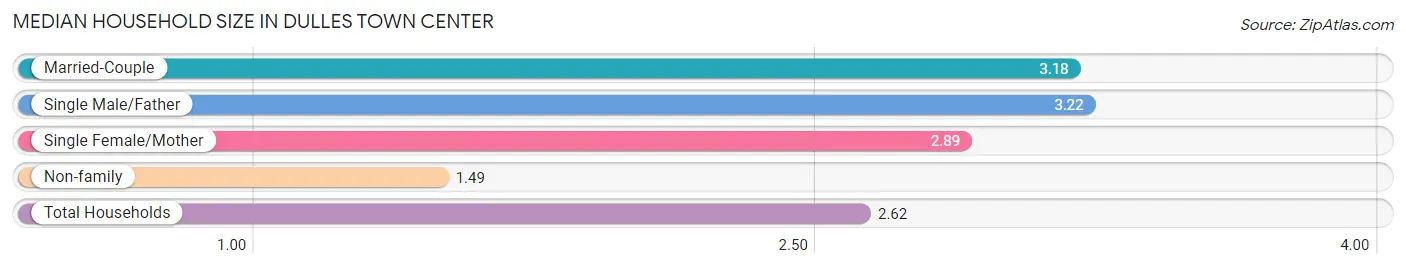
The median household size in Dulles Town Center is 2.62 persons per household, with single male/father households (223 | 9.9%) accounting for the largest median household size of 3.22 persons per household. non-family households (704 | 31.3%) represent the smallest median household size with 1.49 persons per household.
| Household Type | # Households | Household Size |
| Married-Couple | 1,041 (46.3%) | 3.18 |
| Single Male/Father | 223 (9.9%) | 3.22 |
| Single Female/Mother | 279 (12.4%) | 2.89 |
| Non-family | 704 (31.3%) | 1.49 |
| Total Households | 2,247 (100.0%) | 2.62 |
Household Size by Marriage Status in Dulles Town Center
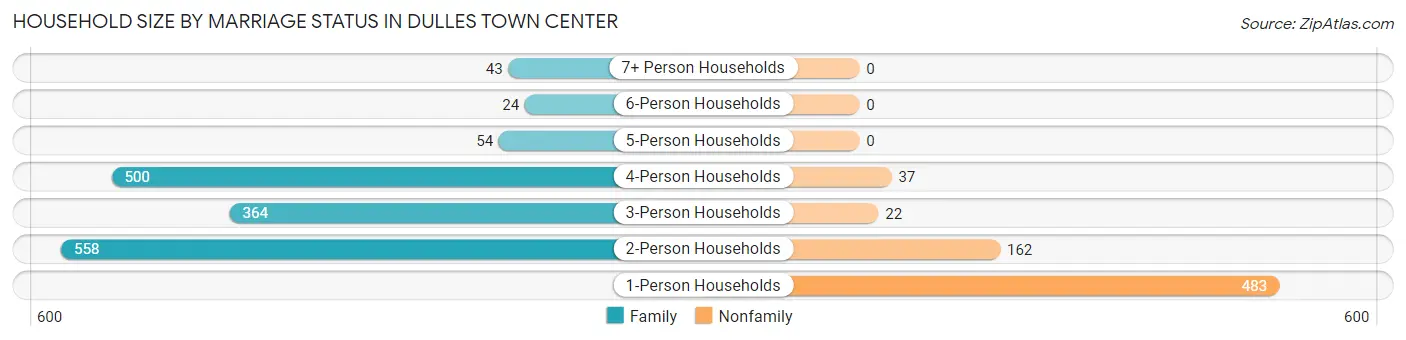
Out of a total of 2,247 households in Dulles Town Center, 1,543 (68.7%) are family households, while 704 (31.3%) are nonfamily households. The most numerous type of family households are 2-person households, comprising 558, and the most common type of nonfamily households are 1-person households, comprising 483.
| Household Size | Family Households | Nonfamily Households |
| 1-Person Households | - | 483 (21.5%) |
| 2-Person Households | 558 (24.8%) | 162 (7.2%) |
| 3-Person Households | 364 (16.2%) | 22 (1.0%) |
| 4-Person Households | 500 (22.3%) | 37 (1.7%) |
| 5-Person Households | 54 (2.4%) | 0 (0.0%) |
| 6-Person Households | 24 (1.1%) | 0 (0.0%) |
| 7+ Person Households | 43 (1.9%) | 0 (0.0%) |
| Total | 1,543 (68.7%) | 704 (31.3%) |
Female Fertility in Dulles Town Center
Fertility by Age in Dulles Town Center
Average fertility rate in Dulles Town Center is 12.0 births per 1,000 women. Women in the age bracket of 35 to 50 years have the highest fertility rate with 15.0 births per 1,000 women. Women in the age bracket of 35 to 50 years acount for 55.0% of all women with births.
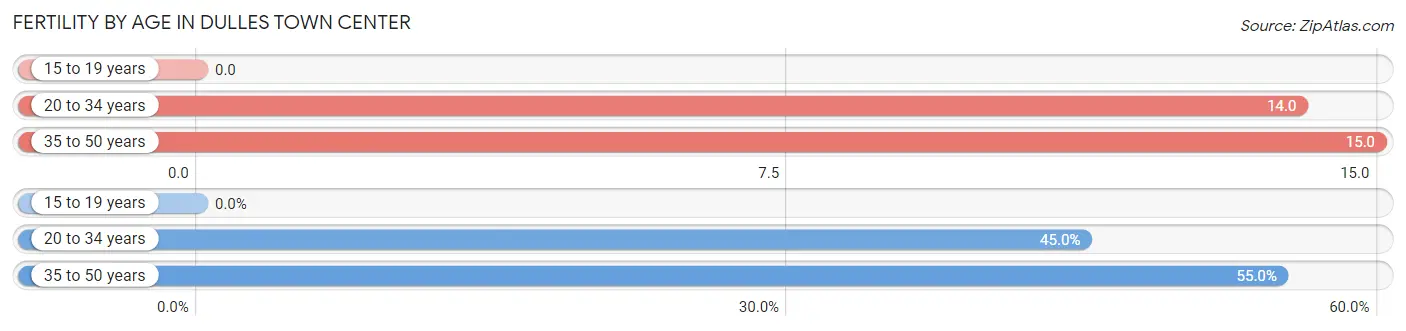
| Age Bracket | Women with Births | Births / 1,000 Women |
| 15 to 19 years | 0 (0.0%) | 0.0 |
| 20 to 34 years | 9 (45.0%) | 14.0 |
| 35 to 50 years | 11 (55.0%) | 15.0 |
| Total | 20 (100.0%) | 12.0 |
Fertility by Age by Marriage Status in Dulles Town Center
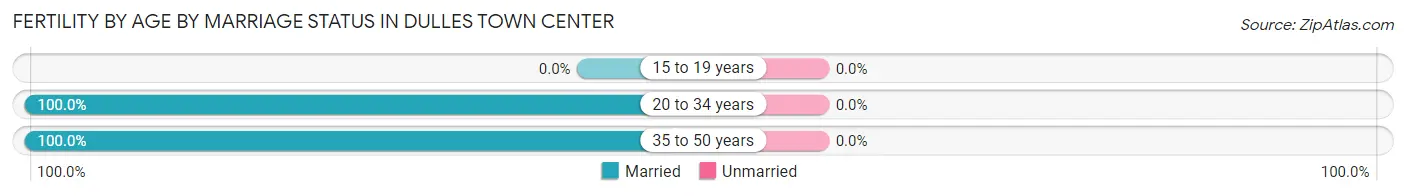
| Age Bracket | Married | Unmarried |
| 15 to 19 years | 0 (0.0%) | 0 (0.0%) |
| 20 to 34 years | 9 (100.0%) | 0 (0.0%) |
| 35 to 50 years | 11 (100.0%) | 0 (0.0%) |
| Total | 20 (100.0%) | 0 (0.0%) |
Fertility by Education in Dulles Town Center
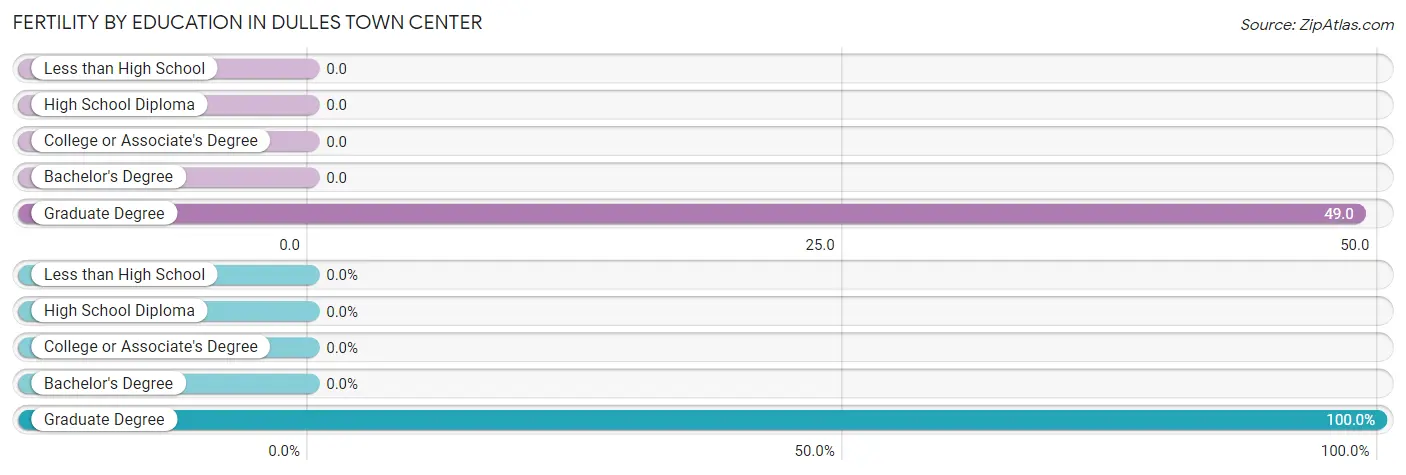
| Educational Attainment | Women with Births | Births / 1,000 Women |
| Less than High School | 0 (0.0%) | 0.0 |
| High School Diploma | 0 (0.0%) | 0.0 |
| College or Associate's Degree | 0 (0.0%) | 0.0 |
| Bachelor's Degree | 0 (0.0%) | 0.0 |
| Graduate Degree | 20 (100.0%) | 49.0 |
| Total | 20 (100.0%) | 12.0 |
Fertility by Education by Marriage Status in Dulles Town Center
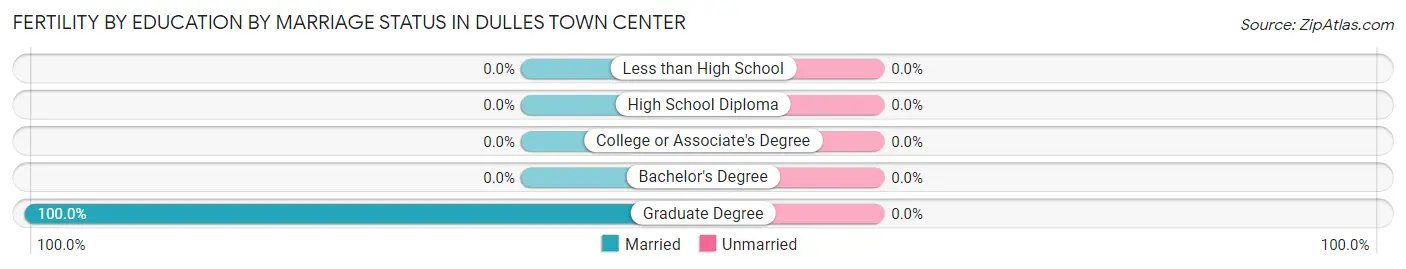
| Educational Attainment | Married | Unmarried |
| Less than High School | 0 (0.0%) | 0 (0.0%) |
| High School Diploma | 0 (0.0%) | 0 (0.0%) |
| College or Associate's Degree | 0 (0.0%) | 0 (0.0%) |
| Bachelor's Degree | 0 (0.0%) | 0 (0.0%) |
| Graduate Degree | 20 (100.0%) | 0 (0.0%) |
| Total | 20 (100.0%) | 0 (0.0%) |
Income in Dulles Town Center
Income Overview in Dulles Town Center
Per Capita Income in Dulles Town Center is $50,758, while median incomes of families and households are $118,528 and $114,034 respectively.
| Characteristic | Number | Measure |
| Per Capita Income | 5,884 | $50,758 |
| Median Family Income | 1,543 | $118,528 |
| Mean Family Income | 1,543 | $128,173 |
| Median Household Income | 2,247 | $114,034 |
| Mean Household Income | 2,247 | $130,253 |
| Income Deficit | 1,543 | $0 |
| Wage / Income Gap (%) | 5,884 | 12.32% |
| Wage / Income Gap ($) | 5,884 | 87.68¢ per $1 |
| Gini / Inequality Index | 5,884 | 0.41 |
Earnings by Sex in Dulles Town Center
Average Earnings in Dulles Town Center are $58,318, $59,683 for men and $52,332 for women, a difference of 12.3%.
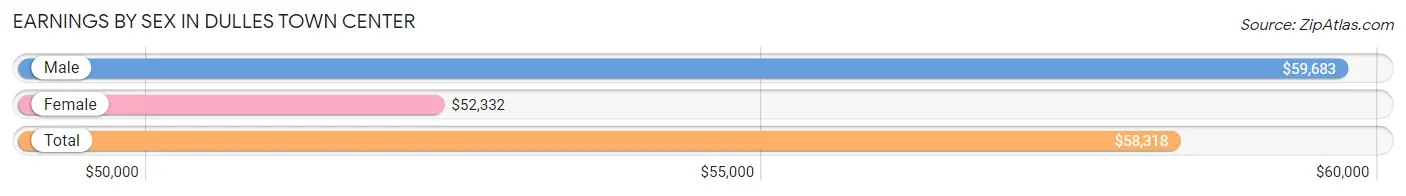
| Sex | Number | Average Earnings |
| Male | 2,268 (58.7%) | $59,683 |
| Female | 1,595 (41.3%) | $52,332 |
| Total | 3,863 (100.0%) | $58,318 |
Earnings by Sex by Income Bracket in Dulles Town Center
The most common earnings brackets in Dulles Town Center are $100,000+ for men (711 | 31.4%) and $100,000+ for women (365 | 22.9%).
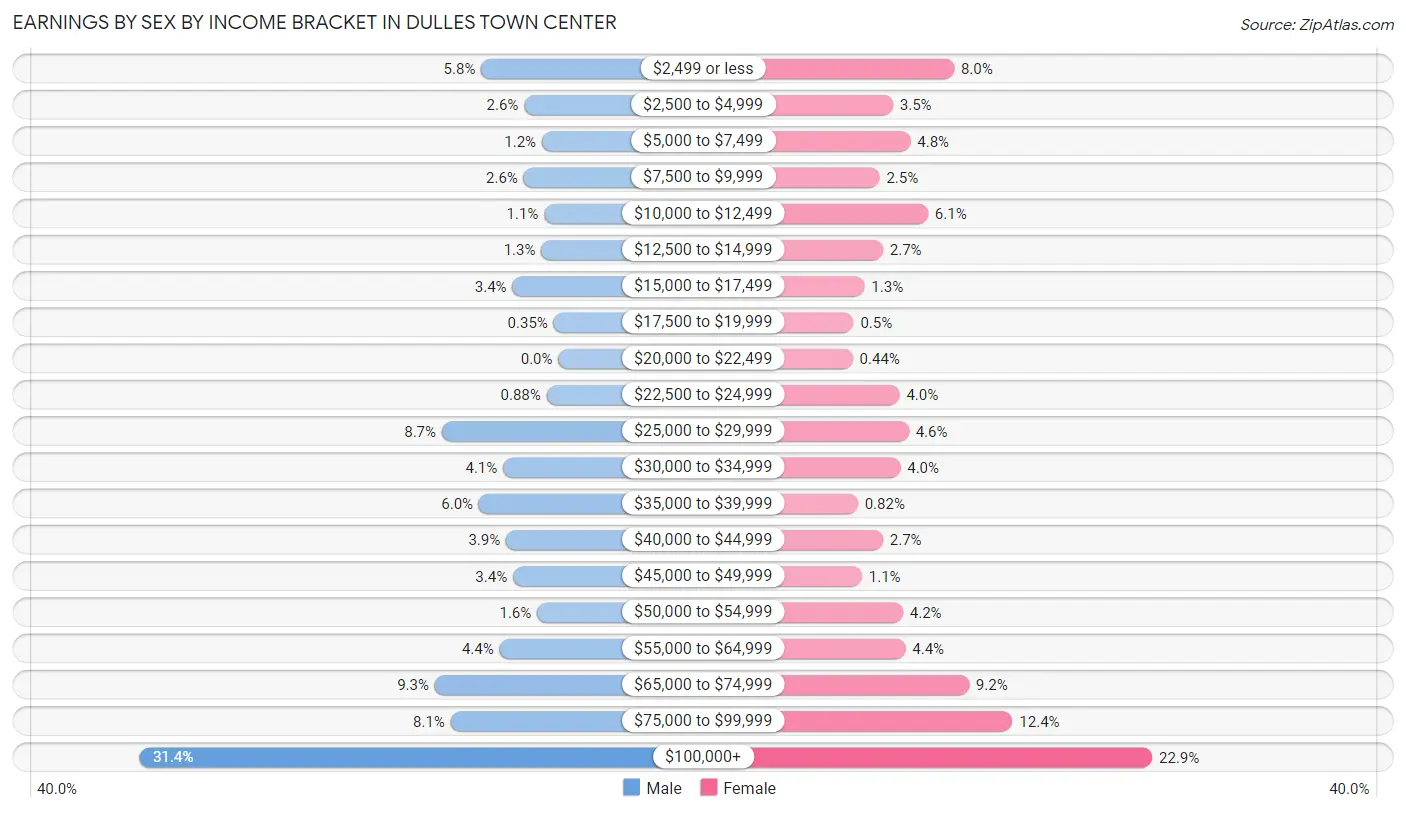
| Income | Male | Female |
| $2,499 or less | 131 (5.8%) | 128 (8.0%) |
| $2,500 to $4,999 | 58 (2.6%) | 55 (3.5%) |
| $5,000 to $7,499 | 28 (1.2%) | 76 (4.8%) |
| $7,500 to $9,999 | 59 (2.6%) | 39 (2.5%) |
| $10,000 to $12,499 | 24 (1.1%) | 97 (6.1%) |
| $12,500 to $14,999 | 29 (1.3%) | 43 (2.7%) |
| $15,000 to $17,499 | 78 (3.4%) | 21 (1.3%) |
| $17,500 to $19,999 | 8 (0.4%) | 8 (0.5%) |
| $20,000 to $22,499 | 0 (0.0%) | 7 (0.4%) |
| $22,500 to $24,999 | 20 (0.9%) | 63 (4.0%) |
| $25,000 to $29,999 | 198 (8.7%) | 74 (4.6%) |
| $30,000 to $34,999 | 94 (4.1%) | 64 (4.0%) |
| $35,000 to $39,999 | 135 (5.9%) | 13 (0.8%) |
| $40,000 to $44,999 | 89 (3.9%) | 43 (2.7%) |
| $45,000 to $49,999 | 77 (3.4%) | 18 (1.1%) |
| $50,000 to $54,999 | 36 (1.6%) | 67 (4.2%) |
| $55,000 to $64,999 | 100 (4.4%) | 70 (4.4%) |
| $65,000 to $74,999 | 210 (9.3%) | 146 (9.1%) |
| $75,000 to $99,999 | 183 (8.1%) | 198 (12.4%) |
| $100,000+ | 711 (31.4%) | 365 (22.9%) |
| Total | 2,268 (100.0%) | 1,595 (100.0%) |
Earnings by Sex by Educational Attainment in Dulles Town Center
Average earnings in Dulles Town Center are $68,438 for men and $59,657 for women, a difference of 12.8%. Men with an educational attainment of graduate degree enjoy the highest average annual earnings of $120,268, while those with high school diploma education earn the least with $42,656. Women with an educational attainment of bachelor's degree earn the most with the average annual earnings of $84,432, while those with less than high school education have the smallest earnings of $22,778.
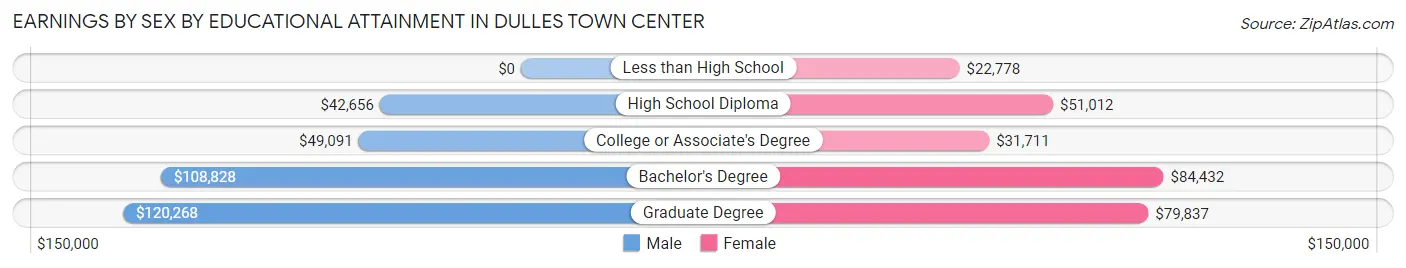
| Educational Attainment | Male Income | Female Income |
| Less than High School | - | - |
| High School Diploma | $42,656 | $51,012 |
| College or Associate's Degree | $49,091 | $31,711 |
| Bachelor's Degree | $108,828 | $84,432 |
| Graduate Degree | $120,268 | $79,837 |
| Total | $68,438 | $59,657 |
Family Income in Dulles Town Center
Family Income Brackets in Dulles Town Center
According to the Dulles Town Center family income data, there are 347 families falling into the $150,000 to $199,999 income range, which is the most common income bracket and makes up 22.5% of all families. Conversely, the less than $10,000 income bracket is the least frequent group with only 22 families (1.4%) belonging to this category.
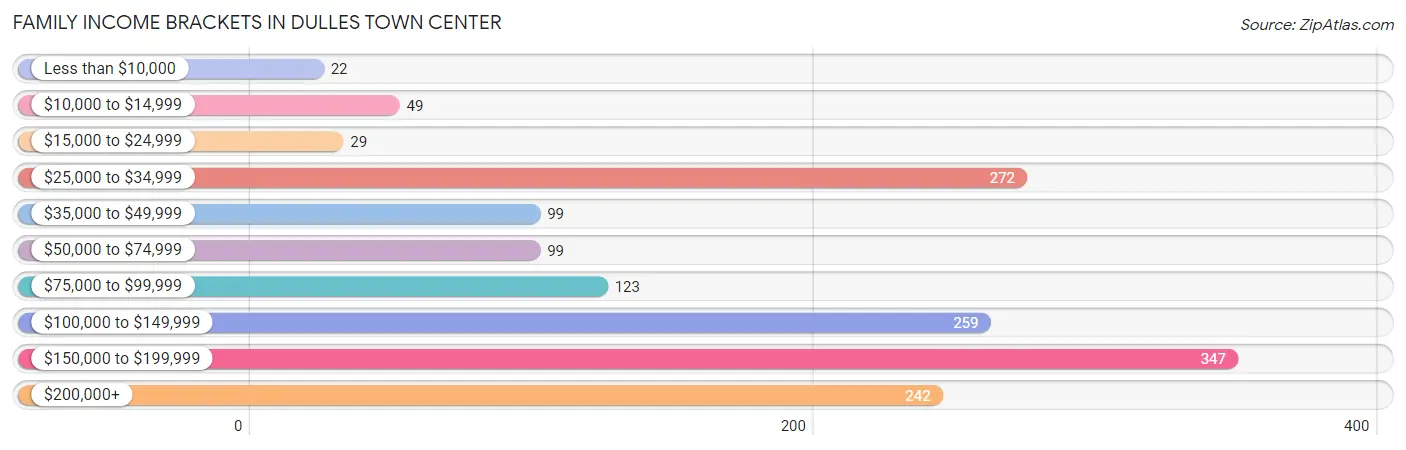
| Income Bracket | # Families | % Families |
| Less than $10,000 | 22 | 1.4% |
| $10,000 to $14,999 | 49 | 3.2% |
| $15,000 to $24,999 | 29 | 1.9% |
| $25,000 to $34,999 | 272 | 17.6% |
| $35,000 to $49,999 | 99 | 6.4% |
| $50,000 to $74,999 | 99 | 6.4% |
| $75,000 to $99,999 | 123 | 8.0% |
| $100,000 to $149,999 | 259 | 16.8% |
| $150,000 to $199,999 | 347 | 22.5% |
| $200,000+ | 242 | 15.7% |
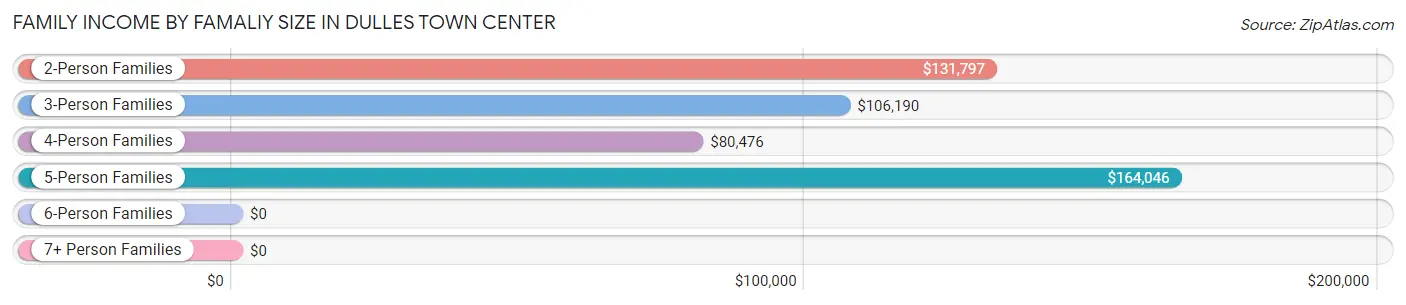
Family Income by Famaliy Size in Dulles Town Center
5-person families (47 | 3.0%) account for the highest median family income in Dulles Town Center with $164,046 per family, while 2-person families (611 | 39.6%) have the highest median income of $65,898 per family member.
| Income Bracket | # Families | Median Income |
| 2-Person Families | 611 (39.6%) | $131,797 |
| 3-Person Families | 326 (21.1%) | $106,190 |
| 4-Person Families | 496 (32.2%) | $80,476 |
| 5-Person Families | 47 (3.0%) | $164,046 |
| 6-Person Families | 20 (1.3%) | $0 |
| 7+ Person Families | 43 (2.8%) | $0 |
| Total | 1,543 (100.0%) | $118,528 |
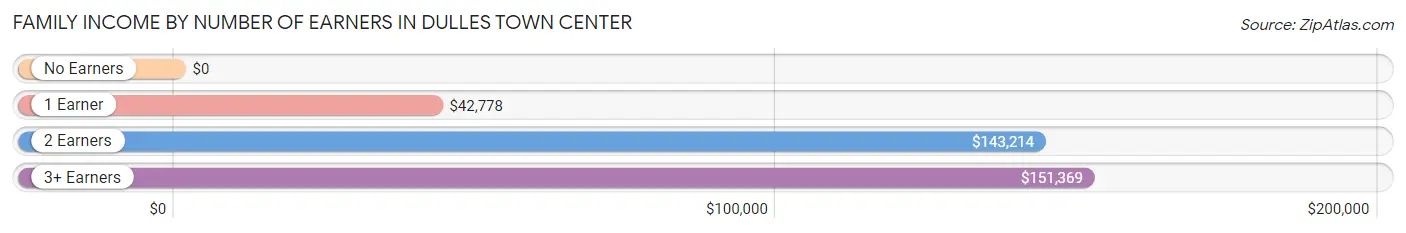
Family Income by Number of Earners in Dulles Town Center
| Number of Earners | # Families | Median Income |
| No Earners | 19 (1.2%) | $0 |
| 1 Earner | 618 (40.1%) | $42,778 |
| 2 Earners | 648 (42.0%) | $143,214 |
| 3+ Earners | 258 (16.7%) | $151,369 |
| Total | 1,543 (100.0%) | $118,528 |
Household Income in Dulles Town Center
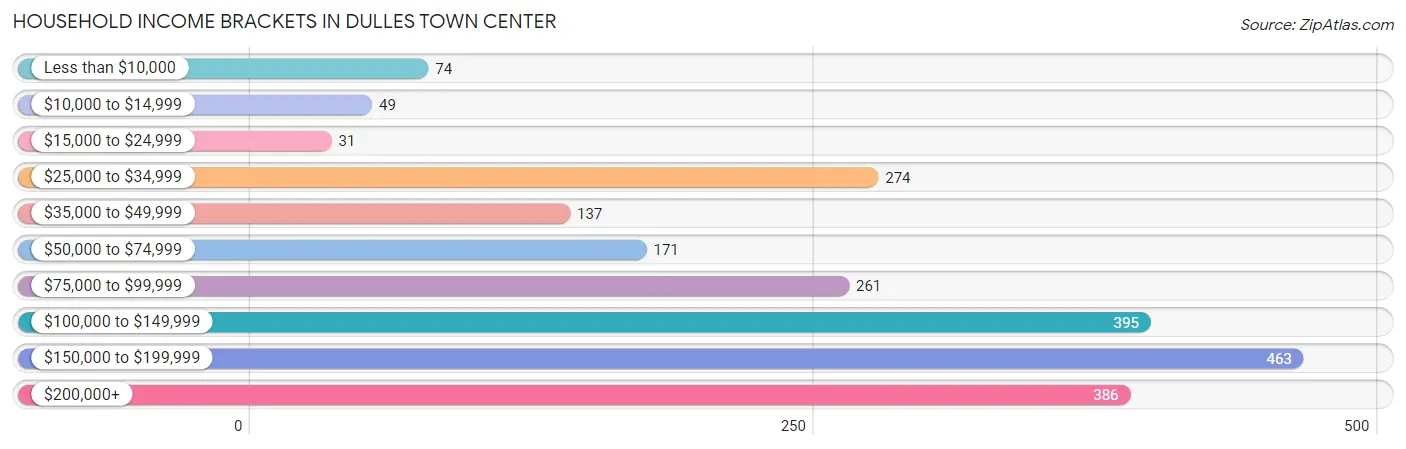
Household Income Brackets in Dulles Town Center
With 463 households falling in the category, the $150,000 to $199,999 income range is the most frequent in Dulles Town Center, accounting for 20.6% of all households. In contrast, only 31 households (1.4%) fall into the $15,000 to $24,999 income bracket, making it the least populous group.
| Income Bracket | # Households | % Households |
| Less than $10,000 | 74 | 3.3% |
| $10,000 to $14,999 | 49 | 2.2% |
| $15,000 to $24,999 | 31 | 1.4% |
| $25,000 to $34,999 | 274 | 12.2% |
| $35,000 to $49,999 | 137 | 6.1% |
| $50,000 to $74,999 | 171 | 7.6% |
| $75,000 to $99,999 | 261 | 11.6% |
| $100,000 to $149,999 | 395 | 17.6% |
| $150,000 to $199,999 | 463 | 20.6% |
| $200,000+ | 386 | 17.2% |
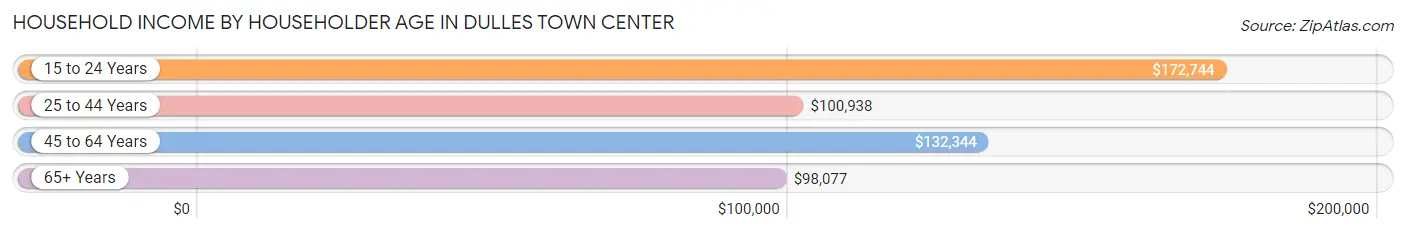
Household Income by Householder Age in Dulles Town Center
The median household income in Dulles Town Center is $114,034, with the highest median household income of $172,744 found in the 15 to 24 years age bracket for the primary householder. A total of 285 households (12.7%) fall into this category. Meanwhile, the 65+ years age bracket for the primary householder has the lowest median household income of $98,077, with 142 households (6.3%) in this group.
| Income Bracket | # Households | Median Income |
| 15 to 24 Years | 285 (12.7%) | $172,744 |
| 25 to 44 Years | 1,100 (48.9%) | $100,938 |
| 45 to 64 Years | 720 (32.0%) | $132,344 |
| 65+ Years | 142 (6.3%) | $98,077 |
| Total | 2,247 (100.0%) | $114,034 |
Poverty in Dulles Town Center
Income Below Poverty by Sex and Age in Dulles Town Center
With 17.0% poverty level for males and 19.4% for females among the residents of Dulles Town Center, 6 to 11 year old males and under 5 year old females are the most vulnerable to poverty, with 163 males (57.6%) and 199 females (75.7%) in their respective age groups living below the poverty level.
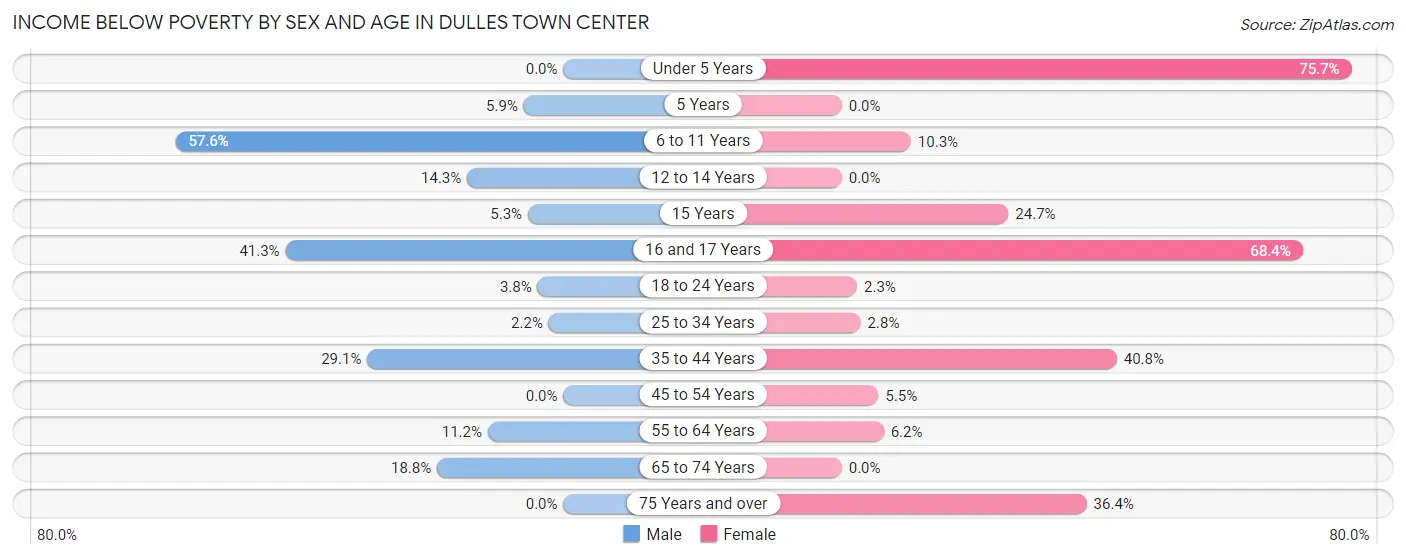
| Age Bracket | Male | Female |
| Under 5 Years | 0 (0.0%) | 199 (75.7%) |
| 5 Years | 1 (5.9%) | 0 (0.0%) |
| 6 to 11 Years | 163 (57.6%) | 8 (10.3%) |
| 12 to 14 Years | 23 (14.3%) | 0 (0.0%) |
| 15 Years | 2 (5.3%) | 24 (24.7%) |
| 16 and 17 Years | 26 (41.3%) | 13 (68.4%) |
| 18 to 24 Years | 18 (3.8%) | 11 (2.3%) |
| 25 to 34 Years | 9 (2.2%) | 8 (2.8%) |
| 35 to 44 Years | 221 (29.1%) | 216 (40.8%) |
| 45 to 54 Years | 0 (0.0%) | 22 (5.4%) |
| 55 to 64 Years | 45 (11.2%) | 14 (6.2%) |
| 65 to 74 Years | 18 (18.8%) | 0 (0.0%) |
| 75 Years and over | 0 (0.0%) | 24 (36.4%) |
| Total | 526 (17.0%) | 539 (19.4%) |
Income Above Poverty by Sex and Age in Dulles Town Center
According to the poverty statistics in Dulles Town Center, males aged under 5 years and females aged 12 to 14 years are the age groups that are most secure financially, with 100.0% of males and 100.0% of females in these age groups living above the poverty line.
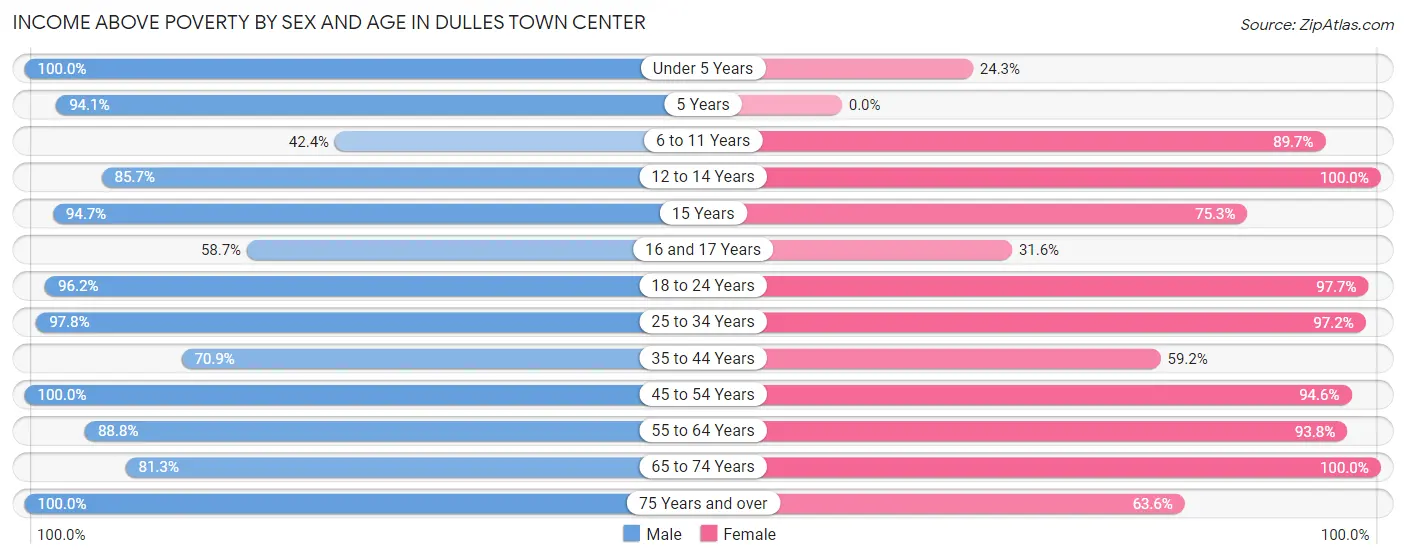
| Age Bracket | Male | Female |
| Under 5 Years | 96 (100.0%) | 64 (24.3%) |
| 5 Years | 16 (94.1%) | 0 (0.0%) |
| 6 to 11 Years | 120 (42.4%) | 70 (89.7%) |
| 12 to 14 Years | 138 (85.7%) | 164 (100.0%) |
| 15 Years | 36 (94.7%) | 73 (75.3%) |
| 16 and 17 Years | 37 (58.7%) | 6 (31.6%) |
| 18 to 24 Years | 453 (96.2%) | 473 (97.7%) |
| 25 to 34 Years | 406 (97.8%) | 278 (97.2%) |
| 35 to 44 Years | 538 (70.9%) | 313 (59.2%) |
| 45 to 54 Years | 274 (100.0%) | 382 (94.6%) |
| 55 to 64 Years | 356 (88.8%) | 211 (93.8%) |
| 65 to 74 Years | 78 (81.2%) | 160 (100.0%) |
| 75 Years and over | 21 (100.0%) | 42 (63.6%) |
| Total | 2,569 (83.0%) | 2,236 (80.6%) |
Income Below Poverty Among Married-Couple Families in Dulles Town Center
The poverty statistics for married-couple families in Dulles Town Center show that 21.6% or 225 of the total 1,041 families live below the poverty line. Families with 1 or 2 children have the highest poverty rate of 41.6%, comprising of 187 families. On the other hand, families with no children have the lowest poverty rate of 3.0%, which includes 15 families.
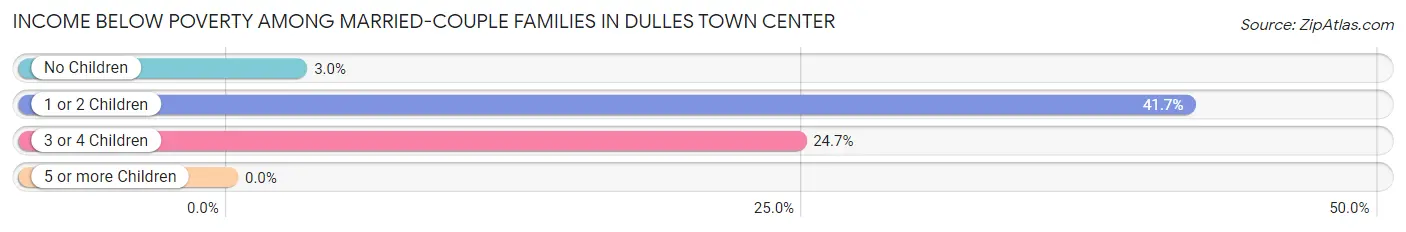
| Children | Above Poverty | Below Poverty |
| No Children | 484 (97.0%) | 15 (3.0%) |
| 1 or 2 Children | 262 (58.4%) | 187 (41.6%) |
| 3 or 4 Children | 70 (75.3%) | 23 (24.7%) |
| 5 or more Children | 0 (0.0%) | 0 (0.0%) |
| Total | 816 (78.4%) | 225 (21.6%) |
Income Below Poverty Among Single-Parent Households in Dulles Town Center
According to the poverty data in Dulles Town Center, 4.5% or 10 single-father households and 17.6% or 49 single-mother households are living below the poverty line. Among single-father households, those with no children have the highest poverty rate, with 9 households (9.9%) experiencing poverty. Likewise, among single-mother households, those with 1 or 2 children have the highest poverty rate, with 49 households (43.8%) falling below the poverty line.
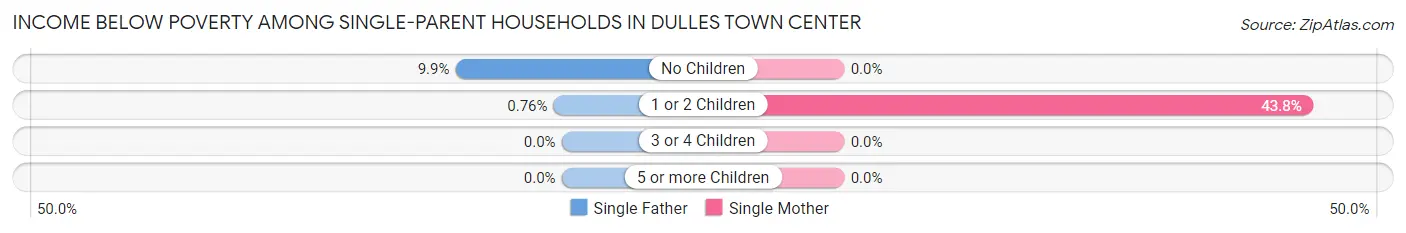
| Children | Single Father | Single Mother |
| No Children | 9 (9.9%) | 0 (0.0%) |
| 1 or 2 Children | 1 (0.8%) | 49 (43.8%) |
| 3 or 4 Children | 0 (0.0%) | 0 (0.0%) |
| 5 or more Children | 0 (0.0%) | 0 (0.0%) |
| Total | 10 (4.5%) | 49 (17.6%) |
Income Below Poverty Among Married-Couple vs Single-Parent Households in Dulles Town Center
The poverty data for Dulles Town Center shows that 225 of the married-couple family households (21.6%) and 59 of the single-parent households (11.7%) are living below the poverty level. Within the married-couple family households, those with 1 or 2 children have the highest poverty rate, with 187 households (41.6%) falling below the poverty line. Among the single-parent households, those with 1 or 2 children have the highest poverty rate, with 50 household (20.5%) living below poverty.
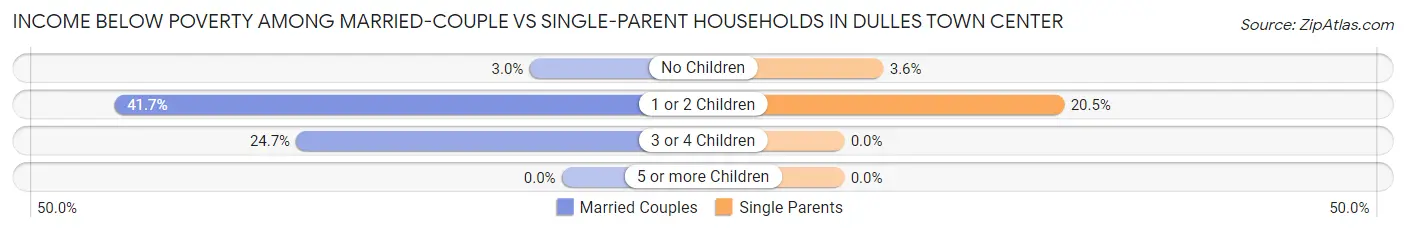
| Children | Married-Couple Families | Single-Parent Households |
| No Children | 15 (3.0%) | 9 (3.6%) |
| 1 or 2 Children | 187 (41.6%) | 50 (20.5%) |
| 3 or 4 Children | 23 (24.7%) | 0 (0.0%) |
| 5 or more Children | 0 (0.0%) | 0 (0.0%) |
| Total | 225 (21.6%) | 59 (11.7%) |
Employment Characteristics in Dulles Town Center
Employment by Class of Employer in Dulles Town Center
Among the 3,633 employed individuals in Dulles Town Center, private company employees (2,440 | 67.2%), federal government employees (334 | 9.2%), and not-for-profit organizations (321 | 8.8%) make up the most common classes of employment.
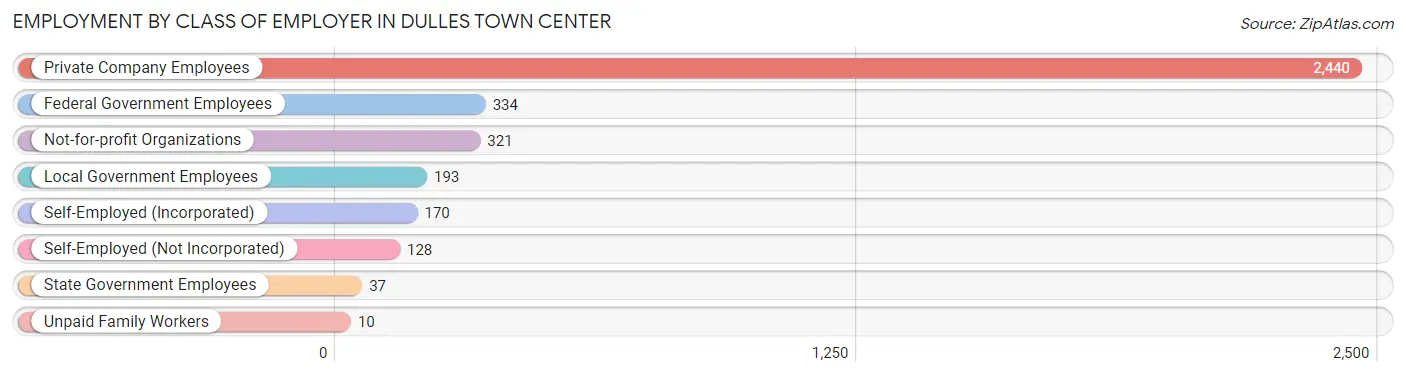
| Employer Class | # Employees | % Employees |
| Private Company Employees | 2,440 | 67.2% |
| Self-Employed (Incorporated) | 170 | 4.7% |
| Self-Employed (Not Incorporated) | 128 | 3.5% |
| Not-for-profit Organizations | 321 | 8.8% |
| Local Government Employees | 193 | 5.3% |
| State Government Employees | 37 | 1.0% |
| Federal Government Employees | 334 | 9.2% |
| Unpaid Family Workers | 10 | 0.3% |
| Total | 3,633 | 100.0% |
Employment Status by Age in Dulles Town Center
According to the labor force statistics for Dulles Town Center, out of the total population over 16 years of age (4,673), 83.0% or 3,879 individuals are in the labor force, with 4.1% or 159 of them unemployed. The age group with the highest labor force participation rate is 25 to 29 years, with 98.9% or 436 individuals in the labor force. Within the labor force, the 65 to 74 years age range has the highest percentage of unemployed individuals, with 34.8% or 39 of them being unemployed.
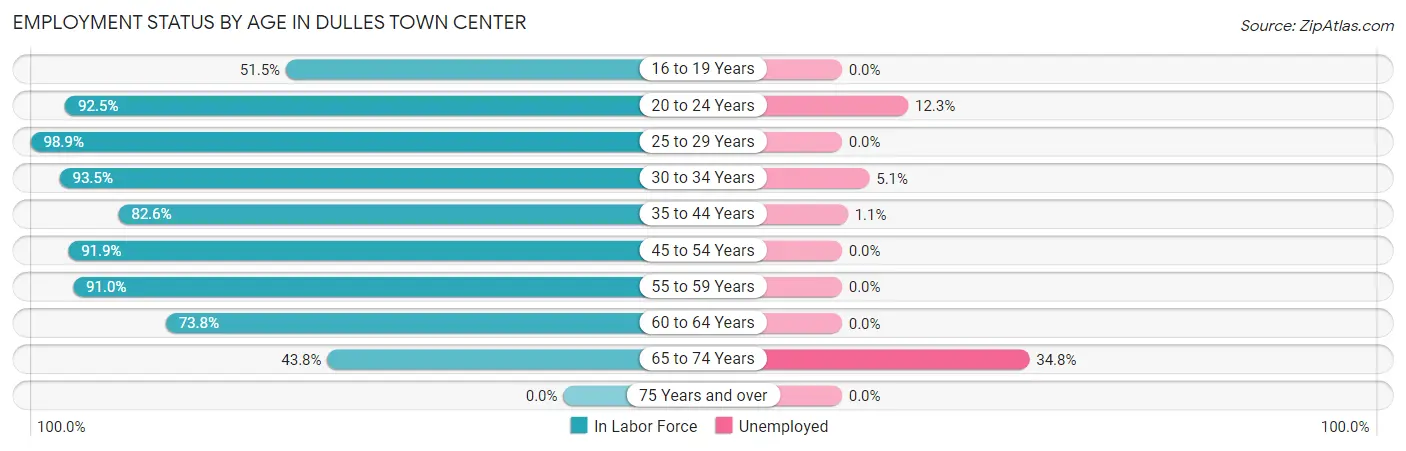
| Age Bracket | In Labor Force | Unemployed |
| 16 to 19 Years | 118 (51.5%) | 0 (0.0%) |
| 20 to 24 Years | 747 (92.5%) | 92 (12.3%) |
| 25 to 29 Years | 436 (98.9%) | 0 (0.0%) |
| 30 to 34 Years | 243 (93.5%) | 12 (5.1%) |
| 35 to 44 Years | 1,064 (82.6%) | 12 (1.1%) |
| 45 to 54 Years | 623 (91.9%) | 0 (0.0%) |
| 55 to 59 Years | 386 (91.0%) | 0 (0.0%) |
| 60 to 64 Years | 149 (73.8%) | 0 (0.0%) |
| 65 to 74 Years | 112 (43.8%) | 39 (34.8%) |
| 75 Years and over | 0 (0.0%) | 0 (0.0%) |
| Total | 3,879 (83.0%) | 159 (4.1%) |
Employment Status by Educational Attainment in Dulles Town Center
According to labor force statistics for Dulles Town Center, 88.1% of individuals (2,901) out of the total population between 25 and 64 years of age (3,293) are in the labor force, with 0.8% or 23 of them being unemployed. The group with the highest labor force participation rate are those with the educational attainment of bachelor's degree or higher, with 92.1% or 1,580 individuals in the labor force. Within the labor force, individuals with high school diploma education have the highest percentage of unemployment, with 2.6% or 12 of them being unemployed.
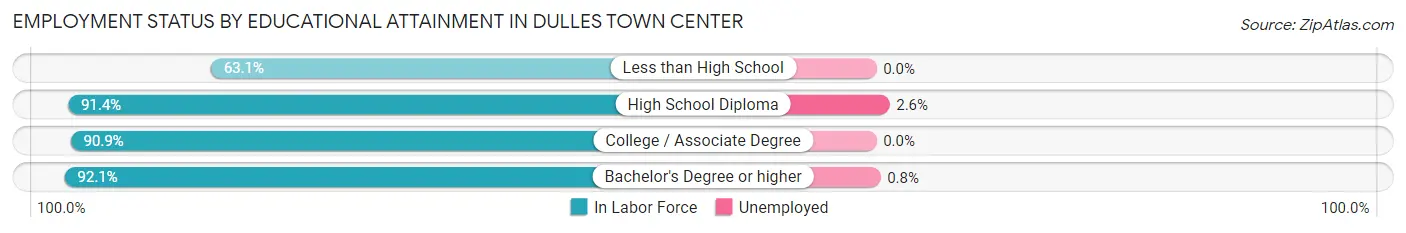
| Educational Attainment | In Labor Force | Unemployed |
| Less than High School | 262 (63.1%) | 0 (0.0%) |
| High School Diploma | 458 (91.4%) | 13 (2.6%) |
| College / Associate Degree | 602 (90.9%) | 0 (0.0%) |
| Bachelor's Degree or higher | 1,580 (92.1%) | 14 (0.8%) |
| Total | 2,901 (88.1%) | 26 (0.8%) |
Employment Occupations by Sex in Dulles Town Center
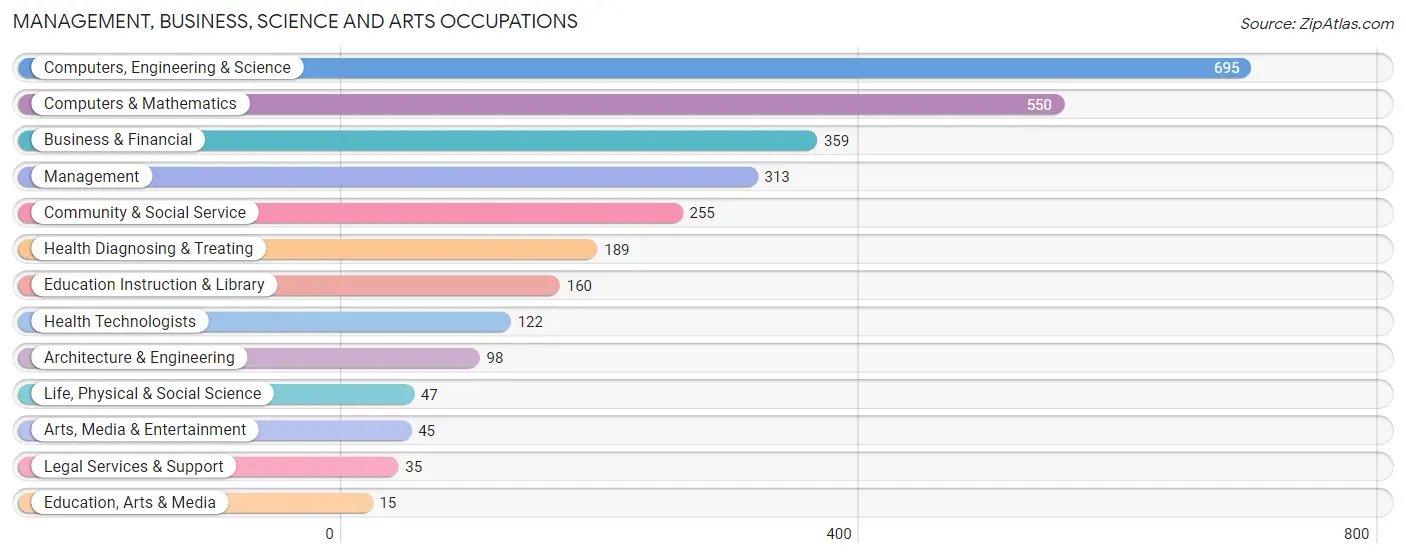
Management, Business, Science and Arts Occupations
The most common Management, Business, Science and Arts occupations in Dulles Town Center are Computers, Engineering & Science (695 | 19.0%), Computers & Mathematics (550 | 15.1%), Business & Financial (359 | 9.8%), Management (313 | 8.6%), and Community & Social Service (255 | 7.0%).
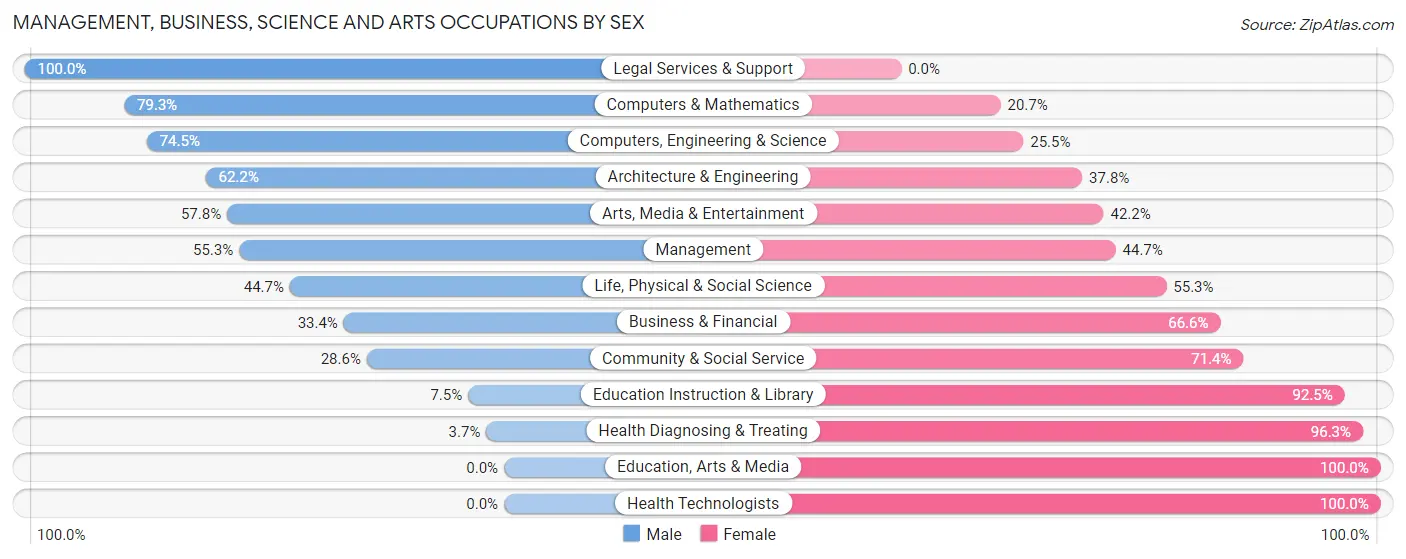
Management, Business, Science and Arts Occupations by Sex
Within the Management, Business, Science and Arts occupations in Dulles Town Center, the most male-oriented occupations are Legal Services & Support (100.0%), Computers & Mathematics (79.3%), and Computers, Engineering & Science (74.5%), while the most female-oriented occupations are Education, Arts & Media (100.0%), Health Technologists (100.0%), and Health Diagnosing & Treating (96.3%).
| Occupation | Male | Female |
| Management | 173 (55.3%) | 140 (44.7%) |
| Business & Financial | 120 (33.4%) | 239 (66.6%) |
| Computers, Engineering & Science | 518 (74.5%) | 177 (25.5%) |
| Computers & Mathematics | 436 (79.3%) | 114 (20.7%) |
| Architecture & Engineering | 61 (62.2%) | 37 (37.8%) |
| Life, Physical & Social Science | 21 (44.7%) | 26 (55.3%) |
| Community & Social Service | 73 (28.6%) | 182 (71.4%) |
| Education, Arts & Media | 0 (0.0%) | 15 (100.0%) |
| Legal Services & Support | 35 (100.0%) | 0 (0.0%) |
| Education Instruction & Library | 12 (7.5%) | 148 (92.5%) |
| Arts, Media & Entertainment | 26 (57.8%) | 19 (42.2%) |
| Health Diagnosing & Treating | 7 (3.7%) | 182 (96.3%) |
| Health Technologists | 0 (0.0%) | 122 (100.0%) |
| Total (Category) | 891 (49.2%) | 920 (50.8%) |
| Total (Overall) | 2,103 (57.6%) | 1,547 (42.4%) |
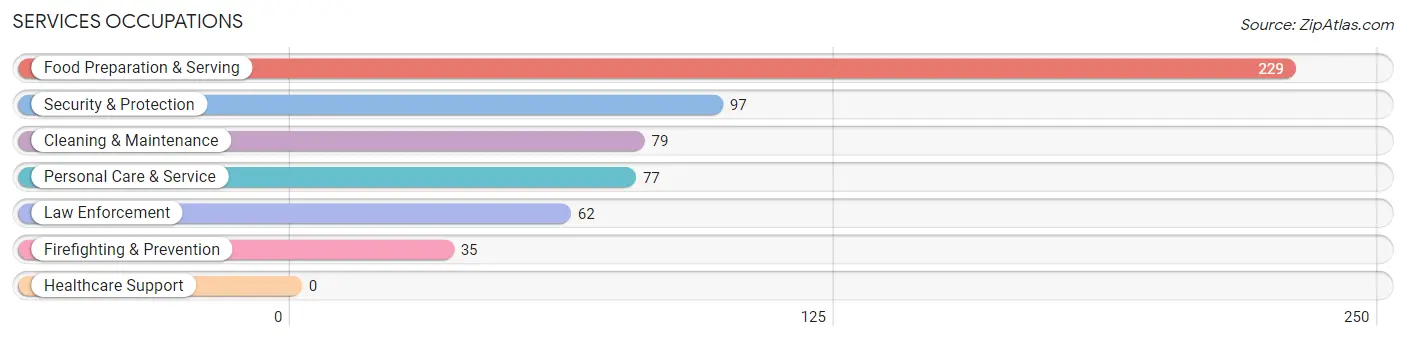
Services Occupations
The most common Services occupations in Dulles Town Center are Food Preparation & Serving (229 | 6.3%), Security & Protection (97 | 2.7%), Cleaning & Maintenance (79 | 2.2%), Personal Care & Service (77 | 2.1%), and Law Enforcement (62 | 1.7%).
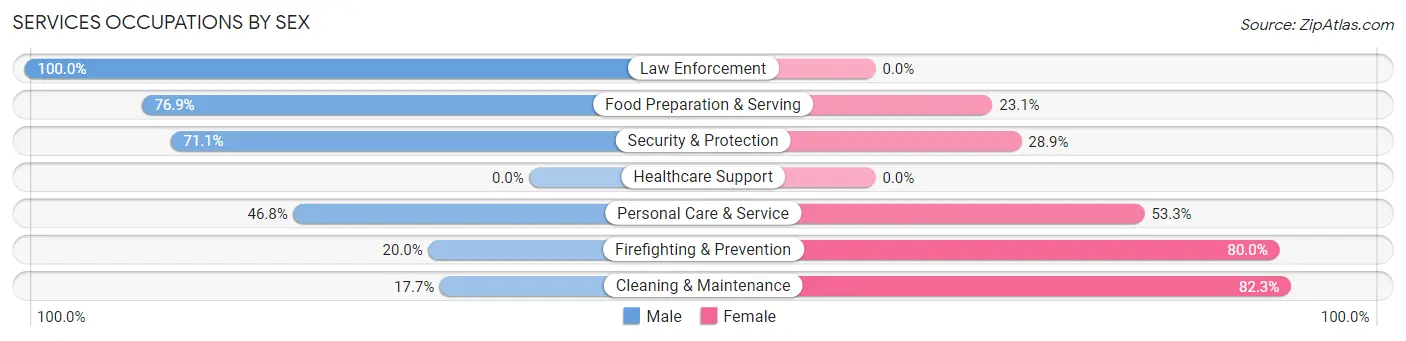
Services Occupations by Sex
Within the Services occupations in Dulles Town Center, the most male-oriented occupations are Law Enforcement (100.0%), Food Preparation & Serving (76.9%), and Security & Protection (71.1%), while the most female-oriented occupations are Cleaning & Maintenance (82.3%), Firefighting & Prevention (80.0%), and Personal Care & Service (53.2%).
| Occupation | Male | Female |
| Healthcare Support | 0 (0.0%) | 0 (0.0%) |
| Security & Protection | 69 (71.1%) | 28 (28.9%) |
| Firefighting & Prevention | 7 (20.0%) | 28 (80.0%) |
| Law Enforcement | 62 (100.0%) | 0 (0.0%) |
| Food Preparation & Serving | 176 (76.9%) | 53 (23.1%) |
| Cleaning & Maintenance | 14 (17.7%) | 65 (82.3%) |
| Personal Care & Service | 36 (46.8%) | 41 (53.2%) |
| Total (Category) | 295 (61.2%) | 187 (38.8%) |
| Total (Overall) | 2,103 (57.6%) | 1,547 (42.4%) |
Sales and Office Occupations
The most common Sales and Office occupations in Dulles Town Center are Sales & Related (349 | 9.6%), and Office & Administration (257 | 7.0%).

Sales and Office Occupations by Sex
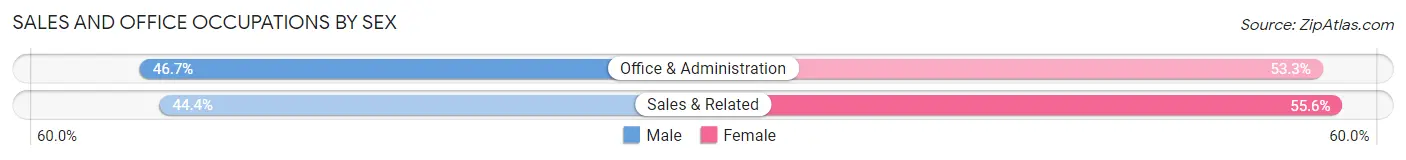
| Occupation | Male | Female |
| Sales & Related | 155 (44.4%) | 194 (55.6%) |
| Office & Administration | 120 (46.7%) | 137 (53.3%) |
| Total (Category) | 275 (45.4%) | 331 (54.6%) |
| Total (Overall) | 2,103 (57.6%) | 1,547 (42.4%) |
Natural Resources, Construction and Maintenance Occupations
The most common Natural Resources, Construction and Maintenance occupations in Dulles Town Center are Construction & Extraction (130 | 3.6%), and Installation, Maintenance & Repair (93 | 2.5%).

Natural Resources, Construction and Maintenance Occupations by Sex
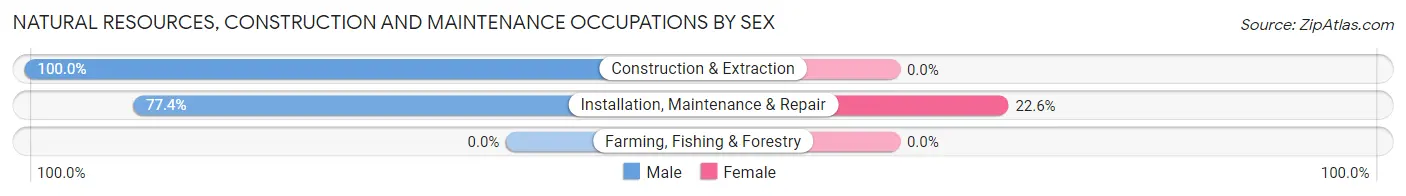
| Occupation | Male | Female |
| Farming, Fishing & Forestry | 0 (0.0%) | 0 (0.0%) |
| Construction & Extraction | 130 (100.0%) | 0 (0.0%) |
| Installation, Maintenance & Repair | 72 (77.4%) | 21 (22.6%) |
| Total (Category) | 202 (90.6%) | 21 (9.4%) |
| Total (Overall) | 2,103 (57.6%) | 1,547 (42.4%) |
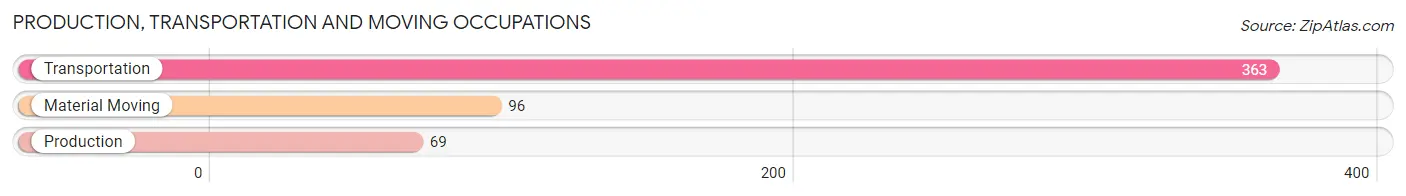
Production, Transportation and Moving Occupations
The most common Production, Transportation and Moving occupations in Dulles Town Center are Transportation (363 | 10.0%), Material Moving (96 | 2.6%), and Production (69 | 1.9%).
Production, Transportation and Moving Occupations by Sex
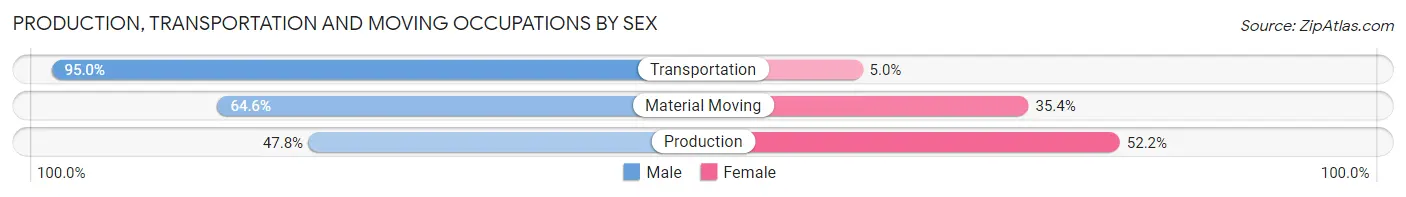
| Occupation | Male | Female |
| Production | 33 (47.8%) | 36 (52.2%) |
| Transportation | 345 (95.0%) | 18 (5.0%) |
| Material Moving | 62 (64.6%) | 34 (35.4%) |
| Total (Category) | 440 (83.3%) | 88 (16.7%) |
| Total (Overall) | 2,103 (57.6%) | 1,547 (42.4%) |
Employment Industries by Sex in Dulles Town Center
Employment Industries in Dulles Town Center
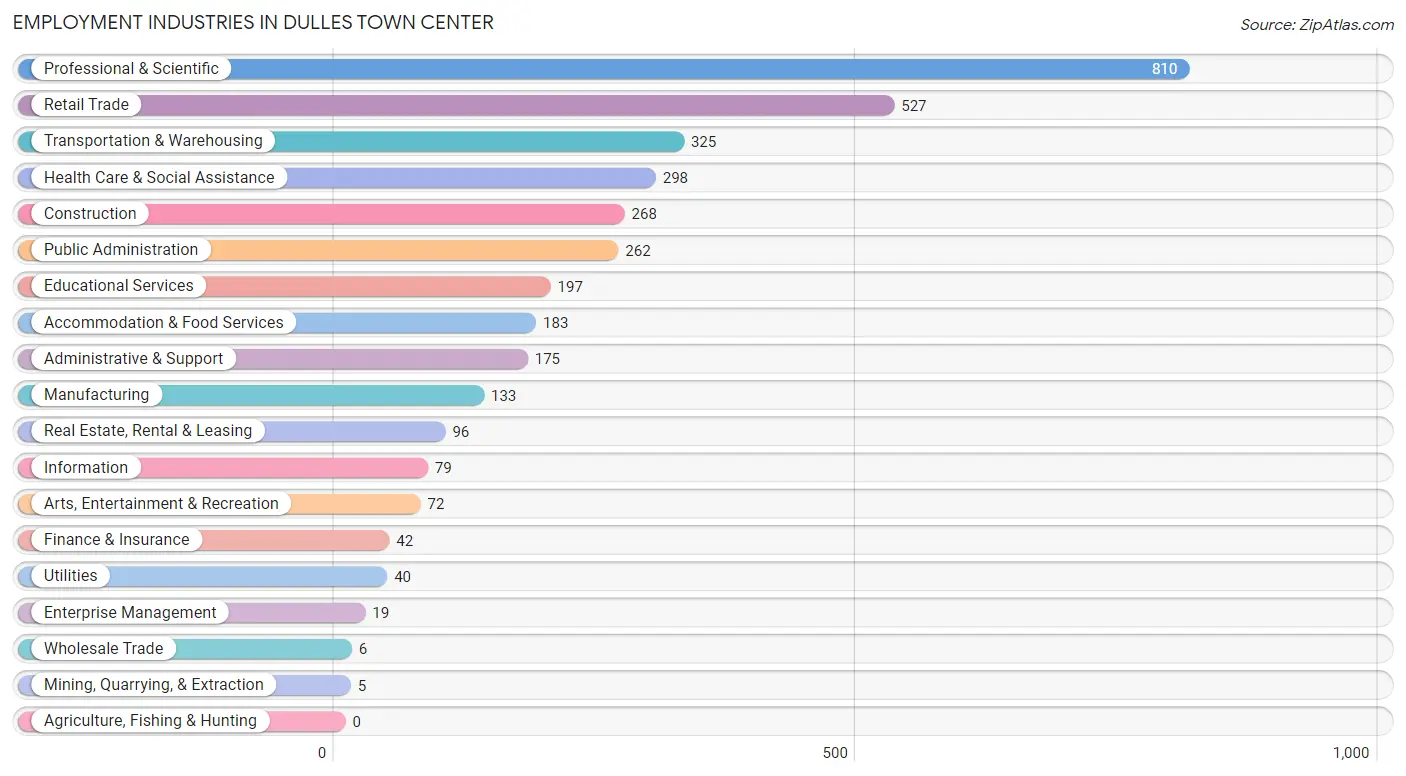
The major employment industries in Dulles Town Center include Professional & Scientific (810 | 22.2%), Retail Trade (527 | 14.4%), Transportation & Warehousing (325 | 8.9%), Health Care & Social Assistance (298 | 8.2%), and Construction (268 | 7.3%).
Employment Industries by Sex in Dulles Town Center
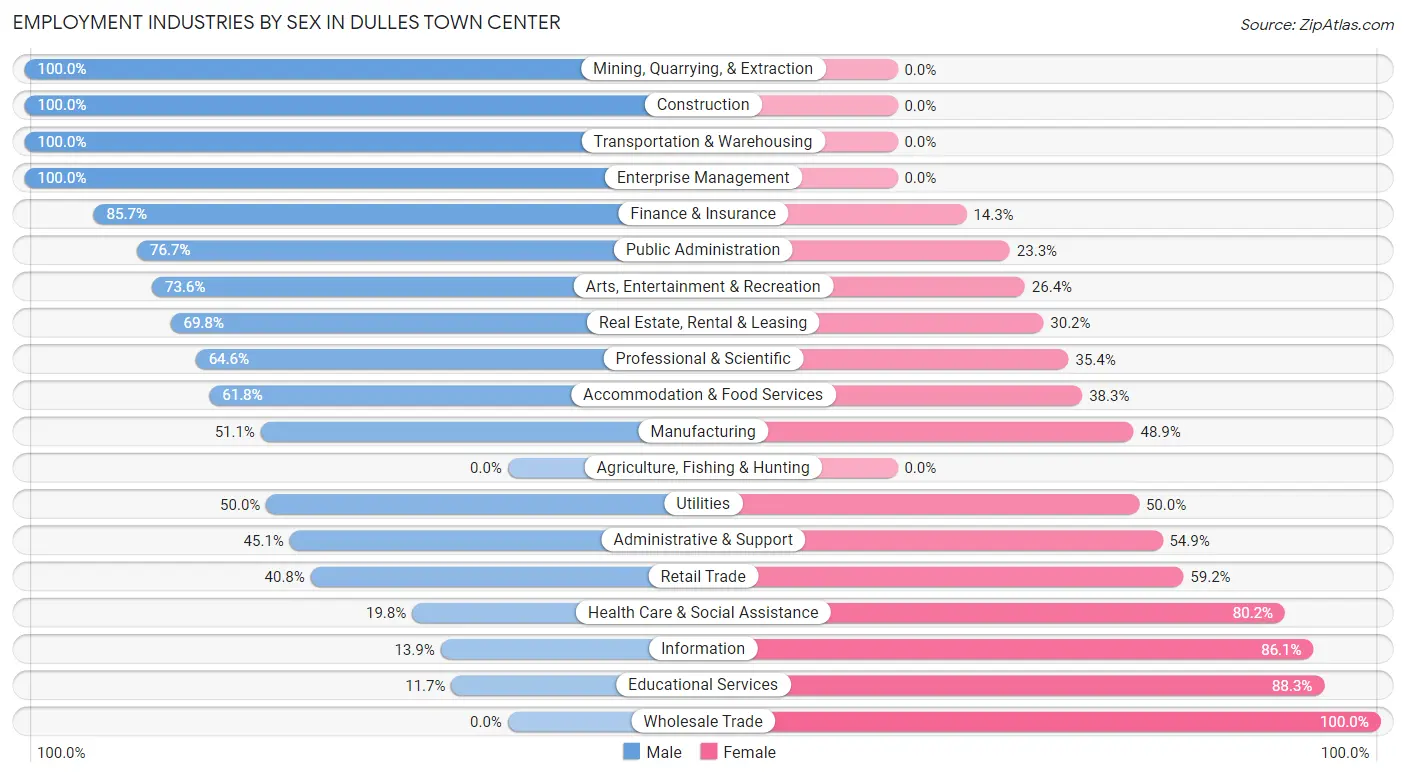
The Dulles Town Center industries that see more men than women are Mining, Quarrying, & Extraction (100.0%), Construction (100.0%), and Transportation & Warehousing (100.0%), whereas the industries that tend to have a higher number of women are Wholesale Trade (100.0%), Educational Services (88.3%), and Information (86.1%).
| Industry | Male | Female |
| Agriculture, Fishing & Hunting | 0 (0.0%) | 0 (0.0%) |
| Mining, Quarrying, & Extraction | 5 (100.0%) | 0 (0.0%) |
| Construction | 268 (100.0%) | 0 (0.0%) |
| Manufacturing | 68 (51.1%) | 65 (48.9%) |
| Wholesale Trade | 0 (0.0%) | 6 (100.0%) |
| Retail Trade | 215 (40.8%) | 312 (59.2%) |
| Transportation & Warehousing | 325 (100.0%) | 0 (0.0%) |
| Utilities | 20 (50.0%) | 20 (50.0%) |
| Information | 11 (13.9%) | 68 (86.1%) |
| Finance & Insurance | 36 (85.7%) | 6 (14.3%) |
| Real Estate, Rental & Leasing | 67 (69.8%) | 29 (30.2%) |
| Professional & Scientific | 523 (64.6%) | 287 (35.4%) |
| Enterprise Management | 19 (100.0%) | 0 (0.0%) |
| Administrative & Support | 79 (45.1%) | 96 (54.9%) |
| Educational Services | 23 (11.7%) | 174 (88.3%) |
| Health Care & Social Assistance | 59 (19.8%) | 239 (80.2%) |
| Arts, Entertainment & Recreation | 53 (73.6%) | 19 (26.4%) |
| Accommodation & Food Services | 113 (61.8%) | 70 (38.3%) |
| Public Administration | 201 (76.7%) | 61 (23.3%) |
| Total | 2,103 (57.6%) | 1,547 (42.4%) |
Education in Dulles Town Center
School Enrollment in Dulles Town Center
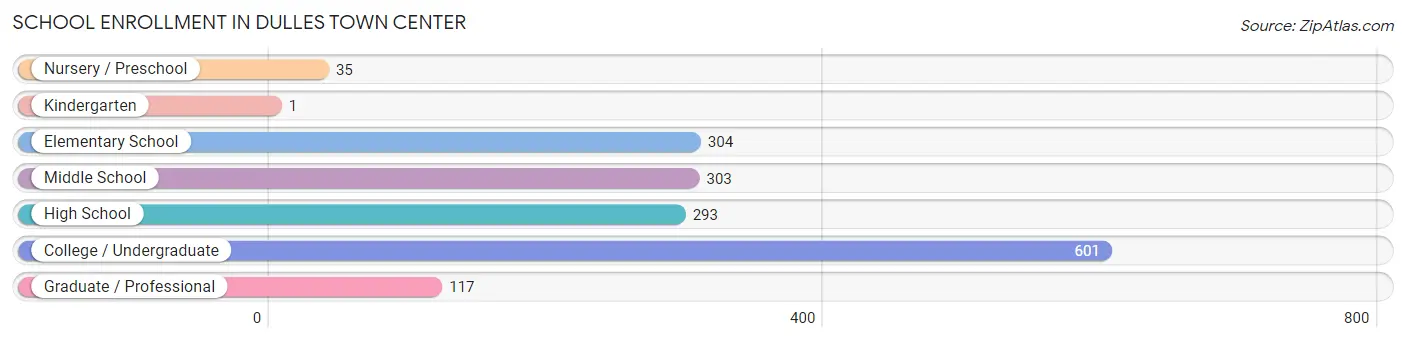
The most common levels of schooling among the 1,654 students in Dulles Town Center are college / undergraduate (601 | 36.3%), elementary school (304 | 18.4%), and middle school (303 | 18.3%).
| School Level | # Students | % Students |
| Nursery / Preschool | 35 | 2.1% |
| Kindergarten | 1 | 0.1% |
| Elementary School | 304 | 18.4% |
| Middle School | 303 | 18.3% |
| High School | 293 | 17.7% |
| College / Undergraduate | 601 | 36.3% |
| Graduate / Professional | 117 | 7.1% |
| Total | 1,654 | 100.0% |
School Enrollment by Age by Funding Source in Dulles Town Center
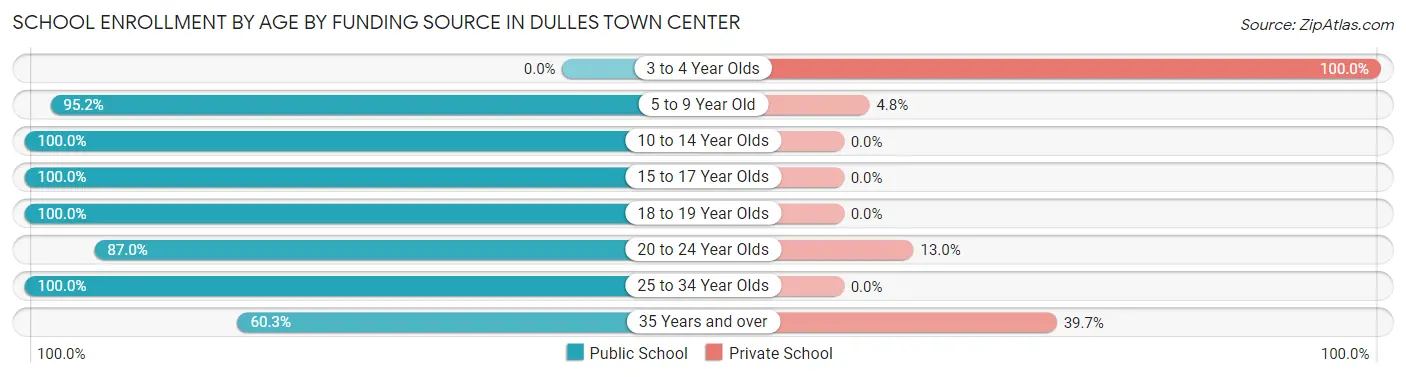
Out of a total of 1,654 students who are enrolled in schools in Dulles Town Center, 144 (8.7%) attend a private institution, while the remaining 1,510 (91.3%) are enrolled in public schools. The age group of 3 to 4 year olds has the highest likelihood of being enrolled in private schools, with 28 (100.0% in the age bracket) enrolled. Conversely, the age group of 10 to 14 year olds has the lowest likelihood of being enrolled in a private school, with 382 (100.0% in the age bracket) attending a public institution.
| Age Bracket | Public School | Private School |
| 3 to 4 Year Olds | 0 (0.0%) | 28 (100.0%) |
| 5 to 9 Year Old | 297 (95.2%) | 15 (4.8%) |
| 10 to 14 Year Olds | 382 (100.0%) | 0 (0.0%) |
| 15 to 17 Year Olds | 217 (100.0%) | 0 (0.0%) |
| 18 to 19 Year Olds | 113 (100.0%) | 0 (0.0%) |
| 20 to 24 Year Olds | 341 (87.0%) | 51 (13.0%) |
| 25 to 34 Year Olds | 84 (100.0%) | 0 (0.0%) |
| 35 Years and over | 76 (60.3%) | 50 (39.7%) |
| Total | 1,510 (91.3%) | 144 (8.7%) |
Educational Attainment by Field of Study in Dulles Town Center
Business (393 | 19.7%), computers & mathematics (312 | 15.6%), engineering (229 | 11.5%), social sciences (209 | 10.5%), and arts & humanities (134 | 6.7%) are the most common fields of study among 1,999 individuals in Dulles Town Center who have obtained a bachelor's degree or higher.
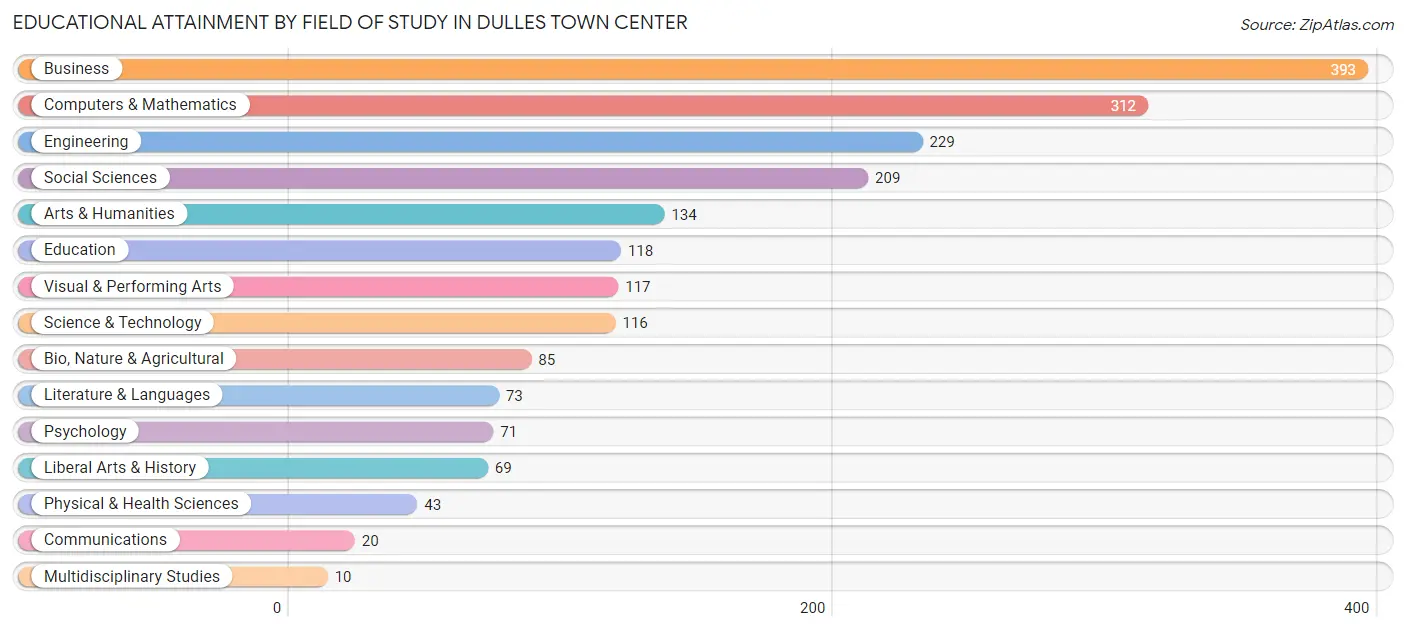
| Field of Study | # Graduates | % Graduates |
| Computers & Mathematics | 312 | 15.6% |
| Bio, Nature & Agricultural | 85 | 4.3% |
| Physical & Health Sciences | 43 | 2.1% |
| Psychology | 71 | 3.5% |
| Social Sciences | 209 | 10.5% |
| Engineering | 229 | 11.5% |
| Multidisciplinary Studies | 10 | 0.5% |
| Science & Technology | 116 | 5.8% |
| Business | 393 | 19.7% |
| Education | 118 | 5.9% |
| Literature & Languages | 73 | 3.6% |
| Liberal Arts & History | 69 | 3.5% |
| Visual & Performing Arts | 117 | 5.9% |
| Communications | 20 | 1.0% |
| Arts & Humanities | 134 | 6.7% |
| Total | 1,999 | 100.0% |
Transportation & Commute in Dulles Town Center
Vehicle Availability by Sex in Dulles Town Center
The most prevalent vehicle ownership categories in Dulles Town Center are males with 2 vehicles (973, accounting for 45.1%) and females with 2 vehicles (658, making up 65.9%).
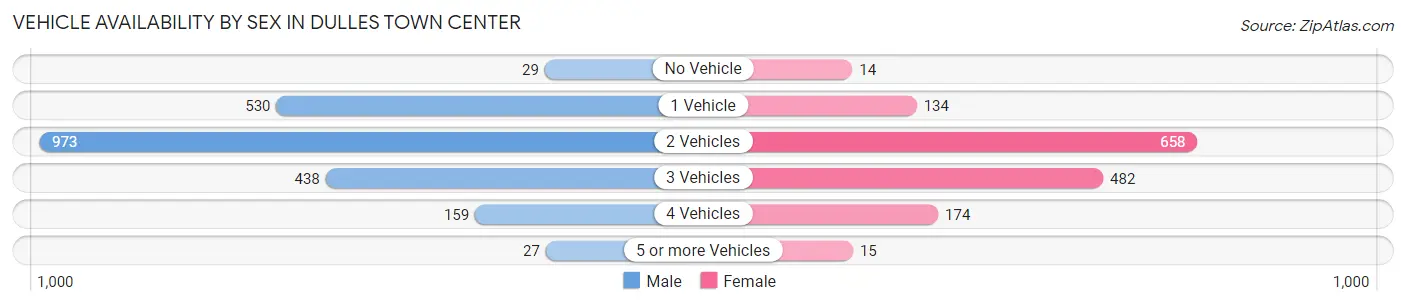
| Vehicles Available | Male | Female |
| No Vehicle | 29 (1.3%) | 14 (0.9%) |
| 1 Vehicle | 530 (24.6%) | 134 (9.1%) |
| 2 Vehicles | 973 (45.1%) | 658 (44.6%) |
| 3 Vehicles | 438 (20.3%) | 482 (32.6%) |
| 4 Vehicles | 159 (7.4%) | 174 (11.8%) |
| 5 or more Vehicles | 27 (1.3%) | 15 (1.0%) |
| Total | 2,156 (100.0%) | 1,477 (100.0%) |
Commute Time in Dulles Town Center
The most frequently occuring commute durations in Dulles Town Center are 10 to 14 minutes (827 commuters, 24.4%), 15 to 19 minutes (603 commuters, 17.8%), and 5 to 9 minutes (465 commuters, 13.8%).
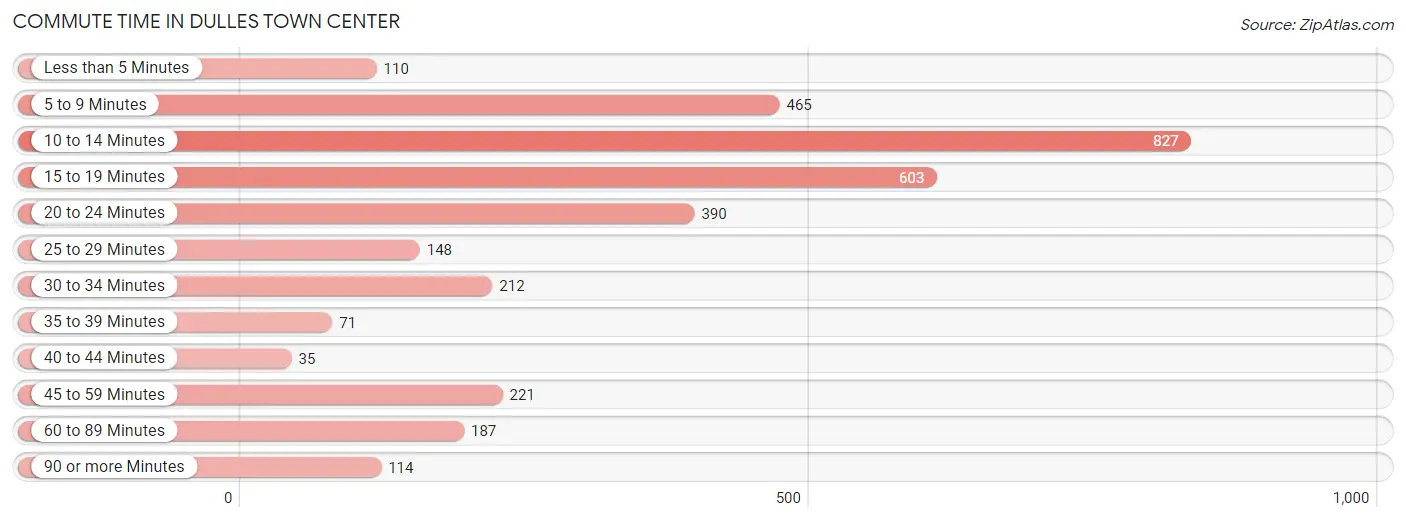
| Commute Time | # Commuters | % Commuters |
| Less than 5 Minutes | 110 | 3.3% |
| 5 to 9 Minutes | 465 | 13.8% |
| 10 to 14 Minutes | 827 | 24.4% |
| 15 to 19 Minutes | 603 | 17.8% |
| 20 to 24 Minutes | 390 | 11.5% |
| 25 to 29 Minutes | 148 | 4.4% |
| 30 to 34 Minutes | 212 | 6.3% |
| 35 to 39 Minutes | 71 | 2.1% |
| 40 to 44 Minutes | 35 | 1.0% |
| 45 to 59 Minutes | 221 | 6.5% |
| 60 to 89 Minutes | 187 | 5.5% |
| 90 or more Minutes | 114 | 3.4% |
Commute Time by Sex in Dulles Town Center
The most common commute times in Dulles Town Center are 10 to 14 minutes (464 commuters, 23.0%) for males and 10 to 14 minutes (363 commuters, 26.6%) for females.
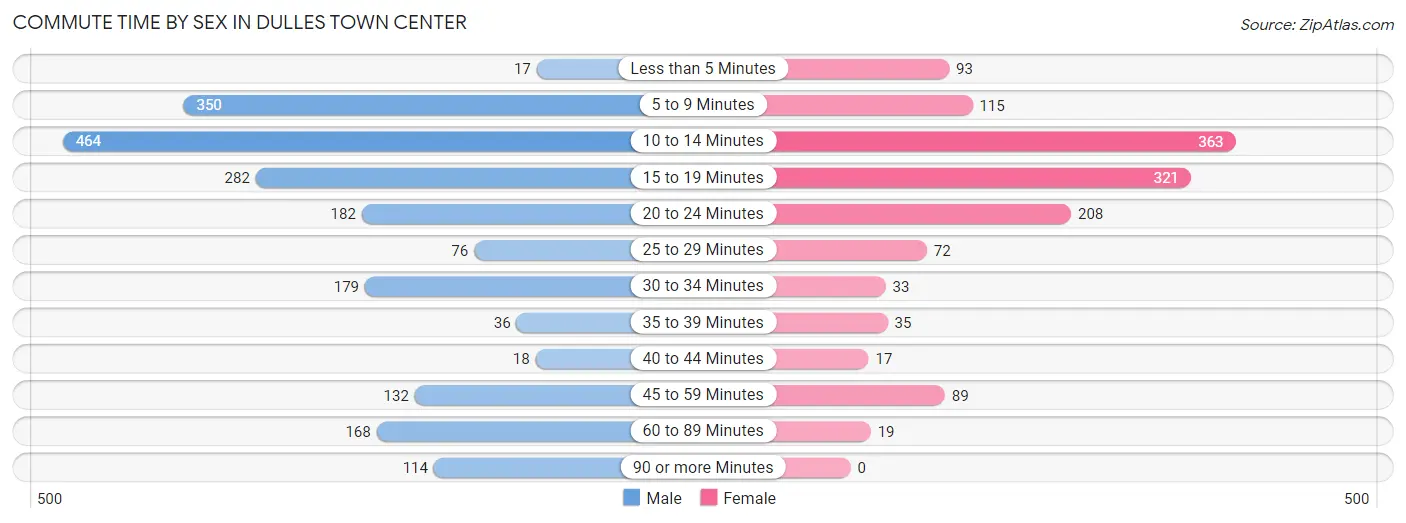
| Commute Time | Male | Female |
| Less than 5 Minutes | 17 (0.8%) | 93 (6.8%) |
| 5 to 9 Minutes | 350 (17.3%) | 115 (8.4%) |
| 10 to 14 Minutes | 464 (23.0%) | 363 (26.6%) |
| 15 to 19 Minutes | 282 (14.0%) | 321 (23.5%) |
| 20 to 24 Minutes | 182 (9.0%) | 208 (15.2%) |
| 25 to 29 Minutes | 76 (3.8%) | 72 (5.3%) |
| 30 to 34 Minutes | 179 (8.9%) | 33 (2.4%) |
| 35 to 39 Minutes | 36 (1.8%) | 35 (2.6%) |
| 40 to 44 Minutes | 18 (0.9%) | 17 (1.3%) |
| 45 to 59 Minutes | 132 (6.5%) | 89 (6.5%) |
| 60 to 89 Minutes | 168 (8.3%) | 19 (1.4%) |
| 90 or more Minutes | 114 (5.7%) | 0 (0.0%) |
Time of Departure to Work by Sex in Dulles Town Center
The most frequent times of departure to work in Dulles Town Center are 7:00 AM to 7:29 AM (611, 30.3%) for males and 7:30 AM to 7:59 AM (245, 17.9%) for females.
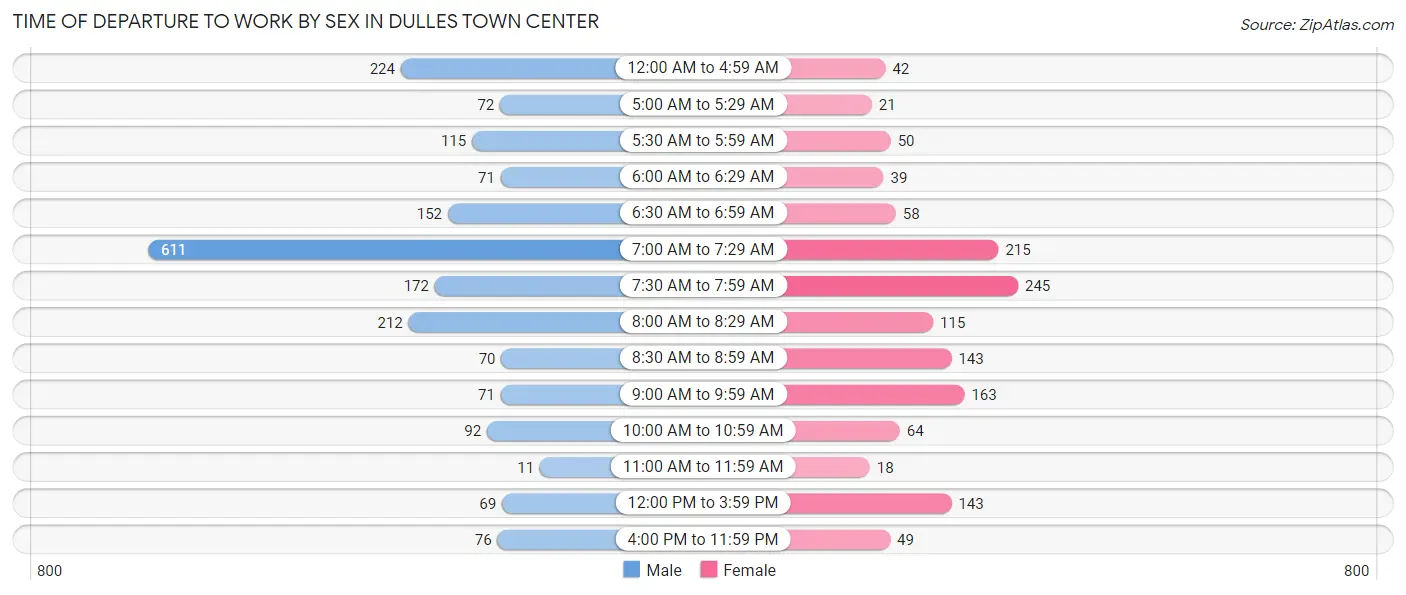
| Time of Departure | Male | Female |
| 12:00 AM to 4:59 AM | 224 (11.1%) | 42 (3.1%) |
| 5:00 AM to 5:29 AM | 72 (3.6%) | 21 (1.5%) |
| 5:30 AM to 5:59 AM | 115 (5.7%) | 50 (3.7%) |
| 6:00 AM to 6:29 AM | 71 (3.5%) | 39 (2.9%) |
| 6:30 AM to 6:59 AM | 152 (7.5%) | 58 (4.3%) |
| 7:00 AM to 7:29 AM | 611 (30.3%) | 215 (15.8%) |
| 7:30 AM to 7:59 AM | 172 (8.5%) | 245 (17.9%) |
| 8:00 AM to 8:29 AM | 212 (10.5%) | 115 (8.4%) |
| 8:30 AM to 8:59 AM | 70 (3.5%) | 143 (10.5%) |
| 9:00 AM to 9:59 AM | 71 (3.5%) | 163 (11.9%) |
| 10:00 AM to 10:59 AM | 92 (4.6%) | 64 (4.7%) |
| 11:00 AM to 11:59 AM | 11 (0.5%) | 18 (1.3%) |
| 12:00 PM to 3:59 PM | 69 (3.4%) | 143 (10.5%) |
| 4:00 PM to 11:59 PM | 76 (3.8%) | 49 (3.6%) |
| Total | 2,018 (100.0%) | 1,365 (100.0%) |
Housing Occupancy in Dulles Town Center
Occupancy by Ownership in Dulles Town Center
Of the total 2,247 dwellings in Dulles Town Center, owner-occupied units account for 745 (33.2%), while renter-occupied units make up 1,502 (66.8%).
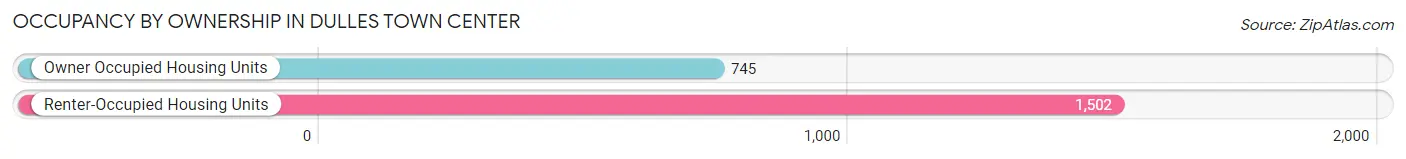
| Occupancy | # Housing Units | % Housing Units |
| Owner Occupied Housing Units | 745 | 33.2% |
| Renter-Occupied Housing Units | 1,502 | 66.8% |
| Total Occupied Housing Units | 2,247 | 100.0% |
Occupancy by Household Size in Dulles Town Center
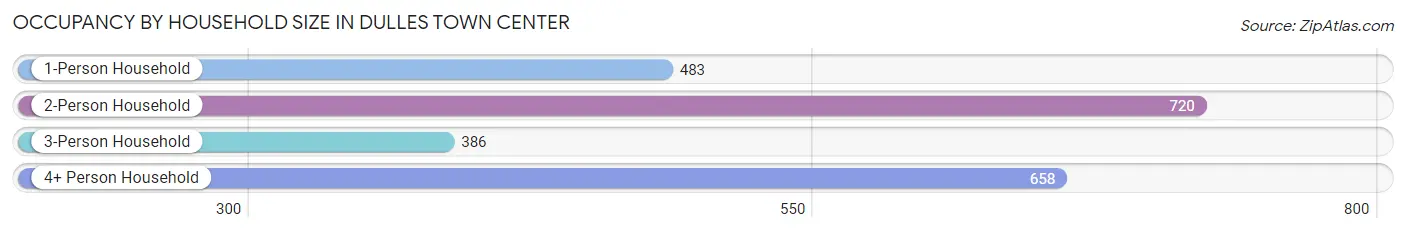
| Household Size | # Housing Units | % Housing Units |
| 1-Person Household | 483 | 21.5% |
| 2-Person Household | 720 | 32.0% |
| 3-Person Household | 386 | 17.2% |
| 4+ Person Household | 658 | 29.3% |
| Total Housing Units | 2,247 | 100.0% |
Occupancy by Ownership by Household Size in Dulles Town Center
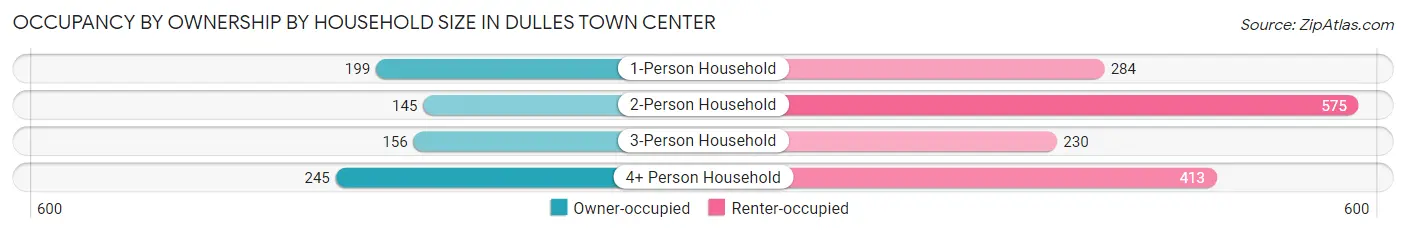
| Household Size | Owner-occupied | Renter-occupied |
| 1-Person Household | 199 (41.2%) | 284 (58.8%) |
| 2-Person Household | 145 (20.1%) | 575 (79.9%) |
| 3-Person Household | 156 (40.4%) | 230 (59.6%) |
| 4+ Person Household | 245 (37.2%) | 413 (62.8%) |
| Total Housing Units | 745 (33.2%) | 1,502 (66.8%) |
Occupancy by Educational Attainment in Dulles Town Center
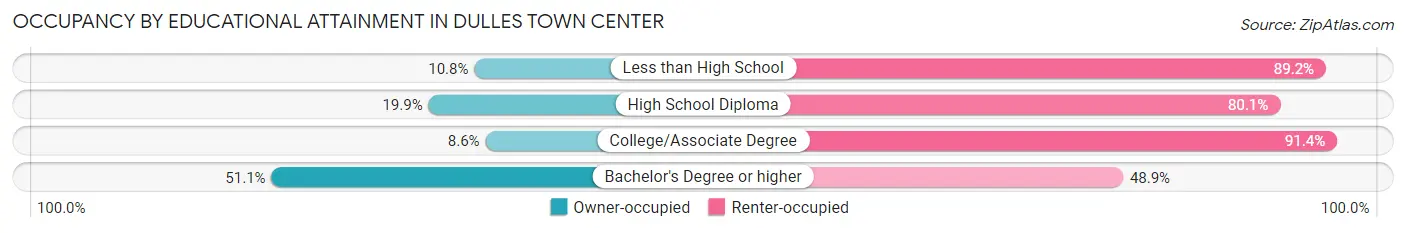
| Household Size | Owner-occupied | Renter-occupied |
| Less than High School | 22 (10.8%) | 181 (89.2%) |
| High School Diploma | 51 (19.9%) | 205 (80.1%) |
| College/Associate Degree | 49 (8.6%) | 519 (91.4%) |
| Bachelor's Degree or higher | 623 (51.1%) | 597 (48.9%) |
Occupancy by Age of Householder in Dulles Town Center
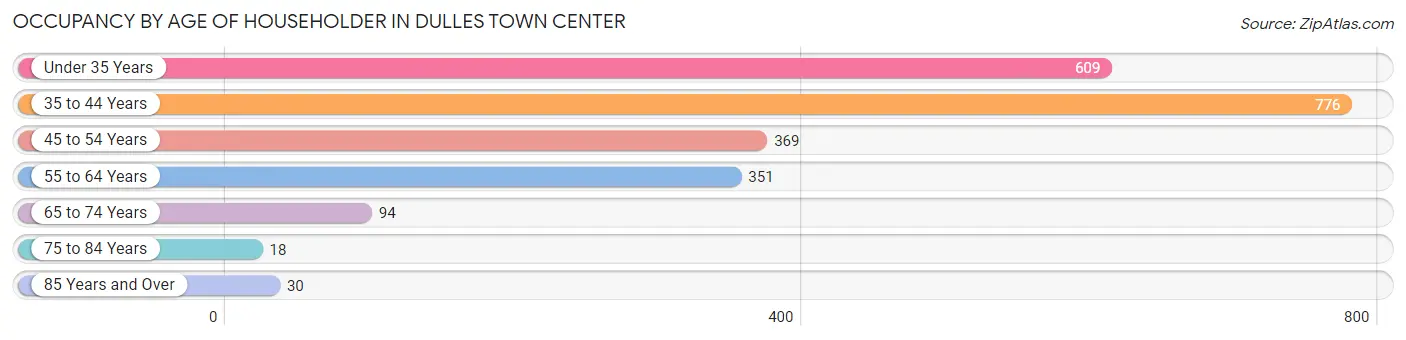
| Age Bracket | # Households | % Households |
| Under 35 Years | 609 | 27.1% |
| 35 to 44 Years | 776 | 34.5% |
| 45 to 54 Years | 369 | 16.4% |
| 55 to 64 Years | 351 | 15.6% |
| 65 to 74 Years | 94 | 4.2% |
| 75 to 84 Years | 18 | 0.8% |
| 85 Years and Over | 30 | 1.3% |
| Total | 2,247 | 100.0% |
Housing Finances in Dulles Town Center
Median Income by Occupancy in Dulles Town Center
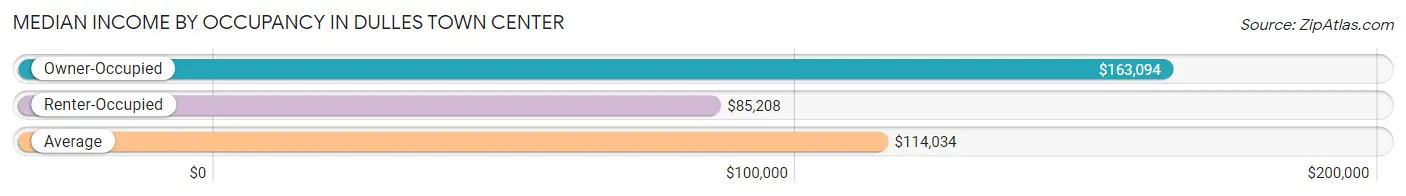
| Occupancy Type | # Households | Median Income |
| Owner-Occupied | 745 (33.2%) | $163,094 |
| Renter-Occupied | 1,502 (66.8%) | $85,208 |
| Average | 2,247 (100.0%) | $114,034 |
Occupancy by Householder Income Bracket in Dulles Town Center
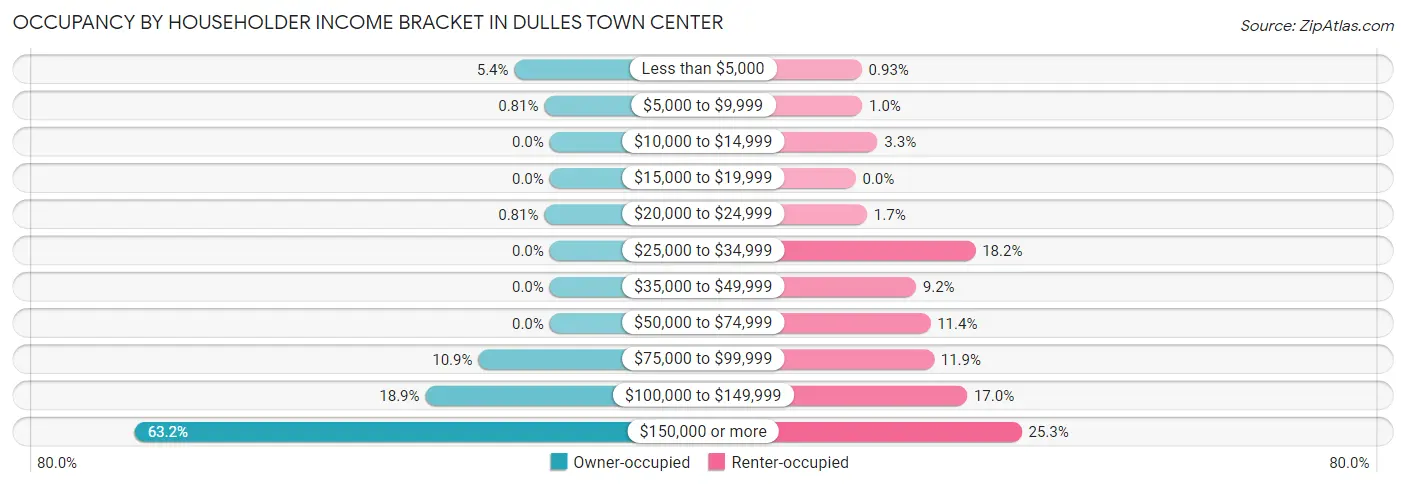
| Income Bracket | Owner-occupied | Renter-occupied |
| Less than $5,000 | 40 (5.4%) | 14 (0.9%) |
| $5,000 to $9,999 | 6 (0.8%) | 15 (1.0%) |
| $10,000 to $14,999 | 0 (0.0%) | 50 (3.3%) |
| $15,000 to $19,999 | 0 (0.0%) | 0 (0.0%) |
| $20,000 to $24,999 | 6 (0.8%) | 26 (1.7%) |
| $25,000 to $34,999 | 0 (0.0%) | 274 (18.2%) |
| $35,000 to $49,999 | 0 (0.0%) | 138 (9.2%) |
| $50,000 to $74,999 | 0 (0.0%) | 171 (11.4%) |
| $75,000 to $99,999 | 81 (10.9%) | 179 (11.9%) |
| $100,000 to $149,999 | 141 (18.9%) | 255 (17.0%) |
| $150,000 or more | 471 (63.2%) | 380 (25.3%) |
| Total | 745 (100.0%) | 1,502 (100.0%) |
Monthly Housing Cost Tiers in Dulles Town Center
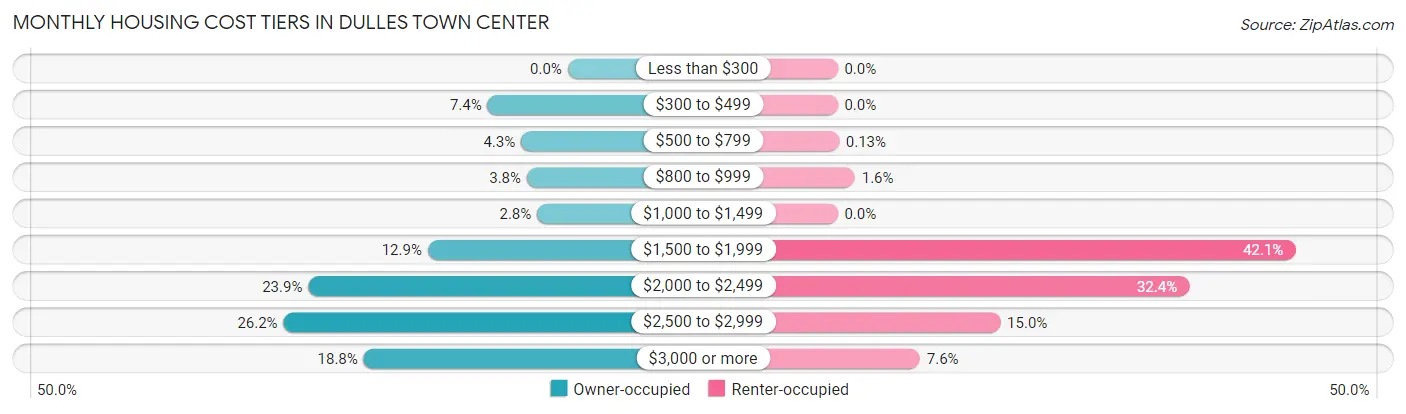
| Monthly Cost | Owner-occupied | Renter-occupied |
| Less than $300 | 0 (0.0%) | 0 (0.0%) |
| $300 to $499 | 55 (7.4%) | 0 (0.0%) |
| $500 to $799 | 32 (4.3%) | 2 (0.1%) |
| $800 to $999 | 28 (3.8%) | 24 (1.6%) |
| $1,000 to $1,499 | 21 (2.8%) | 0 (0.0%) |
| $1,500 to $1,999 | 96 (12.9%) | 633 (42.1%) |
| $2,000 to $2,499 | 178 (23.9%) | 486 (32.4%) |
| $2,500 to $2,999 | 195 (26.2%) | 225 (15.0%) |
| $3,000 or more | 140 (18.8%) | 114 (7.6%) |
| Total | 745 (100.0%) | 1,502 (100.0%) |
Physical Housing Characteristics in Dulles Town Center
Housing Structures in Dulles Town Center
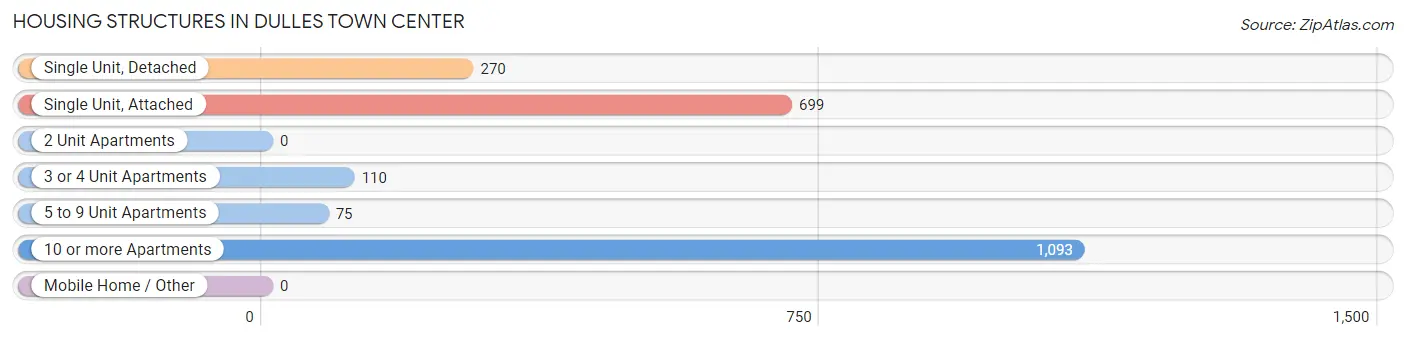
| Structure Type | # Housing Units | % Housing Units |
| Single Unit, Detached | 270 | 12.0% |
| Single Unit, Attached | 699 | 31.1% |
| 2 Unit Apartments | 0 | 0.0% |
| 3 or 4 Unit Apartments | 110 | 4.9% |
| 5 to 9 Unit Apartments | 75 | 3.3% |
| 10 or more Apartments | 1,093 | 48.6% |
| Mobile Home / Other | 0 | 0.0% |
| Total | 2,247 | 100.0% |
Housing Structures by Occupancy in Dulles Town Center
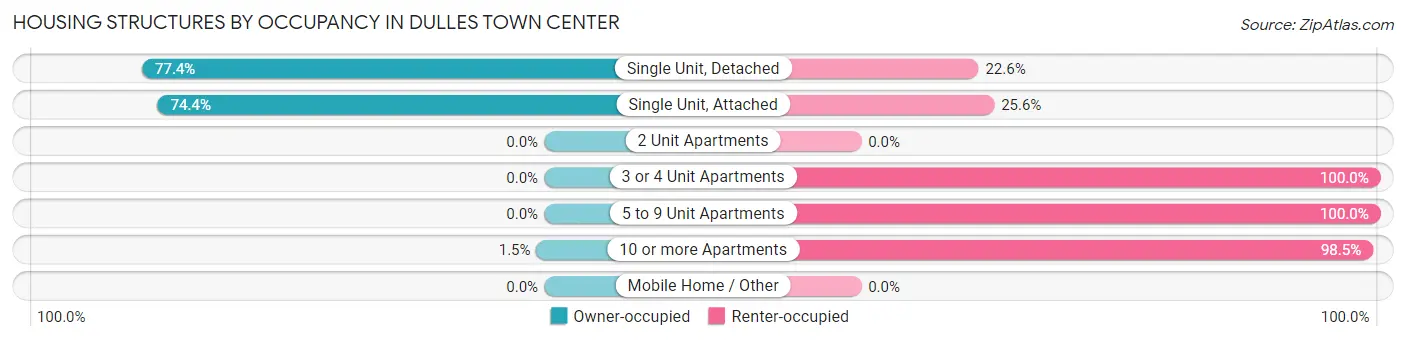
| Structure Type | Owner-occupied | Renter-occupied |
| Single Unit, Detached | 209 (77.4%) | 61 (22.6%) |
| Single Unit, Attached | 520 (74.4%) | 179 (25.6%) |
| 2 Unit Apartments | 0 (0.0%) | 0 (0.0%) |
| 3 or 4 Unit Apartments | 0 (0.0%) | 110 (100.0%) |
| 5 to 9 Unit Apartments | 0 (0.0%) | 75 (100.0%) |
| 10 or more Apartments | 16 (1.5%) | 1,077 (98.5%) |
| Mobile Home / Other | 0 (0.0%) | 0 (0.0%) |
| Total | 745 (33.2%) | 1,502 (66.8%) |
Housing Structures by Number of Rooms in Dulles Town Center
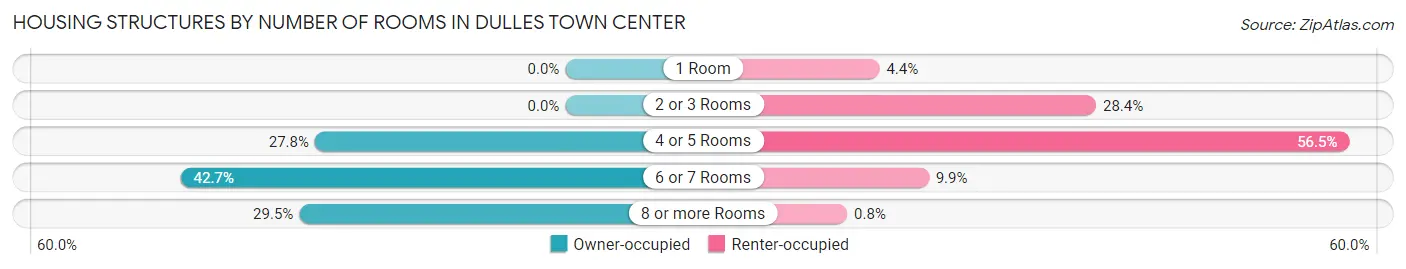
| Number of Rooms | Owner-occupied | Renter-occupied |
| 1 Room | 0 (0.0%) | 66 (4.4%) |
| 2 or 3 Rooms | 0 (0.0%) | 427 (28.4%) |
| 4 or 5 Rooms | 207 (27.8%) | 849 (56.5%) |
| 6 or 7 Rooms | 318 (42.7%) | 148 (9.9%) |
| 8 or more Rooms | 220 (29.5%) | 12 (0.8%) |
| Total | 745 (100.0%) | 1,502 (100.0%) |
Housing Structure by Heating Type in Dulles Town Center
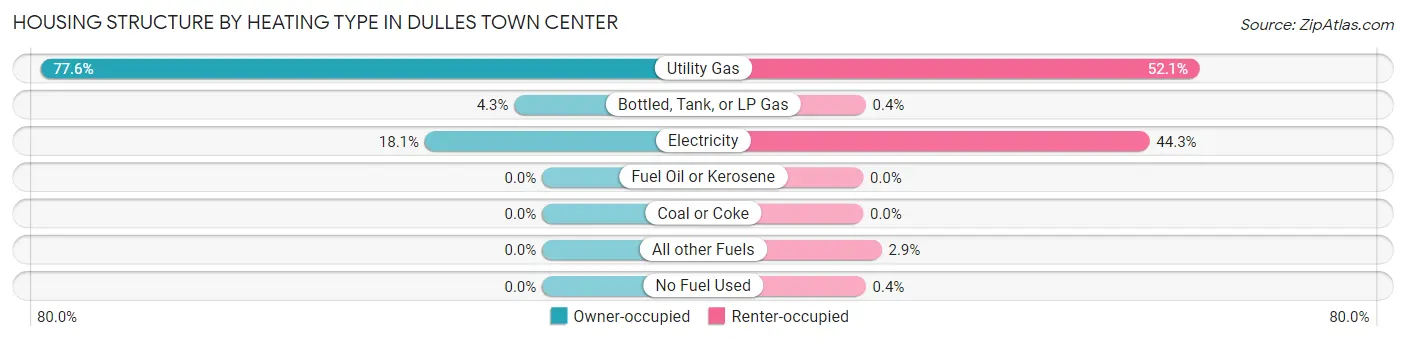
| Heating Type | Owner-occupied | Renter-occupied |
| Utility Gas | 578 (77.6%) | 782 (52.1%) |
| Bottled, Tank, or LP Gas | 32 (4.3%) | 6 (0.4%) |
| Electricity | 135 (18.1%) | 665 (44.3%) |
| Fuel Oil or Kerosene | 0 (0.0%) | 0 (0.0%) |
| Coal or Coke | 0 (0.0%) | 0 (0.0%) |
| All other Fuels | 0 (0.0%) | 43 (2.9%) |
| No Fuel Used | 0 (0.0%) | 6 (0.4%) |
| Total | 745 (100.0%) | 1,502 (100.0%) |
Household Vehicle Usage in Dulles Town Center
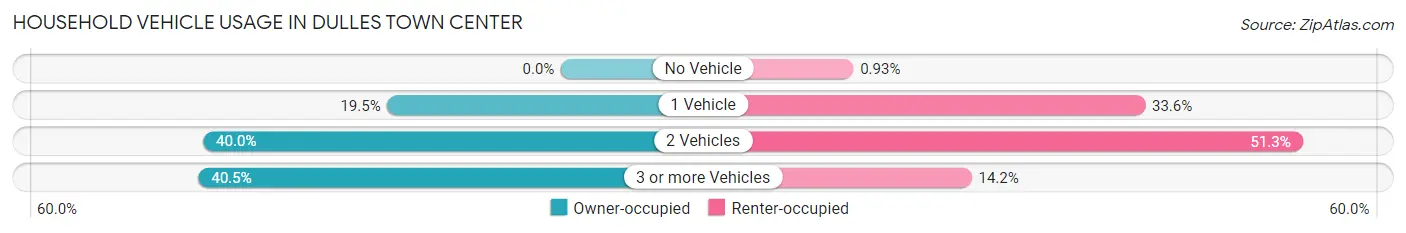
| Vehicles per Household | Owner-occupied | Renter-occupied |
| No Vehicle | 0 (0.0%) | 14 (0.9%) |
| 1 Vehicle | 145 (19.5%) | 505 (33.6%) |
| 2 Vehicles | 298 (40.0%) | 770 (51.3%) |
| 3 or more Vehicles | 302 (40.5%) | 213 (14.2%) |
| Total | 745 (100.0%) | 1,502 (100.0%) |
Real Estate & Mortgages in Dulles Town Center
Real Estate and Mortgage Overview in Dulles Town Center
| Characteristic | Without Mortgage | With Mortgage |
| Housing Units | 126 | 619 |
| Median Property Value | $405,000 | $580,000 |
| Median Household Income | - | - |
| Monthly Housing Costs | $650 | $140 |
| Real Estate Taxes | - | - |
Property Value by Mortgage Status in Dulles Town Center
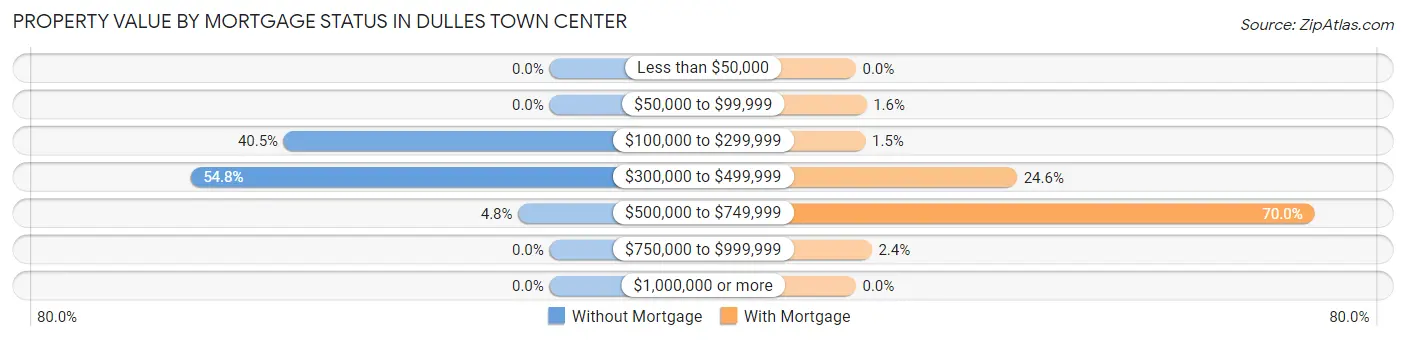
| Property Value | Without Mortgage | With Mortgage |
| Less than $50,000 | 0 (0.0%) | 0 (0.0%) |
| $50,000 to $99,999 | 0 (0.0%) | 10 (1.6%) |
| $100,000 to $299,999 | 51 (40.5%) | 9 (1.5%) |
| $300,000 to $499,999 | 69 (54.8%) | 152 (24.6%) |
| $500,000 to $749,999 | 6 (4.8%) | 433 (70.0%) |
| $750,000 to $999,999 | 0 (0.0%) | 15 (2.4%) |
| $1,000,000 or more | 0 (0.0%) | 0 (0.0%) |
| Total | 126 (100.0%) | 619 (100.0%) |
Household Income by Mortgage Status in Dulles Town Center
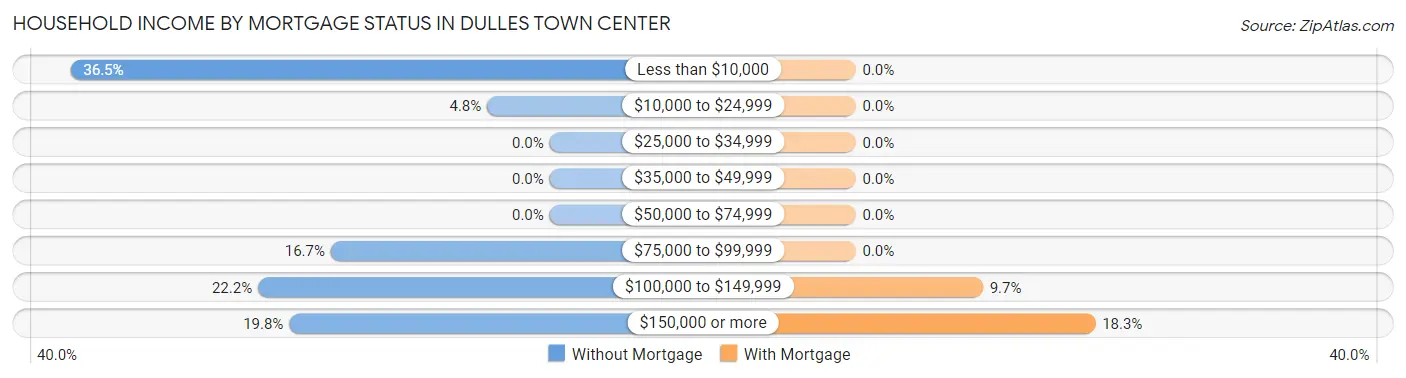
| Household Income | Without Mortgage | With Mortgage |
| Less than $10,000 | 46 (36.5%) | 0 (0.0%) |
| $10,000 to $24,999 | 6 (4.8%) | 0 (0.0%) |
| $25,000 to $34,999 | 0 (0.0%) | 0 (0.0%) |
| $35,000 to $49,999 | 0 (0.0%) | 0 (0.0%) |
| $50,000 to $74,999 | 0 (0.0%) | 0 (0.0%) |
| $75,000 to $99,999 | 21 (16.7%) | 0 (0.0%) |
| $100,000 to $149,999 | 28 (22.2%) | 60 (9.7%) |
| $150,000 or more | 25 (19.8%) | 113 (18.3%) |
| Total | 126 (100.0%) | 619 (100.0%) |
Property Value to Household Income Ratio in Dulles Town Center
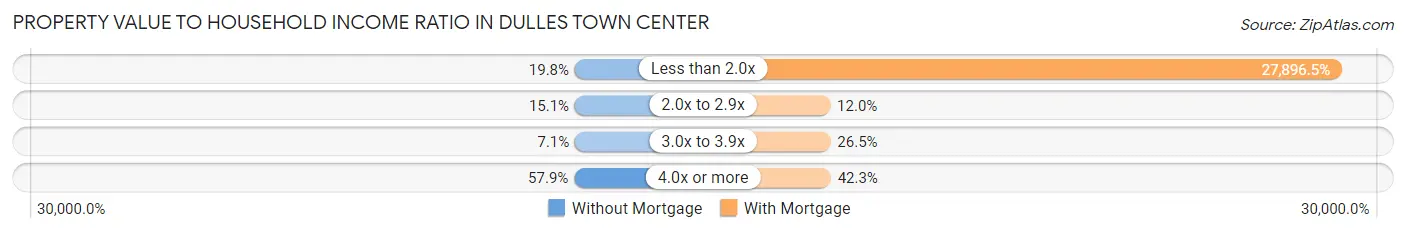
| Value-to-Income Ratio | Without Mortgage | With Mortgage |
| Less than 2.0x | 25 (19.8%) | 172,679 (27,896.4%) |
| 2.0x to 2.9x | 19 (15.1%) | 74 (11.9%) |
| 3.0x to 3.9x | 9 (7.1%) | 164 (26.5%) |
| 4.0x or more | 73 (57.9%) | 262 (42.3%) |
| Total | 126 (100.0%) | 619 (100.0%) |
Real Estate Taxes by Mortgage Status in Dulles Town Center
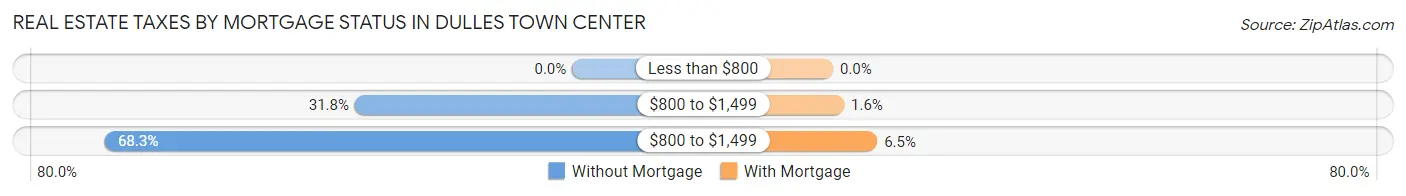
| Property Taxes | Without Mortgage | With Mortgage |
| Less than $800 | 0 (0.0%) | 0 (0.0%) |
| $800 to $1,499 | 40 (31.8%) | 10 (1.6%) |
| $800 to $1,499 | 86 (68.2%) | 40 (6.5%) |
| Total | 126 (100.0%) | 619 (100.0%) |
Health & Disability in Dulles Town Center
Health Insurance Coverage by Age in Dulles Town Center
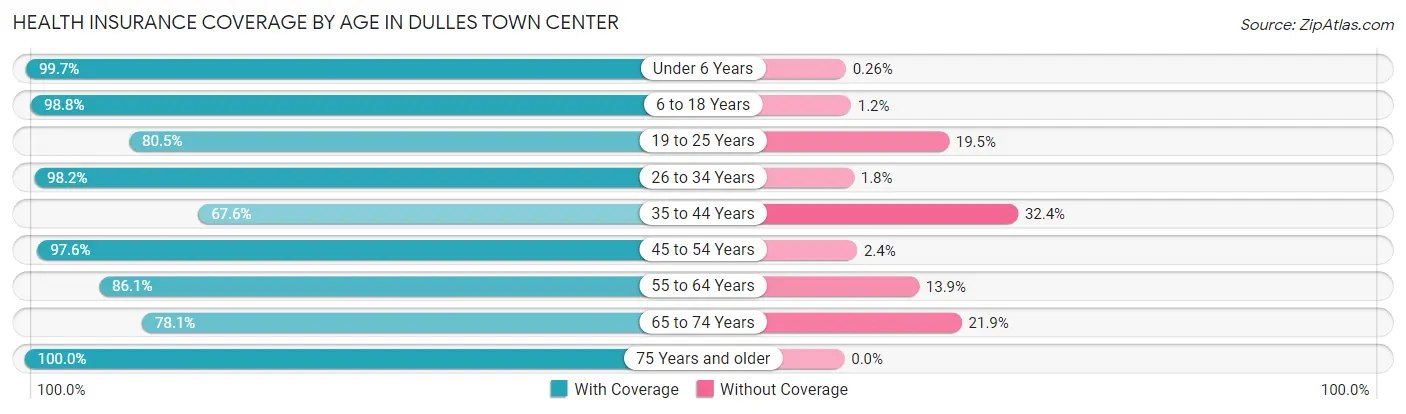
| Age Bracket | With Coverage | Without Coverage |
| Under 6 Years | 389 (99.7%) | 1 (0.3%) |
| 6 to 18 Years | 899 (98.8%) | 11 (1.2%) |
| 19 to 25 Years | 859 (80.5%) | 208 (19.5%) |
| 26 to 34 Years | 500 (98.2%) | 9 (1.8%) |
| 35 to 44 Years | 871 (67.6%) | 417 (32.4%) |
| 45 to 54 Years | 662 (97.6%) | 16 (2.4%) |
| 55 to 64 Years | 539 (86.1%) | 87 (13.9%) |
| 65 to 74 Years | 200 (78.1%) | 56 (21.9%) |
| 75 Years and older | 87 (100.0%) | 0 (0.0%) |
| Total | 5,006 (86.2%) | 805 (13.9%) |
Health Insurance Coverage by Citizenship Status in Dulles Town Center
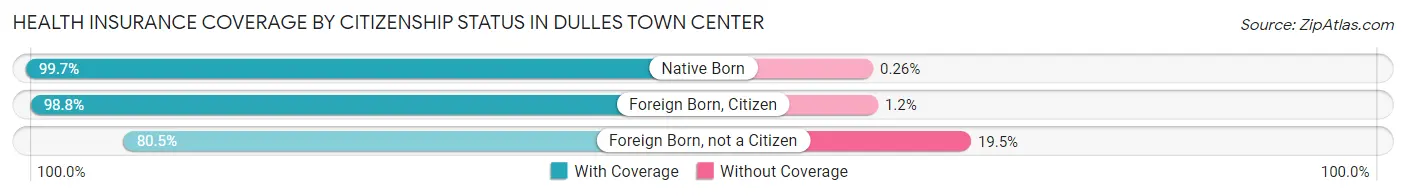
| Citizenship Status | With Coverage | Without Coverage |
| Native Born | 389 (99.7%) | 1 (0.3%) |
| Foreign Born, Citizen | 899 (98.8%) | 11 (1.2%) |
| Foreign Born, not a Citizen | 859 (80.5%) | 208 (19.5%) |
Health Insurance Coverage by Household Income in Dulles Town Center
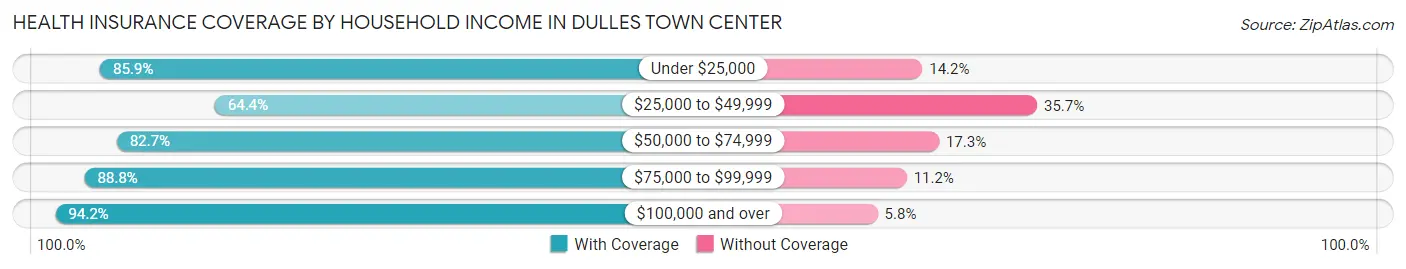
| Household Income | With Coverage | Without Coverage |
| Under $25,000 | 267 (85.9%) | 44 (14.1%) |
| $25,000 to $49,999 | 805 (64.3%) | 446 (35.6%) |
| $50,000 to $74,999 | 297 (82.7%) | 62 (17.3%) |
| $75,000 to $99,999 | 459 (88.8%) | 58 (11.2%) |
| $100,000 and over | 3,178 (94.2%) | 195 (5.8%) |
Public vs Private Health Insurance Coverage by Age in Dulles Town Center
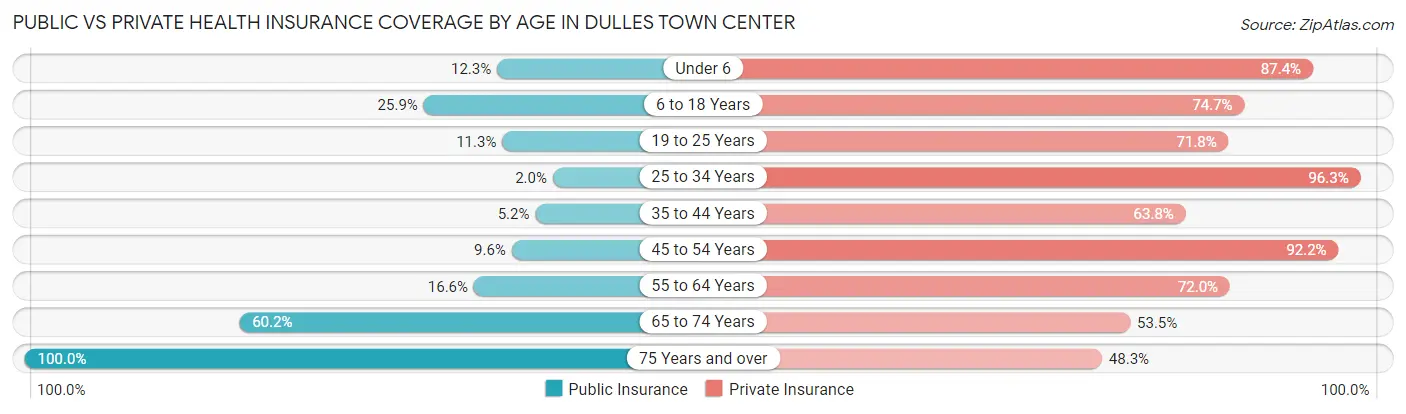
| Age Bracket | Public Insurance | Private Insurance |
| Under 6 | 48 (12.3%) | 341 (87.4%) |
| 6 to 18 Years | 236 (25.9%) | 680 (74.7%) |
| 19 to 25 Years | 121 (11.3%) | 766 (71.8%) |
| 25 to 34 Years | 10 (2.0%) | 490 (96.3%) |
| 35 to 44 Years | 67 (5.2%) | 822 (63.8%) |
| 45 to 54 Years | 65 (9.6%) | 625 (92.2%) |
| 55 to 64 Years | 104 (16.6%) | 451 (72.0%) |
| 65 to 74 Years | 154 (60.2%) | 137 (53.5%) |
| 75 Years and over | 87 (100.0%) | 42 (48.3%) |
| Total | 892 (15.3%) | 4,354 (74.9%) |
Disability Status by Sex by Age in Dulles Town Center
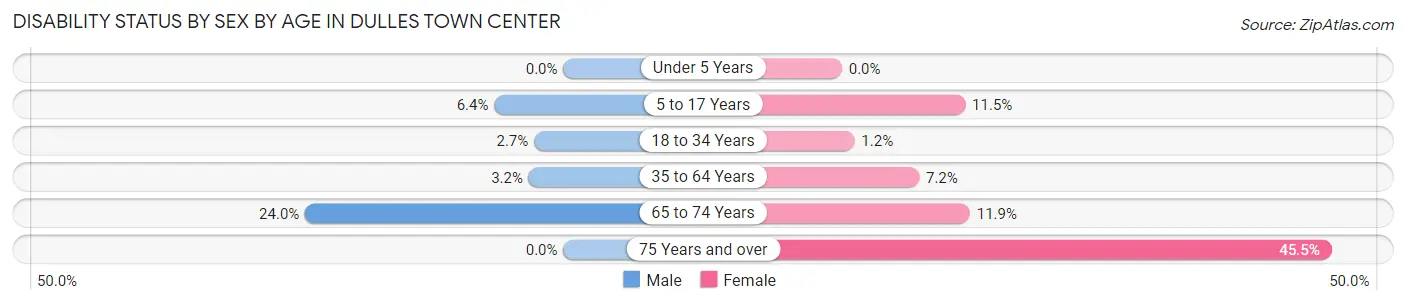
| Age Bracket | Male | Female |
| Under 5 Years | 0 (0.0%) | 0 (0.0%) |
| 5 to 17 Years | 36 (6.4%) | 41 (11.5%) |
| 18 to 34 Years | 22 (2.7%) | 9 (1.2%) |
| 35 to 64 Years | 46 (3.2%) | 83 (7.2%) |
| 65 to 74 Years | 23 (24.0%) | 19 (11.9%) |
| 75 Years and over | 0 (0.0%) | 30 (45.5%) |
Disability Class by Sex by Age in Dulles Town Center
Disability Class: Hearing Difficulty
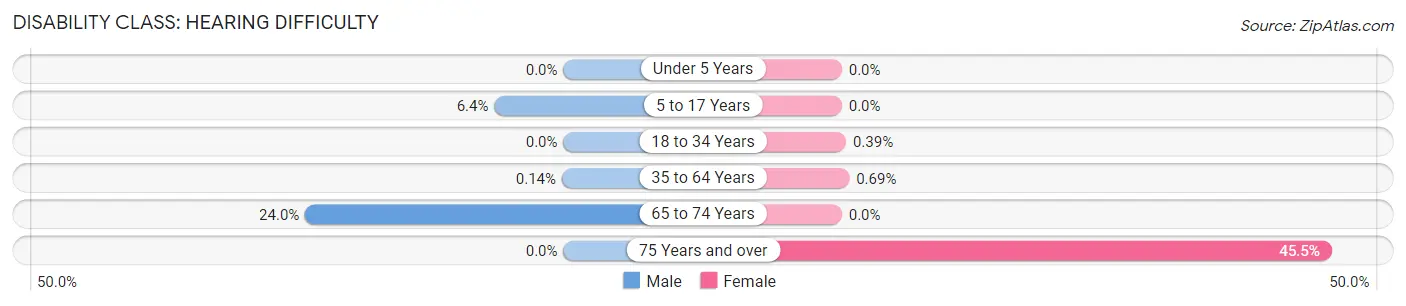
| Age Bracket | Male | Female |
| Under 5 Years | 0 (0.0%) | 0 (0.0%) |
| 5 to 17 Years | 36 (6.4%) | 0 (0.0%) |
| 18 to 34 Years | 0 (0.0%) | 3 (0.4%) |
| 35 to 64 Years | 2 (0.1%) | 8 (0.7%) |
| 65 to 74 Years | 23 (24.0%) | 0 (0.0%) |
| 75 Years and over | 0 (0.0%) | 30 (45.5%) |
Disability Class: Vision Difficulty
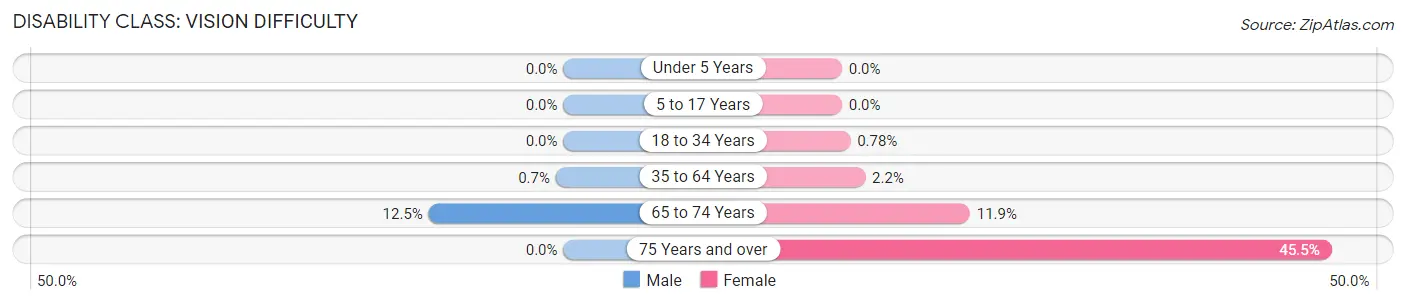
| Age Bracket | Male | Female |
| Under 5 Years | 0 (0.0%) | 0 (0.0%) |
| 5 to 17 Years | 0 (0.0%) | 0 (0.0%) |
| 18 to 34 Years | 0 (0.0%) | 6 (0.8%) |
| 35 to 64 Years | 10 (0.7%) | 25 (2.2%) |
| 65 to 74 Years | 12 (12.5%) | 19 (11.9%) |
| 75 Years and over | 0 (0.0%) | 30 (45.5%) |
Disability Class: Cognitive Difficulty
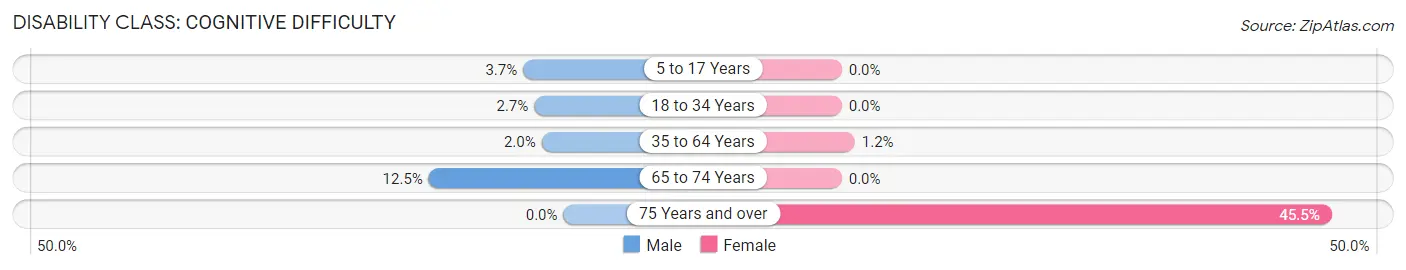
| Age Bracket | Male | Female |
| 5 to 17 Years | 21 (3.7%) | 0 (0.0%) |
| 18 to 34 Years | 22 (2.7%) | 0 (0.0%) |
| 35 to 64 Years | 29 (2.0%) | 14 (1.2%) |
| 65 to 74 Years | 12 (12.5%) | 0 (0.0%) |
| 75 Years and over | 0 (0.0%) | 30 (45.5%) |
Disability Class: Ambulatory Difficulty
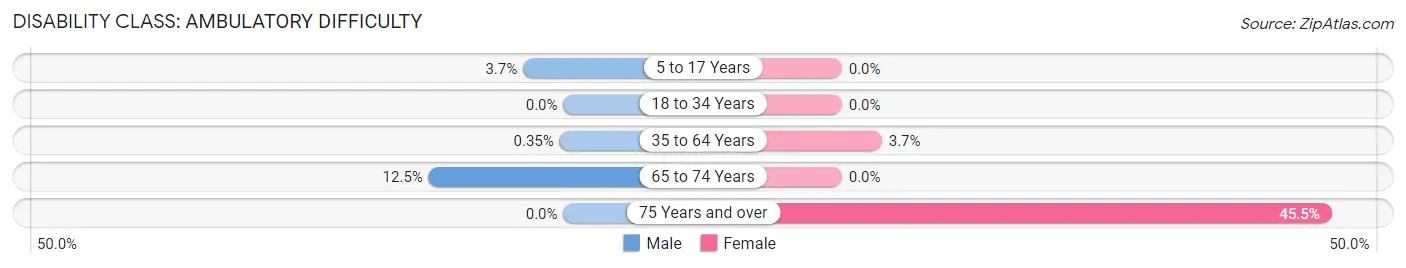
| Age Bracket | Male | Female |
| 5 to 17 Years | 21 (3.7%) | 0 (0.0%) |
| 18 to 34 Years | 0 (0.0%) | 0 (0.0%) |
| 35 to 64 Years | 5 (0.4%) | 43 (3.7%) |
| 65 to 74 Years | 12 (12.5%) | 0 (0.0%) |
| 75 Years and over | 0 (0.0%) | 30 (45.5%) |
Disability Class: Self-Care Difficulty
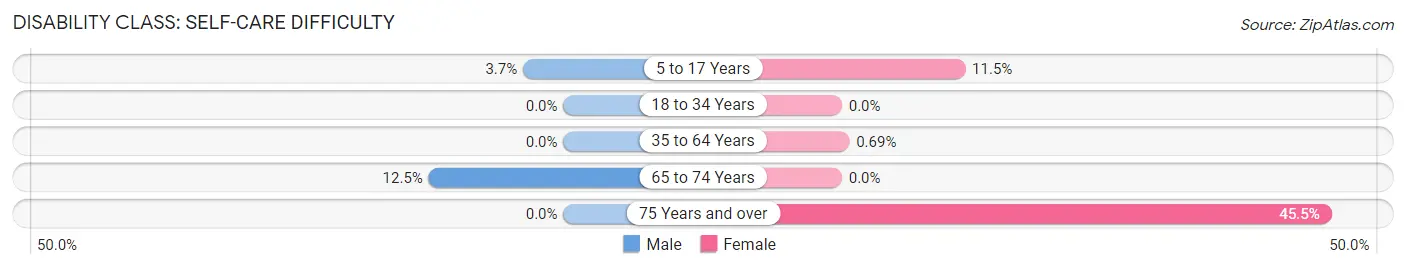
| Age Bracket | Male | Female |
| 5 to 17 Years | 21 (3.7%) | 41 (11.5%) |
| 18 to 34 Years | 0 (0.0%) | 0 (0.0%) |
| 35 to 64 Years | 0 (0.0%) | 8 (0.7%) |
| 65 to 74 Years | 12 (12.5%) | 0 (0.0%) |
| 75 Years and over | 0 (0.0%) | 30 (45.5%) |
Technology Access in Dulles Town Center
Computing Device Access in Dulles Town Center
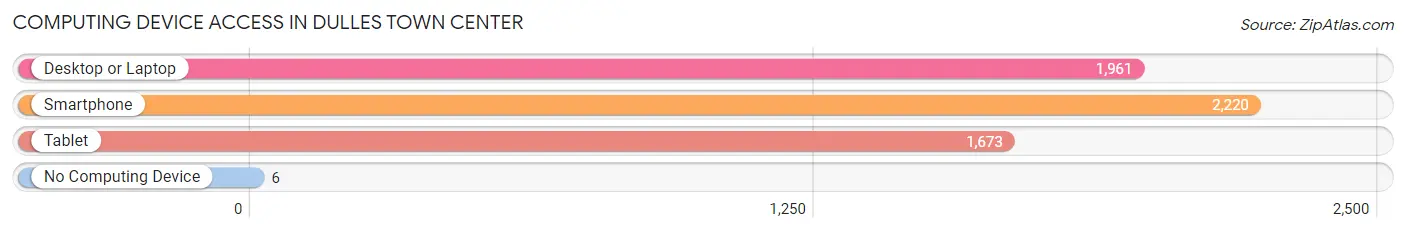
| Device Type | # Households | % Households |
| Desktop or Laptop | 1,961 | 87.3% |
| Smartphone | 2,220 | 98.8% |
| Tablet | 1,673 | 74.5% |
| No Computing Device | 6 | 0.3% |
| Total | 2,247 | 100.0% |
Internet Access in Dulles Town Center
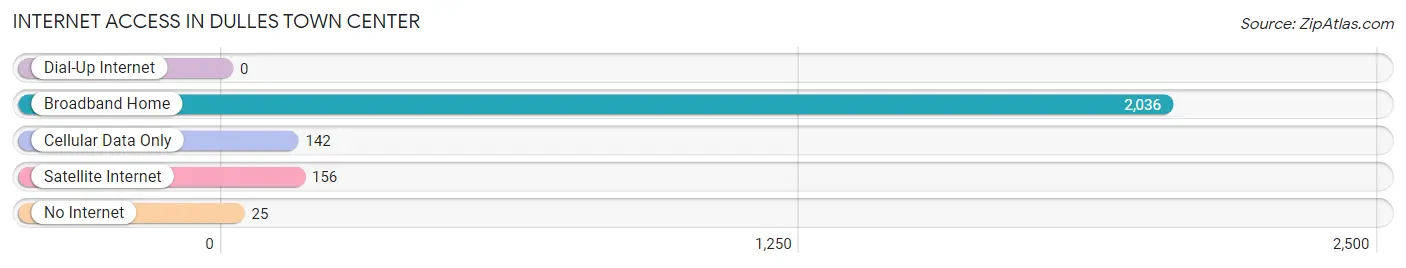
| Internet Type | # Households | % Households |
| Dial-Up Internet | 0 | 0.0% |
| Broadband Home | 2,036 | 90.6% |
| Cellular Data Only | 142 | 6.3% |
| Satellite Internet | 156 | 6.9% |
| No Internet | 25 | 1.1% |
| Total | 2,247 | 100.0% |
Dulles Town Center Summary
Dulles Town Center is a census-designated place (CDP) located in Loudoun County, Virginia. It is situated in the Dulles Technology Corridor, approximately 25 miles west of Washington, D.C. The CDP is home to a variety of businesses, including retail stores, restaurants, and entertainment venues.
History
Dulles Town Center was established in the late 1990s as part of the Dulles Technology Corridor. The area was originally part of the Dulles International Airport, which was built in 1962. The airport was a major factor in the development of the area, as it provided jobs and a convenient transportation hub.
In the late 1990s, the area was developed into a shopping center, with the opening of the Dulles Town Center Mall in 1998. The mall was the first of its kind in the area, and it quickly became a popular destination for shoppers.
In the early 2000s, the area was further developed with the addition of a variety of restaurants, entertainment venues, and other businesses. The area has since become a popular destination for both locals and visitors alike.
Geography
Dulles Town Center is located in Loudoun County, Virginia. It is situated in the Dulles Technology Corridor, approximately 25 miles west of Washington, D.C. The CDP is bordered by the Dulles International Airport to the north, the Dulles Town Center Mall to the east, and the Dulles Town Center Park to the south.
The area is characterized by rolling hills and wooded areas. The terrain is generally flat, with some areas of higher elevation. The climate is temperate, with hot summers and cold winters.
Economy
Dulles Town Center is home to a variety of businesses, including retail stores, restaurants, and entertainment venues. The area is also home to a number of corporate offices, including those of AOL, Verizon, and Northrop Grumman.
The area is also home to a number of government agencies, including the Federal Aviation Administration, the Department of Homeland Security, and the National Geospatial-Intelligence Agency.
Demographics
As of the 2010 census, the population of Dulles Town Center was 8,845. The population is predominantly white (83.3%), with smaller percentages of African American (7.2%), Asian (4.7%), and Hispanic or Latino (2.7%) residents.
The median household income in the area is $107,845, and the median home value is $521,000. The unemployment rate is 3.2%, which is lower than the national average.
Conclusion
Dulles Town Center is a census-designated place located in Loudoun County, Virginia. It is situated in the Dulles Technology Corridor, approximately 25 miles west of Washington, D.C. The area is home to a variety of businesses, including retail stores, restaurants, and entertainment venues. The population of Dulles Town Center is predominantly white, with a median household income of $107,845 and a median home value of $521,000. The area is also home to a number of government agencies and corporate offices.
Common Questions
What is the Total Population of Dulles Town Center?
Total Population of Dulles Town Center is 5,884.
What is the Total Male Population of Dulles Town Center?
Total Male Population of Dulles Town Center is 3,109.
What is the Total Female Population of Dulles Town Center?
Total Female Population of Dulles Town Center is 2,775.
What is the Ratio of Males per 100 Females in Dulles Town Center?
There are 112.04 Males per 100 Females in Dulles Town Center.
What is the Ratio of Females per 100 Males in Dulles Town Center?
There are 89.26 Females per 100 Males in Dulles Town Center.
What is the Median Population Age in Dulles Town Center?
Median Population Age in Dulles Town Center is 34.7 Years.
What is the Average Family Size in Dulles Town Center
Average Family Size in Dulles Town Center is 3.1 People.
What is the Average Household Size in Dulles Town Center
Average Household Size in Dulles Town Center is 2.6 People.
What is Per Capita Income in Dulles Town Center?
Per Capita income in Dulles Town Center is $50,758.
What is the Median Family Income in Dulles Town Center?
Median Family Income in Dulles Town Center is $118,528.
What is the Median Household income in Dulles Town Center?
Median Household Income in Dulles Town Center is $114,034.
What is Income or Wage Gap in Dulles Town Center?
Income or Wage Gap in Dulles Town Center is 12.3%.
Women in Dulles Town Center earn 87.7 cents for every dollar earned by a man.
What is Inequality or Gini Index in Dulles Town Center?
Inequality or Gini Index in Dulles Town Center is 0.41.
How Large is the Labor Force in Dulles Town Center?
There are 3,879 People in the Labor Forcein in Dulles Town Center.
What is the Percentage of People in the Labor Force in Dulles Town Center?
83.0% of People are in the Labor Force in Dulles Town Center.
What is the Unemployment Rate in Dulles Town Center?
Unemployment Rate in Dulles Town Center is 4.1%.