Cities with the Most Immigrants from Western Africa in Kansas
RELATED REPORTS & OPTIONS
Western Africa
Kansas
Compare Cities
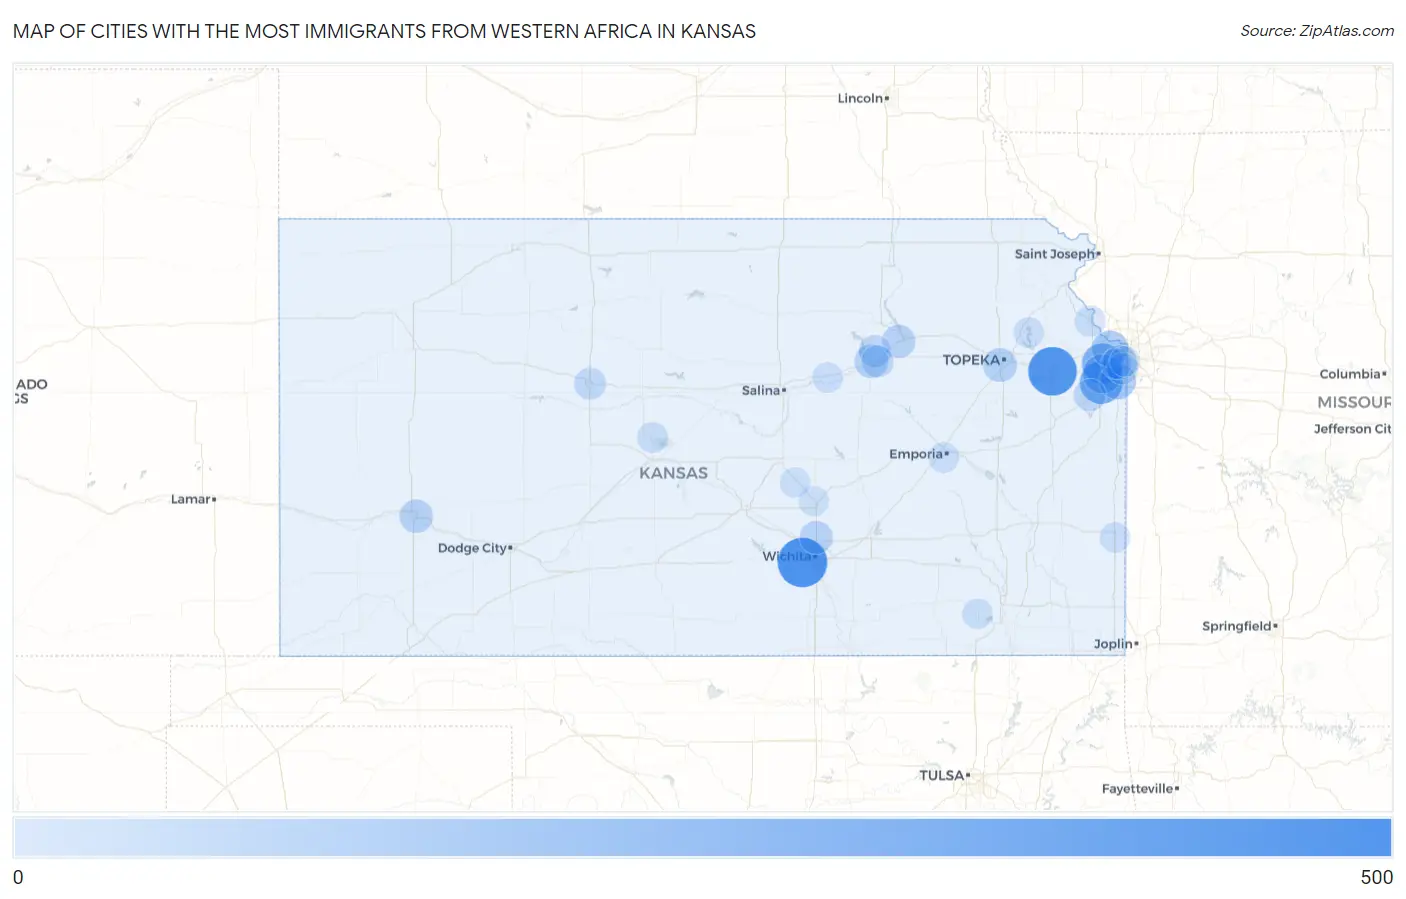
Map of Cities with the Most Immigrants from Western Africa in Kansas
0
500
Cities with the Most Immigrants from Western Africa in Kansas
| City | Western Africa | vs State | vs National | |
| 1. | Wichita | 415 | 2,542(16.33%)#1 | 985,560(0.04%)#338 |
| 2. | Lawrence | 394 | 2,542(15.50%)#2 | 985,560(0.04%)#359 |
| 3. | Olathe | 269 | 2,542(10.58%)#3 | 985,560(0.03%)#517 |
| 4. | Shawnee | 232 | 2,542(9.13%)#4 | 985,560(0.02%)#588 |
| 5. | Lenexa | 187 | 2,542(7.36%)#5 | 985,560(0.02%)#690 |
| 6. | Overland Park | 127 | 2,542(5.00%)#6 | 985,560(0.01%)#938 |
| 7. | Kansas City | 127 | 2,542(5.00%)#7 | 985,560(0.01%)#939 |
| 8. | Mission | 86 | 2,542(3.38%)#8 | 985,560(0.01%)#1,206 |
| 9. | Topeka | 75 | 2,542(2.95%)#9 | 985,560(0.01%)#1,304 |
| 10. | Garden City | 70 | 2,542(2.75%)#10 | 985,560(0.01%)#1,357 |
| 11. | Junction City | 70 | 2,542(2.75%)#11 | 985,560(0.01%)#1,358 |
| 12. | Manhattan | 63 | 2,542(2.48%)#12 | 985,560(0.01%)#1,449 |
| 13. | Park City | 61 | 2,542(2.40%)#13 | 985,560(0.01%)#1,488 |
| 14. | Gardner | 42 | 2,542(1.65%)#14 | 985,560(0.00%)#1,787 |
| 15. | Fort Riley | 42 | 2,542(1.65%)#15 | 985,560(0.00%)#1,801 |
| 16. | Grandview Plaza | 41 | 2,542(1.61%)#16 | 985,560(0.00%)#1,832 |
| 17. | Hays | 34 | 2,542(1.34%)#17 | 985,560(0.00%)#1,968 |
| 18. | Prairie Village | 24 | 2,542(0.94%)#18 | 985,560(0.00%)#2,234 |
| 19. | Leavenworth | 17 | 2,542(0.67%)#19 | 985,560(0.00%)#2,488 |
| 20. | Hoisington | 11 | 2,542(0.43%)#20 | 985,560(0.00%)#2,844 |
| 21. | Emporia | 10 | 2,542(0.39%)#21 | 985,560(0.00%)#2,863 |
| 22. | Merriam | 10 | 2,542(0.39%)#22 | 985,560(0.00%)#2,877 |
| 23. | Fort Scott | 5 | 2,542(0.20%)#23 | 985,560(0.00%)#3,186 |
| 24. | Elk City | 5 | 2,542(0.20%)#24 | 985,560(0.00%)#3,224 |
| 25. | Abilene | 4 | 2,542(0.16%)#25 | 985,560(0.00%)#3,253 |
| 26. | Westwood | 4 | 2,542(0.16%)#26 | 985,560(0.00%)#3,274 |
| 27. | Ozawkie | 4 | 2,542(0.16%)#27 | 985,560(0.00%)#3,291 |
| 28. | North Newton | 1 | 2,542(0.04%)#28 | 985,560(0.00%)#3,481 |
| 29. | Moundridge | 1 | 2,542(0.04%)#29 | 985,560(0.00%)#3,484 |
Common Questions
What are the Top 10 Cities with the Most Immigrants from Western Africa in Kansas?
Top 10 Cities with the Most Immigrants from Western Africa in Kansas are:
#1
415
#2
394
#3
269
#4
232
#5
187
#6
127
#7
127
#8
86
#9
75
#10
70
What city has the Most Immigrants from Western Africa in Kansas?
Wichita has the Most Immigrants from Western Africa in Kansas with 415.
What is the Total Immigrants from Western Africa in the State of Kansas?
Total Immigrants from Western Africa in Kansas is 2,542.
What is the Total Immigrants from Western Africa in the United States?
Total Immigrants from Western Africa in the United States is 985,560.