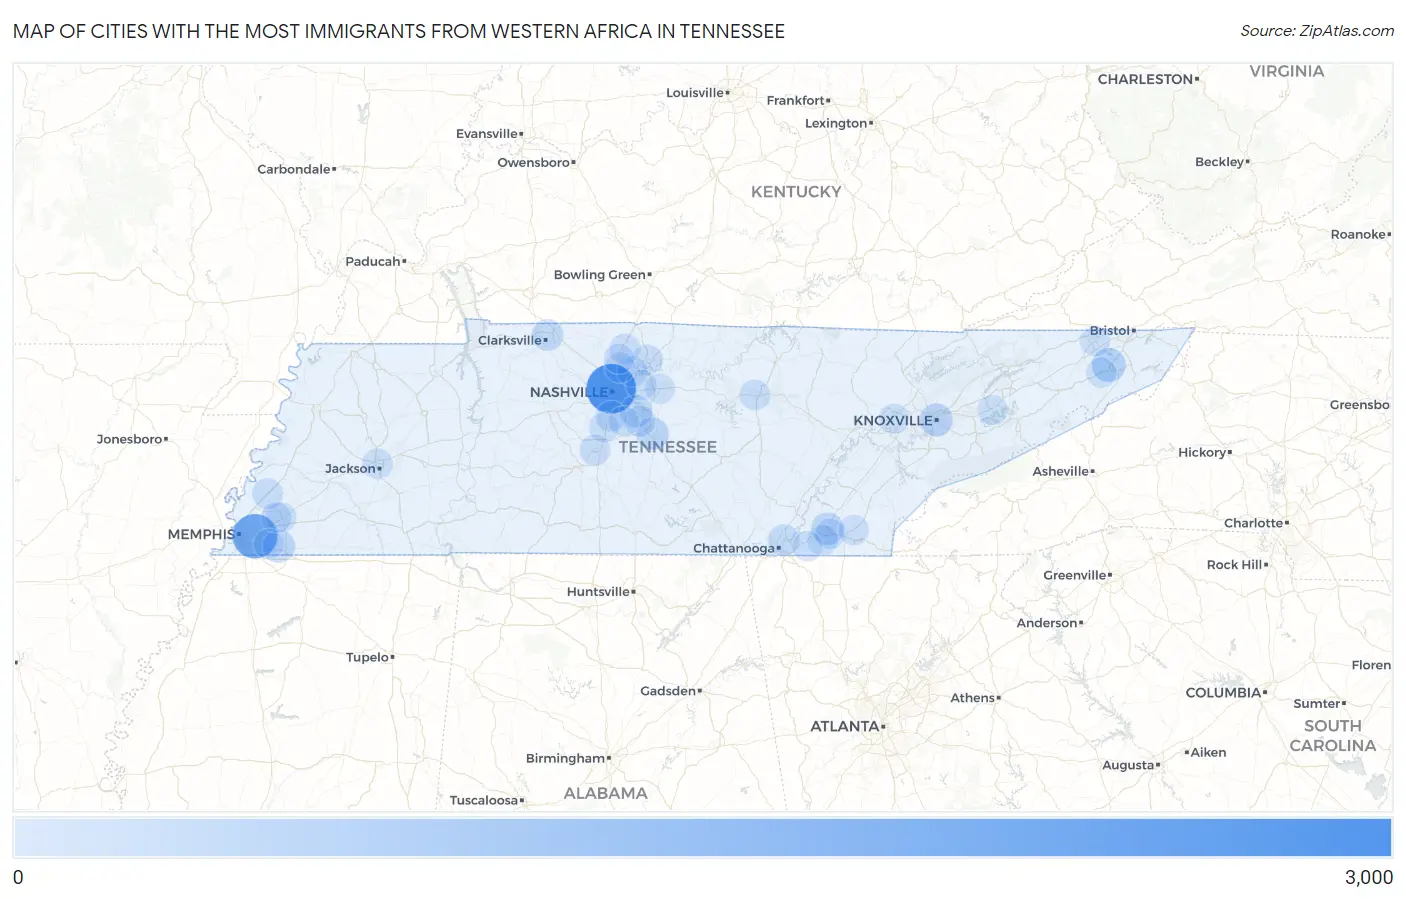
Cities with the Most Immigrants from Western Africa in Tennessee
RELATED REPORTS & OPTIONS
Western Africa
Tennessee
Compare Cities
Map of Cities with the Most Immigrants from Western Africa in Tennessee
0
3,000
Cities with the Most Immigrants from Western Africa in Tennessee
| City | Western Africa | vs State | vs National | |
| 1. | Nashville | 2,704 | 9,484(28.51%)#1 | 985,560(0.27%)#35 |
| 2. | Memphis | 2,004 | 9,484(21.13%)#2 | 985,560(0.20%)#60 |
| 3. | Johnson City | 487 | 9,484(5.13%)#3 | 985,560(0.05%)#293 |
| 4. | Knoxville | 372 | 9,484(3.92%)#4 | 985,560(0.04%)#382 |
| 5. | Collierville | 324 | 9,484(3.42%)#5 | 985,560(0.03%)#429 |
| 6. | Murfreesboro | 300 | 9,484(3.16%)#6 | 985,560(0.03%)#461 |
| 7. | Cleveland | 291 | 9,484(3.07%)#7 | 985,560(0.03%)#475 |
| 8. | La Vergne | 238 | 9,484(2.51%)#8 | 985,560(0.02%)#574 |
| 9. | Clarksville | 182 | 9,484(1.92%)#9 | 985,560(0.02%)#702 |
| 10. | Chattanooga | 150 | 9,484(1.58%)#10 | 985,560(0.02%)#831 |
| 11. | Smyrna | 129 | 9,484(1.36%)#11 | 985,560(0.01%)#929 |
| 12. | Brentwood | 95 | 9,484(1.00%)#12 | 985,560(0.01%)#1,128 |
| 13. | Gallatin | 93 | 9,484(0.98%)#13 | 985,560(0.01%)#1,136 |
| 14. | Spring Hill | 80 | 9,484(0.84%)#14 | 985,560(0.01%)#1,252 |
| 15. | Atoka | 77 | 9,484(0.81%)#15 | 985,560(0.01%)#1,293 |
| 16. | Cookeville | 72 | 9,484(0.76%)#16 | 985,560(0.01%)#1,333 |
| 17. | Hendersonville | 64 | 9,484(0.67%)#17 | 985,560(0.01%)#1,433 |
| 18. | Mount Juliet | 59 | 9,484(0.62%)#18 | 985,560(0.01%)#1,510 |
| 19. | White House | 52 | 9,484(0.55%)#19 | 985,560(0.01%)#1,612 |
| 20. | South Cleveland | 52 | 9,484(0.55%)#20 | 985,560(0.01%)#1,615 |
| 21. | Arlington | 45 | 9,484(0.47%)#21 | 985,560(0.00%)#1,730 |
| 22. | Goodlettsville | 42 | 9,484(0.44%)#22 | 985,560(0.00%)#1,790 |
| 23. | Lakeland | 39 | 9,484(0.41%)#23 | 985,560(0.00%)#1,868 |
| 24. | Jackson | 36 | 9,484(0.38%)#24 | 985,560(0.00%)#1,928 |
| 25. | East Cleveland | 25 | 9,484(0.26%)#25 | 985,560(0.00%)#2,222 |
| 26. | Germantown | 22 | 9,484(0.23%)#26 | 985,560(0.00%)#2,284 |
| 27. | Millersville | 18 | 9,484(0.19%)#27 | 985,560(0.00%)#2,465 |
| 28. | Jonesborough | 12 | 9,484(0.13%)#28 | 985,560(0.00%)#2,789 |
| 29. | Franklin | 10 | 9,484(0.11%)#29 | 985,560(0.00%)#2,857 |
| 30. | Nolensville | 10 | 9,484(0.11%)#30 | 985,560(0.00%)#2,873 |
| 31. | Collegedale | 8 | 9,484(0.08%)#31 | 985,560(0.00%)#3,002 |
| 32. | Lynchburg | 8 | 9,484(0.08%)#32 | 985,560(0.00%)#3,011 |
| 33. | Kingsport | 7 | 9,484(0.07%)#33 | 985,560(0.00%)#3,036 |
| 34. | Oak Ridge | 7 | 9,484(0.07%)#34 | 985,560(0.00%)#3,046 |
| 35. | Dandridge | 6 | 9,484(0.06%)#35 | 985,560(0.00%)#3,142 |
| 36. | Benton | 5 | 9,484(0.05%)#36 | 985,560(0.00%)#3,210 |
| 37. | Lebanon | 3 | 9,484(0.03%)#37 | 985,560(0.00%)#3,304 |
Common Questions
What are the Top 10 Cities with the Most Immigrants from Western Africa in Tennessee?
Top 10 Cities with the Most Immigrants from Western Africa in Tennessee are:
#1
2,704
#2
2,004
#3
487
#4
372
#5
324
#6
300
#7
291
#8
238
#9
182
#10
150
What city has the Most Immigrants from Western Africa in Tennessee?
Nashville has the Most Immigrants from Western Africa in Tennessee with 2,704.
What is the Total Immigrants from Western Africa in the State of Tennessee?
Total Immigrants from Western Africa in Tennessee is 9,484.
What is the Total Immigrants from Western Africa in the United States?
Total Immigrants from Western Africa in the United States is 985,560.