Woodcreek, TX
Woodcreek Map
Woodcreek Overview
2,389
TOTAL POPULATION
1,108
MALE POPULATION
1,281
FEMALE POPULATION
86.49
MALES / 100 FEMALES
115.61
FEMALES / 100 MALES
51.9
MEDIAN AGE
2.9
AVG FAMILY SIZE
2.1
AVG HOUSEHOLD SIZE
$41,426
PER CAPITA INCOME
$100,729
AVG FAMILY INCOME
$80,227
AVG HOUSEHOLD INCOME
0.39
INEQUALITY / GINI INDEX
1,060
LABOR FORCE [ PEOPLE ]
53.5%
PERCENT IN LABOR FORCE
16.7%
UNEMPLOYMENT RATE
Woodcreek Area Codes
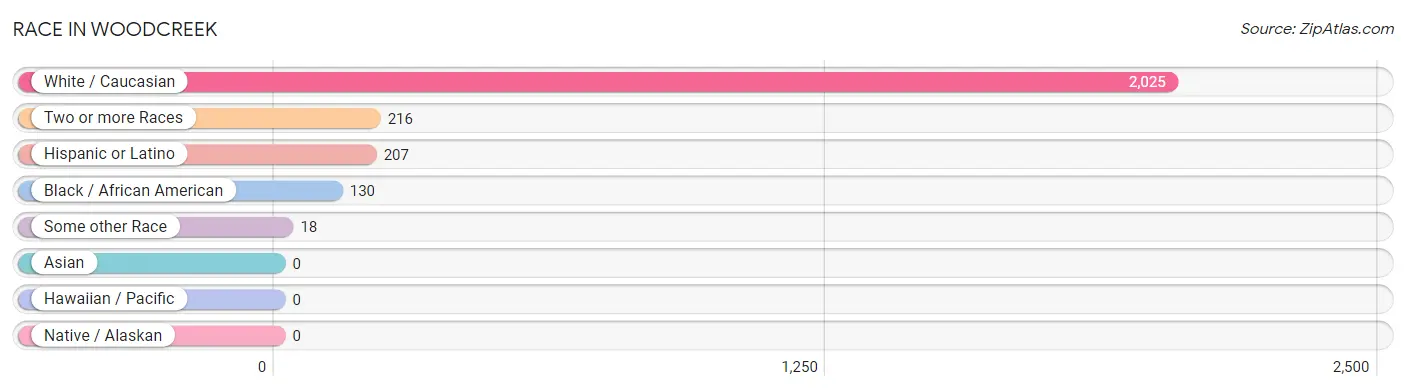
Race in Woodcreek
The most populous races in Woodcreek are White / Caucasian (2,025 | 84.8%), Two or more Races (216 | 9.0%), and Hispanic or Latino (207 | 8.7%).
| Race | # Population | % Population |
| Asian | 0 | 0.0% |
| Black / African American | 130 | 5.4% |
| Hawaiian / Pacific | 0 | 0.0% |
| Hispanic or Latino | 207 | 8.7% |
| Native / Alaskan | 0 | 0.0% |
| White / Caucasian | 2,025 | 84.8% |
| Two or more Races | 216 | 9.0% |
| Some other Race | 18 | 0.7% |
| Total | 2,389 | 100.0% |
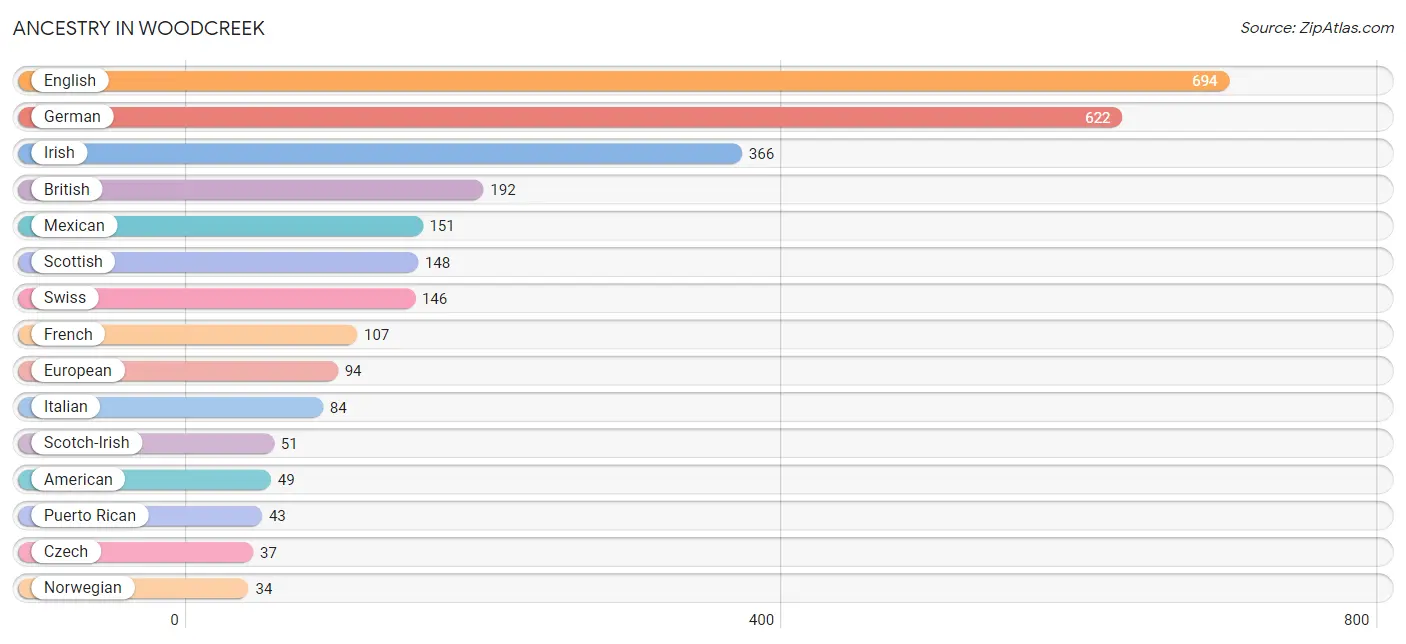
Ancestry in Woodcreek
The most populous ancestries reported in Woodcreek are English (694 | 29.0%), German (622 | 26.0%), Irish (366 | 15.3%), British (192 | 8.0%), and Mexican (151 | 6.3%), together accounting for 84.8% of all Woodcreek residents.
| Ancestry | # Population | % Population |
| American | 49 | 2.1% |
| Arab | 9 | 0.4% |
| Armenian | 13 | 0.5% |
| British | 192 | 8.0% |
| Cherokee | 32 | 1.3% |
| Choctaw | 23 | 1.0% |
| Czech | 37 | 1.5% |
| Danish | 6 | 0.3% |
| Dutch | 23 | 1.0% |
| English | 694 | 29.0% |
| European | 94 | 3.9% |
| French | 107 | 4.5% |
| German | 622 | 26.0% |
| Iranian | 14 | 0.6% |
| Irish | 366 | 15.3% |
| Italian | 84 | 3.5% |
| Lebanese | 9 | 0.4% |
| Mexican | 151 | 6.3% |
| Northern European | 11 | 0.5% |
| Norwegian | 34 | 1.4% |
| Paraguayan | 3 | 0.1% |
| Polish | 7 | 0.3% |
| Puerto Rican | 43 | 1.8% |
| Scandinavian | 25 | 1.1% |
| Scotch-Irish | 51 | 2.1% |
| Scottish | 148 | 6.2% |
| South African | 5 | 0.2% |
| South American | 3 | 0.1% |
| Subsaharan African | 5 | 0.2% |
| Swiss | 146 | 6.1% |
| Turkish | 2 | 0.1% |
| Welsh | 4 | 0.2% | View All 32 Rows |
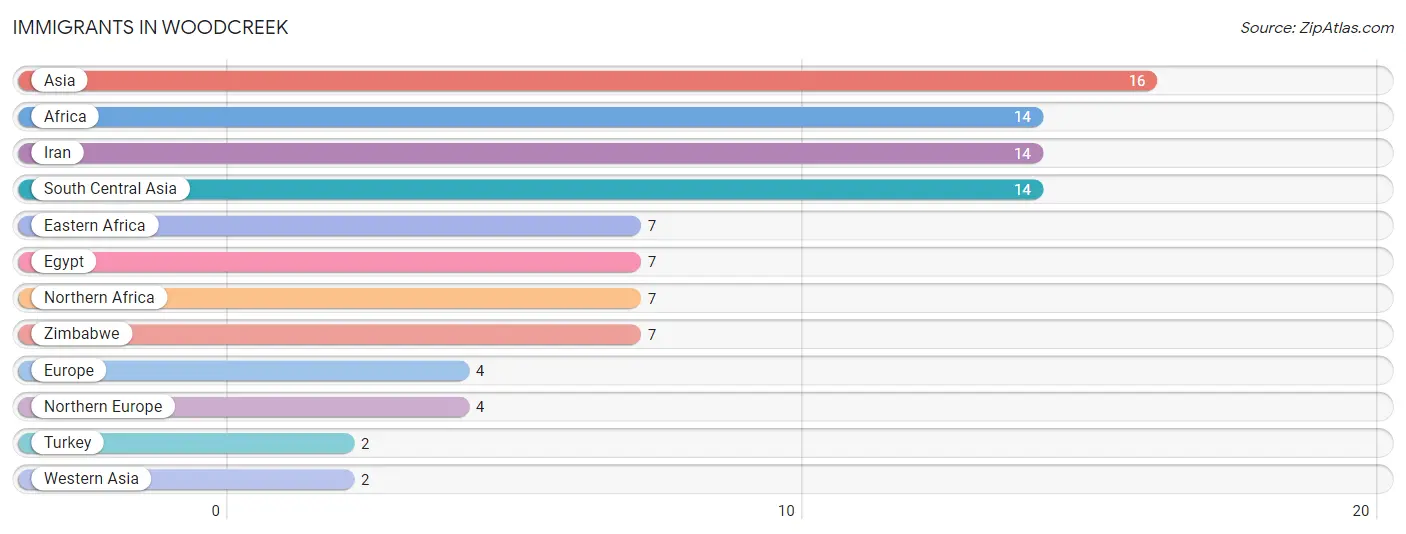
Immigrants in Woodcreek
The most numerous immigrant groups reported in Woodcreek came from Asia (16 | 0.7%), Africa (14 | 0.6%), Iran (14 | 0.6%), South Central Asia (14 | 0.6%), and Eastern Africa (7 | 0.3%), together accounting for 2.7% of all Woodcreek residents.
| Immigration Origin | # Population | % Population |
| Africa | 14 | 0.6% |
| Asia | 16 | 0.7% |
| Eastern Africa | 7 | 0.3% |
| Egypt | 7 | 0.3% |
| Europe | 4 | 0.2% |
| Iran | 14 | 0.6% |
| Northern Africa | 7 | 0.3% |
| Northern Europe | 4 | 0.2% |
| South Central Asia | 14 | 0.6% |
| Turkey | 2 | 0.1% |
| Western Asia | 2 | 0.1% |
| Zimbabwe | 7 | 0.3% | View All 12 Rows |
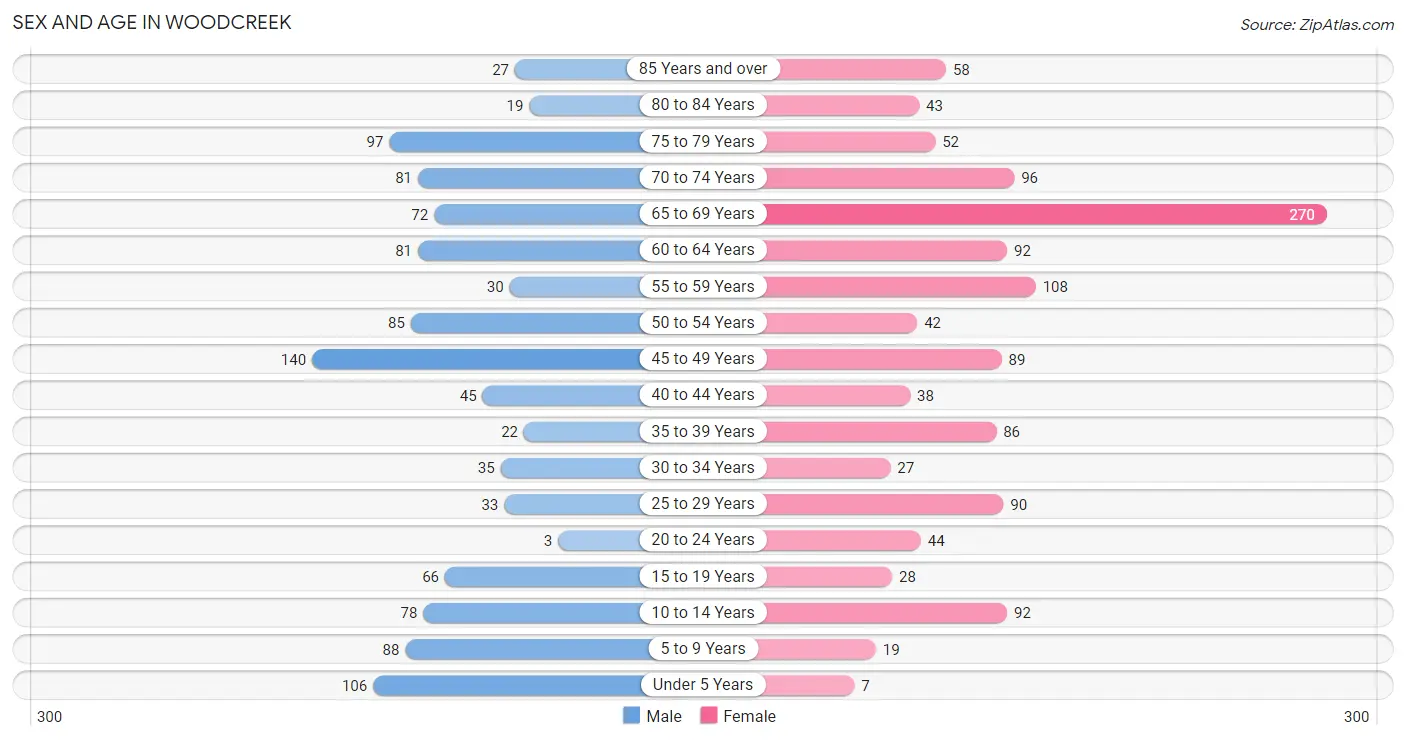
Sex and Age in Woodcreek
Sex and Age in Woodcreek
The most populous age groups in Woodcreek are 45 to 49 Years (140 | 12.6%) for men and 65 to 69 Years (270 | 21.1%) for women.
| Age Bracket | Male | Female |
| Under 5 Years | 106 (9.6%) | 7 (0.5%) |
| 5 to 9 Years | 88 (7.9%) | 19 (1.5%) |
| 10 to 14 Years | 78 (7.0%) | 92 (7.2%) |
| 15 to 19 Years | 66 (6.0%) | 28 (2.2%) |
| 20 to 24 Years | 3 (0.3%) | 44 (3.4%) |
| 25 to 29 Years | 33 (3.0%) | 90 (7.0%) |
| 30 to 34 Years | 35 (3.2%) | 27 (2.1%) |
| 35 to 39 Years | 22 (2.0%) | 86 (6.7%) |
| 40 to 44 Years | 45 (4.1%) | 38 (3.0%) |
| 45 to 49 Years | 140 (12.6%) | 89 (7.0%) |
| 50 to 54 Years | 85 (7.7%) | 42 (3.3%) |
| 55 to 59 Years | 30 (2.7%) | 108 (8.4%) |
| 60 to 64 Years | 81 (7.3%) | 92 (7.2%) |
| 65 to 69 Years | 72 (6.5%) | 270 (21.1%) |
| 70 to 74 Years | 81 (7.3%) | 96 (7.5%) |
| 75 to 79 Years | 97 (8.7%) | 52 (4.1%) |
| 80 to 84 Years | 19 (1.7%) | 43 (3.4%) |
| 85 Years and over | 27 (2.4%) | 58 (4.5%) |
| Total | 1,108 (100.0%) | 1,281 (100.0%) |
Families and Households in Woodcreek
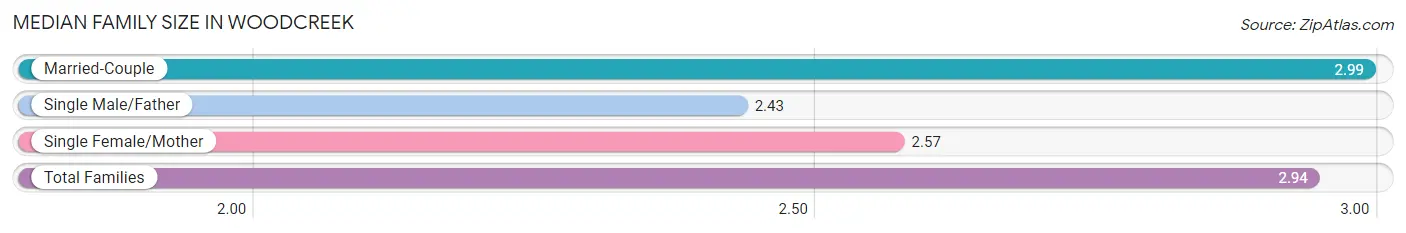
Median Family Size in Woodcreek
The median family size in Woodcreek is 2.94 persons per family, with married-couple families (536 | 89.5%) accounting for the largest median family size of 2.99 persons per family. On the other hand, single male/father families (14 | 2.3%) represent the smallest median family size with 2.43 persons per family.
| Family Type | # Families | Family Size |
| Married-Couple | 536 (89.5%) | 2.99 |
| Single Male/Father | 14 (2.3%) | 2.43 |
| Single Female/Mother | 49 (8.2%) | 2.57 |
| Total Families | 599 (100.0%) | 2.94 |
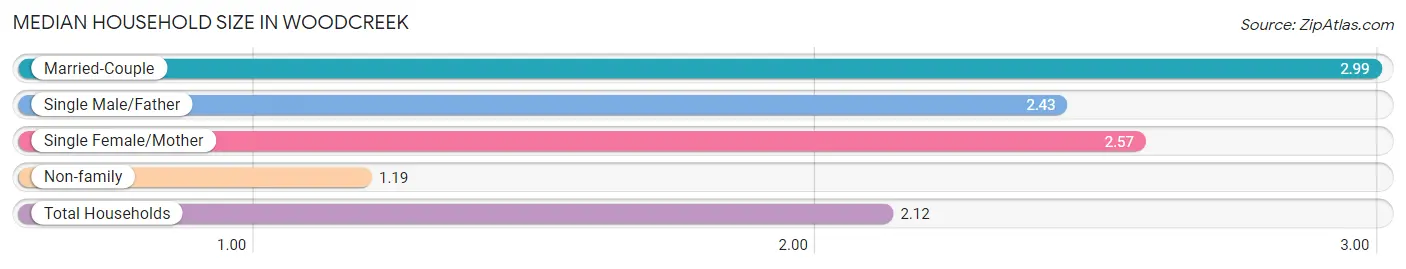
Median Household Size in Woodcreek
The median household size in Woodcreek is 2.12 persons per household, with married-couple households (536 | 47.5%) accounting for the largest median household size of 2.99 persons per household. non-family households (529 | 46.9%) represent the smallest median household size with 1.19 persons per household.
| Household Type | # Households | Household Size |
| Married-Couple | 536 (47.5%) | 2.99 |
| Single Male/Father | 14 (1.2%) | 2.43 |
| Single Female/Mother | 49 (4.3%) | 2.57 |
| Non-family | 529 (46.9%) | 1.19 |
| Total Households | 1,128 (100.0%) | 2.12 |
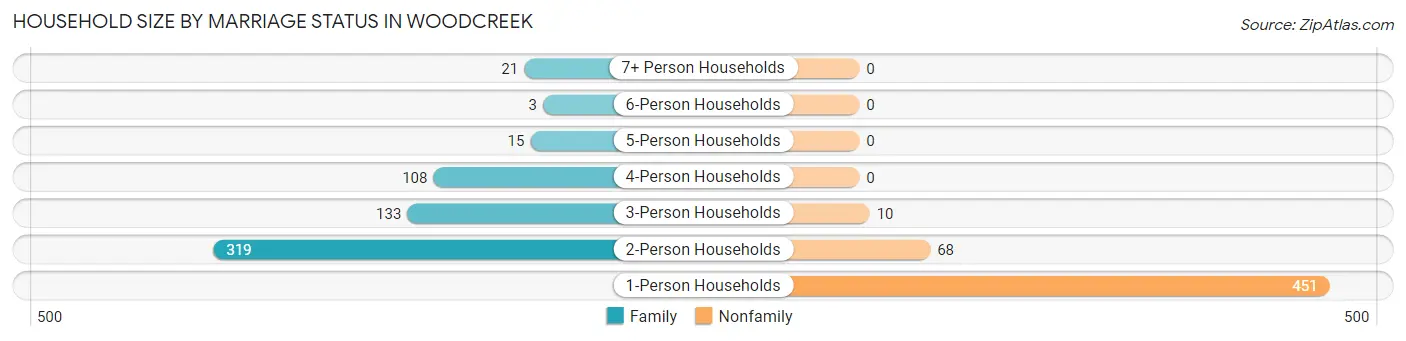
Household Size by Marriage Status in Woodcreek
Out of a total of 1,128 households in Woodcreek, 599 (53.1%) are family households, while 529 (46.9%) are nonfamily households. The most numerous type of family households are 2-person households, comprising 319, and the most common type of nonfamily households are 1-person households, comprising 451.
| Household Size | Family Households | Nonfamily Households |
| 1-Person Households | - | 451 (40.0%) |
| 2-Person Households | 319 (28.3%) | 68 (6.0%) |
| 3-Person Households | 133 (11.8%) | 10 (0.9%) |
| 4-Person Households | 108 (9.6%) | 0 (0.0%) |
| 5-Person Households | 15 (1.3%) | 0 (0.0%) |
| 6-Person Households | 3 (0.3%) | 0 (0.0%) |
| 7+ Person Households | 21 (1.9%) | 0 (0.0%) |
| Total | 599 (53.1%) | 529 (46.9%) |
Female Fertility in Woodcreek
Fertility by Age in Woodcreek
Average fertility rate in Woodcreek is 34.0 births per 1,000 women. Women in the age bracket of 35 to 50 years have the highest fertility rate with 62.0 births per 1,000 women. Women in the age bracket of 35 to 50 years acount for 100.0% of all women with births.
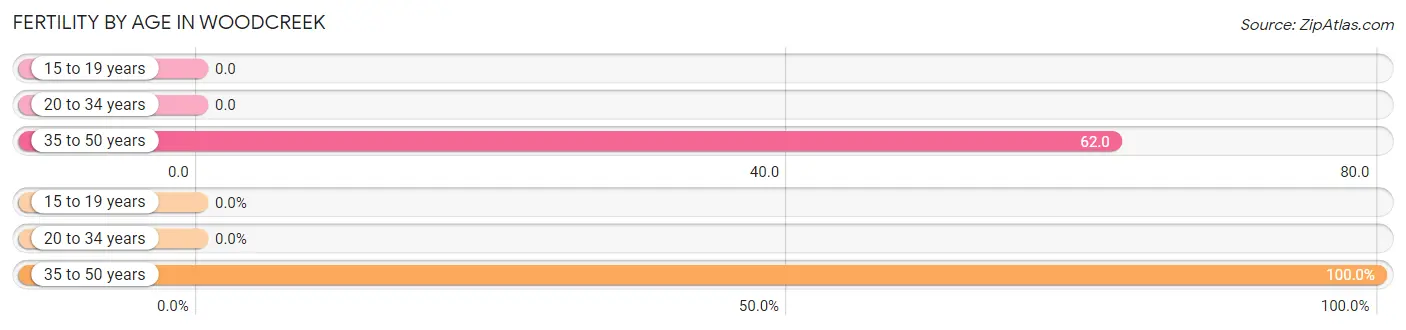
| Age Bracket | Women with Births | Births / 1,000 Women |
| 15 to 19 years | 0 (0.0%) | 0.0 |
| 20 to 34 years | 0 (0.0%) | 0.0 |
| 35 to 50 years | 14 (100.0%) | 62.0 |
| Total | 14 (100.0%) | 34.0 |
Fertility by Age by Marriage Status in Woodcreek
35.7% of women with births (14) in Woodcreek are married. The highest percentage of unmarried women with births falls into 35 to 50 years age bracket with 64.3% of them unmarried at the time of birth, while the lowest percentage of unmarried women with births belong to 35 to 50 years age bracket with 64.3% of them unmarried.
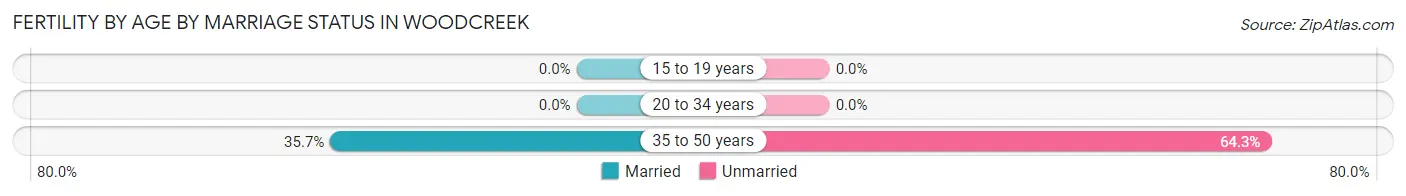
| Age Bracket | Married | Unmarried |
| 15 to 19 years | 0 (0.0%) | 0 (0.0%) |
| 20 to 34 years | 0 (0.0%) | 0 (0.0%) |
| 35 to 50 years | 5 (35.7%) | 9 (64.3%) |
| Total | 5 (35.7%) | 9 (64.3%) |
Fertility by Education in Woodcreek
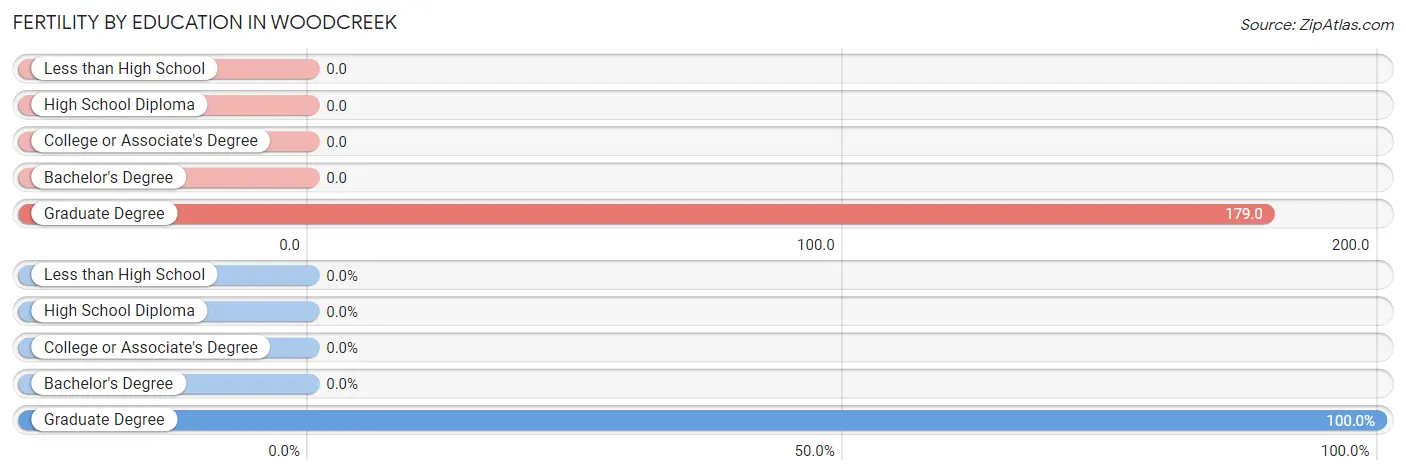
| Educational Attainment | Women with Births | Births / 1,000 Women |
| Less than High School | 0 (0.0%) | 0.0 |
| High School Diploma | 0 (0.0%) | 0.0 |
| College or Associate's Degree | 0 (0.0%) | 0.0 |
| Bachelor's Degree | 0 (0.0%) | 0.0 |
| Graduate Degree | 14 (100.0%) | 179.0 |
| Total | 14 (100.0%) | 34.0 |
Fertility by Education by Marriage Status in Woodcreek
64.3% of women with births in Woodcreek are unmarried. Women with the educational attainment of graduate degree are most likely to be married with 35.7% of them married at childbirth, while women with the educational attainment of graduate degree are least likely to be married with 64.3% of them unmarried at childbirth.
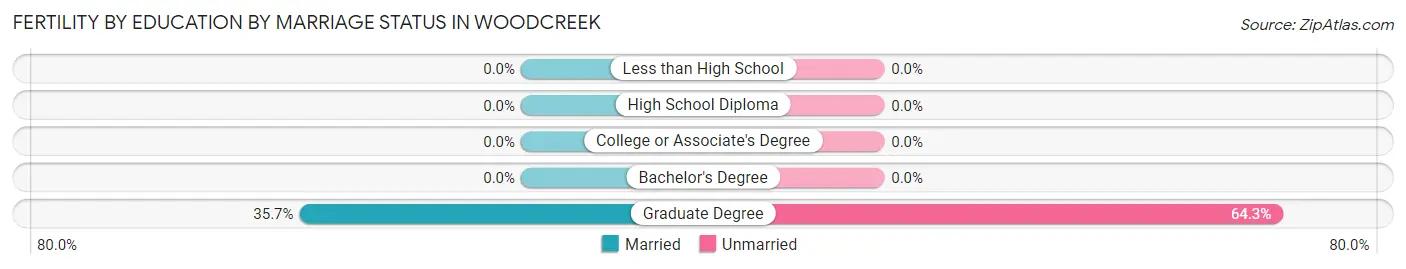
| Educational Attainment | Married | Unmarried |
| Less than High School | 0 (0.0%) | 0 (0.0%) |
| High School Diploma | 0 (0.0%) | 0 (0.0%) |
| College or Associate's Degree | 0 (0.0%) | 0 (0.0%) |
| Bachelor's Degree | 0 (0.0%) | 0 (0.0%) |
| Graduate Degree | 5 (35.7%) | 9 (64.3%) |
| Total | 5 (35.7%) | 9 (64.3%) |
Income in Woodcreek
Income Overview in Woodcreek
Per Capita Income in Woodcreek is $41,426, while median incomes of families and households are $100,729 and $80,227 respectively.
| Characteristic | Number | Measure |
| Per Capita Income | 2,389 | $41,426 |
| Median Family Income | 599 | $100,729 |
| Mean Family Income | 599 | $117,396 |
| Median Household Income | 1,128 | $80,227 |
| Mean Household Income | 1,128 | $88,442 |
| Income Deficit | 599 | $0 |
| Wage / Income Gap (%) | 2,389 | 0.00% |
| Wage / Income Gap ($) | 2,389 | 100.00¢ per $1 |
| Gini / Inequality Index | 2,389 | 0.39 |
Earnings by Sex in Woodcreek
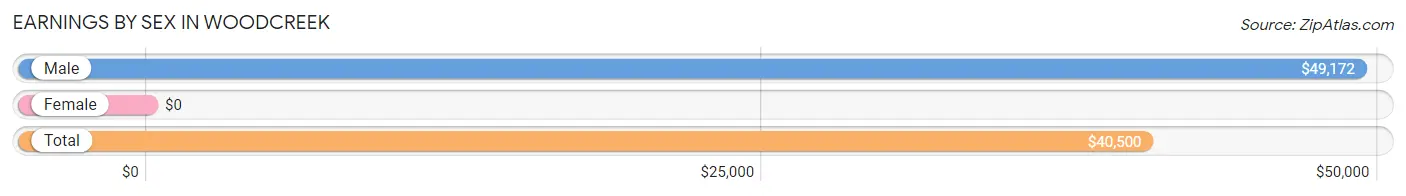
| Sex | Number | Average Earnings |
| Male | 535 (42.7%) | $49,172 |
| Female | 717 (57.3%) | $0 |
| Total | 1,252 (100.0%) | $40,500 |
Earnings by Sex by Income Bracket in Woodcreek
The most common earnings brackets in Woodcreek are $45,000 to $49,999 for men (90 | 16.8%) and $2,500 to $4,999 for women (203 | 28.3%).
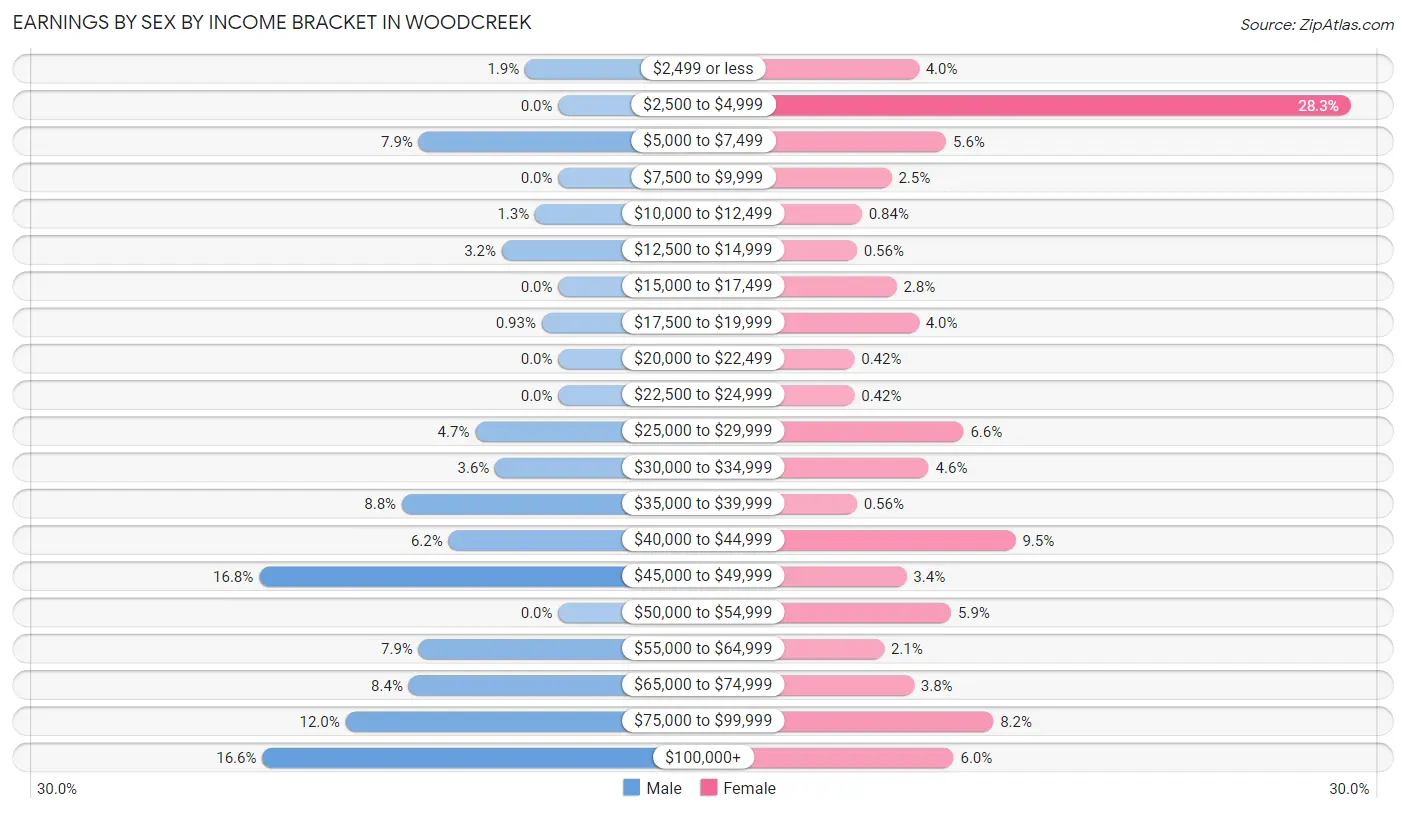
| Income | Male | Female |
| $2,499 or less | 10 (1.9%) | 29 (4.0%) |
| $2,500 to $4,999 | 0 (0.0%) | 203 (28.3%) |
| $5,000 to $7,499 | 42 (7.9%) | 40 (5.6%) |
| $7,500 to $9,999 | 0 (0.0%) | 18 (2.5%) |
| $10,000 to $12,499 | 7 (1.3%) | 6 (0.8%) |
| $12,500 to $14,999 | 17 (3.2%) | 4 (0.6%) |
| $15,000 to $17,499 | 0 (0.0%) | 20 (2.8%) |
| $17,500 to $19,999 | 5 (0.9%) | 29 (4.0%) |
| $20,000 to $22,499 | 0 (0.0%) | 3 (0.4%) |
| $22,500 to $24,999 | 0 (0.0%) | 3 (0.4%) |
| $25,000 to $29,999 | 25 (4.7%) | 47 (6.6%) |
| $30,000 to $34,999 | 19 (3.5%) | 33 (4.6%) |
| $35,000 to $39,999 | 47 (8.8%) | 4 (0.6%) |
| $40,000 to $44,999 | 33 (6.2%) | 68 (9.5%) |
| $45,000 to $49,999 | 90 (16.8%) | 24 (3.4%) |
| $50,000 to $54,999 | 0 (0.0%) | 42 (5.9%) |
| $55,000 to $64,999 | 42 (7.9%) | 15 (2.1%) |
| $65,000 to $74,999 | 45 (8.4%) | 27 (3.8%) |
| $75,000 to $99,999 | 64 (12.0%) | 59 (8.2%) |
| $100,000+ | 89 (16.6%) | 43 (6.0%) |
| Total | 535 (100.0%) | 717 (100.0%) |
Earnings by Sex by Educational Attainment in Woodcreek
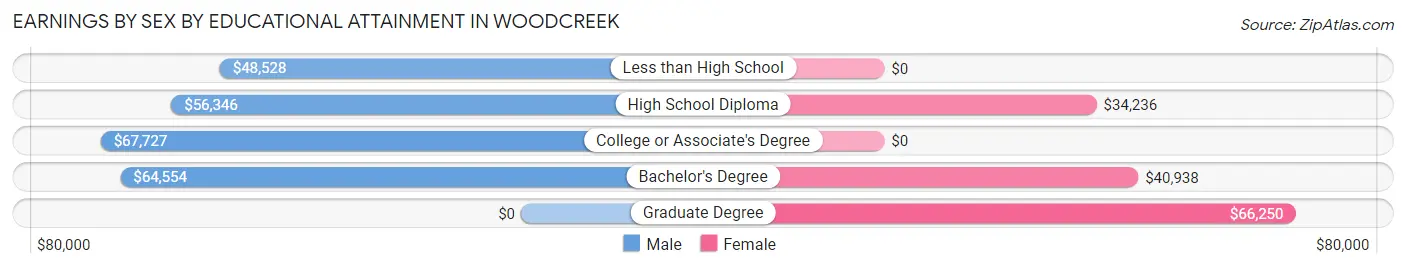
| Educational Attainment | Male Income | Female Income |
| Less than High School | $48,528 | $0 |
| High School Diploma | $56,346 | $34,236 |
| College or Associate's Degree | $67,727 | $0 |
| Bachelor's Degree | $64,554 | $40,938 |
| Graduate Degree | - | - |
| Total | $49,804 | $0 |
Family Income in Woodcreek
Family Income Brackets in Woodcreek
According to the Woodcreek family income data, there are 176 families falling into the $100,000 to $149,999 income range, which is the most common income bracket and makes up 29.4% of all families.
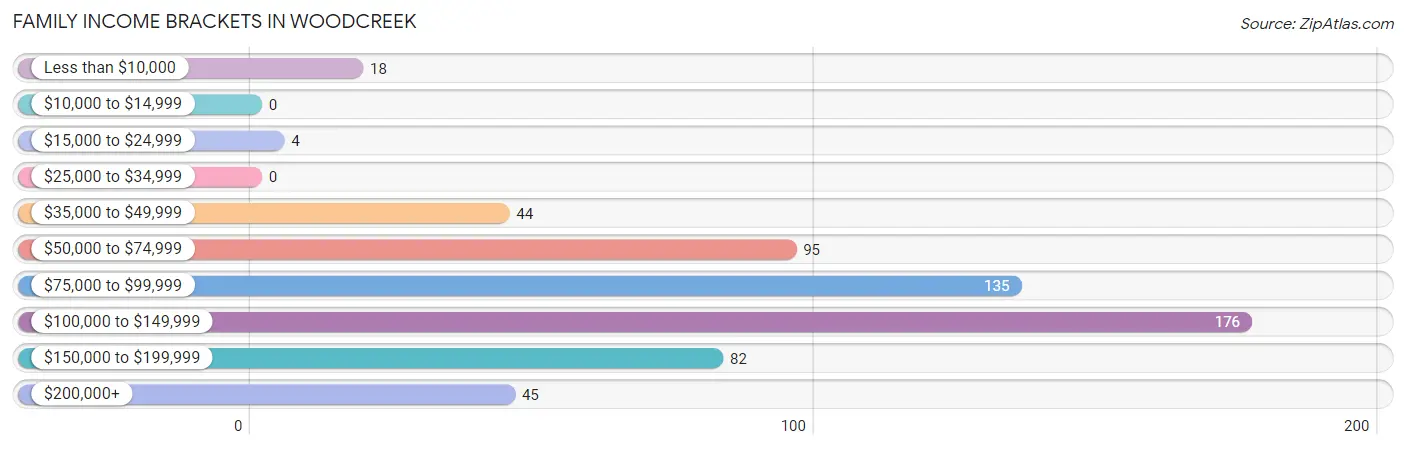
| Income Bracket | # Families | % Families |
| Less than $10,000 | 18 | 3.0% |
| $10,000 to $14,999 | 0 | 0.0% |
| $15,000 to $24,999 | 4 | 0.7% |
| $25,000 to $34,999 | 0 | 0.0% |
| $35,000 to $49,999 | 44 | 7.3% |
| $50,000 to $74,999 | 95 | 15.9% |
| $75,000 to $99,999 | 135 | 22.5% |
| $100,000 to $149,999 | 176 | 29.4% |
| $150,000 to $199,999 | 82 | 13.7% |
| $200,000+ | 45 | 7.5% |
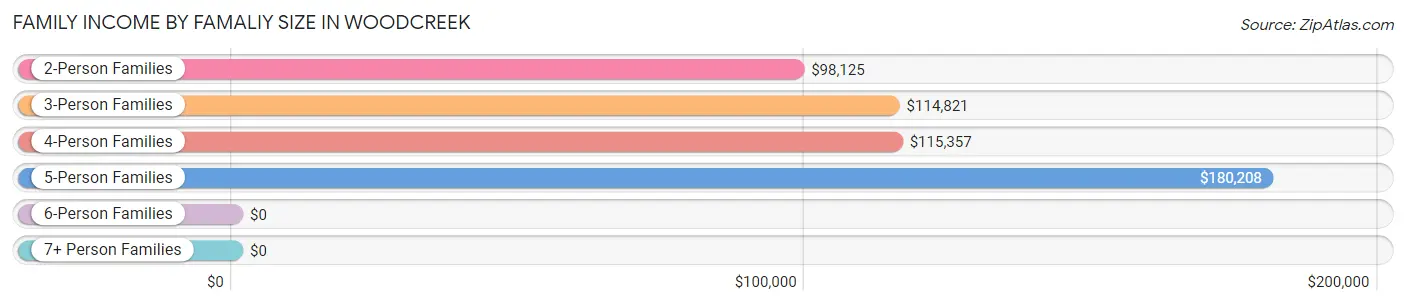
Family Income by Famaliy Size in Woodcreek
5-person families (15 | 2.5%) account for the highest median family income in Woodcreek with $180,208 per family, while 2-person families (319 | 53.3%) have the highest median income of $49,062 per family member.
| Income Bracket | # Families | Median Income |
| 2-Person Families | 319 (53.3%) | $98,125 |
| 3-Person Families | 133 (22.2%) | $114,821 |
| 4-Person Families | 108 (18.0%) | $115,357 |
| 5-Person Families | 15 (2.5%) | $180,208 |
| 6-Person Families | 3 (0.5%) | $0 |
| 7+ Person Families | 21 (3.5%) | $0 |
| Total | 599 (100.0%) | $100,729 |
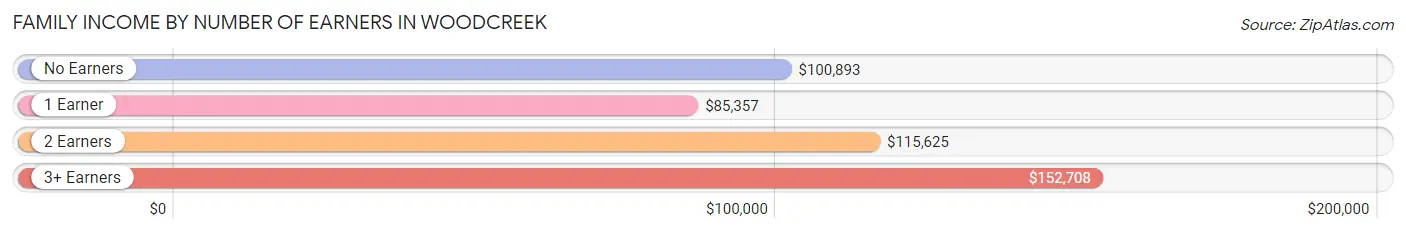
Family Income by Number of Earners in Woodcreek
The median family income in Woodcreek is $100,729, with families comprising 3+ earners (41) having the highest median family income of $152,708, while families with 1 earner (164) have the lowest median family income of $85,357, accounting for 6.8% and 27.4% of families, respectively.
| Number of Earners | # Families | Median Income |
| No Earners | 149 (24.9%) | $100,893 |
| 1 Earner | 164 (27.4%) | $85,357 |
| 2 Earners | 245 (40.9%) | $115,625 |
| 3+ Earners | 41 (6.8%) | $152,708 |
| Total | 599 (100.0%) | $100,729 |
Household Income in Woodcreek
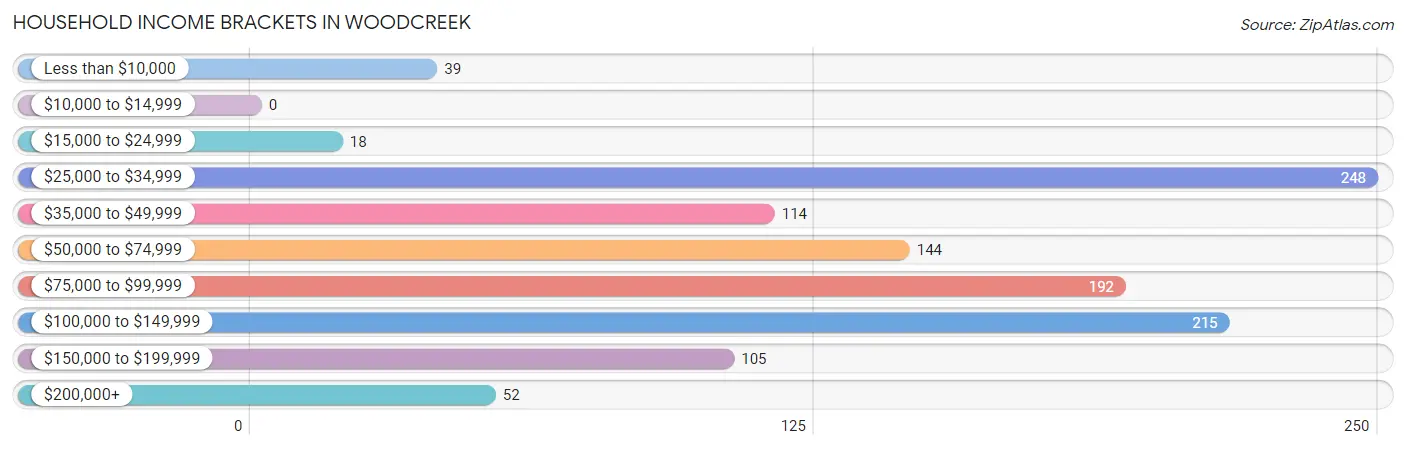
Household Income Brackets in Woodcreek
With 248 households falling in the category, the $25,000 to $34,999 income range is the most frequent in Woodcreek, accounting for 22.0% of all households.
| Income Bracket | # Households | % Households |
| Less than $10,000 | 39 | 3.5% |
| $10,000 to $14,999 | 0 | 0.0% |
| $15,000 to $24,999 | 18 | 1.6% |
| $25,000 to $34,999 | 248 | 22.0% |
| $35,000 to $49,999 | 114 | 10.1% |
| $50,000 to $74,999 | 144 | 12.8% |
| $75,000 to $99,999 | 192 | 17.0% |
| $100,000 to $149,999 | 215 | 19.1% |
| $150,000 to $199,999 | 105 | 9.3% |
| $200,000+ | 52 | 4.6% |
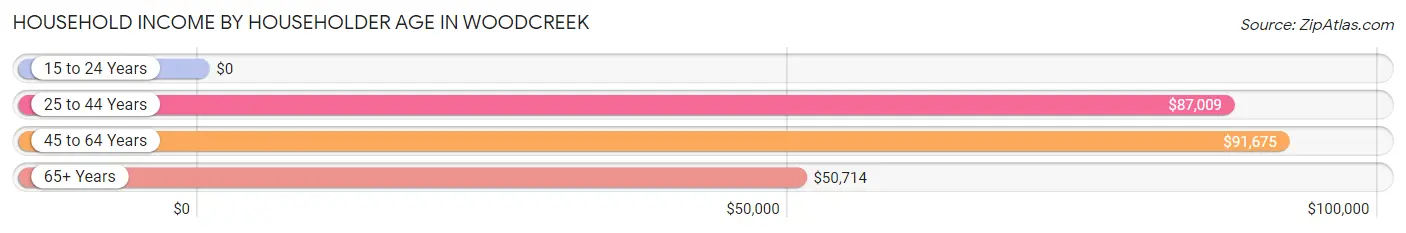
Household Income by Householder Age in Woodcreek
The median household income in Woodcreek is $80,227, with the highest median household income of $91,675 found in the 45 to 64 years age bracket for the primary householder. A total of 359 households (31.8%) fall into this category.
| Income Bracket | # Households | Median Income |
| 15 to 24 Years | 0 (0.0%) | $0 |
| 25 to 44 Years | 153 (13.6%) | $87,009 |
| 45 to 64 Years | 359 (31.8%) | $91,675 |
| 65+ Years | 616 (54.6%) | $50,714 |
| Total | 1,128 (100.0%) | $80,227 |
Poverty in Woodcreek
Income Below Poverty by Sex and Age in Woodcreek
With 3.5% poverty level for males and 2.9% for females among the residents of Woodcreek, 18 to 24 year old males and 55 to 64 year old females are the most vulnerable to poverty, with 20 males (50.0%) and 21 females (10.5%) in their respective age groups living below the poverty level.
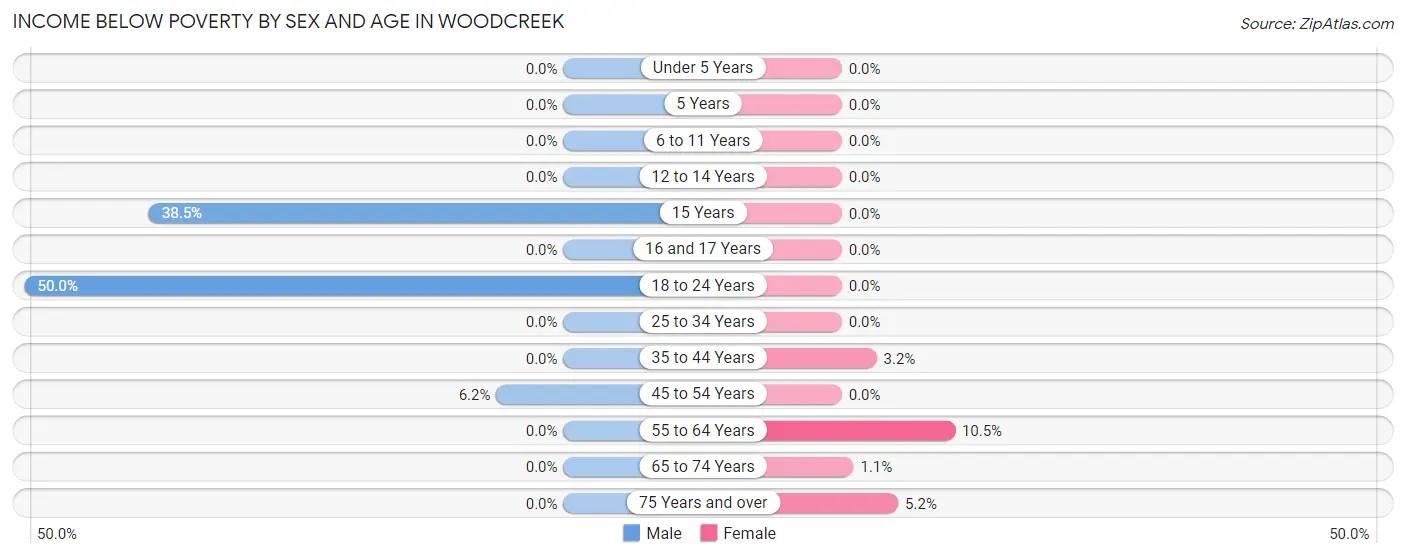
| Age Bracket | Male | Female |
| Under 5 Years | 0 (0.0%) | 0 (0.0%) |
| 5 Years | 0 (0.0%) | 0 (0.0%) |
| 6 to 11 Years | 0 (0.0%) | 0 (0.0%) |
| 12 to 14 Years | 0 (0.0%) | 0 (0.0%) |
| 15 Years | 5 (38.5%) | 0 (0.0%) |
| 16 and 17 Years | 0 (0.0%) | 0 (0.0%) |
| 18 to 24 Years | 20 (50.0%) | 0 (0.0%) |
| 25 to 34 Years | 0 (0.0%) | 0 (0.0%) |
| 35 to 44 Years | 0 (0.0%) | 4 (3.2%) |
| 45 to 54 Years | 14 (6.2%) | 0 (0.0%) |
| 55 to 64 Years | 0 (0.0%) | 21 (10.5%) |
| 65 to 74 Years | 0 (0.0%) | 4 (1.1%) |
| 75 Years and over | 0 (0.0%) | 8 (5.2%) |
| Total | 39 (3.5%) | 37 (2.9%) |
Income Above Poverty by Sex and Age in Woodcreek
According to the poverty statistics in Woodcreek, males aged under 5 years and females aged under 5 years are the age groups that are most secure financially, with 100.0% of males and 100.0% of females in these age groups living above the poverty line.
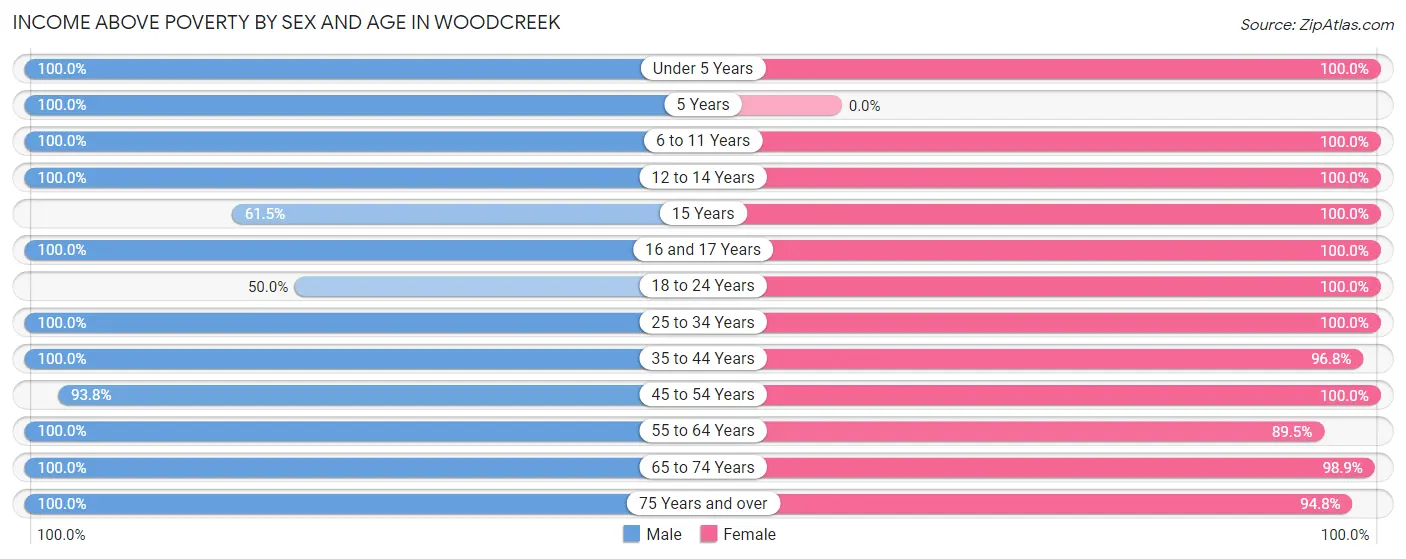
| Age Bracket | Male | Female |
| Under 5 Years | 106 (100.0%) | 7 (100.0%) |
| 5 Years | 27 (100.0%) | 0 (0.0%) |
| 6 to 11 Years | 126 (100.0%) | 78 (100.0%) |
| 12 to 14 Years | 13 (100.0%) | 33 (100.0%) |
| 15 Years | 8 (61.5%) | 5 (100.0%) |
| 16 and 17 Years | 16 (100.0%) | 23 (100.0%) |
| 18 to 24 Years | 20 (50.0%) | 44 (100.0%) |
| 25 to 34 Years | 68 (100.0%) | 117 (100.0%) |
| 35 to 44 Years | 67 (100.0%) | 120 (96.8%) |
| 45 to 54 Years | 211 (93.8%) | 131 (100.0%) |
| 55 to 64 Years | 111 (100.0%) | 179 (89.5%) |
| 65 to 74 Years | 153 (100.0%) | 362 (98.9%) |
| 75 Years and over | 143 (100.0%) | 145 (94.8%) |
| Total | 1,069 (96.5%) | 1,244 (97.1%) |
Income Below Poverty Among Married-Couple Families in Woodcreek
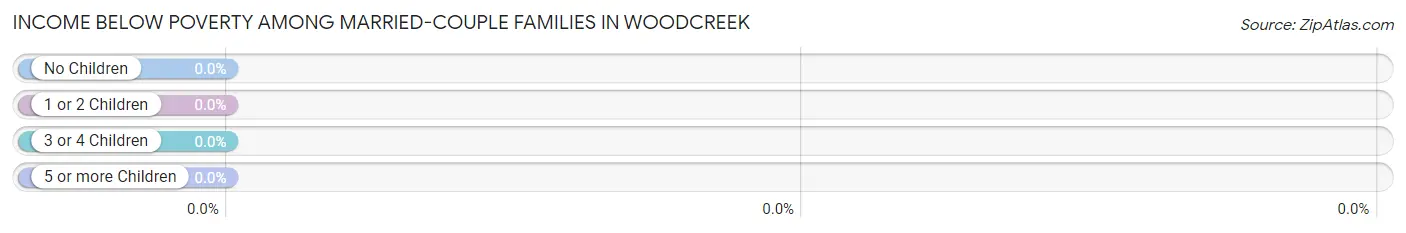
| Children | Above Poverty | Below Poverty |
| No Children | 368 (100.0%) | 0 (0.0%) |
| 1 or 2 Children | 135 (100.0%) | 0 (0.0%) |
| 3 or 4 Children | 12 (100.0%) | 0 (0.0%) |
| 5 or more Children | 21 (100.0%) | 0 (0.0%) |
| Total | 536 (100.0%) | 0 (0.0%) |
Income Below Poverty Among Single-Parent Households in Woodcreek
According to the poverty data in Woodcreek, 100.0% or 14 single-father households and 8.2% or 4 single-mother households are living below the poverty line. Among single-father households, those with no children have the highest poverty rate, with 14 households (100.0%) experiencing poverty. Likewise, among single-mother households, those with 1 or 2 children have the highest poverty rate, with 4 households (21.0%) falling below the poverty line.
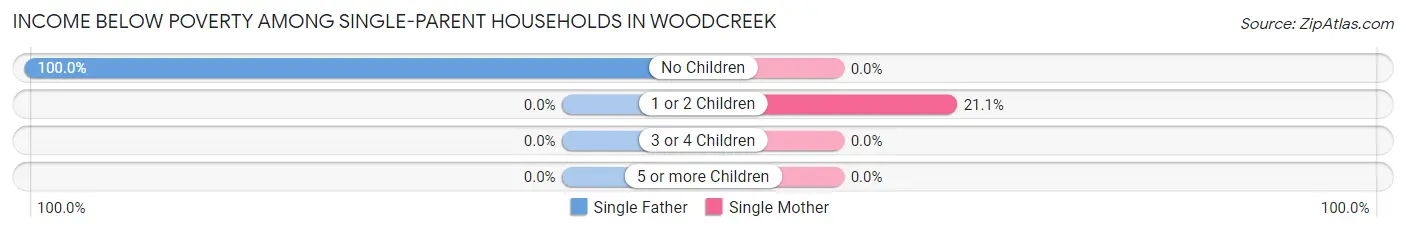
| Children | Single Father | Single Mother |
| No Children | 14 (100.0%) | 0 (0.0%) |
| 1 or 2 Children | 0 (0.0%) | 4 (21.0%) |
| 3 or 4 Children | 0 (0.0%) | 0 (0.0%) |
| 5 or more Children | 0 (0.0%) | 0 (0.0%) |
| Total | 14 (100.0%) | 4 (8.2%) |
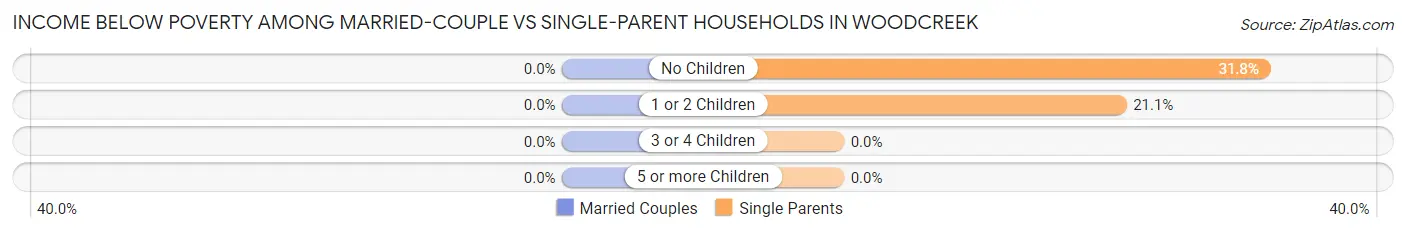
Income Below Poverty Among Married-Couple vs Single-Parent Households in Woodcreek
| Children | Married-Couple Families | Single-Parent Households |
| No Children | 0 (0.0%) | 14 (31.8%) |
| 1 or 2 Children | 0 (0.0%) | 4 (21.0%) |
| 3 or 4 Children | 0 (0.0%) | 0 (0.0%) |
| 5 or more Children | 0 (0.0%) | 0 (0.0%) |
| Total | 0 (0.0%) | 18 (28.6%) |
Employment Characteristics in Woodcreek
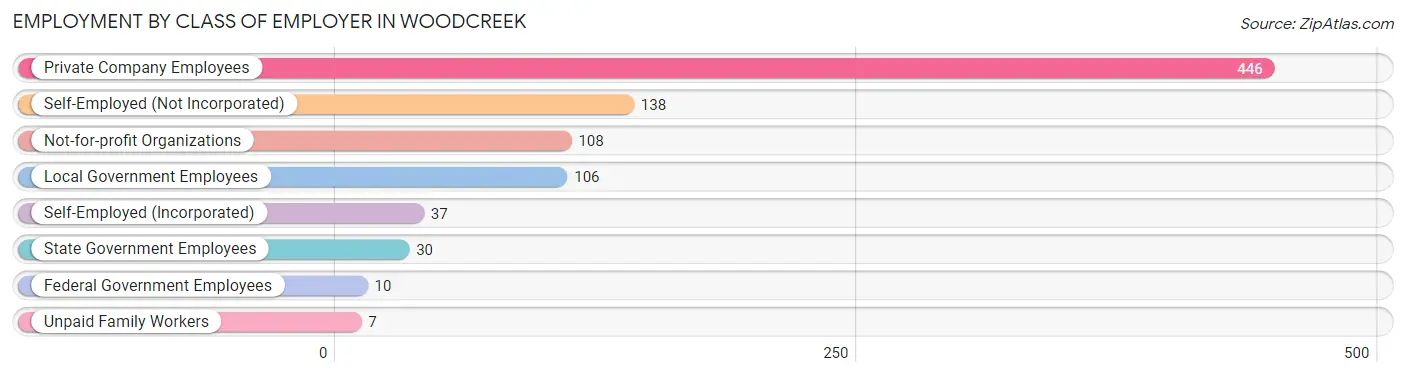
Employment by Class of Employer in Woodcreek
Among the 882 employed individuals in Woodcreek, private company employees (446 | 50.6%), self-employed (not incorporated) (138 | 15.7%), and not-for-profit organizations (108 | 12.2%) make up the most common classes of employment.
| Employer Class | # Employees | % Employees |
| Private Company Employees | 446 | 50.6% |
| Self-Employed (Incorporated) | 37 | 4.2% |
| Self-Employed (Not Incorporated) | 138 | 15.7% |
| Not-for-profit Organizations | 108 | 12.2% |
| Local Government Employees | 106 | 12.0% |
| State Government Employees | 30 | 3.4% |
| Federal Government Employees | 10 | 1.1% |
| Unpaid Family Workers | 7 | 0.8% |
| Total | 882 | 100.0% |
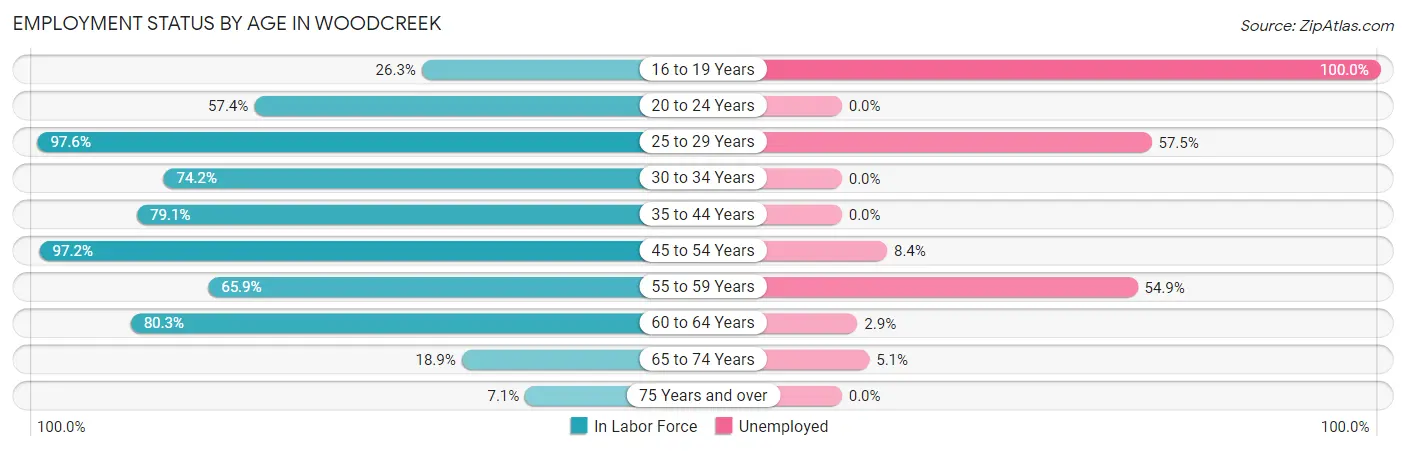
Employment Status by Age in Woodcreek
According to the labor force statistics for Woodcreek, out of the total population over 16 years of age (1,981), 53.5% or 1,060 individuals are in the labor force, with 16.7% or 177 of them unemployed. The age group with the highest labor force participation rate is 25 to 29 years, with 97.6% or 120 individuals in the labor force. Within the labor force, the 16 to 19 years age range has the highest percentage of unemployed individuals, with 100.0% or 20 of them being unemployed.
| Age Bracket | In Labor Force | Unemployed |
| 16 to 19 Years | 20 (26.3%) | 20 (100.0%) |
| 20 to 24 Years | 27 (57.4%) | 0 (0.0%) |
| 25 to 29 Years | 120 (97.6%) | 69 (57.5%) |
| 30 to 34 Years | 46 (74.2%) | 0 (0.0%) |
| 35 to 44 Years | 151 (79.1%) | 0 (0.0%) |
| 45 to 54 Years | 346 (97.2%) | 29 (8.4%) |
| 55 to 59 Years | 91 (65.9%) | 50 (54.9%) |
| 60 to 64 Years | 139 (80.3%) | 4 (2.9%) |
| 65 to 74 Years | 98 (18.9%) | 5 (5.1%) |
| 75 Years and over | 21 (7.1%) | 0 (0.0%) |
| Total | 1,060 (53.5%) | 177 (16.7%) |
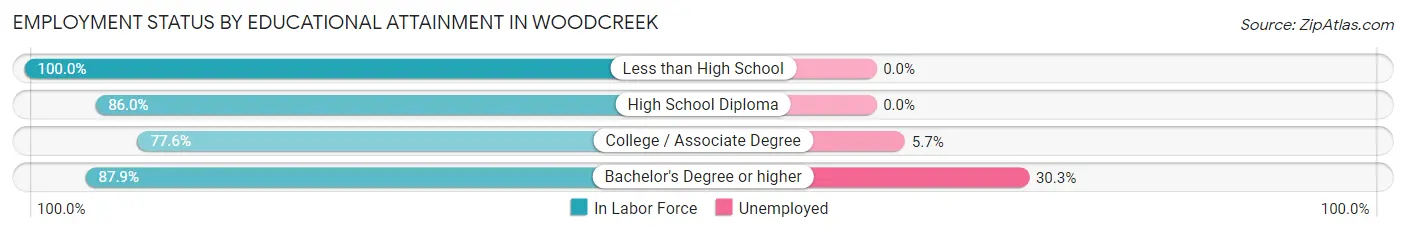
Employment Status by Educational Attainment in Woodcreek
According to labor force statistics for Woodcreek, 85.6% of individuals (893) out of the total population between 25 and 64 years of age (1,043) are in the labor force, with 17.0% or 152 of them being unemployed. The group with the highest labor force participation rate are those with the educational attainment of less than high school, with 100.0% or 93 individuals in the labor force. Within the labor force, individuals with bachelor's degree or higher education have the highest percentage of unemployment, with 30.3% or 138 of them being unemployed.
| Educational Attainment | In Labor Force | Unemployed |
| Less than High School | 93 (100.0%) | 0 (0.0%) |
| High School Diploma | 98 (86.0%) | 0 (0.0%) |
| College / Associate Degree | 246 (77.6%) | 18 (5.7%) |
| Bachelor's Degree or higher | 456 (87.9%) | 157 (30.3%) |
| Total | 893 (85.6%) | 177 (17.0%) |
Employment Occupations by Sex in Woodcreek
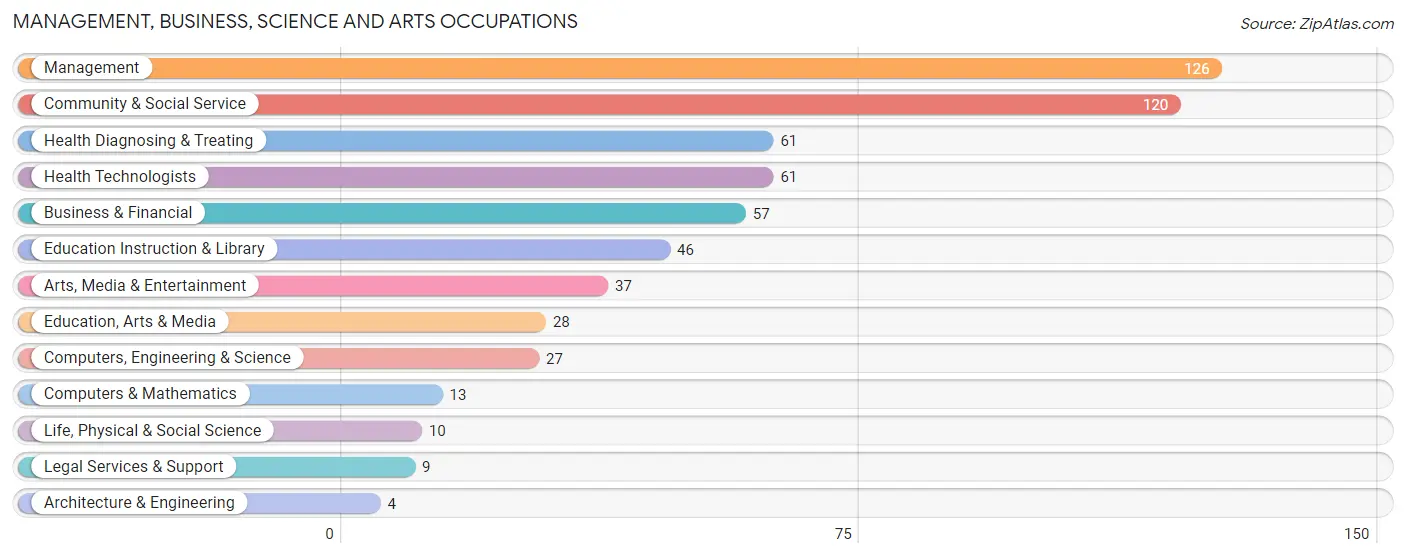
Management, Business, Science and Arts Occupations
The most common Management, Business, Science and Arts occupations in Woodcreek are Management (126 | 14.3%), Community & Social Service (120 | 13.6%), Health Diagnosing & Treating (61 | 6.9%), Health Technologists (61 | 6.9%), and Business & Financial (57 | 6.5%).
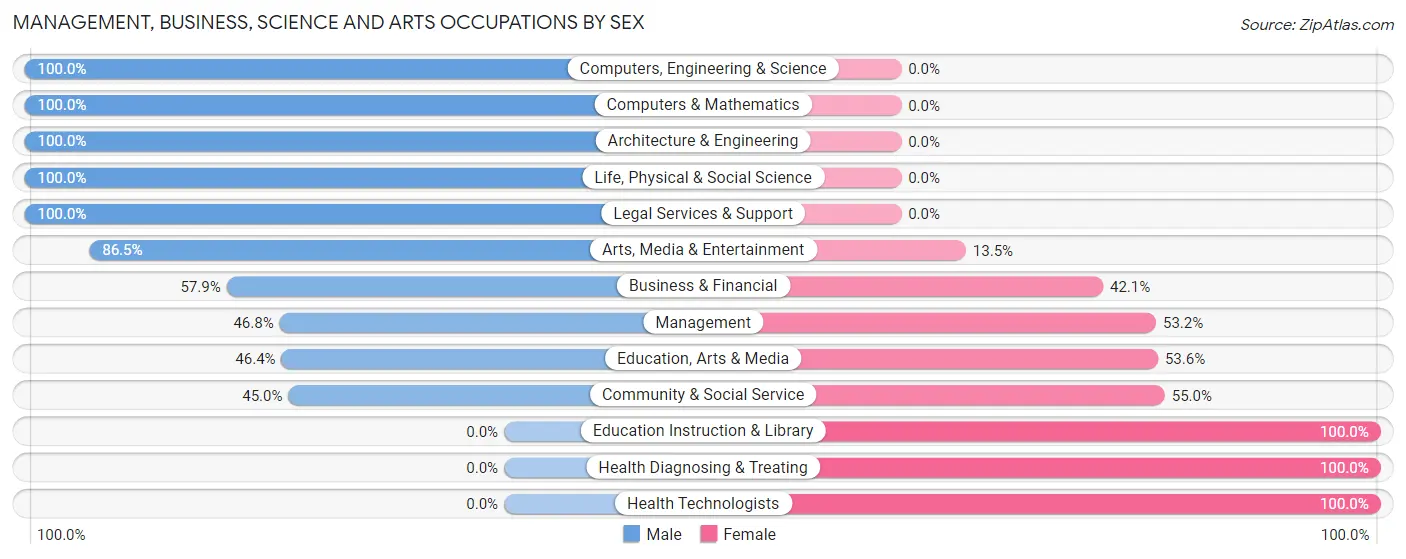
Management, Business, Science and Arts Occupations by Sex
Within the Management, Business, Science and Arts occupations in Woodcreek, the most male-oriented occupations are Computers, Engineering & Science (100.0%), Computers & Mathematics (100.0%), and Architecture & Engineering (100.0%), while the most female-oriented occupations are Education Instruction & Library (100.0%), Health Diagnosing & Treating (100.0%), and Health Technologists (100.0%).
| Occupation | Male | Female |
| Management | 59 (46.8%) | 67 (53.2%) |
| Business & Financial | 33 (57.9%) | 24 (42.1%) |
| Computers, Engineering & Science | 27 (100.0%) | 0 (0.0%) |
| Computers & Mathematics | 13 (100.0%) | 0 (0.0%) |
| Architecture & Engineering | 4 (100.0%) | 0 (0.0%) |
| Life, Physical & Social Science | 10 (100.0%) | 0 (0.0%) |
| Community & Social Service | 54 (45.0%) | 66 (55.0%) |
| Education, Arts & Media | 13 (46.4%) | 15 (53.6%) |
| Legal Services & Support | 9 (100.0%) | 0 (0.0%) |
| Education Instruction & Library | 0 (0.0%) | 46 (100.0%) |
| Arts, Media & Entertainment | 32 (86.5%) | 5 (13.5%) |
| Health Diagnosing & Treating | 0 (0.0%) | 61 (100.0%) |
| Health Technologists | 0 (0.0%) | 61 (100.0%) |
| Total (Category) | 173 (44.3%) | 218 (55.7%) |
| Total (Overall) | 464 (52.6%) | 418 (47.4%) |
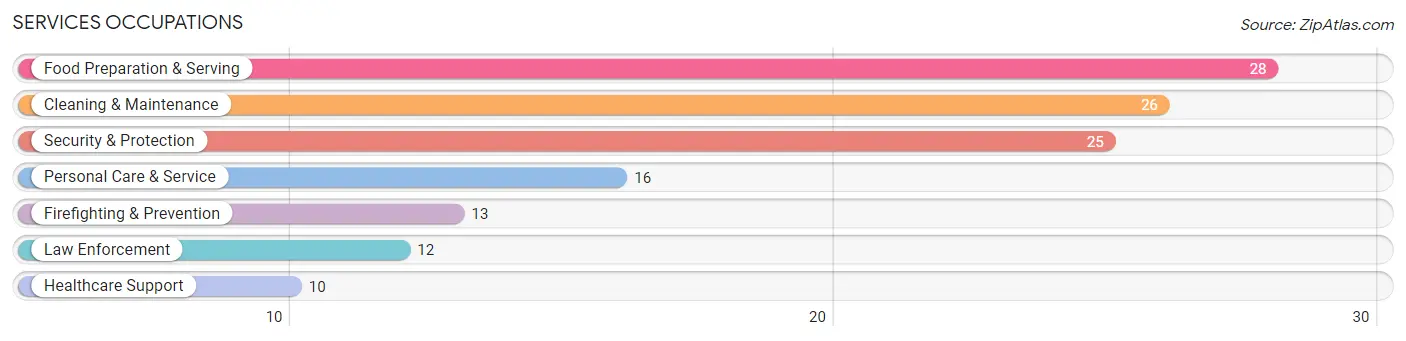
Services Occupations
The most common Services occupations in Woodcreek are Food Preparation & Serving (28 | 3.2%), Cleaning & Maintenance (26 | 2.9%), Security & Protection (25 | 2.8%), Personal Care & Service (16 | 1.8%), and Firefighting & Prevention (13 | 1.5%).
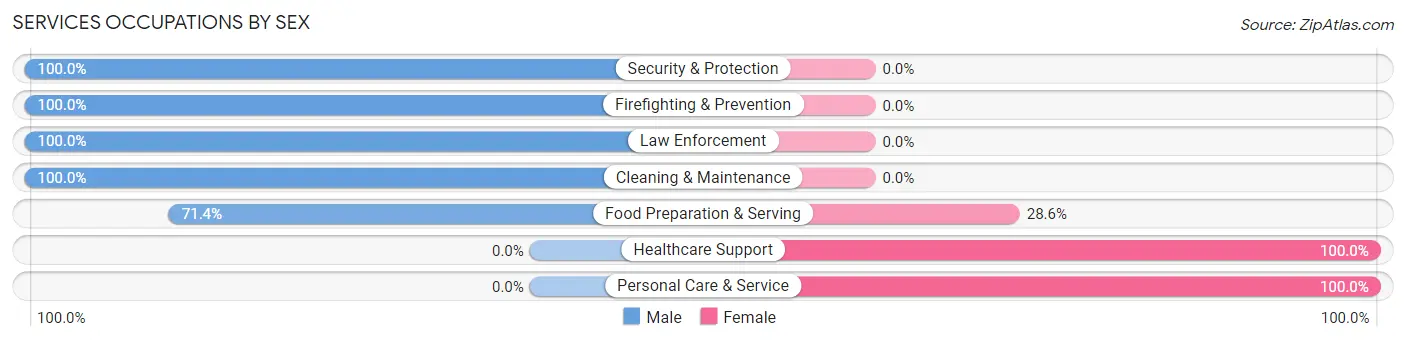
Services Occupations by Sex
Within the Services occupations in Woodcreek, the most male-oriented occupations are Security & Protection (100.0%), Firefighting & Prevention (100.0%), and Law Enforcement (100.0%), while the most female-oriented occupations are Healthcare Support (100.0%), Personal Care & Service (100.0%), and Food Preparation & Serving (28.6%).
| Occupation | Male | Female |
| Healthcare Support | 0 (0.0%) | 10 (100.0%) |
| Security & Protection | 25 (100.0%) | 0 (0.0%) |
| Firefighting & Prevention | 13 (100.0%) | 0 (0.0%) |
| Law Enforcement | 12 (100.0%) | 0 (0.0%) |
| Food Preparation & Serving | 20 (71.4%) | 8 (28.6%) |
| Cleaning & Maintenance | 26 (100.0%) | 0 (0.0%) |
| Personal Care & Service | 0 (0.0%) | 16 (100.0%) |
| Total (Category) | 71 (67.6%) | 34 (32.4%) |
| Total (Overall) | 464 (52.6%) | 418 (47.4%) |
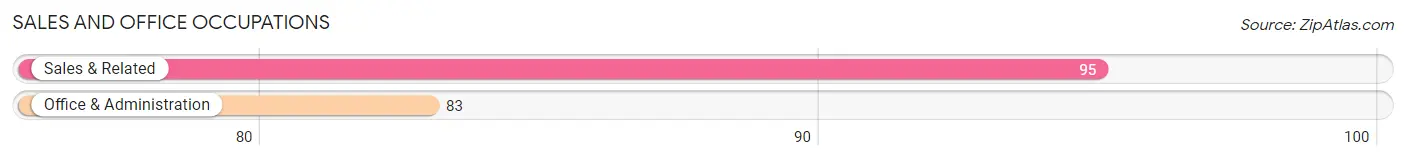
Sales and Office Occupations
The most common Sales and Office occupations in Woodcreek are Sales & Related (95 | 10.8%), and Office & Administration (83 | 9.4%).
Sales and Office Occupations by Sex
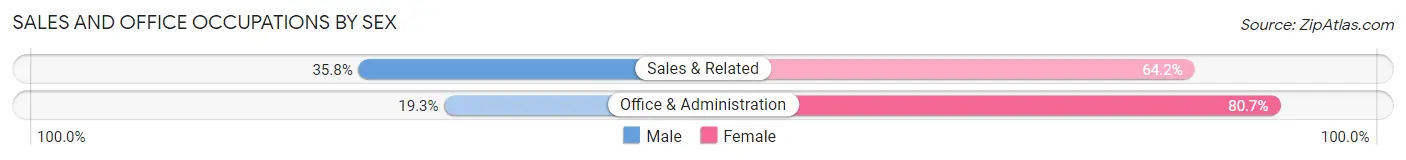
| Occupation | Male | Female |
| Sales & Related | 34 (35.8%) | 61 (64.2%) |
| Office & Administration | 16 (19.3%) | 67 (80.7%) |
| Total (Category) | 50 (28.1%) | 128 (71.9%) |
| Total (Overall) | 464 (52.6%) | 418 (47.4%) |
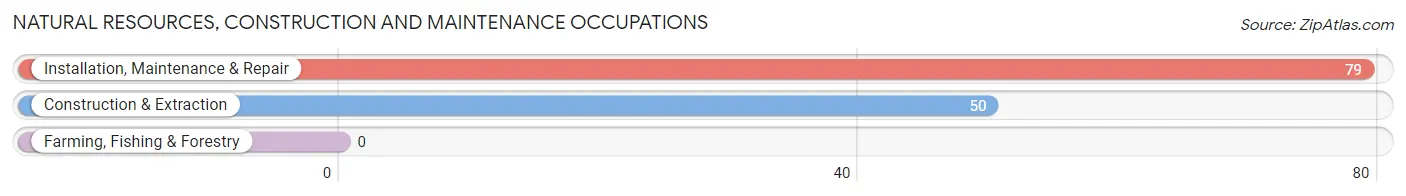
Natural Resources, Construction and Maintenance Occupations
The most common Natural Resources, Construction and Maintenance occupations in Woodcreek are Installation, Maintenance & Repair (79 | 9.0%), and Construction & Extraction (50 | 5.7%).
Natural Resources, Construction and Maintenance Occupations by Sex
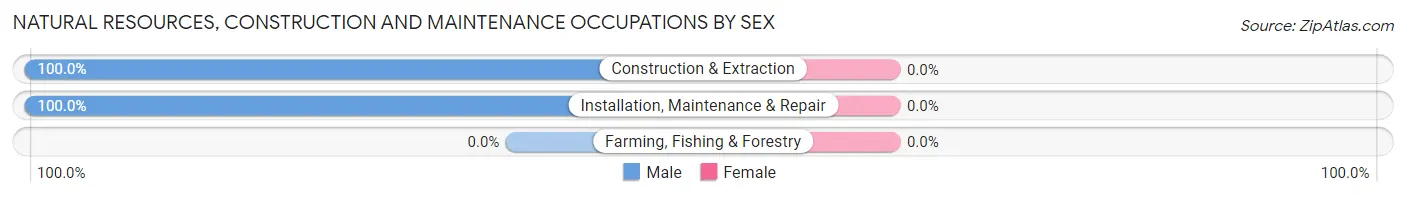
| Occupation | Male | Female |
| Farming, Fishing & Forestry | 0 (0.0%) | 0 (0.0%) |
| Construction & Extraction | 50 (100.0%) | 0 (0.0%) |
| Installation, Maintenance & Repair | 79 (100.0%) | 0 (0.0%) |
| Total (Category) | 129 (100.0%) | 0 (0.0%) |
| Total (Overall) | 464 (52.6%) | 418 (47.4%) |
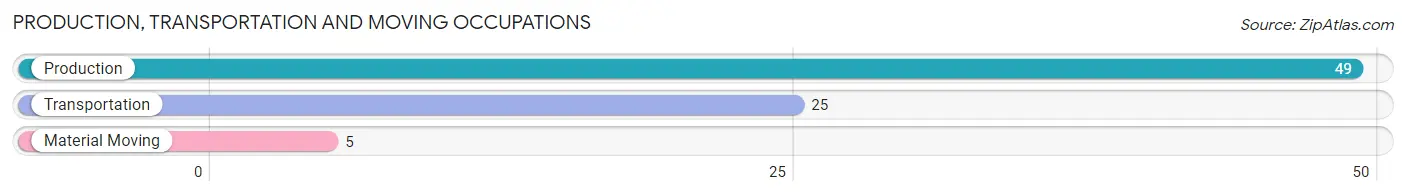
Production, Transportation and Moving Occupations
The most common Production, Transportation and Moving occupations in Woodcreek are Production (49 | 5.6%), Transportation (25 | 2.8%), and Material Moving (5 | 0.6%).
Production, Transportation and Moving Occupations by Sex
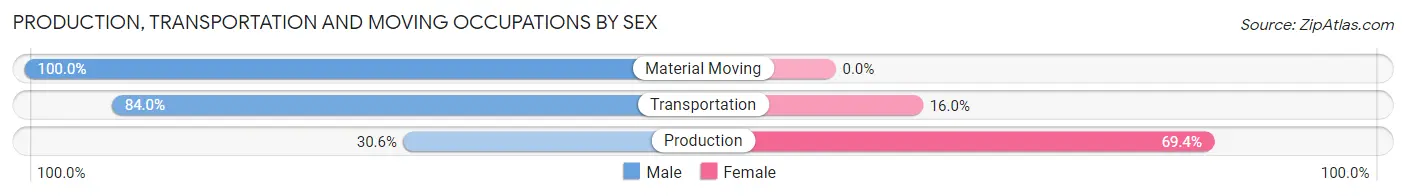
| Occupation | Male | Female |
| Production | 15 (30.6%) | 34 (69.4%) |
| Transportation | 21 (84.0%) | 4 (16.0%) |
| Material Moving | 5 (100.0%) | 0 (0.0%) |
| Total (Category) | 41 (51.9%) | 38 (48.1%) |
| Total (Overall) | 464 (52.6%) | 418 (47.4%) |
Employment Industries by Sex in Woodcreek
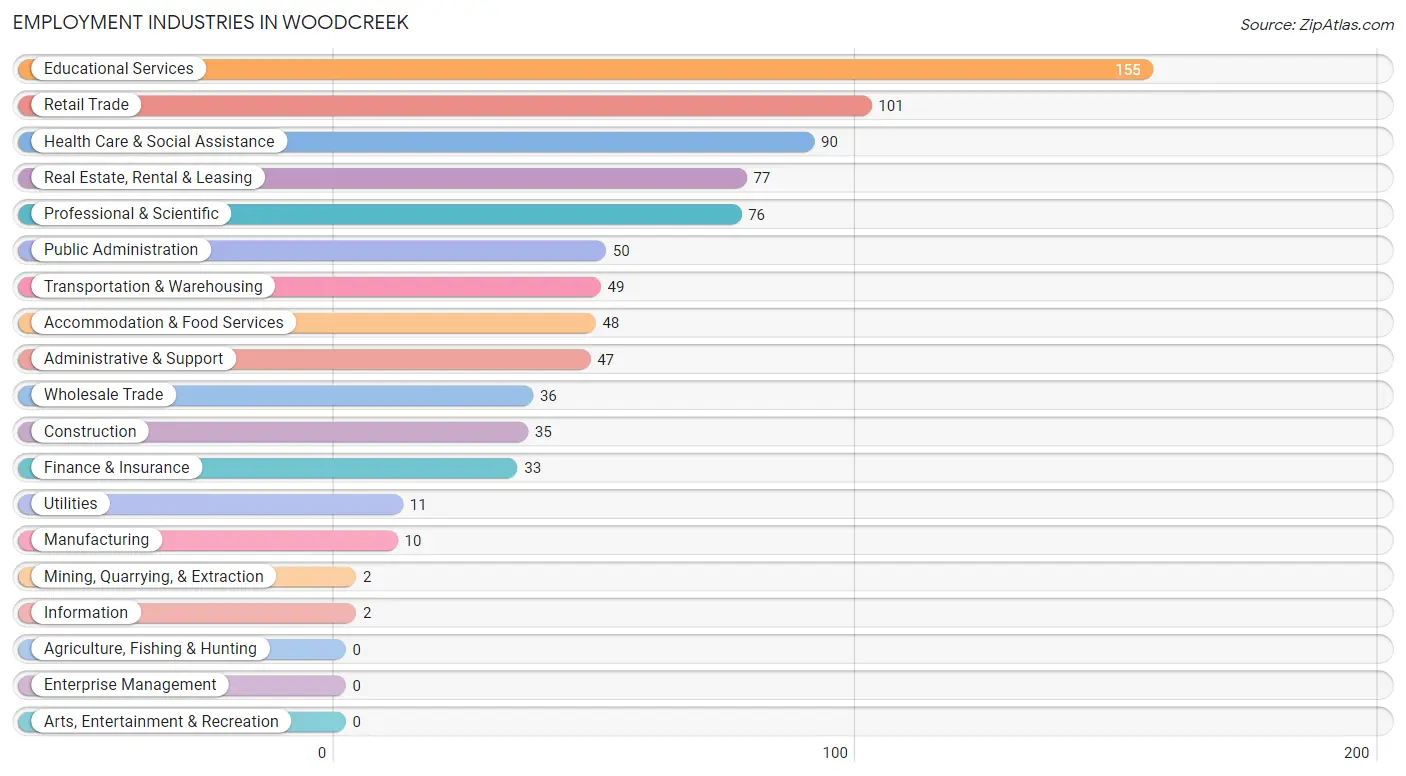
Employment Industries in Woodcreek
The major employment industries in Woodcreek include Educational Services (155 | 17.6%), Retail Trade (101 | 11.5%), Health Care & Social Assistance (90 | 10.2%), Real Estate, Rental & Leasing (77 | 8.7%), and Professional & Scientific (76 | 8.6%).
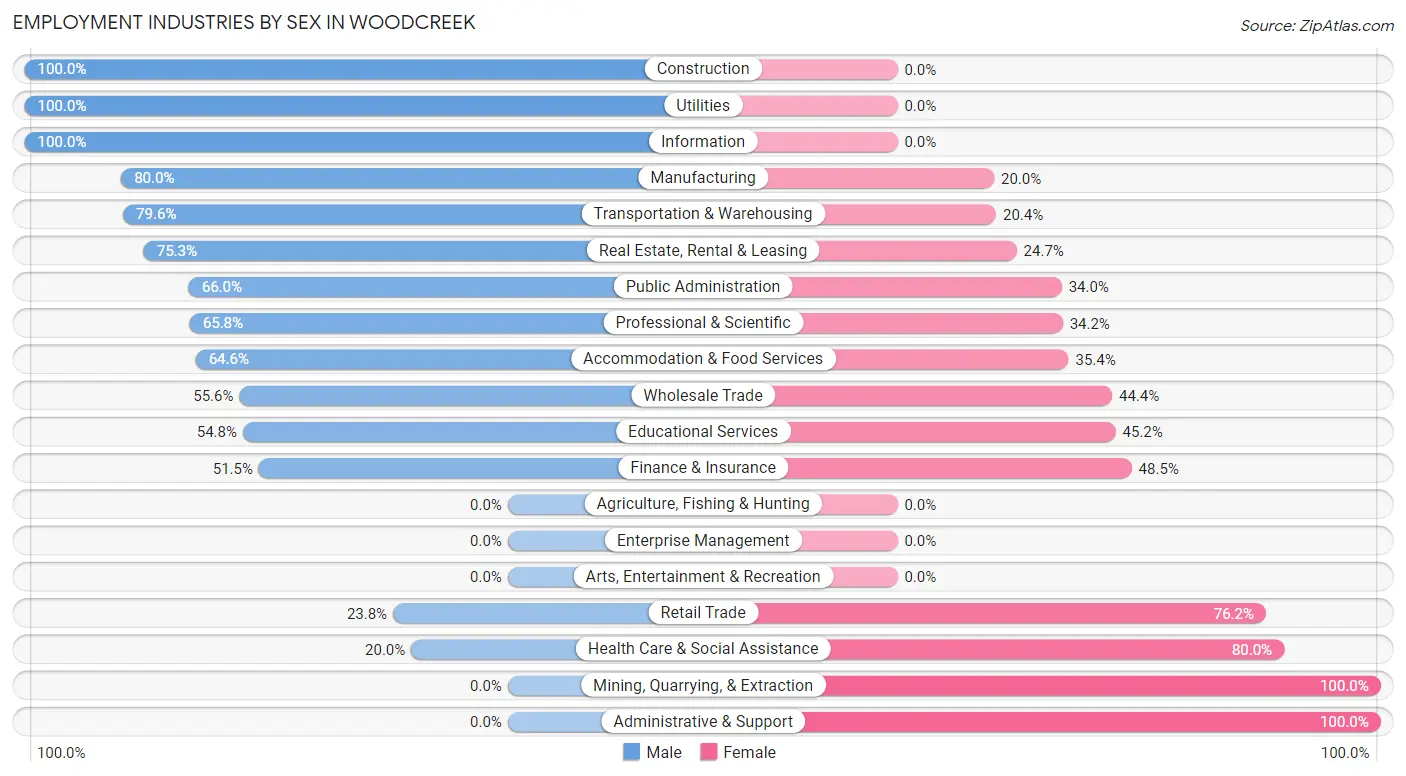
Employment Industries by Sex in Woodcreek
The Woodcreek industries that see more men than women are Construction (100.0%), Utilities (100.0%), and Information (100.0%), whereas the industries that tend to have a higher number of women are Mining, Quarrying, & Extraction (100.0%), Administrative & Support (100.0%), and Health Care & Social Assistance (80.0%).
| Industry | Male | Female |
| Agriculture, Fishing & Hunting | 0 (0.0%) | 0 (0.0%) |
| Mining, Quarrying, & Extraction | 0 (0.0%) | 2 (100.0%) |
| Construction | 35 (100.0%) | 0 (0.0%) |
| Manufacturing | 8 (80.0%) | 2 (20.0%) |
| Wholesale Trade | 20 (55.6%) | 16 (44.4%) |
| Retail Trade | 24 (23.8%) | 77 (76.2%) |
| Transportation & Warehousing | 39 (79.6%) | 10 (20.4%) |
| Utilities | 11 (100.0%) | 0 (0.0%) |
| Information | 2 (100.0%) | 0 (0.0%) |
| Finance & Insurance | 17 (51.5%) | 16 (48.5%) |
| Real Estate, Rental & Leasing | 58 (75.3%) | 19 (24.7%) |
| Professional & Scientific | 50 (65.8%) | 26 (34.2%) |
| Enterprise Management | 0 (0.0%) | 0 (0.0%) |
| Administrative & Support | 0 (0.0%) | 47 (100.0%) |
| Educational Services | 85 (54.8%) | 70 (45.2%) |
| Health Care & Social Assistance | 18 (20.0%) | 72 (80.0%) |
| Arts, Entertainment & Recreation | 0 (0.0%) | 0 (0.0%) |
| Accommodation & Food Services | 31 (64.6%) | 17 (35.4%) |
| Public Administration | 33 (66.0%) | 17 (34.0%) |
| Total | 464 (52.6%) | 418 (47.4%) |
Education in Woodcreek
School Enrollment in Woodcreek
The most common levels of schooling among the 398 students in Woodcreek are middle school (143 | 35.9%), high school (98 | 24.6%), and elementary school (85 | 21.4%).
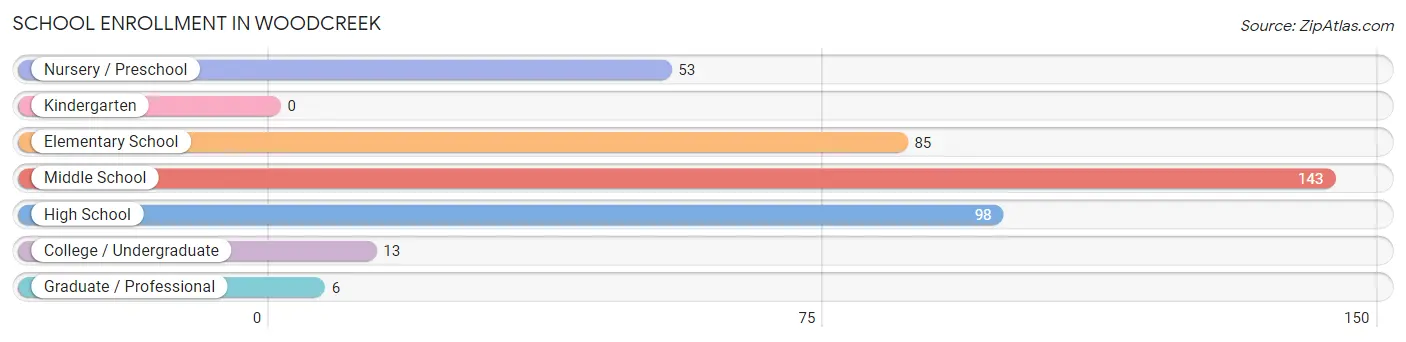
| School Level | # Students | % Students |
| Nursery / Preschool | 53 | 13.3% |
| Kindergarten | 0 | 0.0% |
| Elementary School | 85 | 21.4% |
| Middle School | 143 | 35.9% |
| High School | 98 | 24.6% |
| College / Undergraduate | 13 | 3.3% |
| Graduate / Professional | 6 | 1.5% |
| Total | 398 | 100.0% |
School Enrollment by Age by Funding Source in Woodcreek
Out of a total of 398 students who are enrolled in schools in Woodcreek, 12 (3.0%) attend a private institution, while the remaining 386 (97.0%) are enrolled in public schools. The age group of 3 to 4 year olds has the highest likelihood of being enrolled in private schools, with 7 (19.4% in the age bracket) enrolled. Conversely, the age group of 10 to 14 year olds has the lowest likelihood of being enrolled in a private school, with 167 (100.0% in the age bracket) attending a public institution.
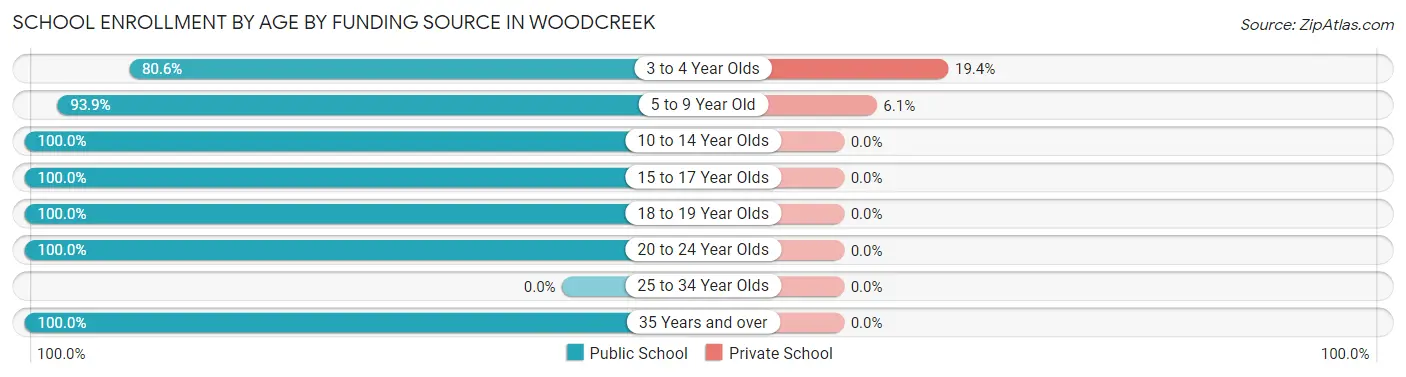
| Age Bracket | Public School | Private School |
| 3 to 4 Year Olds | 29 (80.6%) | 7 (19.4%) |
| 5 to 9 Year Old | 77 (93.9%) | 5 (6.1%) |
| 10 to 14 Year Olds | 167 (100.0%) | 0 (0.0%) |
| 15 to 17 Year Olds | 57 (100.0%) | 0 (0.0%) |
| 18 to 19 Year Olds | 37 (100.0%) | 0 (0.0%) |
| 20 to 24 Year Olds | 13 (100.0%) | 0 (0.0%) |
| 25 to 34 Year Olds | 0 (0.0%) | 0 (0.0%) |
| 35 Years and over | 6 (100.0%) | 0 (0.0%) |
| Total | 386 (97.0%) | 12 (3.0%) |
Educational Attainment by Field of Study in Woodcreek
Education (167 | 17.2%), literature & languages (151 | 15.6%), communications (96 | 9.9%), psychology (73 | 7.5%), and social sciences (70 | 7.2%) are the most common fields of study among 969 individuals in Woodcreek who have obtained a bachelor's degree or higher.
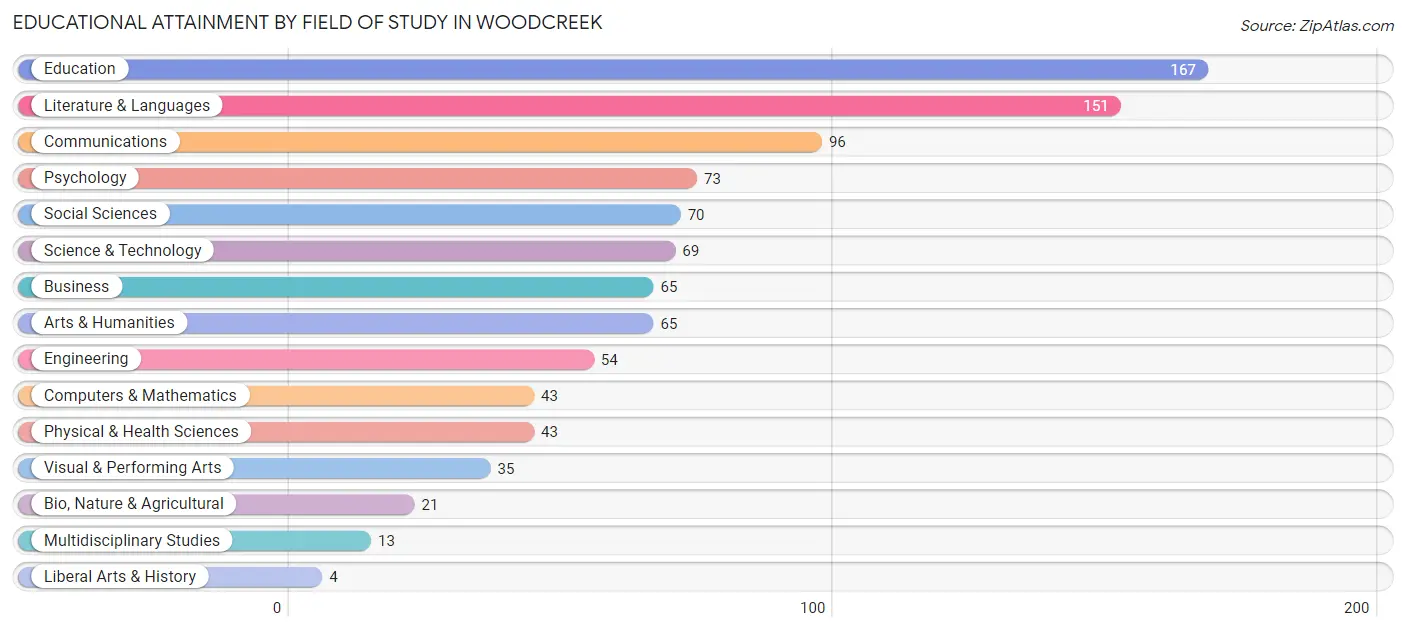
| Field of Study | # Graduates | % Graduates |
| Computers & Mathematics | 43 | 4.4% |
| Bio, Nature & Agricultural | 21 | 2.2% |
| Physical & Health Sciences | 43 | 4.4% |
| Psychology | 73 | 7.5% |
| Social Sciences | 70 | 7.2% |
| Engineering | 54 | 5.6% |
| Multidisciplinary Studies | 13 | 1.3% |
| Science & Technology | 69 | 7.1% |
| Business | 65 | 6.7% |
| Education | 167 | 17.2% |
| Literature & Languages | 151 | 15.6% |
| Liberal Arts & History | 4 | 0.4% |
| Visual & Performing Arts | 35 | 3.6% |
| Communications | 96 | 9.9% |
| Arts & Humanities | 65 | 6.7% |
| Total | 969 | 100.0% |
Transportation & Commute in Woodcreek
Vehicle Availability by Sex in Woodcreek
The most prevalent vehicle ownership categories in Woodcreek are males with 2 vehicles (231, accounting for 49.8%) and females with 2 vehicles (260, making up 55.3%).
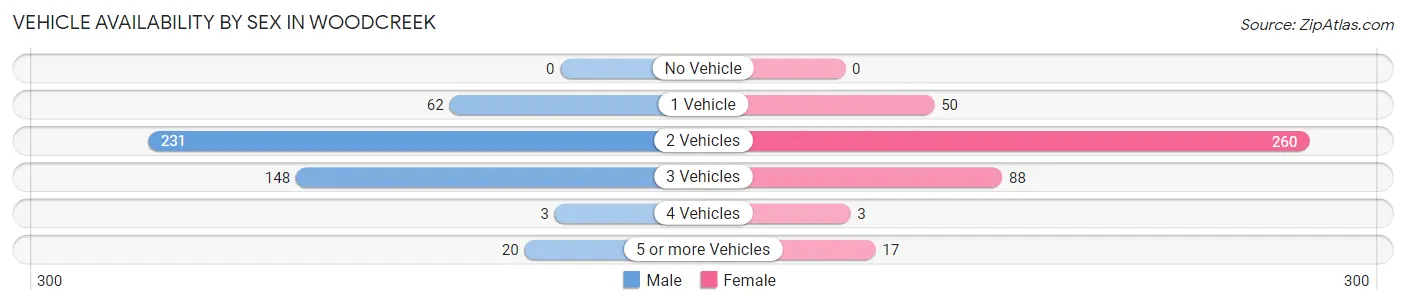
| Vehicles Available | Male | Female |
| No Vehicle | 0 (0.0%) | 0 (0.0%) |
| 1 Vehicle | 62 (13.4%) | 50 (12.0%) |
| 2 Vehicles | 231 (49.8%) | 260 (62.2%) |
| 3 Vehicles | 148 (31.9%) | 88 (21.0%) |
| 4 Vehicles | 3 (0.6%) | 3 (0.7%) |
| 5 or more Vehicles | 20 (4.3%) | 17 (4.1%) |
| Total | 464 (100.0%) | 418 (100.0%) |
Commute Time in Woodcreek
The most frequently occuring commute durations in Woodcreek are 5 to 9 minutes (199 commuters, 27.9%), 25 to 29 minutes (84 commuters, 11.8%), and 45 to 59 minutes (82 commuters, 11.5%).
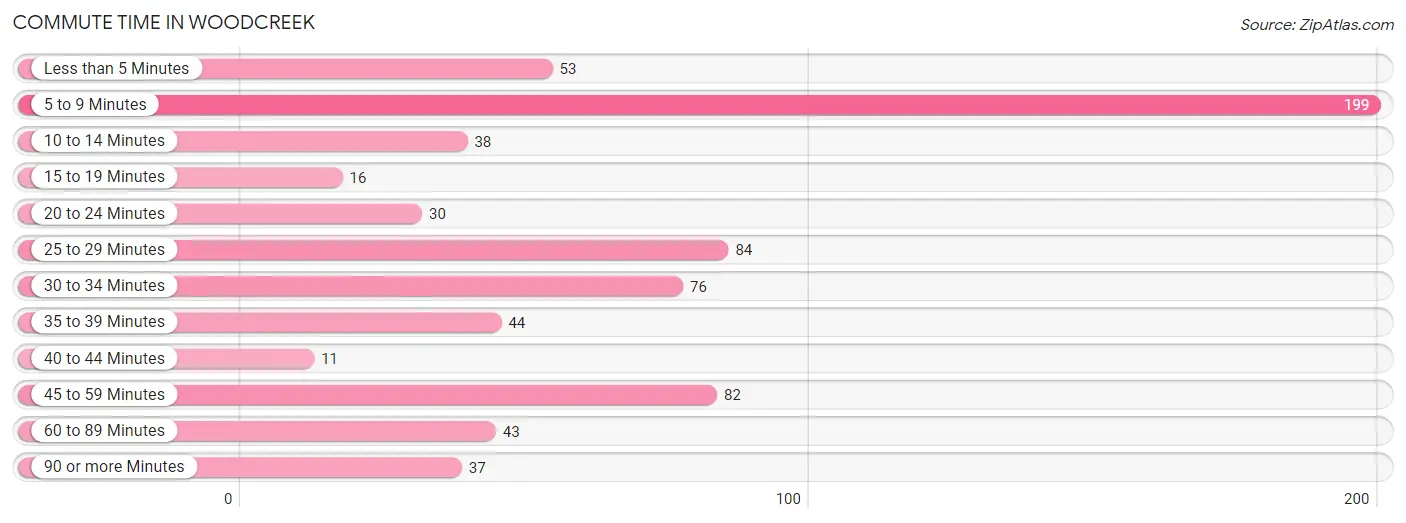
| Commute Time | # Commuters | % Commuters |
| Less than 5 Minutes | 53 | 7.4% |
| 5 to 9 Minutes | 199 | 27.9% |
| 10 to 14 Minutes | 38 | 5.3% |
| 15 to 19 Minutes | 16 | 2.2% |
| 20 to 24 Minutes | 30 | 4.2% |
| 25 to 29 Minutes | 84 | 11.8% |
| 30 to 34 Minutes | 76 | 10.7% |
| 35 to 39 Minutes | 44 | 6.2% |
| 40 to 44 Minutes | 11 | 1.5% |
| 45 to 59 Minutes | 82 | 11.5% |
| 60 to 89 Minutes | 43 | 6.0% |
| 90 or more Minutes | 37 | 5.2% |
Commute Time by Sex in Woodcreek
The most common commute times in Woodcreek are 5 to 9 minutes (132 commuters, 32.8%) for males and 5 to 9 minutes (67 commuters, 21.6%) for females.
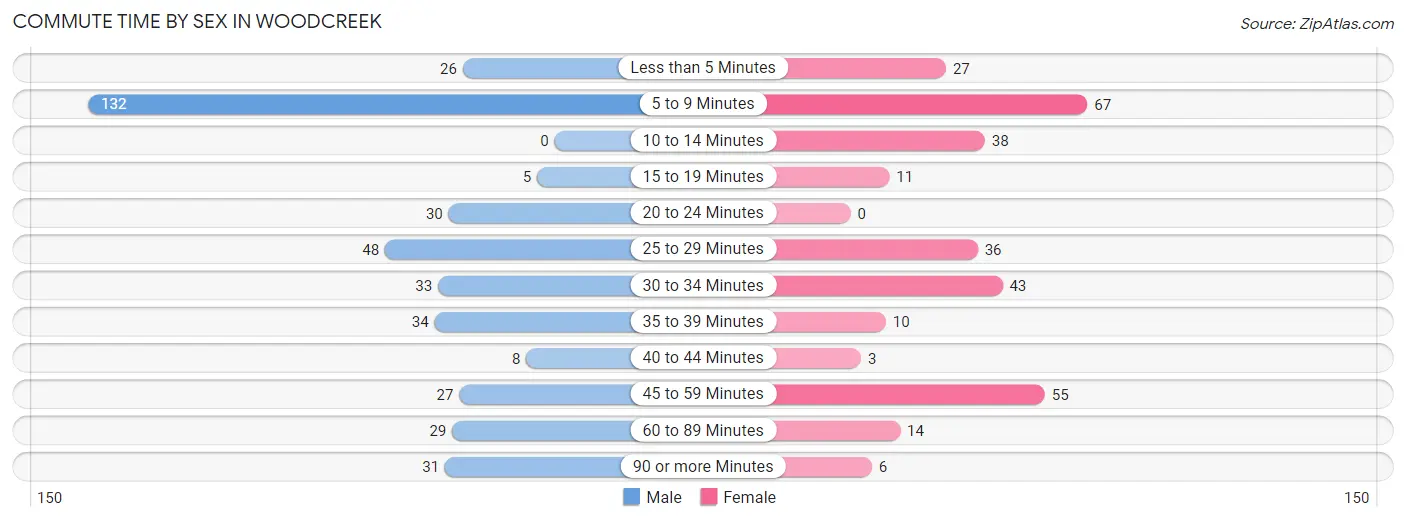
| Commute Time | Male | Female |
| Less than 5 Minutes | 26 (6.5%) | 27 (8.7%) |
| 5 to 9 Minutes | 132 (32.8%) | 67 (21.6%) |
| 10 to 14 Minutes | 0 (0.0%) | 38 (12.3%) |
| 15 to 19 Minutes | 5 (1.2%) | 11 (3.5%) |
| 20 to 24 Minutes | 30 (7.4%) | 0 (0.0%) |
| 25 to 29 Minutes | 48 (11.9%) | 36 (11.6%) |
| 30 to 34 Minutes | 33 (8.2%) | 43 (13.9%) |
| 35 to 39 Minutes | 34 (8.4%) | 10 (3.2%) |
| 40 to 44 Minutes | 8 (2.0%) | 3 (1.0%) |
| 45 to 59 Minutes | 27 (6.7%) | 55 (17.7%) |
| 60 to 89 Minutes | 29 (7.2%) | 14 (4.5%) |
| 90 or more Minutes | 31 (7.7%) | 6 (1.9%) |
Time of Departure to Work by Sex in Woodcreek
The most frequent times of departure to work in Woodcreek are 8:00 AM to 8:29 AM (91, 22.6%) for males and 8:00 AM to 8:29 AM (56, 18.1%) for females.
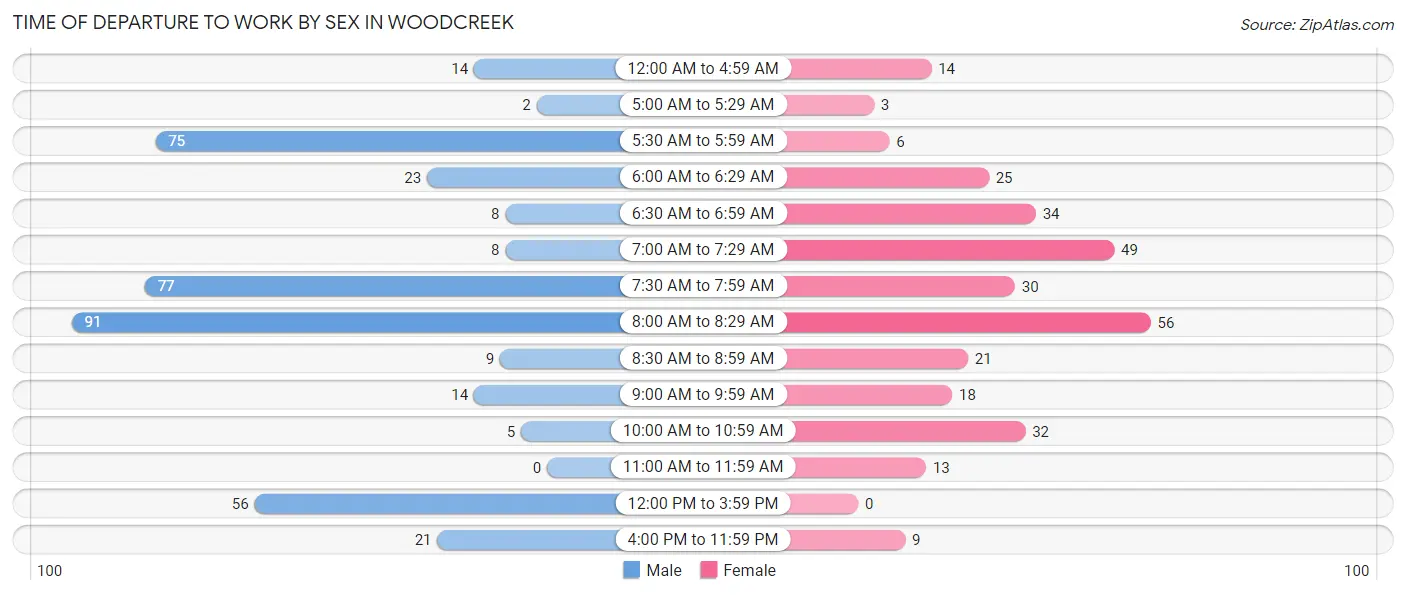
| Time of Departure | Male | Female |
| 12:00 AM to 4:59 AM | 14 (3.5%) | 14 (4.5%) |
| 5:00 AM to 5:29 AM | 2 (0.5%) | 3 (1.0%) |
| 5:30 AM to 5:59 AM | 75 (18.6%) | 6 (1.9%) |
| 6:00 AM to 6:29 AM | 23 (5.7%) | 25 (8.1%) |
| 6:30 AM to 6:59 AM | 8 (2.0%) | 34 (11.0%) |
| 7:00 AM to 7:29 AM | 8 (2.0%) | 49 (15.8%) |
| 7:30 AM to 7:59 AM | 77 (19.1%) | 30 (9.7%) |
| 8:00 AM to 8:29 AM | 91 (22.6%) | 56 (18.1%) |
| 8:30 AM to 8:59 AM | 9 (2.2%) | 21 (6.8%) |
| 9:00 AM to 9:59 AM | 14 (3.5%) | 18 (5.8%) |
| 10:00 AM to 10:59 AM | 5 (1.2%) | 32 (10.3%) |
| 11:00 AM to 11:59 AM | 0 (0.0%) | 13 (4.2%) |
| 12:00 PM to 3:59 PM | 56 (13.9%) | 0 (0.0%) |
| 4:00 PM to 11:59 PM | 21 (5.2%) | 9 (2.9%) |
| Total | 403 (100.0%) | 310 (100.0%) |
Housing Occupancy in Woodcreek
Occupancy by Ownership in Woodcreek
Of the total 1,128 dwellings in Woodcreek, owner-occupied units account for 687 (60.9%), while renter-occupied units make up 441 (39.1%).
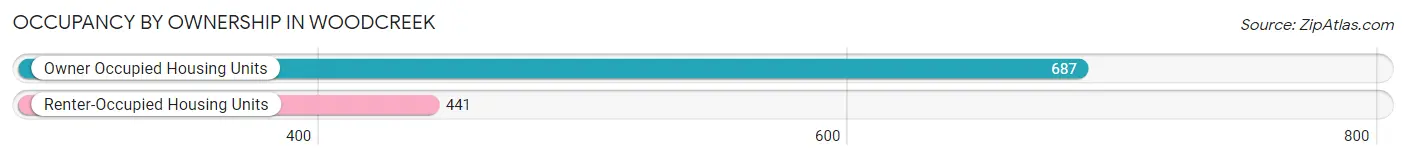
| Occupancy | # Housing Units | % Housing Units |
| Owner Occupied Housing Units | 687 | 60.9% |
| Renter-Occupied Housing Units | 441 | 39.1% |
| Total Occupied Housing Units | 1,128 | 100.0% |
Occupancy by Household Size in Woodcreek
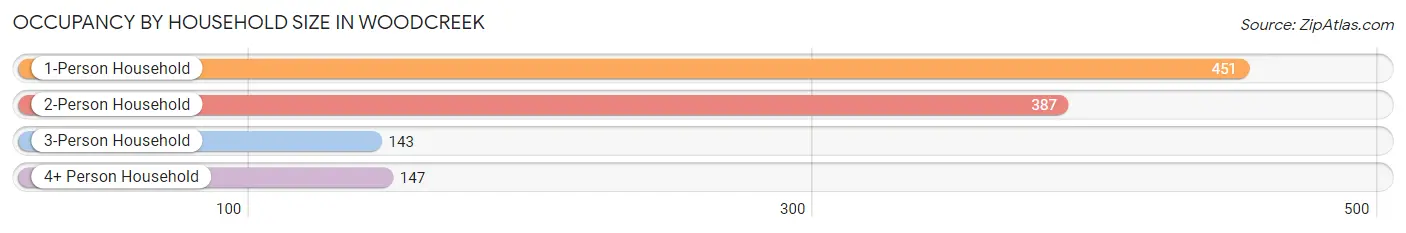
| Household Size | # Housing Units | % Housing Units |
| 1-Person Household | 451 | 40.0% |
| 2-Person Household | 387 | 34.3% |
| 3-Person Household | 143 | 12.7% |
| 4+ Person Household | 147 | 13.0% |
| Total Housing Units | 1,128 | 100.0% |
Occupancy by Ownership by Household Size in Woodcreek
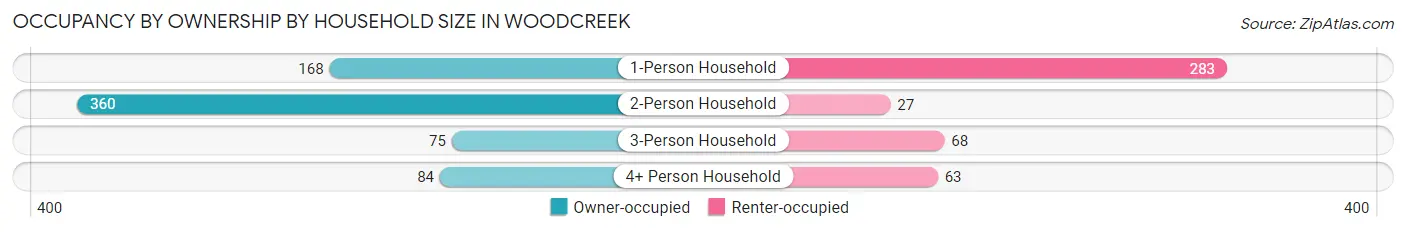
| Household Size | Owner-occupied | Renter-occupied |
| 1-Person Household | 168 (37.2%) | 283 (62.7%) |
| 2-Person Household | 360 (93.0%) | 27 (7.0%) |
| 3-Person Household | 75 (52.4%) | 68 (47.5%) |
| 4+ Person Household | 84 (57.1%) | 63 (42.9%) |
| Total Housing Units | 687 (60.9%) | 441 (39.1%) |
Occupancy by Educational Attainment in Woodcreek
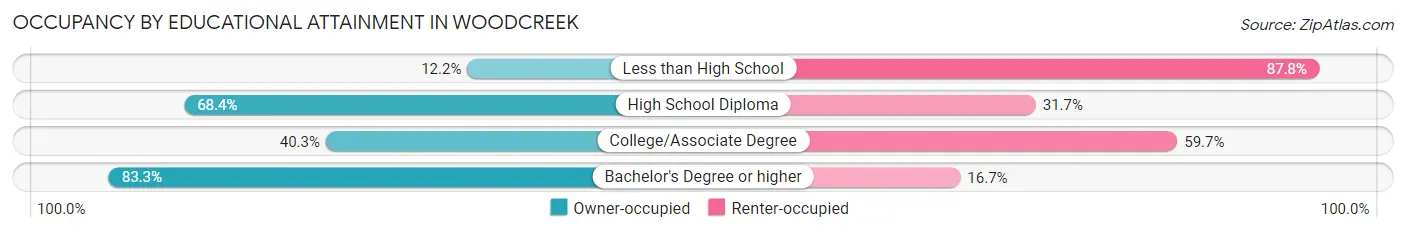
| Household Size | Owner-occupied | Renter-occupied |
| Less than High School | 6 (12.2%) | 43 (87.8%) |
| High School Diploma | 54 (68.3%) | 25 (31.7%) |
| College/Associate Degree | 193 (40.3%) | 286 (59.7%) |
| Bachelor's Degree or higher | 434 (83.3%) | 87 (16.7%) |
Occupancy by Age of Householder in Woodcreek
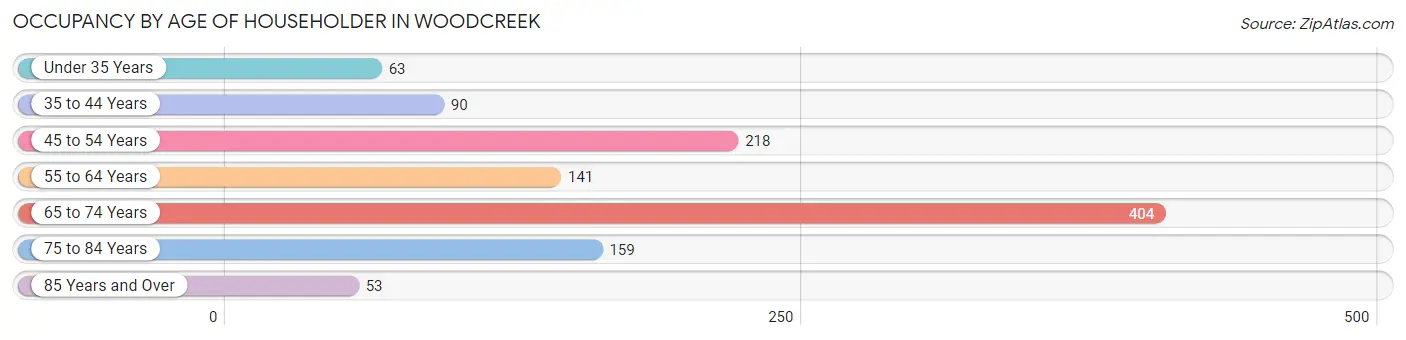
| Age Bracket | # Households | % Households |
| Under 35 Years | 63 | 5.6% |
| 35 to 44 Years | 90 | 8.0% |
| 45 to 54 Years | 218 | 19.3% |
| 55 to 64 Years | 141 | 12.5% |
| 65 to 74 Years | 404 | 35.8% |
| 75 to 84 Years | 159 | 14.1% |
| 85 Years and Over | 53 | 4.7% |
| Total | 1,128 | 100.0% |
Housing Finances in Woodcreek
Median Income by Occupancy in Woodcreek
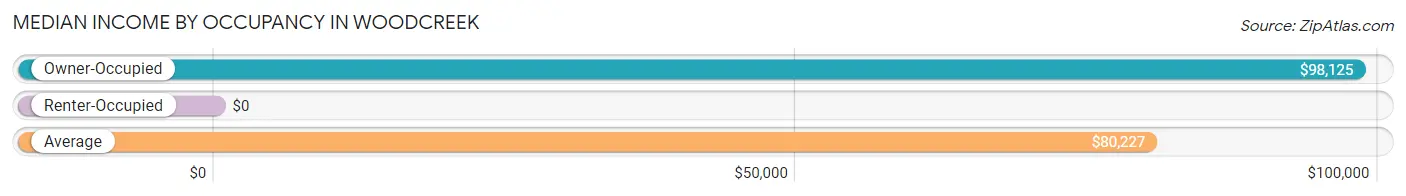
| Occupancy Type | # Households | Median Income |
| Owner-Occupied | 687 (60.9%) | $98,125 |
| Renter-Occupied | 441 (39.1%) | $0 |
| Average | 1,128 (100.0%) | $80,227 |
Occupancy by Householder Income Bracket in Woodcreek
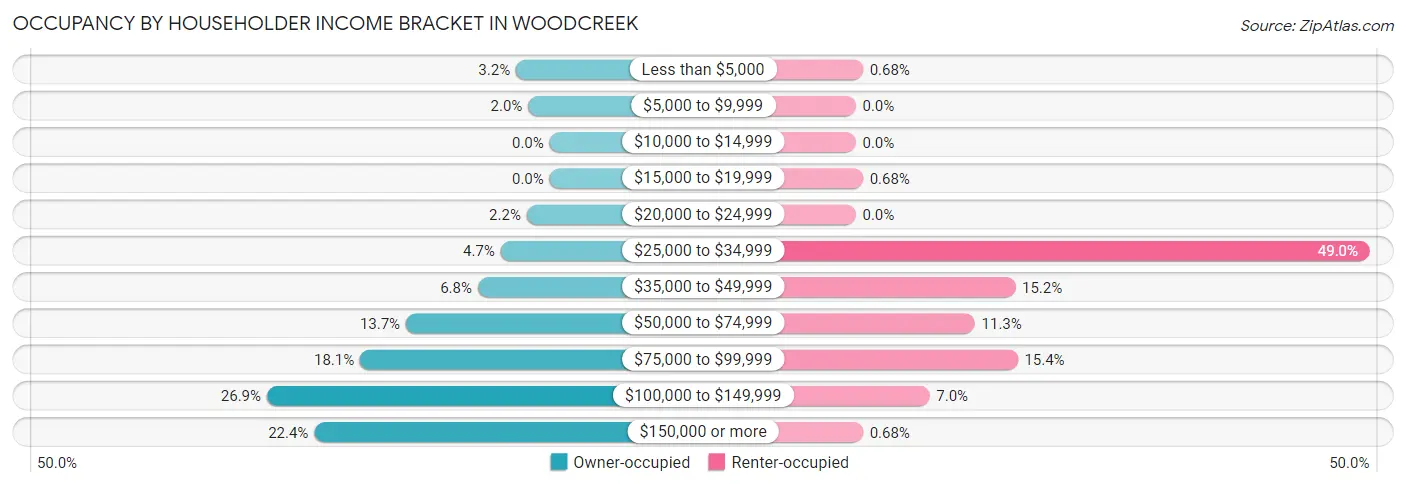
| Income Bracket | Owner-occupied | Renter-occupied |
| Less than $5,000 | 22 (3.2%) | 3 (0.7%) |
| $5,000 to $9,999 | 14 (2.0%) | 0 (0.0%) |
| $10,000 to $14,999 | 0 (0.0%) | 0 (0.0%) |
| $15,000 to $19,999 | 0 (0.0%) | 3 (0.7%) |
| $20,000 to $24,999 | 15 (2.2%) | 0 (0.0%) |
| $25,000 to $34,999 | 32 (4.7%) | 216 (49.0%) |
| $35,000 to $49,999 | 47 (6.8%) | 67 (15.2%) |
| $50,000 to $74,999 | 94 (13.7%) | 50 (11.3%) |
| $75,000 to $99,999 | 124 (18.0%) | 68 (15.4%) |
| $100,000 to $149,999 | 185 (26.9%) | 31 (7.0%) |
| $150,000 or more | 154 (22.4%) | 3 (0.7%) |
| Total | 687 (100.0%) | 441 (100.0%) |
Monthly Housing Cost Tiers in Woodcreek
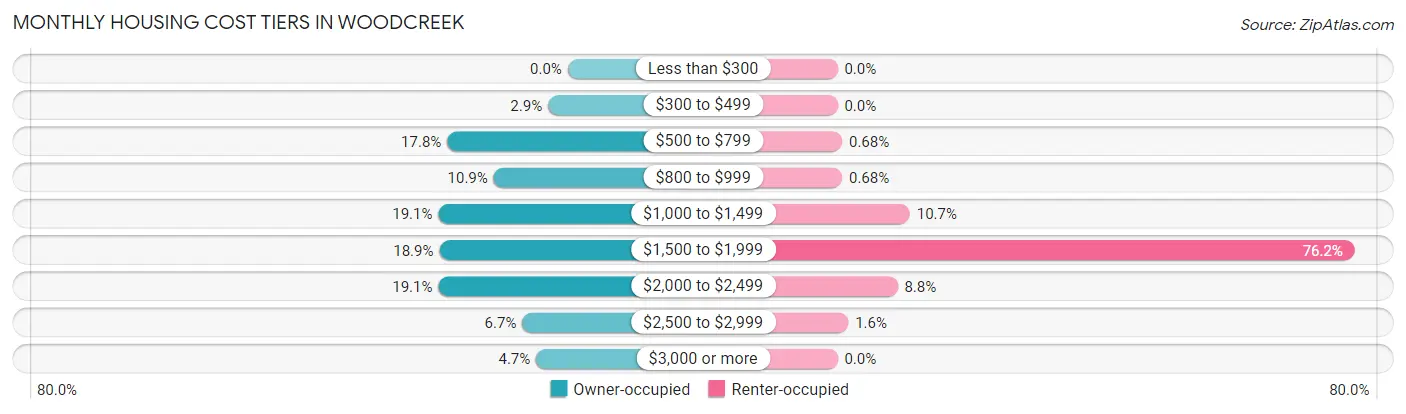
| Monthly Cost | Owner-occupied | Renter-occupied |
| Less than $300 | 0 (0.0%) | 0 (0.0%) |
| $300 to $499 | 20 (2.9%) | 0 (0.0%) |
| $500 to $799 | 122 (17.8%) | 3 (0.7%) |
| $800 to $999 | 75 (10.9%) | 3 (0.7%) |
| $1,000 to $1,499 | 131 (19.1%) | 47 (10.7%) |
| $1,500 to $1,999 | 130 (18.9%) | 336 (76.2%) |
| $2,000 to $2,499 | 131 (19.1%) | 39 (8.8%) |
| $2,500 to $2,999 | 46 (6.7%) | 7 (1.6%) |
| $3,000 or more | 32 (4.7%) | 0 (0.0%) |
| Total | 687 (100.0%) | 441 (100.0%) |
Physical Housing Characteristics in Woodcreek
Housing Structures in Woodcreek
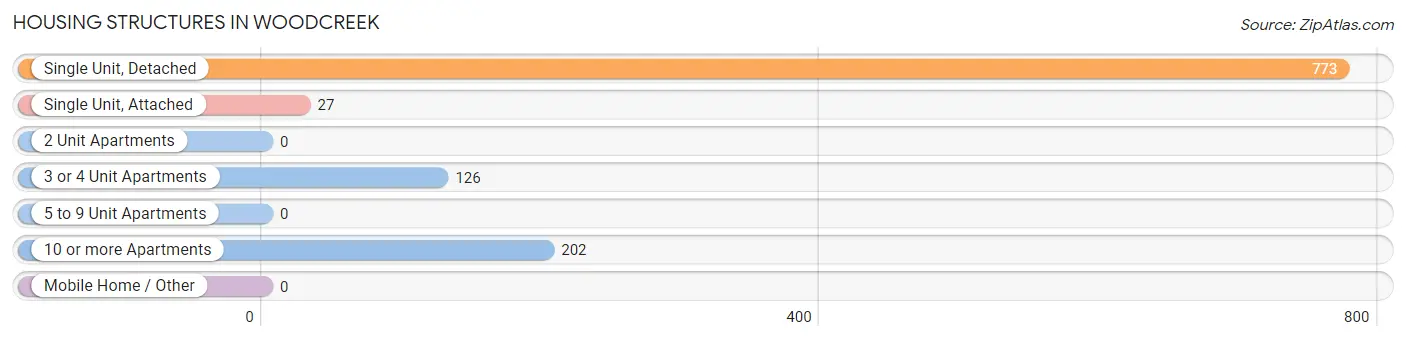
| Structure Type | # Housing Units | % Housing Units |
| Single Unit, Detached | 773 | 68.5% |
| Single Unit, Attached | 27 | 2.4% |
| 2 Unit Apartments | 0 | 0.0% |
| 3 or 4 Unit Apartments | 126 | 11.2% |
| 5 to 9 Unit Apartments | 0 | 0.0% |
| 10 or more Apartments | 202 | 17.9% |
| Mobile Home / Other | 0 | 0.0% |
| Total | 1,128 | 100.0% |
Housing Structures by Occupancy in Woodcreek
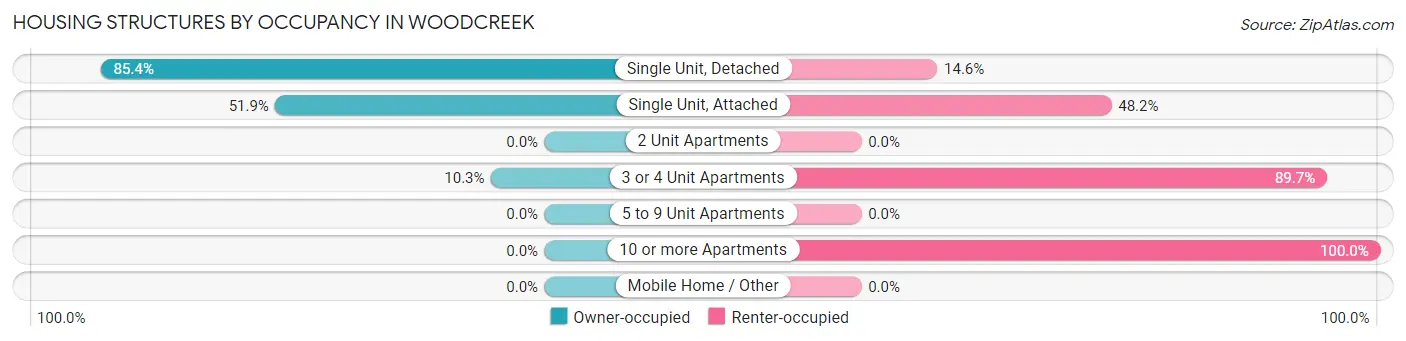
| Structure Type | Owner-occupied | Renter-occupied |
| Single Unit, Detached | 660 (85.4%) | 113 (14.6%) |
| Single Unit, Attached | 14 (51.8%) | 13 (48.1%) |
| 2 Unit Apartments | 0 (0.0%) | 0 (0.0%) |
| 3 or 4 Unit Apartments | 13 (10.3%) | 113 (89.7%) |
| 5 to 9 Unit Apartments | 0 (0.0%) | 0 (0.0%) |
| 10 or more Apartments | 0 (0.0%) | 202 (100.0%) |
| Mobile Home / Other | 0 (0.0%) | 0 (0.0%) |
| Total | 687 (60.9%) | 441 (39.1%) |
Housing Structures by Number of Rooms in Woodcreek
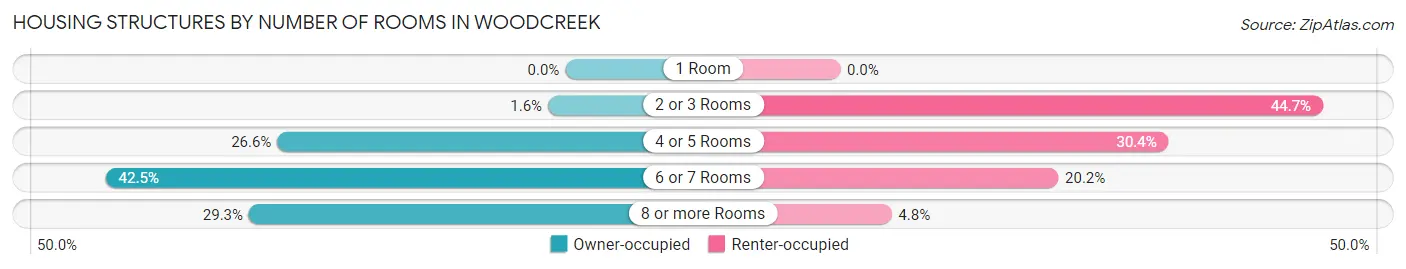
| Number of Rooms | Owner-occupied | Renter-occupied |
| 1 Room | 0 (0.0%) | 0 (0.0%) |
| 2 or 3 Rooms | 11 (1.6%) | 197 (44.7%) |
| 4 or 5 Rooms | 183 (26.6%) | 134 (30.4%) |
| 6 or 7 Rooms | 292 (42.5%) | 89 (20.2%) |
| 8 or more Rooms | 201 (29.3%) | 21 (4.8%) |
| Total | 687 (100.0%) | 441 (100.0%) |
Housing Structure by Heating Type in Woodcreek
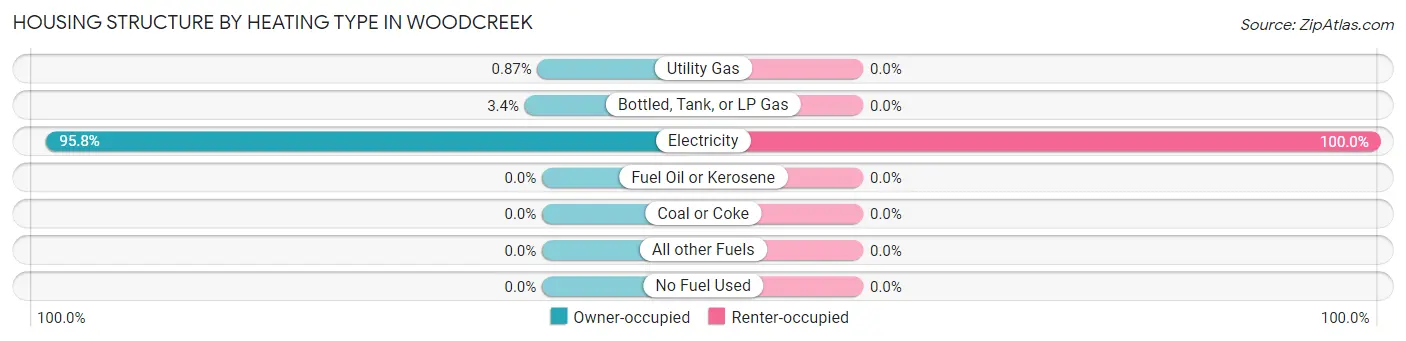
| Heating Type | Owner-occupied | Renter-occupied |
| Utility Gas | 6 (0.9%) | 0 (0.0%) |
| Bottled, Tank, or LP Gas | 23 (3.4%) | 0 (0.0%) |
| Electricity | 658 (95.8%) | 441 (100.0%) |
| Fuel Oil or Kerosene | 0 (0.0%) | 0 (0.0%) |
| Coal or Coke | 0 (0.0%) | 0 (0.0%) |
| All other Fuels | 0 (0.0%) | 0 (0.0%) |
| No Fuel Used | 0 (0.0%) | 0 (0.0%) |
| Total | 687 (100.0%) | 441 (100.0%) |
Household Vehicle Usage in Woodcreek
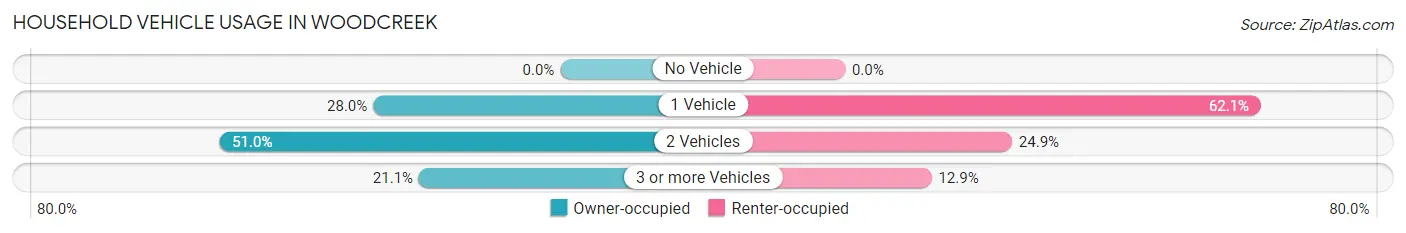
| Vehicles per Household | Owner-occupied | Renter-occupied |
| No Vehicle | 0 (0.0%) | 0 (0.0%) |
| 1 Vehicle | 192 (28.0%) | 274 (62.1%) |
| 2 Vehicles | 350 (50.9%) | 110 (24.9%) |
| 3 or more Vehicles | 145 (21.1%) | 57 (12.9%) |
| Total | 687 (100.0%) | 441 (100.0%) |
Real Estate & Mortgages in Woodcreek
Real Estate and Mortgage Overview in Woodcreek
| Characteristic | Without Mortgage | With Mortgage |
| Housing Units | 274 | 413 |
| Median Property Value | $336,100 | $403,600 |
| Median Household Income | $74,479 | $114 |
| Monthly Housing Costs | $810 | $29 |
| Real Estate Taxes | $4,867 | $0 |
Property Value by Mortgage Status in Woodcreek
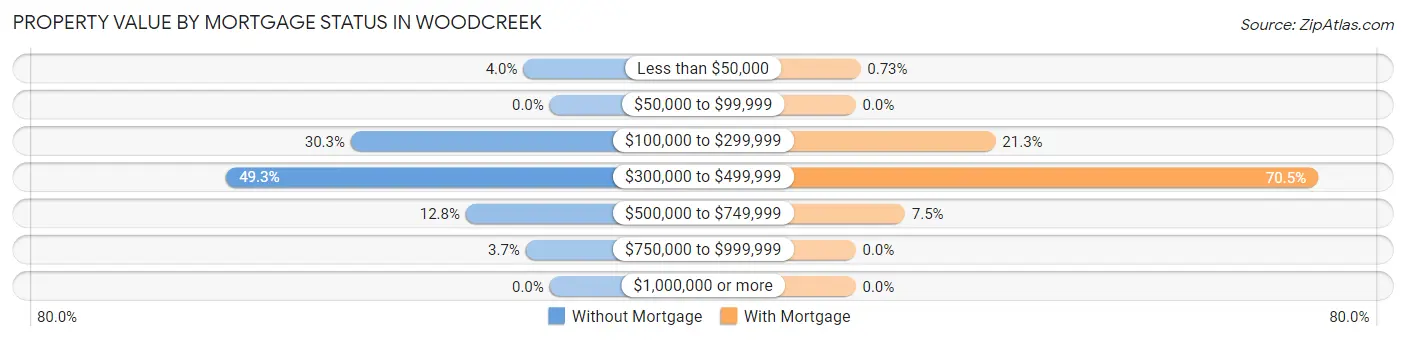
| Property Value | Without Mortgage | With Mortgage |
| Less than $50,000 | 11 (4.0%) | 3 (0.7%) |
| $50,000 to $99,999 | 0 (0.0%) | 0 (0.0%) |
| $100,000 to $299,999 | 83 (30.3%) | 88 (21.3%) |
| $300,000 to $499,999 | 135 (49.3%) | 291 (70.5%) |
| $500,000 to $749,999 | 35 (12.8%) | 31 (7.5%) |
| $750,000 to $999,999 | 10 (3.6%) | 0 (0.0%) |
| $1,000,000 or more | 0 (0.0%) | 0 (0.0%) |
| Total | 274 (100.0%) | 413 (100.0%) |
Household Income by Mortgage Status in Woodcreek
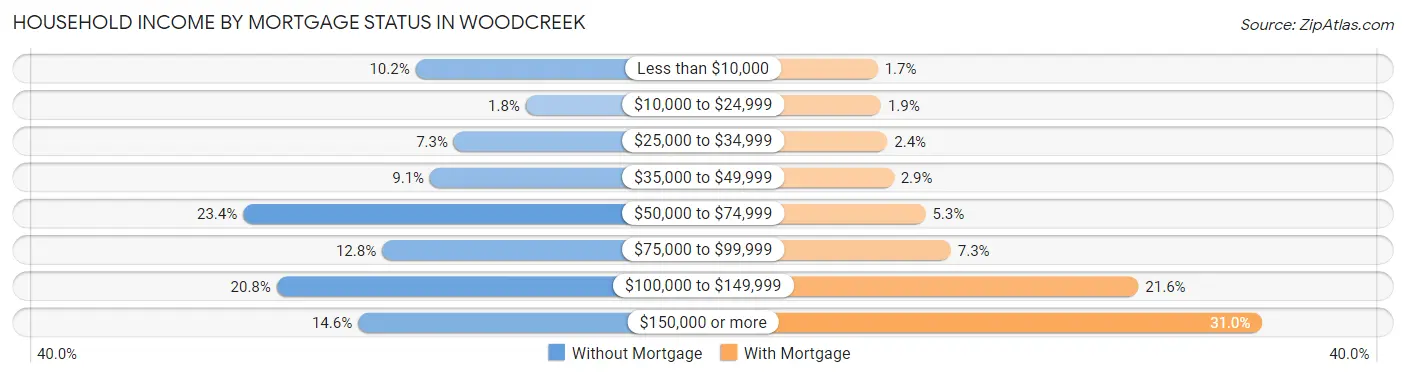
| Household Income | Without Mortgage | With Mortgage |
| Less than $10,000 | 28 (10.2%) | 7 (1.7%) |
| $10,000 to $24,999 | 5 (1.8%) | 8 (1.9%) |
| $25,000 to $34,999 | 20 (7.3%) | 10 (2.4%) |
| $35,000 to $49,999 | 25 (9.1%) | 12 (2.9%) |
| $50,000 to $74,999 | 64 (23.4%) | 22 (5.3%) |
| $75,000 to $99,999 | 35 (12.8%) | 30 (7.3%) |
| $100,000 to $149,999 | 57 (20.8%) | 89 (21.5%) |
| $150,000 or more | 40 (14.6%) | 128 (31.0%) |
| Total | 274 (100.0%) | 413 (100.0%) |
Property Value to Household Income Ratio in Woodcreek
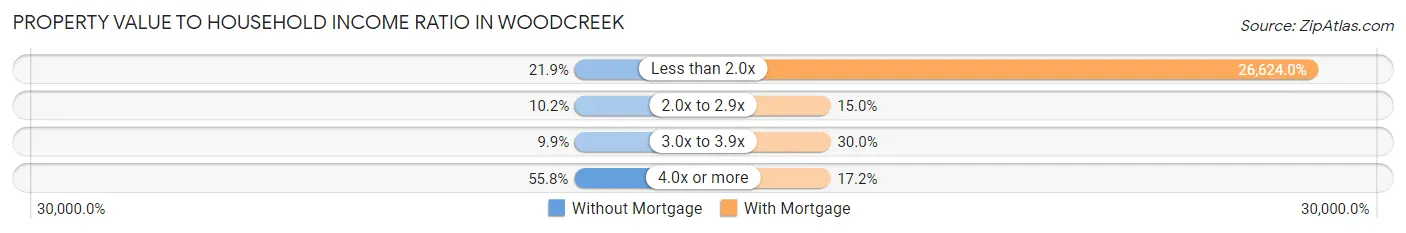
| Value-to-Income Ratio | Without Mortgage | With Mortgage |
| Less than 2.0x | 60 (21.9%) | 109,957 (26,624.0%) |
| 2.0x to 2.9x | 28 (10.2%) | 62 (15.0%) |
| 3.0x to 3.9x | 27 (9.9%) | 124 (30.0%) |
| 4.0x or more | 153 (55.8%) | 71 (17.2%) |
| Total | 274 (100.0%) | 413 (100.0%) |
Real Estate Taxes by Mortgage Status in Woodcreek
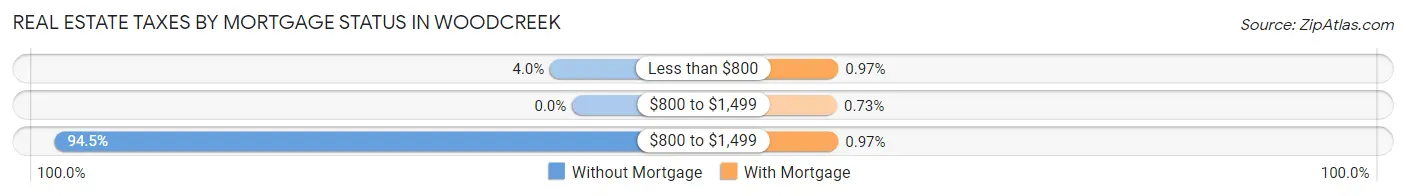
| Property Taxes | Without Mortgage | With Mortgage |
| Less than $800 | 11 (4.0%) | 4 (1.0%) |
| $800 to $1,499 | 0 (0.0%) | 3 (0.7%) |
| $800 to $1,499 | 259 (94.5%) | 4 (1.0%) |
| Total | 274 (100.0%) | 413 (100.0%) |
Health & Disability in Woodcreek
Health Insurance Coverage by Age in Woodcreek
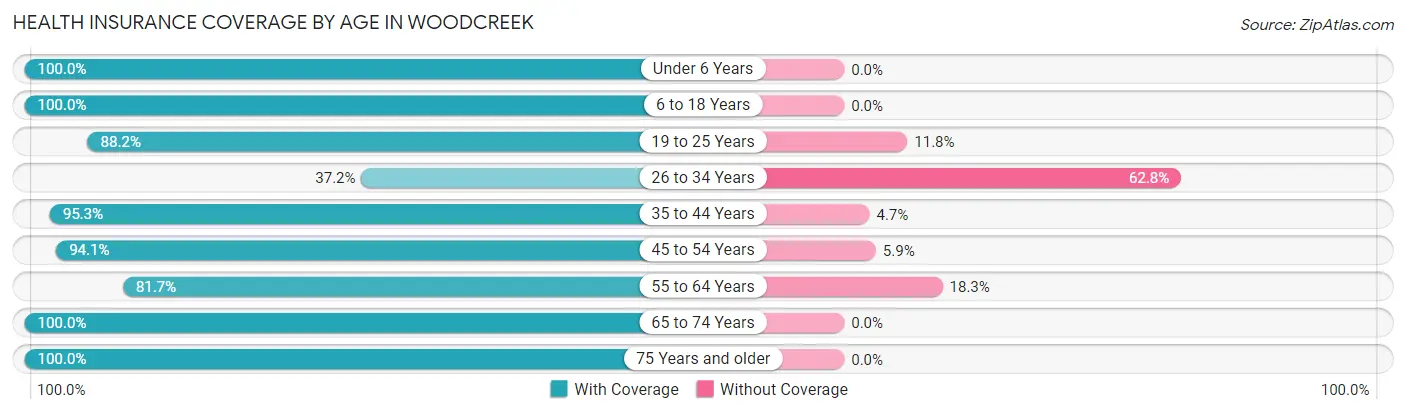
| Age Bracket | With Coverage | Without Coverage |
| Under 6 Years | 140 (100.0%) | 0 (0.0%) |
| 6 to 18 Years | 344 (100.0%) | 0 (0.0%) |
| 19 to 25 Years | 60 (88.2%) | 8 (11.8%) |
| 26 to 34 Years | 61 (37.2%) | 103 (62.8%) |
| 35 to 44 Years | 182 (95.3%) | 9 (4.7%) |
| 45 to 54 Years | 335 (94.1%) | 21 (5.9%) |
| 55 to 64 Years | 254 (81.7%) | 57 (18.3%) |
| 65 to 74 Years | 519 (100.0%) | 0 (0.0%) |
| 75 Years and older | 296 (100.0%) | 0 (0.0%) |
| Total | 2,191 (91.7%) | 198 (8.3%) |
Health Insurance Coverage by Citizenship Status in Woodcreek
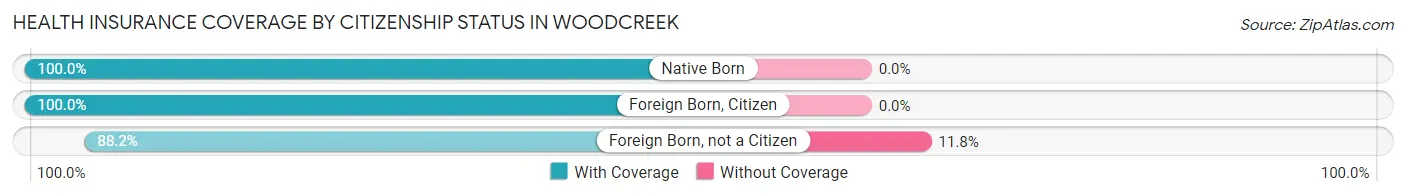
| Citizenship Status | With Coverage | Without Coverage |
| Native Born | 140 (100.0%) | 0 (0.0%) |
| Foreign Born, Citizen | 344 (100.0%) | 0 (0.0%) |
| Foreign Born, not a Citizen | 60 (88.2%) | 8 (11.8%) |
Health Insurance Coverage by Household Income in Woodcreek
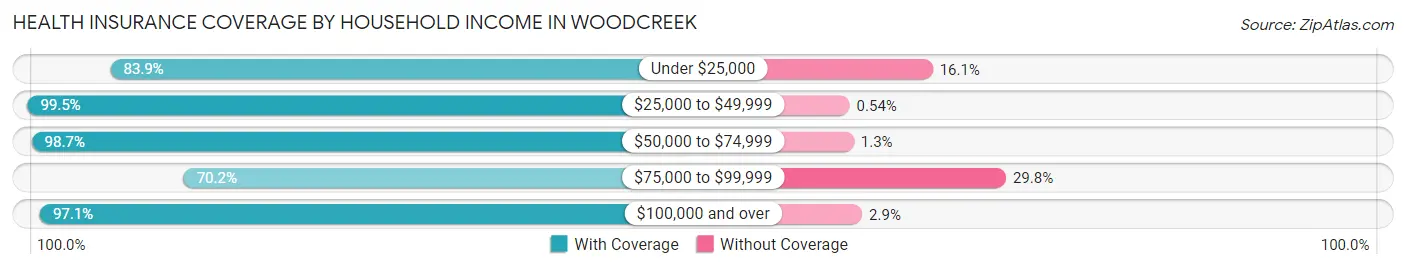
| Household Income | With Coverage | Without Coverage |
| Under $25,000 | 73 (83.9%) | 14 (16.1%) |
| $25,000 to $49,999 | 555 (99.5%) | 3 (0.5%) |
| $50,000 to $74,999 | 300 (98.7%) | 4 (1.3%) |
| $75,000 to $99,999 | 353 (70.2%) | 150 (29.8%) |
| $100,000 and over | 910 (97.1%) | 27 (2.9%) |
Public vs Private Health Insurance Coverage by Age in Woodcreek
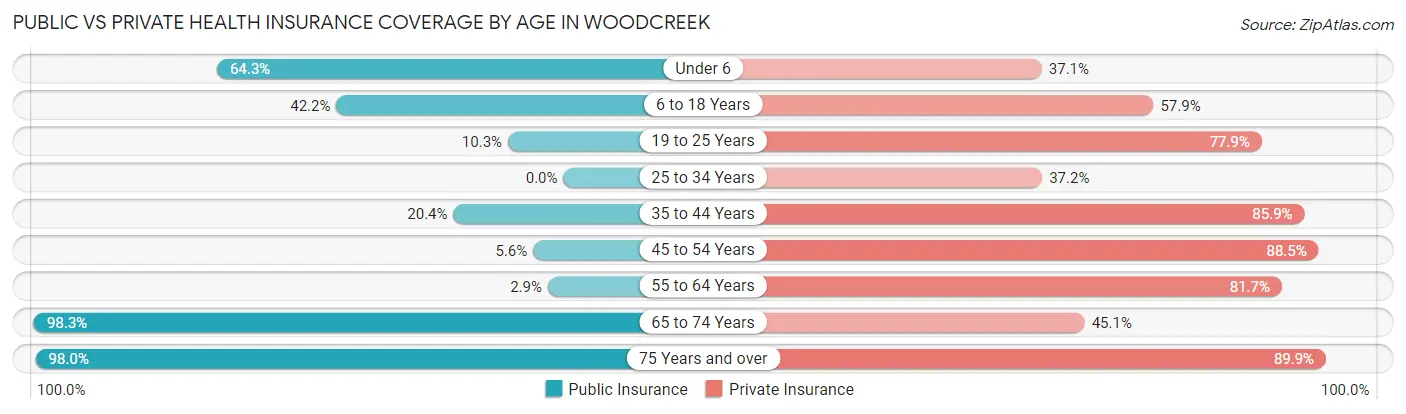
| Age Bracket | Public Insurance | Private Insurance |
| Under 6 | 90 (64.3%) | 52 (37.1%) |
| 6 to 18 Years | 145 (42.1%) | 199 (57.9%) |
| 19 to 25 Years | 7 (10.3%) | 53 (77.9%) |
| 25 to 34 Years | 0 (0.0%) | 61 (37.2%) |
| 35 to 44 Years | 39 (20.4%) | 164 (85.9%) |
| 45 to 54 Years | 20 (5.6%) | 315 (88.5%) |
| 55 to 64 Years | 9 (2.9%) | 254 (81.7%) |
| 65 to 74 Years | 510 (98.3%) | 234 (45.1%) |
| 75 Years and over | 290 (98.0%) | 266 (89.9%) |
| Total | 1,110 (46.5%) | 1,598 (66.9%) |
Disability Status by Sex by Age in Woodcreek
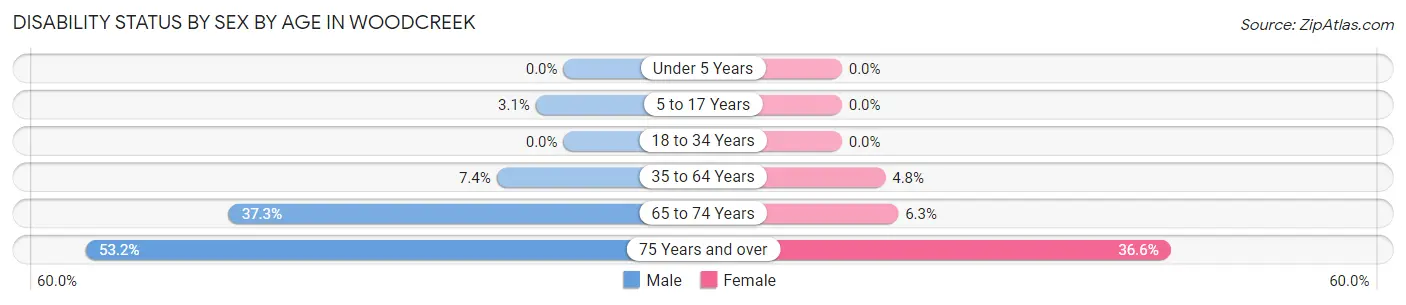
| Age Bracket | Male | Female |
| Under 5 Years | 0 (0.0%) | 0 (0.0%) |
| 5 to 17 Years | 6 (3.1%) | 0 (0.0%) |
| 18 to 34 Years | 0 (0.0%) | 0 (0.0%) |
| 35 to 64 Years | 30 (7.4%) | 22 (4.8%) |
| 65 to 74 Years | 57 (37.2%) | 23 (6.3%) |
| 75 Years and over | 76 (53.1%) | 56 (36.6%) |
Disability Class by Sex by Age in Woodcreek
Disability Class: Hearing Difficulty
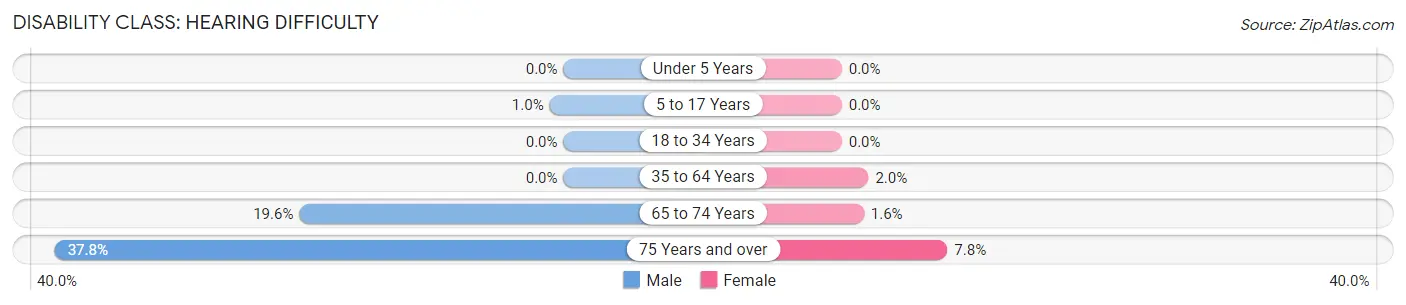
| Age Bracket | Male | Female |
| Under 5 Years | 0 (0.0%) | 0 (0.0%) |
| 5 to 17 Years | 2 (1.0%) | 0 (0.0%) |
| 18 to 34 Years | 0 (0.0%) | 0 (0.0%) |
| 35 to 64 Years | 0 (0.0%) | 9 (2.0%) |
| 65 to 74 Years | 30 (19.6%) | 6 (1.6%) |
| 75 Years and over | 54 (37.8%) | 12 (7.8%) |
Disability Class: Vision Difficulty
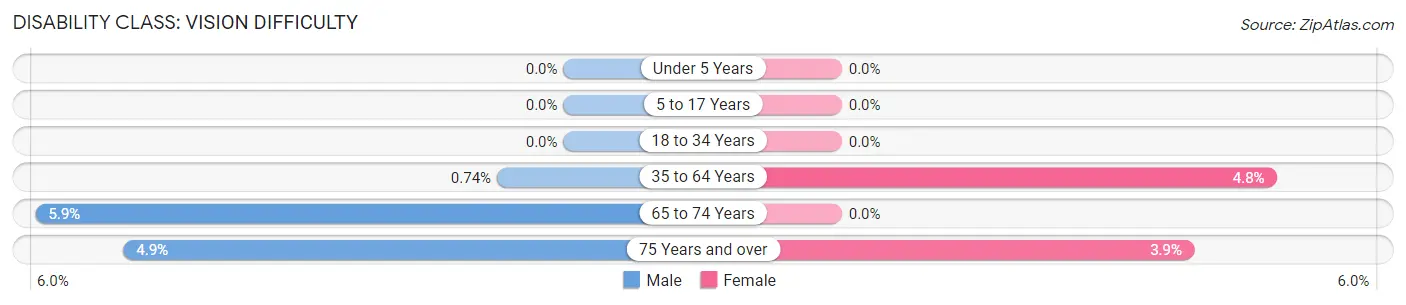
| Age Bracket | Male | Female |
| Under 5 Years | 0 (0.0%) | 0 (0.0%) |
| 5 to 17 Years | 0 (0.0%) | 0 (0.0%) |
| 18 to 34 Years | 0 (0.0%) | 0 (0.0%) |
| 35 to 64 Years | 3 (0.7%) | 22 (4.8%) |
| 65 to 74 Years | 9 (5.9%) | 0 (0.0%) |
| 75 Years and over | 7 (4.9%) | 6 (3.9%) |
Disability Class: Cognitive Difficulty
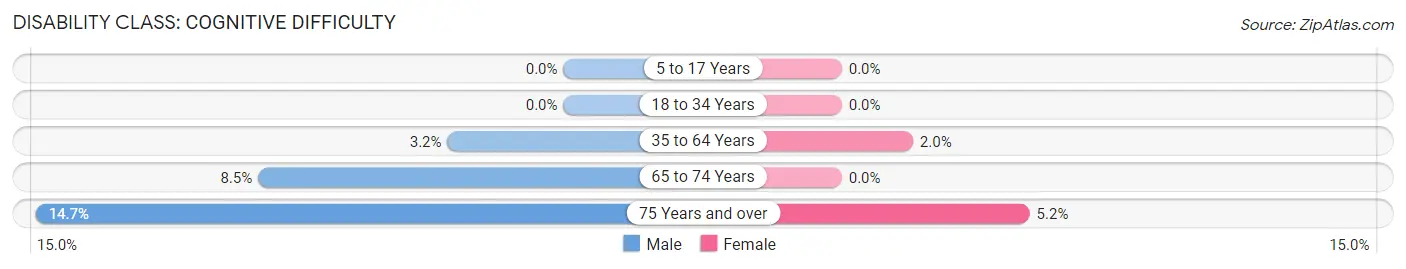
| Age Bracket | Male | Female |
| 5 to 17 Years | 0 (0.0%) | 0 (0.0%) |
| 18 to 34 Years | 0 (0.0%) | 0 (0.0%) |
| 35 to 64 Years | 13 (3.2%) | 9 (2.0%) |
| 65 to 74 Years | 13 (8.5%) | 0 (0.0%) |
| 75 Years and over | 21 (14.7%) | 8 (5.2%) |
Disability Class: Ambulatory Difficulty
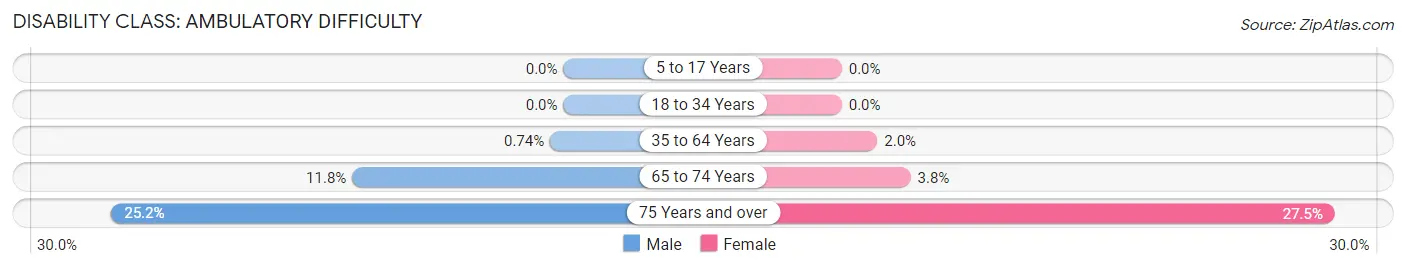
| Age Bracket | Male | Female |
| 5 to 17 Years | 0 (0.0%) | 0 (0.0%) |
| 18 to 34 Years | 0 (0.0%) | 0 (0.0%) |
| 35 to 64 Years | 3 (0.7%) | 9 (2.0%) |
| 65 to 74 Years | 18 (11.8%) | 14 (3.8%) |
| 75 Years and over | 36 (25.2%) | 42 (27.5%) |
Disability Class: Self-Care Difficulty
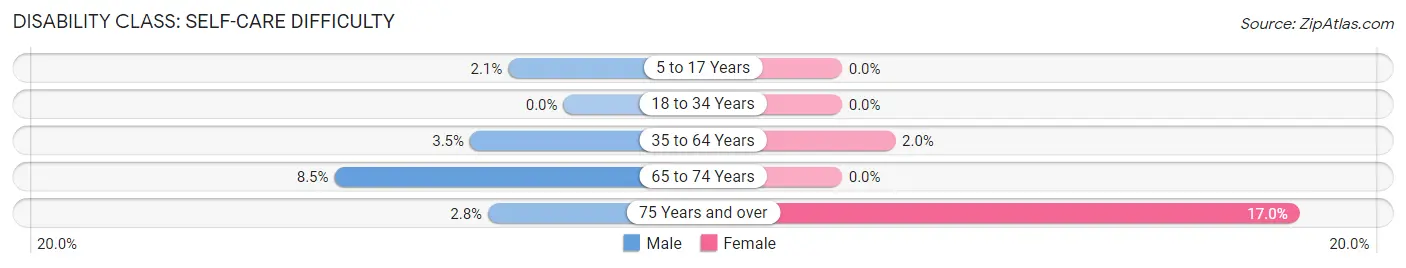
| Age Bracket | Male | Female |
| 5 to 17 Years | 4 (2.1%) | 0 (0.0%) |
| 18 to 34 Years | 0 (0.0%) | 0 (0.0%) |
| 35 to 64 Years | 14 (3.5%) | 9 (2.0%) |
| 65 to 74 Years | 13 (8.5%) | 0 (0.0%) |
| 75 Years and over | 4 (2.8%) | 26 (17.0%) |
Technology Access in Woodcreek
Computing Device Access in Woodcreek
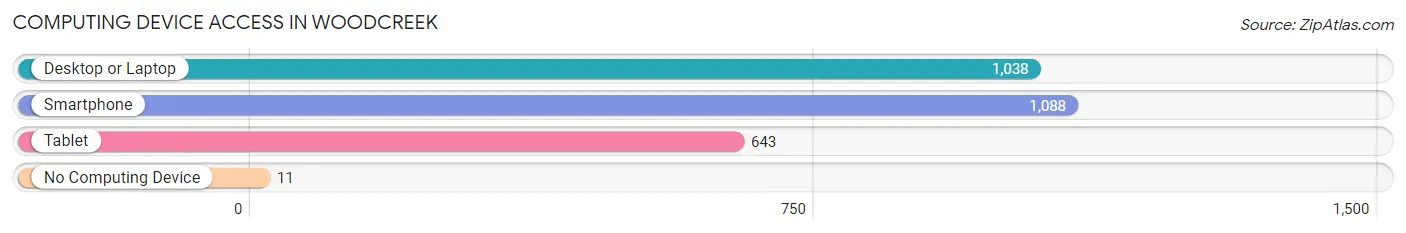
| Device Type | # Households | % Households |
| Desktop or Laptop | 1,038 | 92.0% |
| Smartphone | 1,088 | 96.5% |
| Tablet | 643 | 57.0% |
| No Computing Device | 11 | 1.0% |
| Total | 1,128 | 100.0% |
Internet Access in Woodcreek
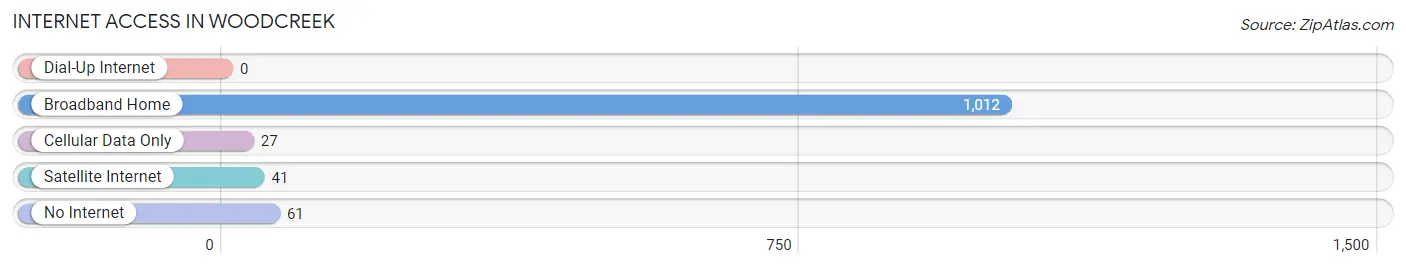
| Internet Type | # Households | % Households |
| Dial-Up Internet | 0 | 0.0% |
| Broadband Home | 1,012 | 89.7% |
| Cellular Data Only | 27 | 2.4% |
| Satellite Internet | 41 | 3.6% |
| No Internet | 61 | 5.4% |
| Total | 1,128 | 100.0% |
Woodcreek Summary
Woodcreek, Texas is a small town located in the northeastern part of the state, about 30 miles east of Austin. It is part of Bastrop County and is situated on the banks of the Colorado River. The town was founded in 1845 and has a population of about 1,000 people.
History
Woodcreek was founded in 1845 by a group of settlers from the nearby town of Bastrop. The settlers were looking for a place to settle and start a new life. The town was named after the nearby creek, which was named after the wooded area that surrounded it. The town was originally a farming community, but over time it developed into a small town with a variety of businesses.
In the late 1800s, the town was home to a cotton gin, a sawmill, a gristmill, and a blacksmith shop. The town also had a post office, a school, and a church. In the early 1900s, the town began to grow and the population increased. The town was incorporated in 1912 and the first mayor was elected in 1913.
Geography
Woodcreek is located in the northeastern part of Texas, about 30 miles east of Austin. It is situated on the banks of the Colorado River and is surrounded by rolling hills and wooded areas. The town is located in the Central Texas Hill Country and is part of the Texas Blackland Prairie region. The climate is generally mild and the average temperature is around 70 degrees Fahrenheit.
Economy
The economy of Woodcreek is largely based on agriculture and tourism. The town is home to several farms and ranches, which produce a variety of crops and livestock. The town also has a number of small businesses, including restaurants, shops, and services. Tourism is also an important part of the local economy, as the town is a popular destination for outdoor activities such as fishing, camping, and hiking.
Demographics
As of the 2010 census, the population of Woodcreek was 1,000 people. The racial makeup of the town was 94.2% White, 0.7% African American, 0.3% Native American, 0.2% Asian, 0.1% Pacific Islander, and 4.5% from other races. The median household income was $41,250 and the median family income was $50,000. The per capita income was $20,000. The town had a poverty rate of 11.3%.
Woodcreek is a small town with a rich history and a vibrant economy. It is a great place to live and work, and it offers a variety of activities and attractions for visitors. The town is a great place to raise a family and enjoy the beauty of the Texas Hill Country.
Common Questions
What is the Total Population of Woodcreek?
Total Population of Woodcreek is 2,389.
What is the Total Male Population of Woodcreek?
Total Male Population of Woodcreek is 1,108.
What is the Total Female Population of Woodcreek?
Total Female Population of Woodcreek is 1,281.
What is the Ratio of Males per 100 Females in Woodcreek?
There are 86.49 Males per 100 Females in Woodcreek.
What is the Ratio of Females per 100 Males in Woodcreek?
There are 115.61 Females per 100 Males in Woodcreek.
What is the Median Population Age in Woodcreek?
Median Population Age in Woodcreek is 51.9 Years.
What is the Average Family Size in Woodcreek
Average Family Size in Woodcreek is 2.9 People.
What is the Average Household Size in Woodcreek
Average Household Size in Woodcreek is 2.1 People.
What is Per Capita Income in Woodcreek?
Per Capita income in Woodcreek is $41,426.
What is the Median Family Income in Woodcreek?
Median Family Income in Woodcreek is $100,729.
What is the Median Household income in Woodcreek?
Median Household Income in Woodcreek is $80,227.
What is Inequality or Gini Index in Woodcreek?
Inequality or Gini Index in Woodcreek is 0.39.
How Large is the Labor Force in Woodcreek?
There are 1,060 People in the Labor Forcein in Woodcreek.
What is the Percentage of People in the Labor Force in Woodcreek?
53.5% of People are in the Labor Force in Woodcreek.
What is the Unemployment Rate in Woodcreek?
Unemployment Rate in Woodcreek is 16.7%.