Cities with the Highest Percentage of Immigrants from Turkey in the United States
RELATED REPORTS & OPTIONS
Turkey
United States
Compare Cities
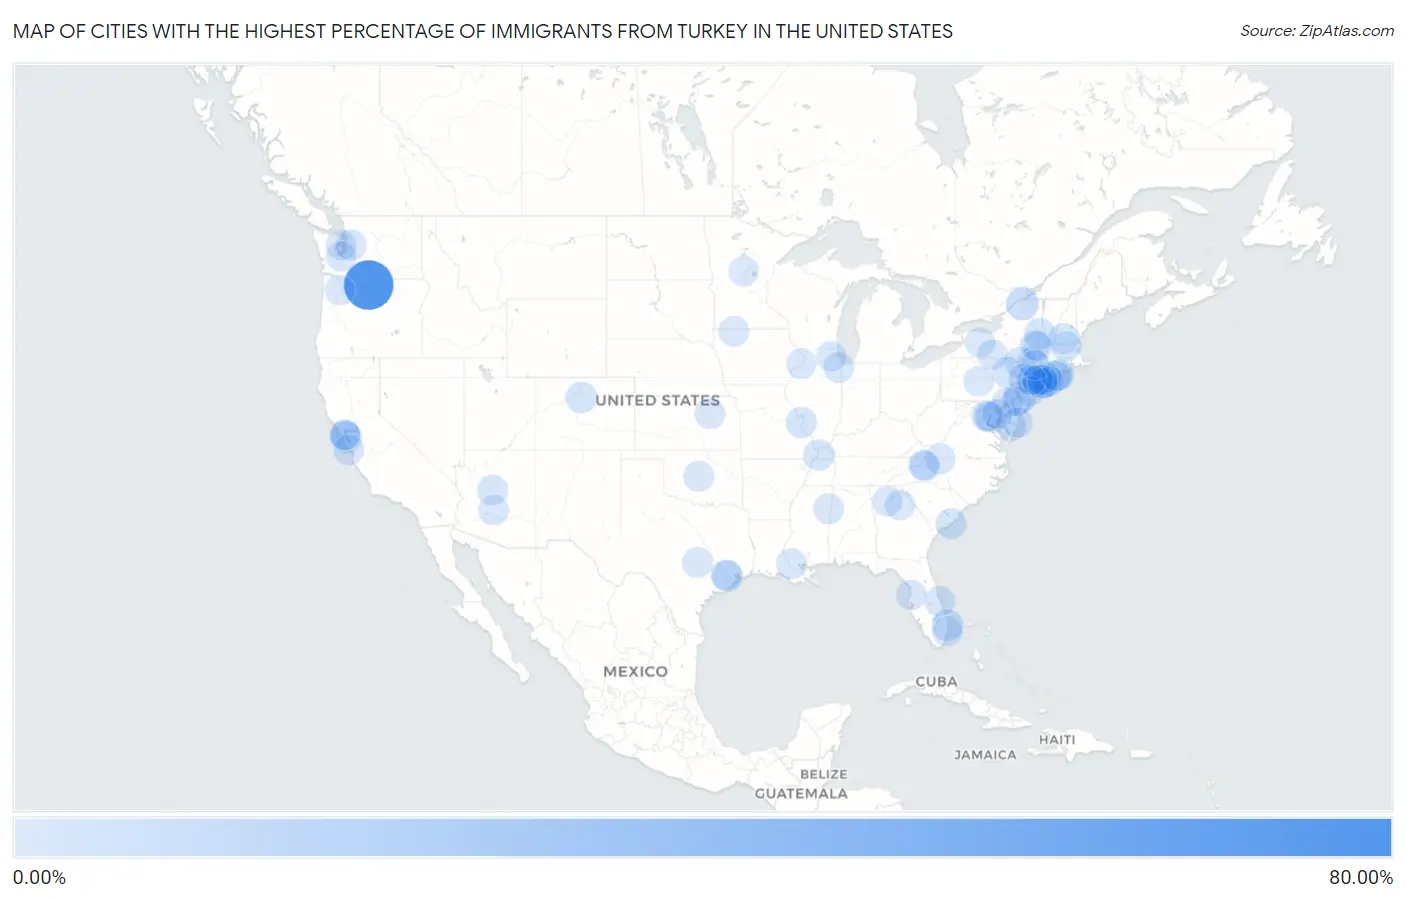
Map of Cities with the Highest Percentage of Immigrants from Turkey in the United States
0.00%
80.00%
Cities with the Highest Percentage of Immigrants from Turkey in the United States
| City | Turkey | vs State | vs National | |
| 1. | Maryhill | 62.16% | 0.039%(+62.1)#-1 | 0.042%(+62.1)#0 |
| 2. | Winthrop | 8.51% | 0.11%(+8.41)#-1 | 0.042%(+8.47)#1 |
| 3. | Ellisburg | 7.32% | 0.18%(+7.14)#-1 | 0.042%(+7.28)#2 |
| 4. | South Palm Beach | 5.28% | 0.051%(+5.23)#-1 | 0.042%(+5.24)#3 |
| 5. | Orient | 4.51% | 0.11%(+4.40)#0 | 0.042%(+4.47)#4 |
| 6. | Fraser | 4.34% | 0.023%(+4.32)#-1 | 0.042%(+4.30)#5 |
| 7. | Greenvale | 4.12% | 0.11%(+4.02)#1 | 0.042%(+4.08)#6 |
| 8. | Stafford | 3.78% | 0.045%(+3.74)#-1 | 0.042%(+3.74)#7 |
| 9. | Bennington | 3.56% | 0.032%(+3.53)#-1 | 0.042%(+3.51)#8 |
| 10. | Indian Field | 3.55% | 0.062%(+3.49)#-1 | 0.042%(+3.51)#9 |
| 11. | Brisbane | 3.53% | 0.052%(+3.48)#31 | 0.042%(+3.49)#187 |
| 12. | Jeffersonville | 3.46% | 0.11%(+3.35)#2 | 0.042%(+3.41)#188 |
| 13. | Hudson | 3.35% | 0.034%(+3.32)#-1 | 0.042%(+3.31)#189 |
| 14. | Plandome Manor | 3.31% | 0.11%(+3.20)#3 | 0.042%(+3.27)#190 |
| 15. | Moorefield | 3.11% | 0.083%(+3.03)#-1 | 0.042%(+3.07)#191 |
| 16. | Fort Edward | 3.01% | 0.11%(+2.91)#4 | 0.042%(+2.97)#192 |
| 17. | Isle Of Palms | 2.90% | 0.014%(+2.88)#-1 | 0.042%(+2.86)#193 |
| 18. | East Rutherford Borough | 2.80% | 0.18%(+2.62)#0 | 0.042%(+2.76)#194 |
| 19. | Columbus | 2.66% | 0.0056%(+2.65)#-1 | 0.042%(+2.62)#195 |
| 20. | Green Park | 2.64% | 0.015%(+2.63)#-1 | 0.042%(+2.60)#196 |
| 21. | Nesconset | 2.61% | 0.11%(+2.50)#5 | 0.042%(+2.56)#197 |
| 22. | Guttenberg | 2.42% | 0.18%(+2.24)#1 | 0.042%(+2.38)#198 |
| 23. | Flossmoor | 2.32% | 0.038%(+2.28)#-1 | 0.042%(+2.28)#199 |
| 24. | Mechanicsville | 2.21% | 0.062%(+2.15)#0 | 0.042%(+2.17)#200 |
| 25. | New Paltz | 2.20% | 0.11%(+2.09)#6 | 0.042%(+2.16)#201 |
| 26. | Belvedere | 2.19% | 0.052%(+2.14)#32 | 0.042%(+2.15)#202 |
| 27. | Locust Valley | 2.13% | 0.11%(+2.03)#7 | 0.042%(+2.09)#203 |
| 28. | Wells Branch | 2.12% | 0.045%(+2.07)#25 | 0.042%(+2.07)#546 |
| 29. | National Harbor | 2.11% | 0.062%(+2.05)#-1 | 0.042%(+2.07)#547 |
| 30. | Fruitland | 2.11% | 0.062%(+2.04)#0 | 0.042%(+2.06)#548 |
| 31. | Columbus Afb | 2.10% | 0.0023%(+2.10)#-1 | 0.042%(+2.06)#549 |
| 32. | Nichols Hills | 2.08% | 0.012%(+2.06)#-1 | 0.042%(+2.03)#550 |
| 33. | Clarkdale | 2.01% | 0.024%(+1.99)#-1 | 0.042%(+1.97)#551 |
| 34. | East Marion | 1.98% | 0.11%(+1.88)#8 | 0.042%(+1.94)#552 |
| 35. | Cliffside Park Borough | 1.97% | 0.18%(+1.79)#18 | 0.042%(+1.93)#553 |
| 36. | Bonny Doon | 1.96% | 0.052%(+1.91)#33 | 0.042%(+1.92)#554 |
| 37. | Glen Rock Borough | 1.93% | 0.18%(+1.75)#19 | 0.042%(+1.89)#555 |
| 38. | Indialantic | 1.92% | 0.051%(+1.87)#0 | 0.042%(+1.88)#556 |
| 39. | Preakness | 1.78% | 0.18%(+1.60)#81 | 0.042%(+1.74)#1,013 |
| 40. | North Lindenhurst | 1.76% | 0.11%(+1.65)#9 | 0.042%(+1.71)#1,014 |
| 41. | Byram Center | 1.73% | 0.18%(+1.55)#82 | 0.042%(+1.68)#1,015 |
| 42. | Elkton | 1.69% | 0.062%(+1.63)#1 | 0.042%(+1.65)#1,016 |
| 43. | University Gardens | 1.68% | 0.11%(+1.57)#17 | 0.042%(+1.64)#1,017 |
| 44. | Carlls Corner | 1.68% | 0.18%(+1.50)#83 | 0.042%(+1.64)#1,018 |
| 45. | Wind Gap Borough | 1.68% | 0.034%(+1.64)#0 | 0.042%(+1.63)#1,019 |
| 46. | Okoboji | 1.66% | 0.0090%(+1.65)#-1 | 0.042%(+1.62)#1,020 |
| 47. | The Ponds | 1.64% | 0.18%(+1.45)#84 | 0.042%(+1.59)#1,021 |
| 48. | Ames Lake | 1.62% | 0.039%(+1.59)#0 | 0.042%(+1.58)#1,022 |
| 49. | Grandview Plaza | 1.62% | 0.011%(+1.61)#-1 | 0.042%(+1.58)#1,023 |
| 50. | Four Corners | 1.57% | 0.045%(+1.53)#26 | 0.042%(+1.53)#1,024 |
| 51. | Fort Lee Borough | 1.57% | 0.18%(+1.39)#85 | 0.042%(+1.53)#1,025 |
| 52. | North Arlington Borough | 1.57% | 0.18%(+1.38)#86 | 0.042%(+1.52)#1,026 |
| 53. | Deal Borough | 1.55% | 0.18%(+1.37)#87 | 0.042%(+1.51)#1,027 |
| 54. | Big Flats | 1.54% | 0.11%(+1.44)#18 | 0.042%(+1.50)#1,028 |
| 55. | Westmere | 1.54% | 0.11%(+1.43)#19 | 0.042%(+1.50)#1,029 |
| 56. | Chico | 1.53% | 0.039%(+1.49)#1 | 0.042%(+1.49)#1,030 |
| 57. | Stirling | 1.50% | 0.18%(+1.32)#88 | 0.042%(+1.46)#1,031 |
| 58. | Park Forest Village | 1.48% | 0.034%(+1.45)#1 | 0.042%(+1.44)#1,032 |
| 59. | Cresskill Borough | 1.47% | 0.18%(+1.29)#89 | 0.042%(+1.43)#1,033 |
| 60. | Old Field | 1.47% | 0.11%(+1.37)#20 | 0.042%(+1.43)#1,034 |
| 61. | Paradise Valley | 1.46% | 0.024%(+1.44)#3 | 0.042%(+1.42)#1,035 |
| 62. | East Patchogue | 1.46% | 0.11%(+1.35)#45 | 0.042%(+1.42)#1,036 |
| 63. | East Islip | 1.41% | 0.11%(+1.30)#46 | 0.042%(+1.36)#1,037 |
| 64. | Mount Airy | 1.39% | 0.029%(+1.36)#-1 | 0.042%(+1.35)#1,038 |
| 65. | Amityville | 1.37% | 0.11%(+1.26)#47 | 0.042%(+1.33)#1,039 |
| 66. | New Milford Borough | 1.34% | 0.18%(+1.16)#90 | 0.042%(+1.30)#1,040 |
| 67. | East Greenbush | 1.31% | 0.11%(+1.20)#48 | 0.042%(+1.27)#1,041 |
| 68. | Port Washington North | 1.29% | 0.11%(+1.19)#49 | 0.042%(+1.25)#1,042 |
| 69. | Dupont | 1.29% | 0.039%(+1.25)#2 | 0.042%(+1.24)#1,043 |
| 70. | Millville | 1.27% | 0.11%(+1.16)#-1 | 0.042%(+1.22)#1,044 |
| 71. | West Freehold | 1.20% | 0.18%(+1.02)#91 | 0.042%(+1.16)#1,045 |
| 72. | Red Oaks Mill | 1.19% | 0.11%(+1.08)#50 | 0.042%(+1.14)#1,046 |
| 73. | East Gull Lake | 1.17% | 0.017%(+1.15)#-1 | 0.042%(+1.13)#1,047 |
| 74. | Carlstadt Borough | 1.15% | 0.18%(+0.970)#92 | 0.042%(+1.11)#1,048 |
| 75. | Seaside Heights Borough | 1.13% | 0.18%(+0.953)#93 | 0.042%(+1.09)#1,049 |
| 76. | Fair Oaks | 1.13% | 0.083%(+1.05)#74 | 0.042%(+1.09)#1,081 |
| 77. | Geneseo | 1.13% | 0.11%(+1.02)#51 | 0.042%(+1.09)#1,082 |
| 78. | Lunenburg | 1.12% | 0.075%(+1.04)#-1 | 0.042%(+1.07)#1,083 |
| 79. | Blowing Rock | 1.11% | 0.029%(+1.08)#0 | 0.042%(+1.07)#1,084 |
| 80. | Harveys Lake Borough | 1.11% | 0.034%(+1.08)#2 | 0.042%(+1.07)#1,085 |
| 81. | Watkinsville | 1.10% | 0.028%(+1.07)#-1 | 0.042%(+1.06)#1,086 |
| 82. | Mullica Hill | 1.10% | 0.18%(+0.919)#94 | 0.042%(+1.06)#1,087 |
| 83. | Alpharetta | 1.10% | 0.028%(+1.07)#0 | 0.042%(+1.05)#1,088 |
| 84. | Seven Corners | 1.08% | 0.083%(+1.00)#75 | 0.042%(+1.04)#1,089 |
| 85. | Frazer | 1.08% | 0.034%(+1.05)#17 | 0.042%(+1.04)#1,090 |
| 86. | Herald Harbor | 1.08% | 0.062%(+1.02)#2 | 0.042%(+1.04)#1,091 |
| 87. | Cedar Knolls | 1.08% | 0.18%(+0.895)#95 | 0.042%(+1.03)#1,092 |
| 88. | Cordova | 1.08% | 0.038%(+1.04)#0 | 0.042%(+1.03)#1,093 |
| 89. | Oak Hills Place | 1.07% | 0.015%(+1.05)#8 | 0.042%(+1.02)#1,094 |
| 90. | Heritage Pines | 1.06% | 0.051%(+1.01)#1 | 0.042%(+1.02)#1,095 |
| 91. | Foscoe | 1.06% | 0.029%(+1.03)#1 | 0.042%(+1.02)#1,096 |
| 92. | Southold | 1.05% | 0.11%(+0.944)#52 | 0.042%(+1.01)#1,097 |
| 93. | Woodland Park Borough | 1.05% | 0.18%(+0.864)#96 | 0.042%(+1.00)#1,098 |
| 94. | South Huntington | 1.04% | 0.11%(+0.933)#53 | 0.042%(+0.996)#1,099 |
| 95. | Tiburon | 1.02% | 0.052%(+0.968)#34 | 0.042%(+0.978)#1,100 |
| 96. | Lauderdale By The Sea | 1.00% | 0.051%(+0.949)#2 | 0.042%(+0.957)#1,101 |
| 97. | Metzger | 0.99% | 0.030%(+0.961)#-1 | 0.042%(+0.949)#1,102 |
| 98. | Clifton | 0.98% | 0.18%(+0.802)#97 | 0.042%(+0.941)#1,103 |
| 99. | East Dundee | 0.98% | 0.038%(+0.944)#1 | 0.042%(+0.940)#1,104 |
| 100. | South Wilton | 0.98% | 0.062%(+0.919)#1 | 0.042%(+0.938)#1,105 |
Common Questions
What are the Top 10 Cities with the Highest Percentage of Immigrants from Turkey in the United States?
Top 10 Cities with the Highest Percentage of Immigrants from Turkey in the United States are:
What city has the Highest Percentage of Immigrants from Turkey in the United States?
Maryhill has the Highest Percentage of Immigrants from Turkey in the United States with 62.16%.
What is the Percentage of Immigrants from Turkey in the United States?
Percentage of Immigrants from Turkey in the United States is 0.042%.