Cities with the Highest Percentage of Immigrants from Turkey in Florida
RELATED REPORTS & OPTIONS
Turkey
Florida
Compare Cities
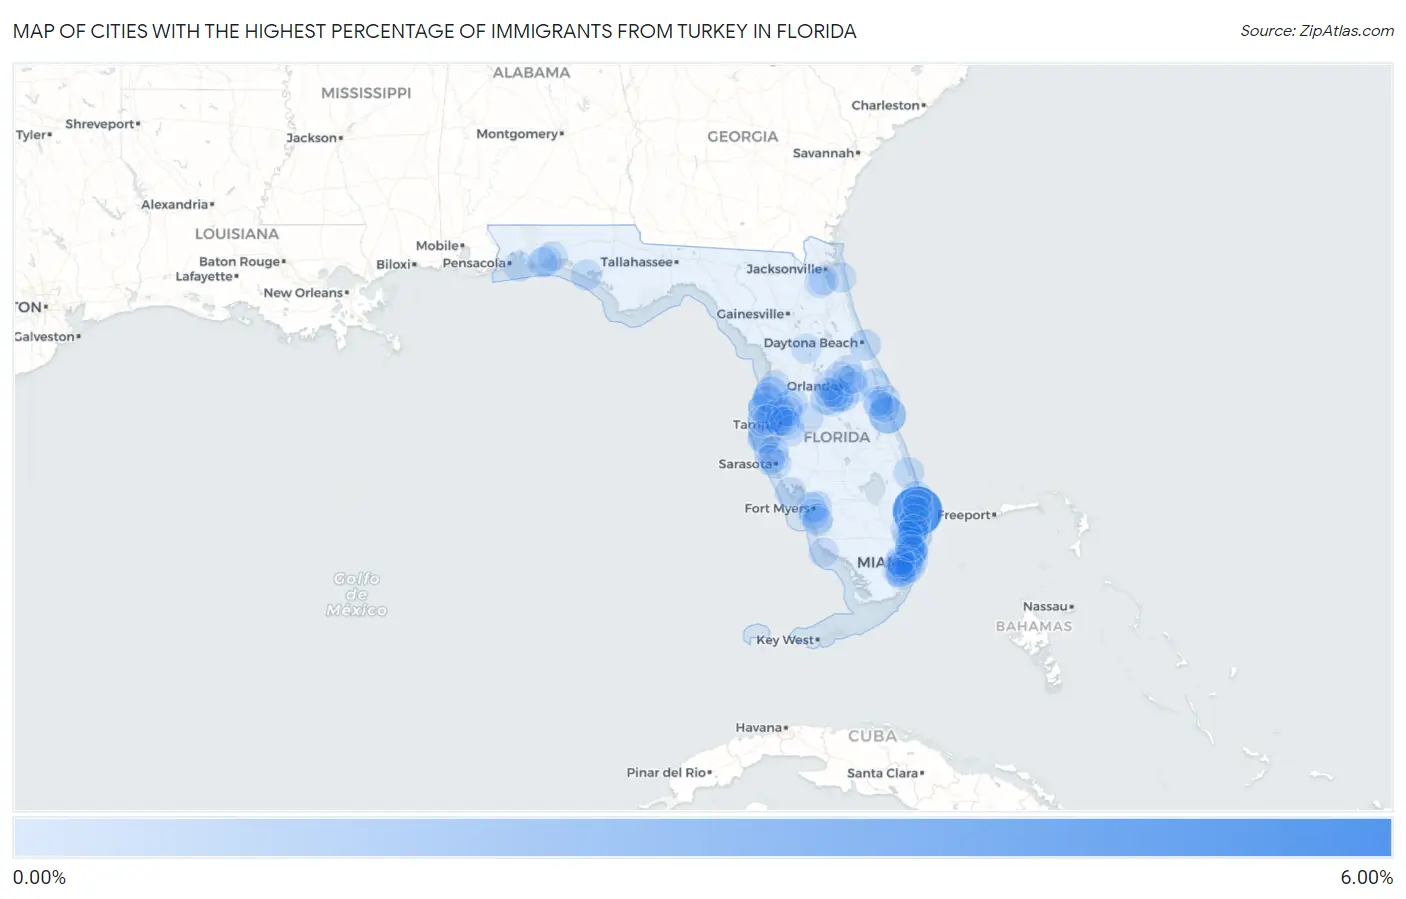
Map of Cities with the Highest Percentage of Immigrants from Turkey in Florida
0.00%
6.00%
Cities with the Highest Percentage of Immigrants from Turkey in Florida
| City | Turkey | vs State | vs National | |
| 1. | South Palm Beach | 5.28% | 0.051%(+5.23)#-1 | 0.042%(+5.24)#0 |
| 2. | Indialantic | 1.92% | 0.051%(+1.87)#0 | 0.042%(+1.88)#1 |
| 3. | Heritage Pines | 1.06% | 0.051%(+1.01)#1 | 0.042%(+1.02)#2 |
| 4. | Lauderdale By The Sea | 1.00% | 0.051%(+0.949)#2 | 0.042%(+0.957)#3 |
| 5. | Lake Magdalene | 0.77% | 0.051%(+0.716)#3 | 0.042%(+0.725)#4 |
| 6. | Bear Creek | 0.68% | 0.051%(+0.627)#4 | 0.042%(+0.635)#5 |
| 7. | South Pasadena | 0.67% | 0.051%(+0.624)#5 | 0.042%(+0.633)#6 |
| 8. | Ojus | 0.64% | 0.051%(+0.588)#55 | 0.042%(+0.596)#637 |
| 9. | Boca Raton | 0.57% | 0.051%(+0.516)#82 | 0.042%(+0.524)#837 |
| 10. | Williamsburg | 0.54% | 0.051%(+0.485)#83 | 0.042%(+0.493)#838 |
| 11. | Four Corners | 0.51% | 0.051%(+0.457)#148 | 0.042%(+0.465)#1,519 |
| 12. | Aventura | 0.49% | 0.051%(+0.439)#149 | 0.042%(+0.447)#1,520 |
| 13. | Citrus Park | 0.48% | 0.051%(+0.430)#150 | 0.042%(+0.438)#1,521 |
| 14. | Daytona Beach Shores | 0.47% | 0.051%(+0.421)#151 | 0.042%(+0.429)#1,522 |
| 15. | Alafaya | 0.45% | 0.051%(+0.402)#152 | 0.042%(+0.410)#1,523 |
| 16. | Jasmine Estates | 0.41% | 0.051%(+0.357)#153 | 0.042%(+0.365)#1,524 |
| 17. | Beacon Square | 0.38% | 0.051%(+0.331)#154 | 0.042%(+0.340)#1,525 |
| 18. | Panama City Beach | 0.33% | 0.051%(+0.283)#155 | 0.042%(+0.291)#1,526 |
| 19. | Titusville | 0.33% | 0.051%(+0.279)#156 | 0.042%(+0.287)#1,527 |
| 20. | Tice | 0.33% | 0.051%(+0.278)#157 | 0.042%(+0.287)#1,528 |
| 21. | Miami Beach | 0.33% | 0.051%(+0.277)#158 | 0.042%(+0.285)#1,529 |
| 22. | Shalimar | 0.33% | 0.051%(+0.276)#159 | 0.042%(+0.284)#1,530 |
| 23. | Parkland | 0.32% | 0.051%(+0.265)#160 | 0.042%(+0.273)#1,531 |
| 24. | Sewall S Point | 0.31% | 0.051%(+0.261)#161 | 0.042%(+0.270)#1,532 |
| 25. | Fort Lauderdale | 0.29% | 0.051%(+0.237)#162 | 0.042%(+0.245)#1,533 |
| 26. | Lochmoor Waterway Estates | 0.28% | 0.051%(+0.231)#163 | 0.042%(+0.239)#1,534 |
| 27. | Ives Estates | 0.26% | 0.051%(+0.210)#164 | 0.042%(+0.219)#1,535 |
| 28. | Hypoluxo | 0.26% | 0.051%(+0.206)#165 | 0.042%(+0.215)#1,536 |
| 29. | Cocoa Beach | 0.26% | 0.051%(+0.205)#166 | 0.042%(+0.213)#1,537 |
| 30. | North Palm Beach | 0.25% | 0.051%(+0.201)#167 | 0.042%(+0.210)#1,538 |
| 31. | Lakeside | 0.24% | 0.051%(+0.188)#168 | 0.042%(+0.197)#1,539 |
| 32. | Silver Springs | 0.23% | 0.051%(+0.181)#169 | 0.042%(+0.189)#1,540 |
| 33. | Pompano Beach | 0.23% | 0.051%(+0.177)#170 | 0.042%(+0.185)#1,541 |
| 34. | Atlantis | 0.23% | 0.051%(+0.176)#171 | 0.042%(+0.184)#1,542 |
| 35. | Biscayne Park | 0.23% | 0.051%(+0.175)#172 | 0.042%(+0.184)#1,543 |
| 36. | Meadow Woods | 0.23% | 0.051%(+0.174)#173 | 0.042%(+0.183)#1,544 |
| 37. | Celebration | 0.22% | 0.051%(+0.174)#174 | 0.042%(+0.182)#1,545 |
| 38. | Sunny Isles Beach | 0.22% | 0.051%(+0.165)#175 | 0.042%(+0.174)#1,546 |
| 39. | Bayshore Gardens | 0.21% | 0.051%(+0.157)#176 | 0.042%(+0.166)#1,547 |
| 40. | Pinecrest | 0.21% | 0.051%(+0.157)#177 | 0.042%(+0.166)#1,548 |
| 41. | Glenvar Heights | 0.21% | 0.051%(+0.156)#178 | 0.042%(+0.164)#1,549 |
| 42. | Villas | 0.20% | 0.051%(+0.145)#179 | 0.042%(+0.153)#1,550 |
| 43. | Three Oaks | 0.19% | 0.051%(+0.144)#180 | 0.042%(+0.153)#1,551 |
| 44. | Pasadena Hills | 0.18% | 0.051%(+0.131)#181 | 0.042%(+0.139)#1,552 |
| 45. | Westchase | 0.18% | 0.051%(+0.130)#182 | 0.042%(+0.138)#1,553 |
| 46. | Egypt Lake Leto | 0.18% | 0.051%(+0.127)#183 | 0.042%(+0.135)#1,554 |
| 47. | Wesley Chapel | 0.18% | 0.051%(+0.125)#184 | 0.042%(+0.133)#1,555 |
| 48. | Delray Beach | 0.17% | 0.051%(+0.120)#185 | 0.042%(+0.129)#1,556 |
| 49. | Tiger Point | 0.17% | 0.051%(+0.120)#186 | 0.042%(+0.129)#1,557 |
| 50. | Hunters Creek | 0.17% | 0.051%(+0.115)#187 | 0.042%(+0.123)#1,558 |
| 51. | Sanford | 0.16% | 0.051%(+0.109)#188 | 0.042%(+0.118)#1,559 |
| 52. | Hallandale Beach | 0.15% | 0.051%(+0.103)#189 | 0.042%(+0.111)#1,560 |
| 53. | Sunset | 0.15% | 0.051%(+0.101)#190 | 0.042%(+0.109)#1,561 |
| 54. | Rotonda | 0.15% | 0.051%(+0.096)#191 | 0.042%(+0.104)#1,562 |
| 55. | Coral Terrace | 0.14% | 0.051%(+0.092)#192 | 0.042%(+0.100)#1,563 |
| 56. | Fort Walton Beach | 0.14% | 0.051%(+0.088)#193 | 0.042%(+0.096)#1,564 |
| 57. | Sarasota | 0.14% | 0.051%(+0.086)#194 | 0.042%(+0.095)#1,565 |
| 58. | Palm Valley | 0.14% | 0.051%(+0.086)#195 | 0.042%(+0.094)#1,566 |
| 59. | Coral Gables | 0.13% | 0.051%(+0.082)#196 | 0.042%(+0.090)#1,567 |
| 60. | Orange Park | 0.13% | 0.051%(+0.082)#197 | 0.042%(+0.090)#1,568 |
| 61. | Palm Beach | 0.13% | 0.051%(+0.080)#198 | 0.042%(+0.088)#1,569 |
| 62. | Holiday | 0.13% | 0.051%(+0.075)#199 | 0.042%(+0.083)#1,570 |
| 63. | Miami | 0.13% | 0.051%(+0.075)#200 | 0.042%(+0.083)#1,571 |
| 64. | Bradfordville | 0.12% | 0.051%(+0.071)#201 | 0.042%(+0.080)#1,572 |
| 65. | Clearwater | 0.12% | 0.051%(+0.071)#202 | 0.042%(+0.079)#1,573 |
| 66. | Estero | 0.12% | 0.051%(+0.069)#203 | 0.042%(+0.078)#1,574 |
| 67. | Palmetto | 0.12% | 0.051%(+0.069)#204 | 0.042%(+0.077)#1,575 |
| 68. | Three Lakes | 0.11% | 0.051%(+0.064)#205 | 0.042%(+0.072)#1,576 |
| 69. | Lutz | 0.11% | 0.051%(+0.063)#206 | 0.042%(+0.071)#1,577 |
| 70. | University Cdp Hillsborough County | 0.11% | 0.051%(+0.059)#207 | 0.042%(+0.067)#1,578 |
| 71. | Longboat Key | 0.11% | 0.051%(+0.056)#208 | 0.042%(+0.065)#1,579 |
| 72. | North Weeki Wachee | 0.11% | 0.051%(+0.056)#209 | 0.042%(+0.064)#1,580 |
| 73. | Doctor Phillips | 0.11% | 0.051%(+0.055)#210 | 0.042%(+0.063)#1,581 |
| 74. | Winter Garden | 0.11% | 0.051%(+0.055)#211 | 0.042%(+0.063)#1,582 |
| 75. | Deerfield Beach | 0.10% | 0.051%(+0.052)#212 | 0.042%(+0.061)#1,583 |
| 76. | Rockledge | 0.10% | 0.051%(+0.050)#213 | 0.042%(+0.058)#1,584 |
| 77. | Silver Springs Shores | 0.098% | 0.051%(+0.048)#214 | 0.042%(+0.056)#1,585 |
| 78. | Hudson | 0.092% | 0.051%(+0.042)#215 | 0.042%(+0.050)#1,586 |
| 79. | Brandon | 0.092% | 0.051%(+0.042)#216 | 0.042%(+0.050)#1,587 |
| 80. | Niceville | 0.089% | 0.051%(+0.038)#217 | 0.042%(+0.046)#1,588 |
| 81. | Safety Harbor | 0.088% | 0.051%(+0.037)#218 | 0.042%(+0.045)#1,589 |
| 82. | Tamarac | 0.084% | 0.051%(+0.033)#219 | 0.042%(+0.041)#1,590 |
| 83. | Wekiwa Springs | 0.082% | 0.051%(+0.032)#220 | 0.042%(+0.040)#1,591 |
| 84. | Riverview | 0.080% | 0.051%(+0.029)#221 | 0.042%(+0.038)#1,592 |
| 85. | Goldenrod | 0.080% | 0.051%(+0.029)#222 | 0.042%(+0.038)#1,593 |
| 86. | Viera West | 0.075% | 0.051%(+0.024)#223 | 0.042%(+0.033)#1,594 |
| 87. | Pebble Creek | 0.073% | 0.051%(+0.022)#224 | 0.042%(+0.031)#1,595 |
| 88. | Doral | 0.071% | 0.051%(+0.020)#225 | 0.042%(+0.028)#1,596 |
| 89. | Cutler Bay | 0.069% | 0.051%(+0.019)#226 | 0.042%(+0.027)#1,597 |
| 90. | Key Biscayne | 0.069% | 0.051%(+0.018)#227 | 0.042%(+0.026)#1,598 |
| 91. | Tampa | 0.066% | 0.051%(+0.016)#228 | 0.042%(+0.024)#1,599 |
| 92. | Palmetto Estates | 0.066% | 0.051%(+0.015)#229 | 0.042%(+0.023)#1,600 |
| 93. | Lakeland | 0.066% | 0.051%(+0.015)#230 | 0.042%(+0.023)#1,601 |
| 94. | Oviedo | 0.063% | 0.051%(+0.013)#231 | 0.042%(+0.021)#1,602 |
| 95. | Horizon West | 0.063% | 0.051%(+0.012)#232 | 0.042%(+0.021)#1,603 |
| 96. | South Patrick Shores | 0.058% | 0.051%(+0.007)#233 | 0.042%(+0.016)#1,604 |
| 97. | Marco Island | 0.056% | 0.051%(+0.006)#234 | 0.042%(+0.014)#1,605 |
| 98. | Fountainebleau | 0.056% | 0.051%(+0.005)#235 | 0.042%(+0.014)#1,606 |
| 99. | East Lake Orient Park | 0.055% | 0.051%(+0.004)#236 | 0.042%(+0.012)#1,607 |
| 100. | Hollywood | 0.054% | 0.051%(+0.004)#237 | 0.042%(+0.012)#1,608 |
Common Questions
What are the Top 10 Cities with the Highest Percentage of Immigrants from Turkey in Florida?
Top 10 Cities with the Highest Percentage of Immigrants from Turkey in Florida are:
#1
5.28%
#2
1.92%
#3
1.06%
#4
1.00%
#5
0.77%
#6
0.68%
#7
0.67%
#8
0.64%
#9
0.57%
#10
0.54%
What city has the Highest Percentage of Immigrants from Turkey in Florida?
South Palm Beach has the Highest Percentage of Immigrants from Turkey in Florida with 5.28%.
What is the Percentage of Immigrants from Turkey in the State of Florida?
Percentage of Immigrants from Turkey in Florida is 0.051%.
What is the Percentage of Immigrants from Turkey in the United States?
Percentage of Immigrants from Turkey in the United States is 0.042%.