Cities with the Lowest Poverty Level Among Married Couples in South Carolina
RELATED REPORTS & OPTIONS
Lowest Poverty | Married Couple
South Carolina
Compare Cities
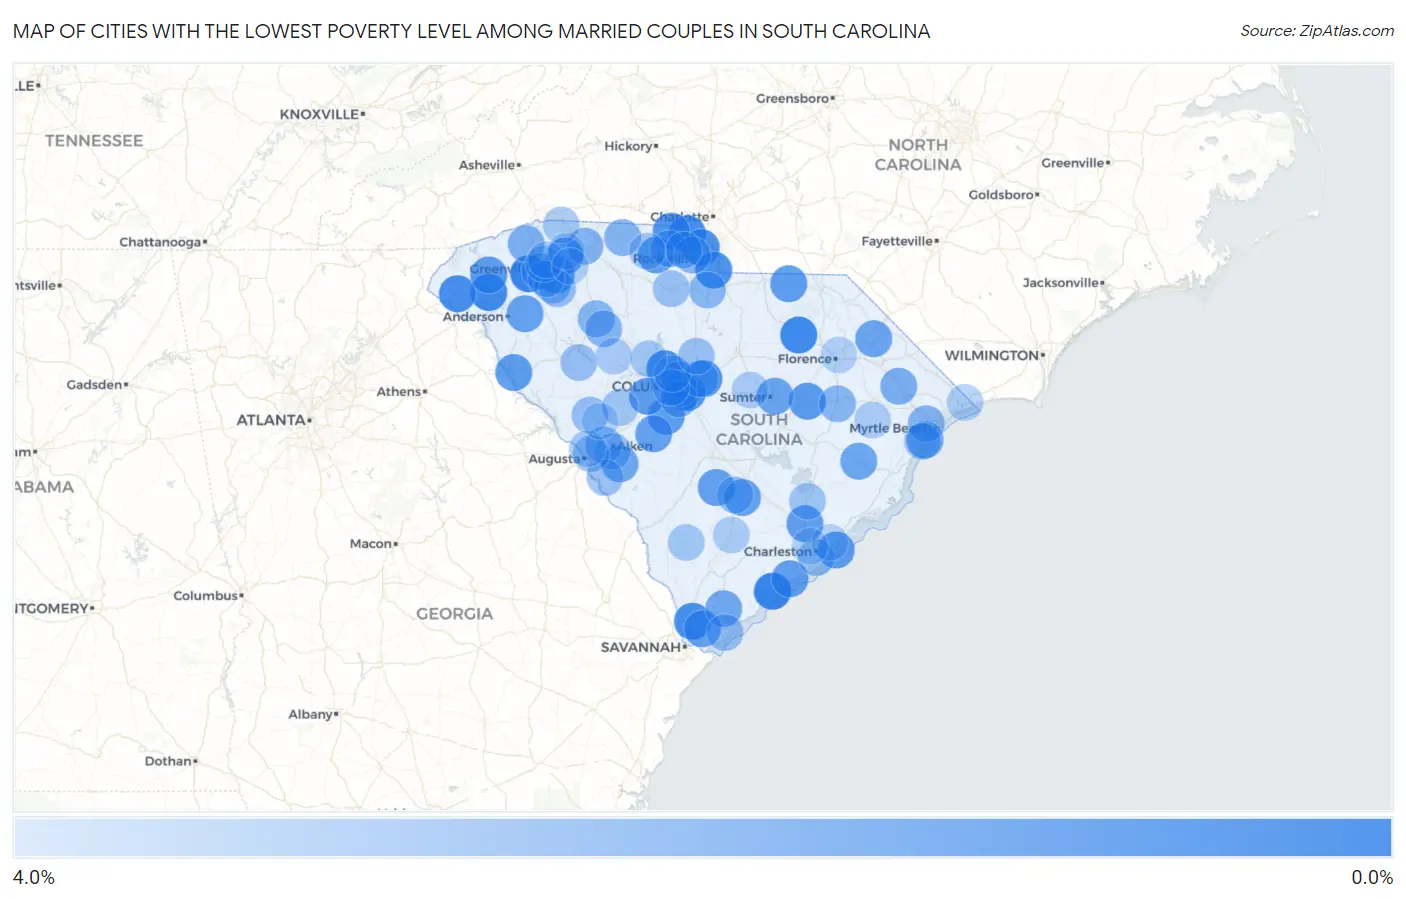
Map of Cities with the Lowest Poverty Level Among Married Couples in South Carolina
4.0%
0.0%
Cities with the Lowest Poverty Level Among Married Couples in South Carolina
| City | Married Couples Poverty | vs State | vs National | |
| 1. | Edisto Beach | 0.33% | 4.6%(-4.28)#1 | 4.5%(-4.13)#88 |
| 2. | Welcome | 0.35% | 4.6%(-4.26)#2 | 4.5%(-4.11)#101 |
| 3. | Clemson | 0.54% | 4.6%(-4.07)#3 | 4.5%(-3.92)#291 |
| 4. | Hartsville | 0.56% | 4.6%(-4.04)#4 | 4.5%(-3.90)#324 |
| 5. | Lake Wylie | 0.65% | 4.6%(-3.96)#5 | 4.5%(-3.81)#440 |
| 6. | Lake Murray Of Richland | 0.69% | 4.6%(-3.91)#6 | 4.5%(-3.77)#515 |
| 7. | Westminster | 0.70% | 4.6%(-3.91)#7 | 4.5%(-3.77)#519 |
| 8. | Woodfield | 0.76% | 4.6%(-3.85)#8 | 4.5%(-3.70)#639 |
| 9. | Hardeeville | 0.76% | 4.6%(-3.85)#9 | 4.5%(-3.70)#647 |
| 10. | Fort Mill | 0.77% | 4.6%(-3.83)#10 | 4.5%(-3.69)#680 |
| 11. | Fripp Island | 0.78% | 4.6%(-3.83)#11 | 4.5%(-3.68)#701 |
| 12. | Van Wyck | 0.79% | 4.6%(-3.82)#12 | 4.5%(-3.67)#720 |
| 13. | Springdale | 0.81% | 4.6%(-3.80)#13 | 4.5%(-3.65)#770 |
| 14. | Clover | 0.89% | 4.6%(-3.72)#14 | 4.5%(-3.57)#929 |
| 15. | Cayce | 0.95% | 4.6%(-3.66)#15 | 4.5%(-3.51)#1,076 |
| 16. | Five Forks | 1.1% | 4.6%(-3.55)#16 | 4.5%(-3.41)#1,332 |
| 17. | Duncan | 1.1% | 4.6%(-3.52)#17 | 4.5%(-3.37)#1,414 |
| 18. | Turbeville | 1.2% | 4.6%(-3.44)#18 | 4.5%(-3.30)#1,593 |
| 19. | Baxter | 1.2% | 4.6%(-3.42)#19 | 4.5%(-3.27)#1,650 |
| 20. | Pelion | 1.2% | 4.6%(-3.42)#20 | 4.5%(-3.27)#1,655 |
| 21. | Ruby | 1.2% | 4.6%(-3.39)#21 | 4.5%(-3.24)#1,732 |
| 22. | Isle Of Palms | 1.2% | 4.6%(-3.37)#22 | 4.5%(-3.23)#1,756 |
| 23. | Calhoun Falls | 1.2% | 4.6%(-3.37)#23 | 4.5%(-3.23)#1,762 |
| 24. | Summit | 1.3% | 4.6%(-3.35)#24 | 4.5%(-3.20)#1,811 |
| 25. | Six Mile | 1.3% | 4.6%(-3.35)#25 | 4.5%(-3.20)#1,821 |
| 26. | Sharon | 1.3% | 4.6%(-3.34)#26 | 4.5%(-3.20)#1,843 |
| 27. | Bluffton | 1.3% | 4.6%(-3.31)#27 | 4.5%(-3.17)#1,911 |
| 28. | Seabrook Island | 1.3% | 4.6%(-3.29)#28 | 4.5%(-3.14)#1,979 |
| 29. | Goose Creek | 1.3% | 4.6%(-3.28)#29 | 4.5%(-3.13)#2,002 |
| 30. | Branchville | 1.4% | 4.6%(-3.26)#30 | 4.5%(-3.11)#2,073 |
| 31. | Belton | 1.4% | 4.6%(-3.21)#31 | 4.5%(-3.06)#2,207 |
| 32. | St George | 1.4% | 4.6%(-3.18)#32 | 4.5%(-3.04)#2,267 |
| 33. | Surfside Beach | 1.5% | 4.6%(-3.16)#33 | 4.5%(-3.01)#2,355 |
| 34. | Wagener | 1.5% | 4.6%(-3.11)#34 | 4.5%(-2.97)#2,452 |
| 35. | East Sumter | 1.5% | 4.6%(-3.09)#35 | 4.5%(-2.95)#2,519 |
| 36. | Latta | 1.6% | 4.6%(-3.02)#36 | 4.5%(-2.87)#2,702 |
| 37. | Andrews | 1.6% | 4.6%(-3.01)#37 | 4.5%(-2.87)#2,748 |
| 38. | New Ellenton | 1.6% | 4.6%(-3.01)#38 | 4.5%(-2.86)#2,752 |
| 39. | Seven Oaks | 1.7% | 4.6%(-2.95)#39 | 4.5%(-2.81)#2,899 |
| 40. | Port Royal | 1.7% | 4.6%(-2.90)#40 | 4.5%(-2.76)#3,024 |
| 41. | Aynor | 1.9% | 4.6%(-2.68)#41 | 4.5%(-2.54)#3,566 |
| 42. | Daufuskie Island | 1.9% | 4.6%(-2.66)#42 | 4.5%(-2.52)#3,604 |
| 43. | Slater Marietta | 2.0% | 4.6%(-2.61)#43 | 4.5%(-2.47)#3,747 |
| 44. | Oak Grove | 2.0% | 4.6%(-2.59)#44 | 4.5%(-2.45)#3,803 |
| 45. | Forestbrook | 2.1% | 4.6%(-2.46)#45 | 4.5%(-2.31)#4,152 |
| 46. | South Congaree | 2.2% | 4.6%(-2.45)#46 | 4.5%(-2.31)#4,186 |
| 47. | Valley Falls | 2.2% | 4.6%(-2.45)#47 | 4.5%(-2.31)#4,187 |
| 48. | York | 2.2% | 4.6%(-2.43)#48 | 4.5%(-2.29)#4,210 |
| 49. | Clinton | 2.2% | 4.6%(-2.37)#49 | 4.5%(-2.23)#4,384 |
| 50. | Greenville | 2.2% | 4.6%(-2.37)#50 | 4.5%(-2.22)#4,398 |
| 51. | The Cliffs Valley | 2.2% | 4.6%(-2.36)#51 | 4.5%(-2.21)#4,409 |
| 52. | Gaffney | 2.3% | 4.6%(-2.35)#52 | 4.5%(-2.21)#4,425 |
| 53. | Rock Hill | 2.3% | 4.6%(-2.34)#53 | 4.5%(-2.20)#4,444 |
| 54. | Joanna | 2.3% | 4.6%(-2.34)#54 | 4.5%(-2.20)#4,455 |
| 55. | Lake City | 2.3% | 4.6%(-2.33)#55 | 4.5%(-2.18)#4,497 |
| 56. | Fort Lawn | 2.3% | 4.6%(-2.28)#56 | 4.5%(-2.14)#4,602 |
| 57. | Graniteville | 2.3% | 4.6%(-2.26)#57 | 4.5%(-2.12)#4,666 |
| 58. | Simpsonville | 2.4% | 4.6%(-2.19)#58 | 4.5%(-2.04)#4,857 |
| 59. | Arcadia Lakes | 2.4% | 4.6%(-2.19)#59 | 4.5%(-2.04)#4,863 |
| 60. | Newport | 2.5% | 4.6%(-2.14)#60 | 4.5%(-1.99)#4,994 |
| 61. | Lexington | 2.5% | 4.6%(-2.09)#61 | 4.5%(-1.95)#5,111 |
| 62. | Aiken | 2.5% | 4.6%(-2.07)#62 | 4.5%(-1.93)#5,160 |
| 63. | Fountain Inn | 2.5% | 4.6%(-2.07)#63 | 4.5%(-1.92)#5,161 |
| 64. | James Island | 2.5% | 4.6%(-2.06)#64 | 4.5%(-1.91)#5,189 |
| 65. | Edgefield | 2.6% | 4.6%(-2.02)#65 | 4.5%(-1.88)#5,299 |
| 66. | Mauldin | 2.6% | 4.6%(-2.02)#66 | 4.5%(-1.87)#5,310 |
| 67. | Irmo | 2.6% | 4.6%(-1.99)#67 | 4.5%(-1.84)#5,379 |
| 68. | Reevesville | 2.6% | 4.6%(-1.97)#68 | 4.5%(-1.83)#5,412 |
| 69. | Hilton Head Island | 2.6% | 4.6%(-1.96)#69 | 4.5%(-1.81)#5,451 |
| 70. | Ninety Six | 2.7% | 4.6%(-1.94)#70 | 4.5%(-1.80)#5,474 |
| 71. | Jackson | 2.7% | 4.6%(-1.91)#71 | 4.5%(-1.76)#5,549 |
| 72. | Blythewood | 2.7% | 4.6%(-1.89)#72 | 4.5%(-1.75)#5,611 |
| 73. | Clearwater | 2.7% | 4.6%(-1.89)#73 | 4.5%(-1.74)#5,615 |
| 74. | Chester | 2.7% | 4.6%(-1.88)#74 | 4.5%(-1.73)#5,630 |
| 75. | Garden City | 2.8% | 4.6%(-1.81)#75 | 4.5%(-1.67)#5,797 |
| 76. | Moncks Corner | 2.8% | 4.6%(-1.79)#76 | 4.5%(-1.65)#5,834 |
| 77. | Keowee Key | 2.8% | 4.6%(-1.79)#77 | 4.5%(-1.64)#5,849 |
| 78. | Homewood | 2.8% | 4.6%(-1.76)#78 | 4.5%(-1.62)#5,900 |
| 79. | Ridge Spring | 2.9% | 4.6%(-1.75)#79 | 4.5%(-1.60)#5,919 |
| 80. | Landrum | 2.9% | 4.6%(-1.68)#80 | 4.5%(-1.53)#6,086 |
| 81. | Varnville | 2.9% | 4.6%(-1.67)#81 | 4.5%(-1.53)#6,096 |
| 82. | Whitney | 2.9% | 4.6%(-1.67)#82 | 4.5%(-1.53)#6,103 |
| 83. | Hickory Grove | 2.9% | 4.6%(-1.67)#83 | 4.5%(-1.52)#6,120 |
| 84. | Little Mountain | 3.0% | 4.6%(-1.64)#84 | 4.5%(-1.49)#6,204 |
| 85. | Wade Hampton | 3.0% | 4.6%(-1.64)#85 | 4.5%(-1.49)#6,207 |
| 86. | Cateechee | 3.0% | 4.6%(-1.60)#86 | 4.5%(-1.46)#6,277 |
| 87. | Belvedere | 3.0% | 4.6%(-1.58)#87 | 4.5%(-1.44)#6,315 |
| 88. | Stateburg | 3.1% | 4.6%(-1.49)#88 | 4.5%(-1.34)#6,530 |
| 89. | Silverstreet | 3.1% | 4.6%(-1.48)#89 | 4.5%(-1.34)#6,574 |
| 90. | Taylors | 3.1% | 4.6%(-1.47)#90 | 4.5%(-1.33)#6,583 |
| 91. | Little River | 3.2% | 4.6%(-1.46)#91 | 4.5%(-1.31)#6,622 |
| 92. | Walterboro | 3.2% | 4.6%(-1.45)#92 | 4.5%(-1.30)#6,635 |
| 93. | Hemingway | 3.2% | 4.6%(-1.43)#93 | 4.5%(-1.29)#6,666 |
| 94. | Lyman | 3.3% | 4.6%(-1.35)#94 | 4.5%(-1.20)#6,851 |
| 95. | Reidville | 3.3% | 4.6%(-1.33)#95 | 4.5%(-1.18)#6,901 |
| 96. | Quinby | 3.3% | 4.6%(-1.32)#96 | 4.5%(-1.17)#6,925 |
| 97. | Mount Pleasant | 3.3% | 4.6%(-1.30)#97 | 4.5%(-1.16)#6,960 |
| 98. | Charleston | 3.3% | 4.6%(-1.28)#98 | 4.5%(-1.13)#7,000 |
| 99. | Trenton | 3.4% | 4.6%(-1.22)#99 | 4.5%(-1.07)#7,157 |
| 100. | Wyboo | 3.4% | 4.6%(-1.18)#100 | 4.5%(-1.03)#7,223 |
Common Questions
What are the Top 10 Cities with the Lowest Poverty Level Among Married Couples in South Carolina?
Top 10 Cities with the Lowest Poverty Level Among Married Couples in South Carolina are:
#1
0.33%
#2
0.35%
#3
0.54%
#4
0.56%
#5
0.65%
#6
0.69%
#7
0.70%
#8
0.76%
#9
0.76%
#10
0.77%
What city has the Lowest Poverty Level Among Married Couples in South Carolina?
Edisto Beach has the Lowest Poverty Level Among Married Couples in South Carolina with 0.33%.
What is the Poverty Level Among Married Couples in the State of South Carolina?
Poverty Level Among Married Couples in South Carolina is 4.6%.
What is the Poverty Level Among Married Couples in the United States?
Poverty Level Among Married Couples in the United States is 4.5%.