Cities with the Highest Percentage of Population Employed in Computer & Mathematics in South Carolina
RELATED REPORTS & OPTIONS
Computer & Mathematics
South Carolina
Compare Cities
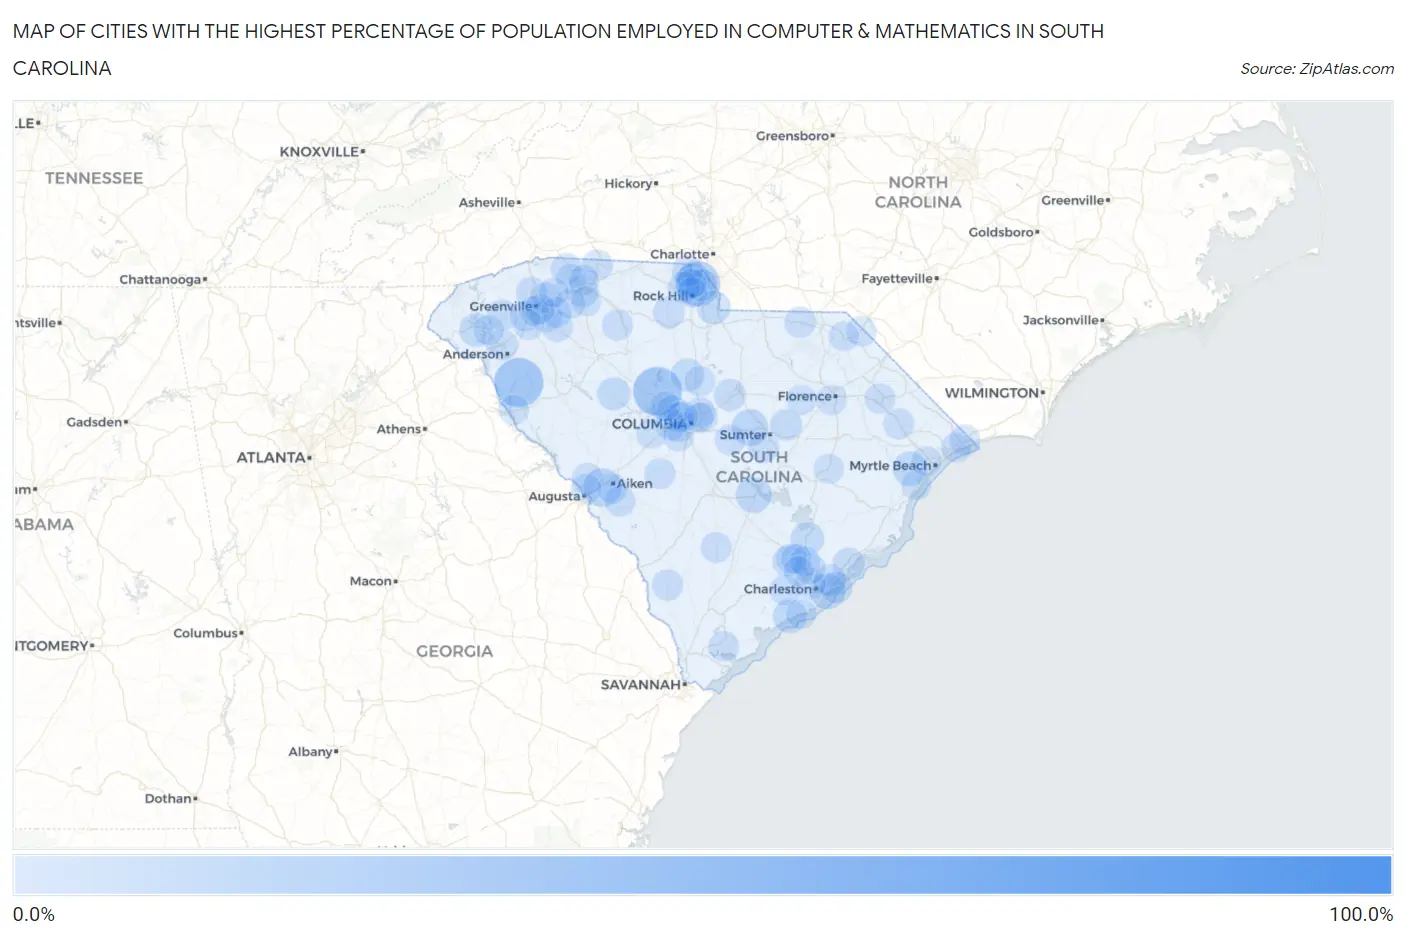
Map of Cities with the Highest Percentage of Population Employed in Computer & Mathematics in South Carolina
0.0%
100.0%
Cities with the Highest Percentage of Population Employed in Computer & Mathematics in South Carolina
| City | % Employed | vs State | vs National | |
| 1. | Browntown | 100.0% | 2.4%(+97.6)#1 | 3.5%(+96.5)#2 |
| 2. | Antreville | 30.3% | 2.4%(+27.8)#2 | 3.5%(+26.7)#67 |
| 3. | Peak | 29.4% | 2.4%(+27.0)#3 | 3.5%(+25.9)#73 |
| 4. | Riverview | 24.5% | 2.4%(+22.1)#4 | 3.5%(+21.0)#107 |
| 5. | La France | 22.8% | 2.4%(+20.4)#5 | 3.5%(+19.3)#125 |
| 6. | Gloverville | 14.5% | 2.4%(+12.1)#6 | 3.5%(+11.0)#339 |
| 7. | Adams Run | 13.8% | 2.4%(+11.4)#7 | 3.5%(+10.3)#375 |
| 8. | Stateburg | 11.7% | 2.4%(+9.28)#8 | 3.5%(+8.17)#527 |
| 9. | Sandy Springs | 11.6% | 2.4%(+9.20)#9 | 3.5%(+8.09)#529 |
| 10. | Santee | 11.1% | 2.4%(+8.67)#10 | 3.5%(+7.57)#583 |
| 11. | Sullivan S Island | 10.7% | 2.4%(+8.30)#11 | 3.5%(+7.20)#625 |
| 12. | Sheldon | 9.6% | 2.4%(+7.15)#12 | 3.5%(+6.04)#820 |
| 13. | Bucksport | 9.1% | 2.4%(+6.67)#13 | 3.5%(+5.57)#920 |
| 14. | Tega Cay | 8.4% | 2.4%(+5.94)#14 | 3.5%(+4.84)#1,099 |
| 15. | Seabrook Island | 8.3% | 2.4%(+5.89)#15 | 3.5%(+4.78)#1,117 |
| 16. | Utica | 8.0% | 2.4%(+5.58)#16 | 3.5%(+4.47)#1,223 |
| 17. | Van Wyck | 7.6% | 2.4%(+5.19)#17 | 3.5%(+4.09)#1,364 |
| 18. | Moncks Corner | 7.2% | 2.4%(+4.82)#18 | 3.5%(+3.71)#1,498 |
| 19. | Winnsboro Mills | 7.1% | 2.4%(+4.69)#19 | 3.5%(+3.59)#1,551 |
| 20. | Silverstreet | 6.8% | 2.4%(+4.36)#20 | 3.5%(+3.26)#1,721 |
| 21. | Arcadia | 5.9% | 2.4%(+3.50)#21 | 3.5%(+2.40)#2,231 |
| 22. | Fort Mill | 5.7% | 2.4%(+3.33)#22 | 3.5%(+2.22)#2,355 |
| 23. | Irmo | 5.7% | 2.4%(+3.31)#23 | 3.5%(+2.21)#2,371 |
| 24. | Awendaw | 5.7% | 2.4%(+3.24)#24 | 3.5%(+2.13)#2,438 |
| 25. | Mount Pleasant | 5.6% | 2.4%(+3.16)#25 | 3.5%(+2.05)#2,508 |
| 26. | Isle Of Palms | 5.3% | 2.4%(+2.89)#26 | 3.5%(+1.79)#2,765 |
| 27. | Lugoff | 5.3% | 2.4%(+2.88)#27 | 3.5%(+1.77)#2,776 |
| 28. | Mayesville | 4.9% | 2.4%(+2.51)#28 | 3.5%(+1.41)#3,165 |
| 29. | Mauldin | 4.9% | 2.4%(+2.44)#29 | 3.5%(+1.33)#3,254 |
| 30. | Newport | 4.8% | 2.4%(+2.39)#30 | 3.5%(+1.29)#3,308 |
| 31. | Lowrys | 4.6% | 2.4%(+2.21)#31 | 3.5%(+1.11)#3,536 |
| 32. | Lake Wylie | 4.6% | 2.4%(+2.19)#32 | 3.5%(+1.09)#3,552 |
| 33. | Travelers Rest | 4.4% | 2.4%(+2.02)#33 | 3.5%(+0.912)#3,756 |
| 34. | Murphys Estates | 4.4% | 2.4%(+2.00)#34 | 3.5%(+0.896)#3,784 |
| 35. | Fountain Inn | 4.4% | 2.4%(+1.99)#35 | 3.5%(+0.889)#3,791 |
| 36. | Hamer | 4.4% | 2.4%(+1.99)#36 | 3.5%(+0.887)#3,792 |
| 37. | Charleston | 4.4% | 2.4%(+1.98)#37 | 3.5%(+0.877)#3,819 |
| 38. | Oak Grove | 4.3% | 2.4%(+1.91)#38 | 3.5%(+0.805)#3,928 |
| 39. | Chesterfield | 4.2% | 2.4%(+1.78)#39 | 3.5%(+0.674)#4,128 |
| 40. | Liberty | 4.2% | 2.4%(+1.77)#40 | 3.5%(+0.660)#4,153 |
| 41. | Campobello | 4.1% | 2.4%(+1.72)#41 | 3.5%(+0.613)#4,252 |
| 42. | Aynor | 4.0% | 2.4%(+1.61)#42 | 3.5%(+0.508)#4,405 |
| 43. | Ravenel | 3.9% | 2.4%(+1.50)#43 | 3.5%(+0.392)#4,611 |
| 44. | Luray | 3.8% | 2.4%(+1.43)#44 | 3.5%(+0.322)#4,733 |
| 45. | Taylors | 3.8% | 2.4%(+1.39)#45 | 3.5%(+0.285)#4,807 |
| 46. | Lexington | 3.8% | 2.4%(+1.38)#46 | 3.5%(+0.274)#4,825 |
| 47. | Little River | 3.8% | 2.4%(+1.35)#47 | 3.5%(+0.240)#4,884 |
| 48. | Hanahan | 3.7% | 2.4%(+1.30)#48 | 3.5%(+0.199)#4,959 |
| 49. | Smoaks | 3.7% | 2.4%(+1.28)#49 | 3.5%(+0.179)#5,002 |
| 50. | Chesnee | 3.6% | 2.4%(+1.23)#50 | 3.5%(+0.123)#5,113 |
| 51. | Northlake | 3.6% | 2.4%(+1.20)#51 | 3.5%(+0.098)#5,164 |
| 52. | Dentsville | 3.6% | 2.4%(+1.18)#52 | 3.5%(+0.073)#5,208 |
| 53. | Privateer | 3.6% | 2.4%(+1.17)#53 | 3.5%(+0.065)#5,225 |
| 54. | Buffalo | 3.6% | 2.4%(+1.16)#54 | 3.5%(+0.056)#5,241 |
| 55. | Seven Oaks | 3.6% | 2.4%(+1.15)#55 | 3.5%(+0.048)#5,253 |
| 56. | New Ellenton | 3.6% | 2.4%(+1.14)#56 | 3.5%(+0.036)#5,288 |
| 57. | Perry | 3.5% | 2.4%(+1.12)#57 | 3.5%(+0.015)#5,340 |
| 58. | Five Forks | 3.5% | 2.4%(+1.11)#58 | 3.5%(+0.004)#5,362 |
| 59. | The Cliffs Valley | 3.5% | 2.4%(+1.10)#59 | 3.5%(-0.009)#5,389 |
| 60. | Summerville | 3.4% | 2.4%(+0.977)#60 | 3.5%(-0.128)#5,645 |
| 61. | Eastover | 3.3% | 2.4%(+0.930)#61 | 3.5%(-0.175)#5,751 |
| 62. | Marion | 3.3% | 2.4%(+0.883)#62 | 3.5%(-0.222)#5,862 |
| 63. | Port Royal | 3.3% | 2.4%(+0.839)#63 | 3.5%(-0.266)#5,965 |
| 64. | Inman | 3.2% | 2.4%(+0.820)#64 | 3.5%(-0.285)#6,007 |
| 65. | Clemson | 3.2% | 2.4%(+0.749)#65 | 3.5%(-0.356)#6,186 |
| 66. | St Andrews | 3.2% | 2.4%(+0.735)#66 | 3.5%(-0.370)#6,222 |
| 67. | Lincolnville | 3.2% | 2.4%(+0.734)#67 | 3.5%(-0.371)#6,227 |
| 68. | Ladson | 3.2% | 2.4%(+0.733)#68 | 3.5%(-0.372)#6,230 |
| 69. | Florence | 3.1% | 2.4%(+0.716)#69 | 3.5%(-0.389)#6,266 |
| 70. | Mccoll | 3.1% | 2.4%(+0.688)#70 | 3.5%(-0.417)#6,335 |
| 71. | Ridgeway | 3.1% | 2.4%(+0.681)#71 | 3.5%(-0.424)#6,356 |
| 72. | Powdersville | 3.1% | 2.4%(+0.666)#72 | 3.5%(-0.439)#6,394 |
| 73. | Columbia | 3.0% | 2.4%(+0.589)#73 | 3.5%(-0.516)#6,575 |
| 74. | South Congaree | 3.0% | 2.4%(+0.589)#74 | 3.5%(-0.516)#6,576 |
| 75. | Kingstree | 3.0% | 2.4%(+0.587)#75 | 3.5%(-0.518)#6,586 |
| 76. | Goose Creek | 3.0% | 2.4%(+0.584)#76 | 3.5%(-0.521)#6,593 |
| 77. | Calhoun Falls | 3.0% | 2.4%(+0.548)#77 | 3.5%(-0.557)#6,680 |
| 78. | Boiling Springs | 2.9% | 2.4%(+0.507)#78 | 3.5%(-0.598)#6,780 |
| 79. | Aiken | 2.9% | 2.4%(+0.475)#79 | 3.5%(-0.630)#6,846 |
| 80. | Unity | 2.9% | 2.4%(+0.451)#80 | 3.5%(-0.654)#6,913 |
| 81. | North Charleston | 2.9% | 2.4%(+0.442)#81 | 3.5%(-0.663)#6,935 |
| 82. | North Augusta | 2.8% | 2.4%(+0.423)#82 | 3.5%(-0.682)#6,994 |
| 83. | Greenville | 2.8% | 2.4%(+0.402)#83 | 3.5%(-0.703)#7,037 |
| 84. | Rock Hill | 2.8% | 2.4%(+0.381)#84 | 3.5%(-0.724)#7,101 |
| 85. | North Myrtle Beach | 2.7% | 2.4%(+0.306)#85 | 3.5%(-0.799)#7,313 |
| 86. | Kiawah Island | 2.7% | 2.4%(+0.299)#86 | 3.5%(-0.806)#7,327 |
| 87. | Murrells Inlet | 2.7% | 2.4%(+0.299)#87 | 3.5%(-0.806)#7,329 |
| 88. | Reidville | 2.7% | 2.4%(+0.269)#88 | 3.5%(-0.836)#7,408 |
| 89. | Roebuck | 2.7% | 2.4%(+0.241)#89 | 3.5%(-0.864)#7,487 |
| 90. | Piedmont | 2.7% | 2.4%(+0.235)#90 | 3.5%(-0.870)#7,499 |
| 91. | Dunean | 2.6% | 2.4%(+0.219)#91 | 3.5%(-0.886)#7,546 |
| 92. | Forestbrook | 2.6% | 2.4%(+0.178)#92 | 3.5%(-0.927)#7,636 |
| 93. | Lake Murray Of Richland | 2.6% | 2.4%(+0.151)#93 | 3.5%(-0.954)#7,719 |
| 94. | Lamar | 2.6% | 2.4%(+0.140)#94 | 3.5%(-0.965)#7,760 |
| 95. | India Hook | 2.5% | 2.4%(+0.117)#95 | 3.5%(-0.988)#7,830 |
| 96. | Gilbert | 2.5% | 2.4%(+0.089)#96 | 3.5%(-1.02)#7,905 |
| 97. | Bennettsville | 2.5% | 2.4%(+0.089)#97 | 3.5%(-1.02)#7,906 |
| 98. | Greer | 2.5% | 2.4%(+0.042)#98 | 3.5%(-1.06)#8,061 |
| 99. | White Knoll | 2.4% | 2.4%(+0.024)#99 | 3.5%(-1.08)#8,123 |
| 100. | Forest Acres | 2.4% | 2.4%(+0.022)#100 | 3.5%(-1.08)#8,129 |
Common Questions
What are the Top 10 Cities with the Highest Percentage of Population Employed in Computer & Mathematics in South Carolina?
Top 10 Cities with the Highest Percentage of Population Employed in Computer & Mathematics in South Carolina are:
#1
30.3%
#2
29.4%
#3
24.5%
#4
14.5%
#5
11.7%
#6
11.1%
#7
10.7%
#8
9.1%
#9
8.4%
#10
8.3%
What city has the Highest Percentage of Population Employed in Computer & Mathematics in South Carolina?
Antreville has the Highest Percentage of Population Employed in Computer & Mathematics in South Carolina with 30.3%.
What is the Percentage of Population Employed in Computer & Mathematics in the State of South Carolina?
Percentage of Population Employed in Computer & Mathematics in South Carolina is 2.4%.
What is the Percentage of Population Employed in Computer & Mathematics in the United States?
Percentage of Population Employed in Computer & Mathematics in the United States is 3.5%.