Cities with the Highest Percentage of Italian Population in South Carolina
RELATED REPORTS & OPTIONS
Italian
South Carolina
Compare Cities
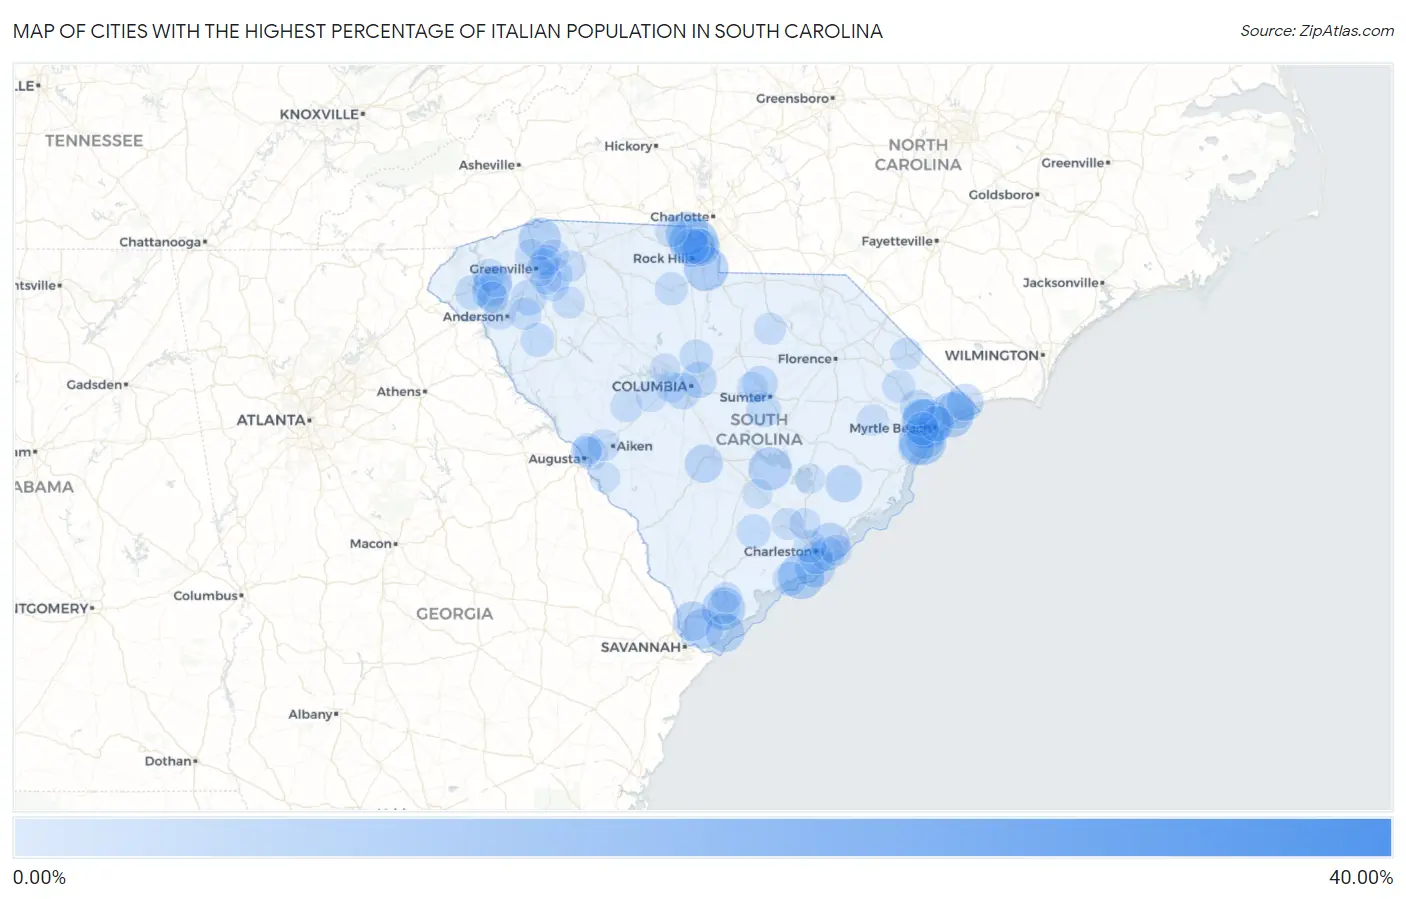
Map of Cities with the Highest Percentage of Italian Population in South Carolina
0.00%
40.00%
Cities with the Highest Percentage of Italian Population in South Carolina
| City | Italian | vs State | vs National | |
| 1. | St. Charles | 36.00% | 3.15%(+32.8)#1 | 4.93%(+31.1)#146 |
| 2. | Pimlico | 25.31% | 3.15%(+22.2)#2 | 4.93%(+20.4)#578 |
| 3. | Homewood | 17.05% | 3.15%(+13.9)#3 | 4.93%(+12.1)#1,636 |
| 4. | Forestbrook | 11.82% | 3.15%(+8.66)#4 | 4.93%(+6.89)#3,095 |
| 5. | Tega Cay | 11.70% | 3.15%(+8.55)#5 | 4.93%(+6.78)#3,135 |
| 6. | Carolina Forest | 11.25% | 3.15%(+8.09)#6 | 4.93%(+6.32)#3,299 |
| 7. | Garden City | 11.05% | 3.15%(+7.90)#7 | 4.93%(+6.12)#3,391 |
| 8. | Kiawah Island | 10.33% | 3.15%(+7.18)#8 | 4.93%(+5.40)#3,731 |
| 9. | Briarcliffe Acres | 10.04% | 3.15%(+6.88)#9 | 4.93%(+5.11)#3,874 |
| 10. | Catawba | 9.66% | 3.15%(+6.51)#10 | 4.93%(+4.73)#4,054 |
| 11. | Lake Wylie | 9.12% | 3.15%(+5.97)#11 | 4.93%(+4.19)#4,326 |
| 12. | Eutawville | 9.09% | 3.15%(+5.94)#12 | 4.93%(+4.16)#4,344 |
| 13. | Port Royal | 9.06% | 3.15%(+5.91)#13 | 4.93%(+4.14)#4,362 |
| 14. | Tigerville | 8.72% | 3.15%(+5.57)#14 | 4.93%(+3.79)#4,537 |
| 15. | Daufuskie Island | 8.08% | 3.15%(+4.93)#15 | 4.93%(+3.16)#4,956 |
| 16. | Folly Beach | 7.84% | 3.15%(+4.69)#16 | 4.93%(+2.92)#5,127 |
| 17. | Dacusville | 7.80% | 3.15%(+4.65)#17 | 4.93%(+2.87)#5,171 |
| 18. | Litchfield Beach | 7.76% | 3.15%(+4.60)#18 | 4.93%(+2.83)#5,199 |
| 19. | Bluffton | 7.67% | 3.15%(+4.52)#19 | 4.93%(+2.75)#5,257 |
| 20. | Hardeeville | 7.54% | 3.15%(+4.39)#20 | 4.93%(+2.61)#5,353 |
| 21. | Mount Pleasant | 7.51% | 3.15%(+4.36)#21 | 4.93%(+2.59)#5,373 |
| 22. | Hilton Head Island | 7.33% | 3.15%(+4.18)#22 | 4.93%(+2.40)#5,537 |
| 23. | Central | 7.28% | 3.15%(+4.13)#23 | 4.93%(+2.36)#5,572 |
| 24. | Cordova | 7.01% | 3.15%(+3.86)#24 | 4.93%(+2.08)#5,825 |
| 25. | Surfside Beach | 6.84% | 3.15%(+3.69)#25 | 4.93%(+1.92)#5,990 |
| 26. | North Myrtle Beach | 6.67% | 3.15%(+3.52)#26 | 4.93%(+1.74)#6,146 |
| 27. | Lobeco | 6.63% | 3.15%(+3.48)#27 | 4.93%(+1.70)#6,185 |
| 28. | Fort Mill | 6.54% | 3.15%(+3.39)#28 | 4.93%(+1.61)#6,271 |
| 29. | Red Hill | 6.51% | 3.15%(+3.36)#29 | 4.93%(+1.58)#6,310 |
| 30. | Little River | 6.50% | 3.15%(+3.35)#30 | 4.93%(+1.57)#6,323 |
| 31. | Jamestown | 6.41% | 3.15%(+3.26)#31 | 4.93%(+1.48)#6,399 |
| 32. | Springdale | 6.23% | 3.15%(+3.08)#32 | 4.93%(+1.31)#6,555 |
| 33. | Forest Acres | 6.16% | 3.15%(+3.01)#33 | 4.93%(+1.24)#6,634 |
| 34. | Riverview | 6.07% | 3.15%(+2.92)#34 | 4.93%(+1.14)#6,737 |
| 35. | Olympia | 6.04% | 3.15%(+2.88)#35 | 4.93%(+1.11)#6,785 |
| 36. | Pelzer | 6.01% | 3.15%(+2.86)#36 | 4.93%(+1.09)#6,808 |
| 37. | India Hook | 5.95% | 3.15%(+2.80)#37 | 4.93%(+1.02)#6,880 |
| 38. | Dalzell | 5.94% | 3.15%(+2.79)#38 | 4.93%(+1.01)#6,894 |
| 39. | Murrells Inlet | 5.90% | 3.15%(+2.75)#39 | 4.93%(+0.977)#6,943 |
| 40. | Myrtle Beach | 5.89% | 3.15%(+2.73)#40 | 4.93%(+0.959)#6,964 |
| 41. | Conway | 5.80% | 3.15%(+2.64)#41 | 4.93%(+0.868)#7,058 |
| 42. | Drayton | 5.64% | 3.15%(+2.48)#42 | 4.93%(+0.710)#7,267 |
| 43. | Fripp Island | 5.61% | 3.15%(+2.45)#43 | 4.93%(+0.678)#7,301 |
| 44. | Seneca | 5.58% | 3.15%(+2.43)#44 | 4.93%(+0.653)#7,324 |
| 45. | Privateer | 5.52% | 3.15%(+2.37)#45 | 4.93%(+0.595)#7,401 |
| 46. | Seabrook Island | 5.38% | 3.15%(+2.23)#46 | 4.93%(+0.455)#7,587 |
| 47. | Cottageville | 5.24% | 3.15%(+2.09)#47 | 4.93%(+0.317)#7,790 |
| 48. | Sullivan S Island | 5.22% | 3.15%(+2.07)#48 | 4.93%(+0.294)#7,821 |
| 49. | Clemson | 5.17% | 3.15%(+2.01)#49 | 4.93%(+0.238)#7,888 |
| 50. | Chickasaw Point | 5.14% | 3.15%(+1.99)#50 | 4.93%(+0.213)#7,921 |
| 51. | Due West | 5.14% | 3.15%(+1.99)#51 | 4.93%(+0.211)#7,926 |
| 52. | Blythewood | 5.13% | 3.15%(+1.98)#52 | 4.93%(+0.205)#7,931 |
| 53. | Shell Point | 4.89% | 3.15%(+1.73)#53 | 4.93%(-0.042)#8,306 |
| 54. | James Island | 4.87% | 3.15%(+1.71)#54 | 4.93%(-0.060)#8,338 |
| 55. | Chester | 4.85% | 3.15%(+1.69)#55 | 4.93%(-0.080)#8,373 |
| 56. | Clearwater | 4.82% | 3.15%(+1.67)#56 | 4.93%(-0.109)#8,406 |
| 57. | Socastee | 4.81% | 3.15%(+1.66)#57 | 4.93%(-0.117)#8,424 |
| 58. | Aynor | 4.75% | 3.15%(+1.60)#58 | 4.93%(-0.176)#8,519 |
| 59. | Charleston | 4.75% | 3.15%(+1.59)#59 | 4.93%(-0.180)#8,521 |
| 60. | Debordieu Colony | 4.74% | 3.15%(+1.59)#60 | 4.93%(-0.187)#8,531 |
| 61. | Five Forks | 4.70% | 3.15%(+1.55)#61 | 4.93%(-0.227)#8,593 |
| 62. | Six Mile | 4.60% | 3.15%(+1.45)#62 | 4.93%(-0.324)#8,734 |
| 63. | Belton | 4.54% | 3.15%(+1.39)#63 | 4.93%(-0.384)#8,830 |
| 64. | Travelers Rest | 4.49% | 3.15%(+1.34)#64 | 4.93%(-0.438)#8,915 |
| 65. | Simpsonville | 4.48% | 3.15%(+1.33)#65 | 4.93%(-0.445)#8,924 |
| 66. | Bethune | 4.41% | 3.15%(+1.25)#66 | 4.93%(-0.523)#9,059 |
| 67. | Nichols | 4.37% | 3.15%(+1.22)#67 | 4.93%(-0.553)#9,118 |
| 68. | Gray Court | 4.37% | 3.15%(+1.22)#68 | 4.93%(-0.558)#9,125 |
| 69. | Centerville | 4.35% | 3.15%(+1.20)#69 | 4.93%(-0.577)#9,160 |
| 70. | Monetta | 4.35% | 3.15%(+1.19)#70 | 4.93%(-0.580)#9,174 |
| 71. | Norris | 4.34% | 3.15%(+1.19)#71 | 4.93%(-0.586)#9,189 |
| 72. | Graniteville | 4.34% | 3.15%(+1.19)#72 | 4.93%(-0.587)#9,192 |
| 73. | Summerville | 4.32% | 3.15%(+1.17)#73 | 4.93%(-0.605)#9,222 |
| 74. | Keowee Key | 4.32% | 3.15%(+1.16)#74 | 4.93%(-0.613)#9,237 |
| 75. | Clover | 4.29% | 3.15%(+1.14)#75 | 4.93%(-0.634)#9,273 |
| 76. | Reidville | 4.21% | 3.15%(+1.06)#76 | 4.93%(-0.718)#9,440 |
| 77. | Pendleton | 4.20% | 3.15%(+1.05)#77 | 4.93%(-0.726)#9,456 |
| 78. | Oakland | 4.18% | 3.15%(+1.02)#78 | 4.93%(-0.753)#9,507 |
| 79. | Mauldin | 4.17% | 3.15%(+1.01)#79 | 4.93%(-0.761)#9,520 |
| 80. | Gilbert | 4.09% | 3.15%(+0.932)#80 | 4.93%(-0.843)#9,675 |
| 81. | Hemingway | 4.04% | 3.15%(+0.885)#81 | 4.93%(-0.890)#9,763 |
| 82. | Ben Avon | 4.03% | 3.15%(+0.873)#82 | 4.93%(-0.902)#9,783 |
| 83. | Isle Of Palms | 4.00% | 3.15%(+0.850)#83 | 4.93%(-0.925)#9,824 |
| 84. | Goose Creek | 3.97% | 3.15%(+0.820)#84 | 4.93%(-0.955)#9,888 |
| 85. | Clemson University | 3.97% | 3.15%(+0.820)#85 | 4.93%(-0.955)#9,889 |
| 86. | Greer | 3.95% | 3.15%(+0.800)#86 | 4.93%(-0.975)#9,931 |
| 87. | Beaufort | 3.94% | 3.15%(+0.786)#87 | 4.93%(-0.989)#9,951 |
| 88. | Lexington | 3.91% | 3.15%(+0.756)#88 | 4.93%(-1.02)#10,000 |
| 89. | Baxter | 3.89% | 3.15%(+0.739)#89 | 4.93%(-1.04)#10,042 |
| 90. | Taylors | 3.88% | 3.15%(+0.729)#90 | 4.93%(-1.05)#10,060 |
| 91. | Lake Murray Of Richland | 3.88% | 3.15%(+0.723)#91 | 4.93%(-1.05)#10,074 |
| 92. | Wade Hampton | 3.86% | 3.15%(+0.703)#92 | 4.93%(-1.07)#10,118 |
| 93. | Belvedere | 3.77% | 3.15%(+0.615)#93 | 4.93%(-1.16)#10,297 |
| 94. | North Augusta | 3.74% | 3.15%(+0.589)#94 | 4.93%(-1.19)#10,334 |
| 95. | Jackson | 3.61% | 3.15%(+0.460)#95 | 4.93%(-1.31)#10,567 |
| 96. | Bonneau Beach | 3.60% | 3.15%(+0.447)#96 | 4.93%(-1.33)#10,598 |
| 97. | The Cliffs Valley | 3.56% | 3.15%(+0.410)#97 | 4.93%(-1.37)#10,673 |
| 98. | Harleyville | 3.53% | 3.15%(+0.374)#98 | 4.93%(-1.40)#10,764 |
| 99. | Greenville | 3.49% | 3.15%(+0.334)#99 | 4.93%(-1.44)#10,844 |
| 100. | North Santee | 3.40% | 3.15%(+0.251)#100 | 4.93%(-1.52)#11,027 |
Common Questions
What are the Top 10 Cities with the Highest Percentage of Italian Population in South Carolina?
Top 10 Cities with the Highest Percentage of Italian Population in South Carolina are:
#1
11.82%
#2
11.70%
#3
11.05%
#4
10.33%
#5
10.04%
#6
9.66%
#7
9.12%
#8
9.09%
#9
9.06%
#10
8.72%
What city has the Highest Percentage of Italian Population in South Carolina?
Forestbrook has the Highest Percentage of Italian Population in South Carolina with 11.82%.
What is the Percentage of Italian Population in the State of South Carolina?
Percentage of Italian Population in South Carolina is 3.15%.
What is the Percentage of Italian Population in the United States?
Percentage of Italian Population in the United States is 4.93%.