Clemson, SC
Clemson Map
Clemson Overview
17,557
TOTAL POPULATION
10,381
MALE POPULATION
7,176
FEMALE POPULATION
144.66
MALES / 100 FEMALES
69.13
FEMALES / 100 MALES
24.6
MEDIAN AGE
2.9
AVG FAMILY SIZE
2.4
AVG HOUSEHOLD SIZE
$34,468
PER CAPITA INCOME
$121,995
AVG FAMILY INCOME
$50,263
AVG HOUSEHOLD INCOME
6.1%
WAGE / INCOME GAP [ % ]
93.9¢/ $1
WAGE / INCOME GAP [ $ ]
0.54
INEQUALITY / GINI INDEX
8,902
LABOR FORCE [ PEOPLE ]
55.2%
PERCENT IN LABOR FORCE
4.3%
UNEMPLOYMENT RATE
Clemson Area Codes
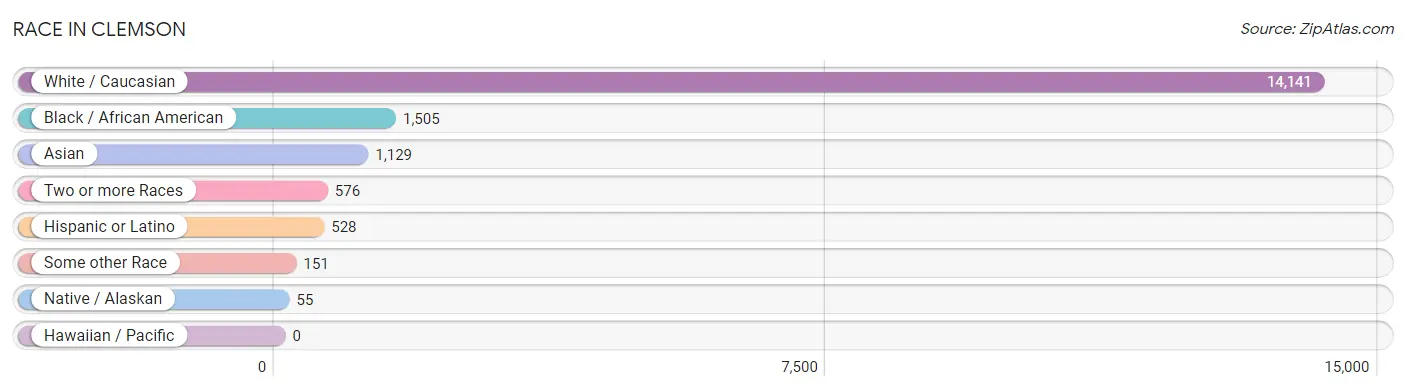
Race in Clemson
The most populous races in Clemson are White / Caucasian (14,141 | 80.5%), Black / African American (1,505 | 8.6%), and Asian (1,129 | 6.4%).
| Race | # Population | % Population |
| Asian | 1,129 | 6.4% |
| Black / African American | 1,505 | 8.6% |
| Hawaiian / Pacific | 0 | 0.0% |
| Hispanic or Latino | 528 | 3.0% |
| Native / Alaskan | 55 | 0.3% |
| White / Caucasian | 14,141 | 80.5% |
| Two or more Races | 576 | 3.3% |
| Some other Race | 151 | 0.9% |
| Total | 17,557 | 100.0% |
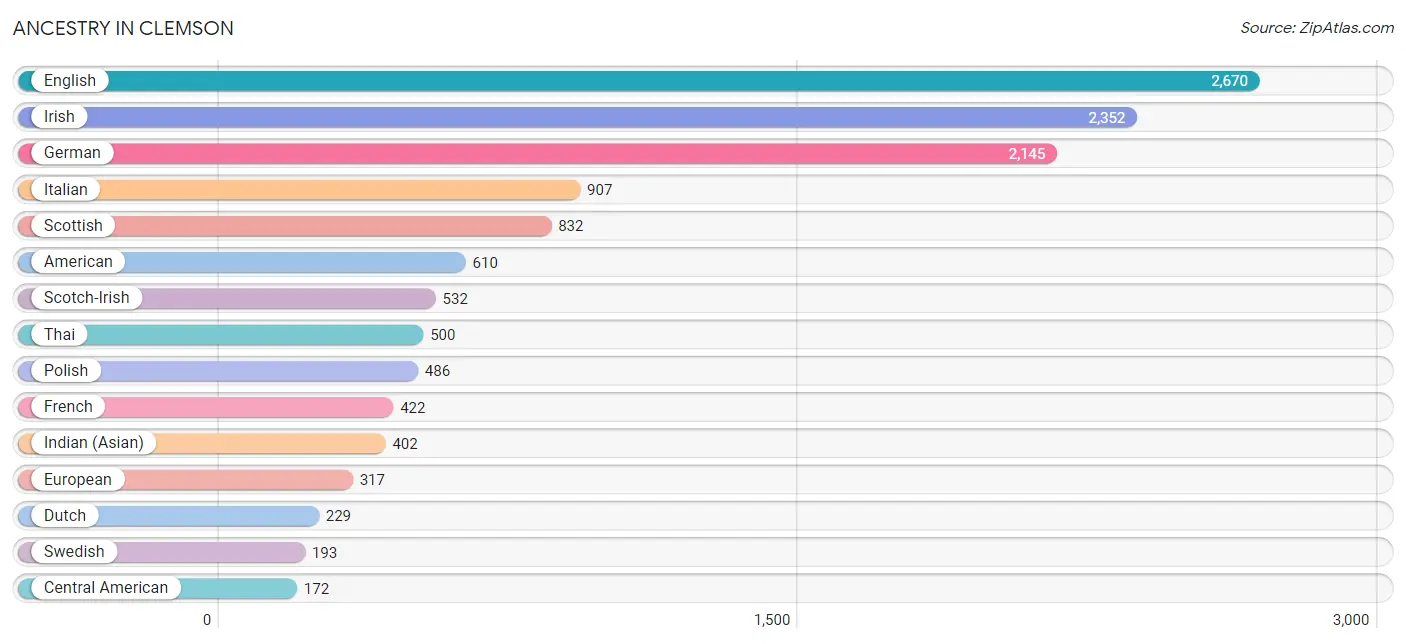
Ancestry in Clemson
The most populous ancestries reported in Clemson are English (2,670 | 15.2%), Irish (2,352 | 13.4%), German (2,145 | 12.2%), Italian (907 | 5.2%), and Scottish (832 | 4.7%), together accounting for 50.7% of all Clemson residents.
| Ancestry | # Population | % Population |
| African | 168 | 1.0% |
| American | 610 | 3.5% |
| Arab | 83 | 0.5% |
| Austrian | 24 | 0.1% |
| Bhutanese | 29 | 0.2% |
| Blackfeet | 23 | 0.1% |
| British | 97 | 0.5% |
| British West Indian | 14 | 0.1% |
| Burmese | 73 | 0.4% |
| Celtic | 14 | 0.1% |
| Central American | 172 | 1.0% |
| Central American Indian | 32 | 0.2% |
| Cherokee | 54 | 0.3% |
| Chilean | 40 | 0.2% |
| Colombian | 22 | 0.1% |
| Costa Rican | 18 | 0.1% |
| Croatian | 19 | 0.1% |
| Cuban | 37 | 0.2% |
| Czech | 27 | 0.2% |
| Czechoslovakian | 16 | 0.1% |
| Danish | 14 | 0.1% |
| Dutch | 229 | 1.3% |
| Eastern European | 13 | 0.1% |
| Ecuadorian | 59 | 0.3% |
| Egyptian | 19 | 0.1% |
| English | 2,670 | 15.2% |
| European | 317 | 1.8% |
| Filipino | 53 | 0.3% |
| Finnish | 17 | 0.1% |
| French | 422 | 2.4% |
| French Canadian | 26 | 0.2% |
| German | 2,145 | 12.2% |
| Greek | 11 | 0.1% |
| Guatemalan | 32 | 0.2% |
| Haitian | 24 | 0.1% |
| Honduran | 5 | 0.0% |
| Hungarian | 82 | 0.5% |
| Indian (Asian) | 402 | 2.3% |
| Indonesian | 56 | 0.3% |
| Iranian | 54 | 0.3% |
| Irish | 2,352 | 13.4% |
| Iroquois | 2 | 0.0% |
| Italian | 907 | 5.2% |
| Korean | 118 | 0.7% |
| Lebanese | 36 | 0.2% |
| Lithuanian | 21 | 0.1% |
| Lumbee | 22 | 0.1% |
| Mexican | 81 | 0.5% |
| Northern European | 25 | 0.1% |
| Norwegian | 85 | 0.5% |
| Palestinian | 28 | 0.2% |
| Peruvian | 24 | 0.1% |
| Polish | 486 | 2.8% |
| Portuguese | 23 | 0.1% |
| Puerto Rican | 48 | 0.3% |
| Romanian | 37 | 0.2% |
| Russian | 86 | 0.5% |
| Salvadoran | 117 | 0.7% |
| Scandinavian | 94 | 0.5% |
| Scotch-Irish | 532 | 3.0% |
| Scottish | 832 | 4.7% |
| Slovak | 20 | 0.1% |
| Slovene | 17 | 0.1% |
| South American | 162 | 0.9% |
| Spanish | 19 | 0.1% |
| Sri Lankan | 45 | 0.3% |
| Subsaharan African | 168 | 1.0% |
| Swedish | 193 | 1.1% |
| Swiss | 10 | 0.1% |
| Thai | 500 | 2.9% |
| Trinidadian and Tobagonian | 24 | 0.1% |
| U.S. Virgin Islander | 3 | 0.0% |
| Venezuelan | 17 | 0.1% |
| Welsh | 118 | 0.7% | View All 74 Rows |
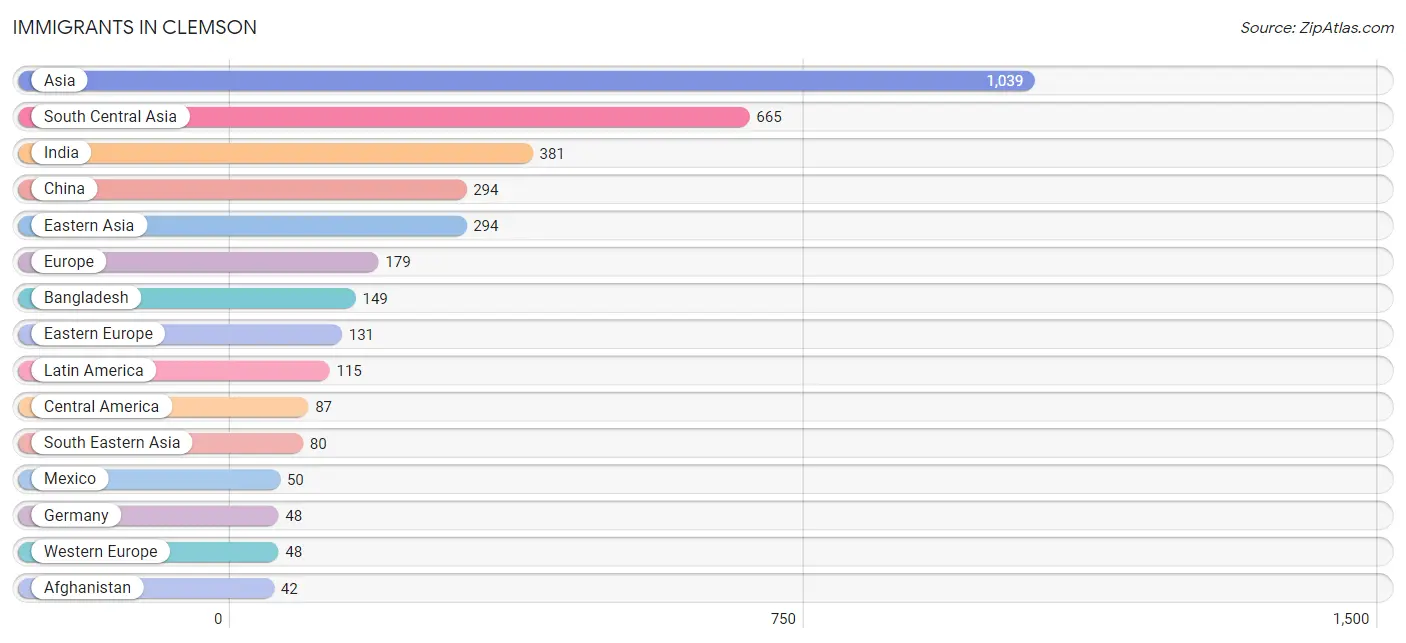
Immigrants in Clemson
The most numerous immigrant groups reported in Clemson came from Asia (1,039 | 5.9%), South Central Asia (665 | 3.8%), India (381 | 2.2%), China (294 | 1.7%), and Eastern Asia (294 | 1.7%), together accounting for 15.2% of all Clemson residents.
| Immigration Origin | # Population | % Population |
| Afghanistan | 42 | 0.2% |
| Africa | 19 | 0.1% |
| Asia | 1,039 | 5.9% |
| Australia | 8 | 0.1% |
| Bangladesh | 149 | 0.9% |
| Central America | 87 | 0.5% |
| China | 294 | 1.7% |
| Colombia | 22 | 0.1% |
| Croatia | 34 | 0.2% |
| Eastern Asia | 294 | 1.7% |
| Eastern Europe | 131 | 0.7% |
| Egypt | 19 | 0.1% |
| Europe | 179 | 1.0% |
| Germany | 48 | 0.3% |
| Guatemala | 32 | 0.2% |
| Honduras | 5 | 0.0% |
| Hungary | 18 | 0.1% |
| India | 381 | 2.2% |
| Iran | 40 | 0.2% |
| Latin America | 115 | 0.7% |
| Malaysia | 9 | 0.1% |
| Mexico | 50 | 0.3% |
| Nepal | 20 | 0.1% |
| Northern Africa | 19 | 0.1% |
| Oceania | 8 | 0.1% |
| Peru | 6 | 0.0% |
| Philippines | 14 | 0.1% |
| Romania | 24 | 0.1% |
| Russia | 36 | 0.2% |
| South America | 28 | 0.2% |
| South Central Asia | 665 | 3.8% |
| South Eastern Asia | 80 | 0.5% |
| Sri Lanka | 33 | 0.2% |
| Taiwan | 37 | 0.2% |
| Vietnam | 19 | 0.1% |
| Western Europe | 48 | 0.3% | View All 36 Rows |
Sex and Age in Clemson
Sex and Age in Clemson
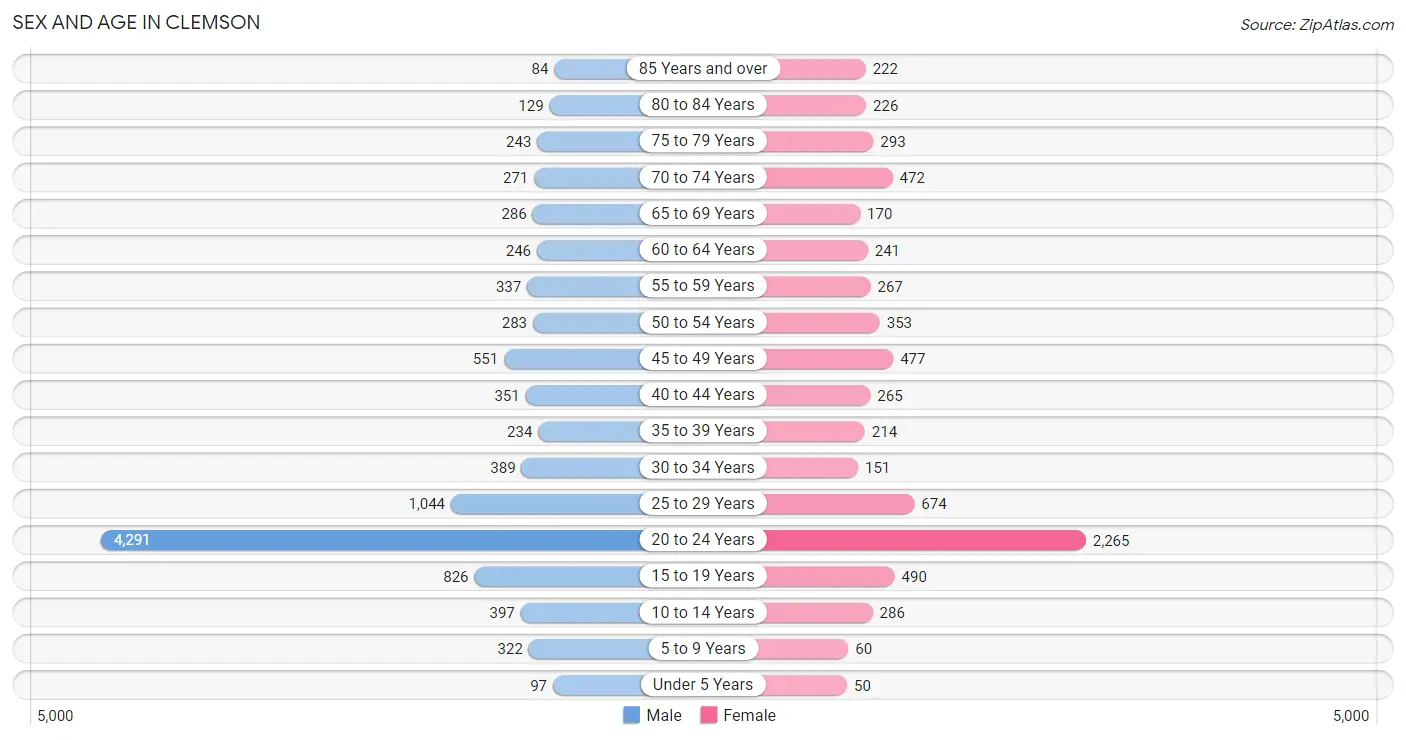
The most populous age groups in Clemson are 20 to 24 Years (4,291 | 41.3%) for men and 20 to 24 Years (2,265 | 31.6%) for women.
| Age Bracket | Male | Female |
| Under 5 Years | 97 (0.9%) | 50 (0.7%) |
| 5 to 9 Years | 322 (3.1%) | 60 (0.8%) |
| 10 to 14 Years | 397 (3.8%) | 286 (4.0%) |
| 15 to 19 Years | 826 (8.0%) | 490 (6.8%) |
| 20 to 24 Years | 4,291 (41.3%) | 2,265 (31.6%) |
| 25 to 29 Years | 1,044 (10.1%) | 674 (9.4%) |
| 30 to 34 Years | 389 (3.7%) | 151 (2.1%) |
| 35 to 39 Years | 234 (2.2%) | 214 (3.0%) |
| 40 to 44 Years | 351 (3.4%) | 265 (3.7%) |
| 45 to 49 Years | 551 (5.3%) | 477 (6.7%) |
| 50 to 54 Years | 283 (2.7%) | 353 (4.9%) |
| 55 to 59 Years | 337 (3.3%) | 267 (3.7%) |
| 60 to 64 Years | 246 (2.4%) | 241 (3.4%) |
| 65 to 69 Years | 286 (2.8%) | 170 (2.4%) |
| 70 to 74 Years | 271 (2.6%) | 472 (6.6%) |
| 75 to 79 Years | 243 (2.3%) | 293 (4.1%) |
| 80 to 84 Years | 129 (1.2%) | 226 (3.2%) |
| 85 Years and over | 84 (0.8%) | 222 (3.1%) |
| Total | 10,381 (100.0%) | 7,176 (100.0%) |
Families and Households in Clemson
Median Family Size in Clemson
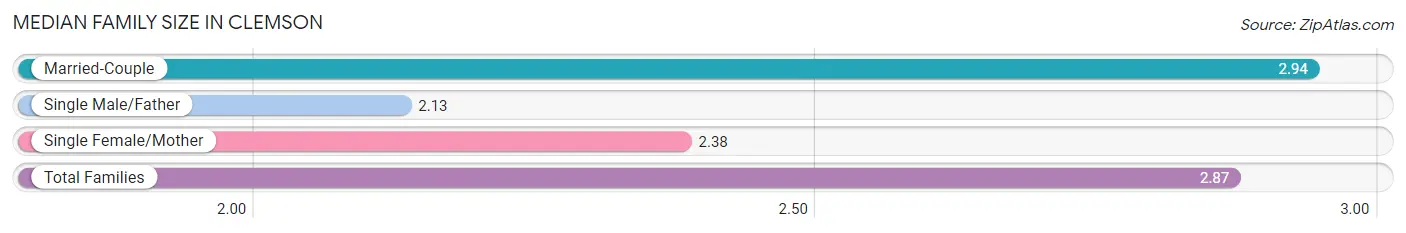
The median family size in Clemson is 2.87 persons per family, with married-couple families (2,222 | 89.3%) accounting for the largest median family size of 2.94 persons per family. On the other hand, single male/father families (178 | 7.2%) represent the smallest median family size with 2.13 persons per family.
| Family Type | # Families | Family Size |
| Married-Couple | 2,222 (89.3%) | 2.94 |
| Single Male/Father | 178 (7.2%) | 2.13 |
| Single Female/Mother | 87 (3.5%) | 2.38 |
| Total Families | 2,487 (100.0%) | 2.87 |
Median Household Size in Clemson
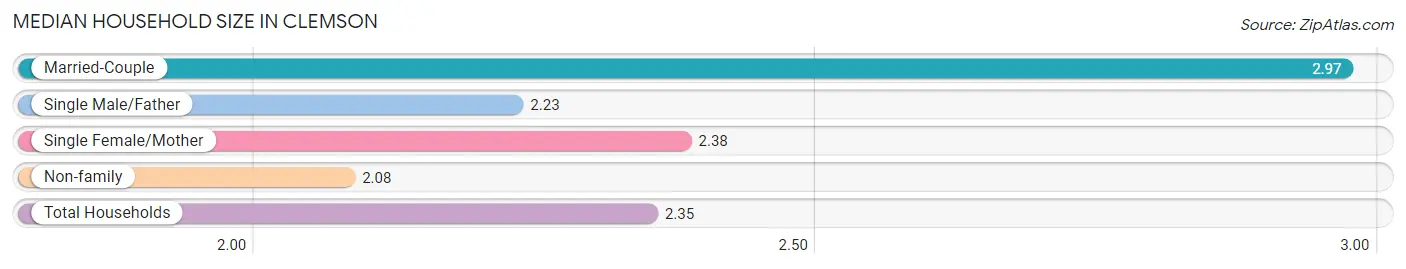
The median household size in Clemson is 2.35 persons per household, with married-couple households (2,222 | 30.0%) accounting for the largest median household size of 2.97 persons per household. non-family households (4,911 | 66.4%) represent the smallest median household size with 2.08 persons per household.
| Household Type | # Households | Household Size |
| Married-Couple | 2,222 (30.0%) | 2.97 |
| Single Male/Father | 178 (2.4%) | 2.23 |
| Single Female/Mother | 87 (1.2%) | 2.38 |
| Non-family | 4,911 (66.4%) | 2.08 |
| Total Households | 7,398 (100.0%) | 2.35 |
Household Size by Marriage Status in Clemson
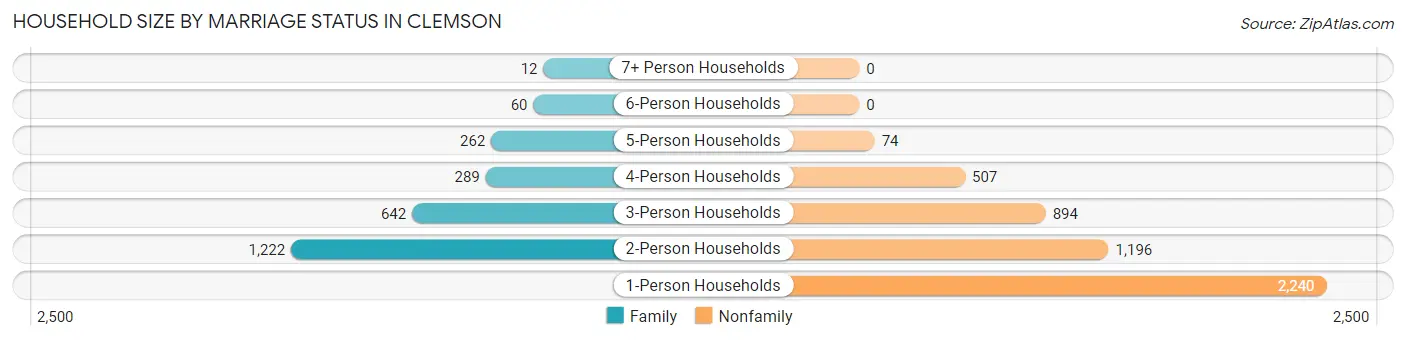
Out of a total of 7,398 households in Clemson, 2,487 (33.6%) are family households, while 4,911 (66.4%) are nonfamily households. The most numerous type of family households are 2-person households, comprising 1,222, and the most common type of nonfamily households are 1-person households, comprising 2,240.
| Household Size | Family Households | Nonfamily Households |
| 1-Person Households | - | 2,240 (30.3%) |
| 2-Person Households | 1,222 (16.5%) | 1,196 (16.2%) |
| 3-Person Households | 642 (8.7%) | 894 (12.1%) |
| 4-Person Households | 289 (3.9%) | 507 (6.9%) |
| 5-Person Households | 262 (3.5%) | 74 (1.0%) |
| 6-Person Households | 60 (0.8%) | 0 (0.0%) |
| 7+ Person Households | 12 (0.2%) | 0 (0.0%) |
| Total | 2,487 (33.6%) | 4,911 (66.4%) |
Female Fertility in Clemson
Fertility by Age in Clemson
Average fertility rate in Clemson is 6.0 births per 1,000 women. Women in the age bracket of 20 to 34 years have the highest fertility rate with 9.0 births per 1,000 women. Women in the age bracket of 20 to 34 years acount for 100.0% of all women with births.
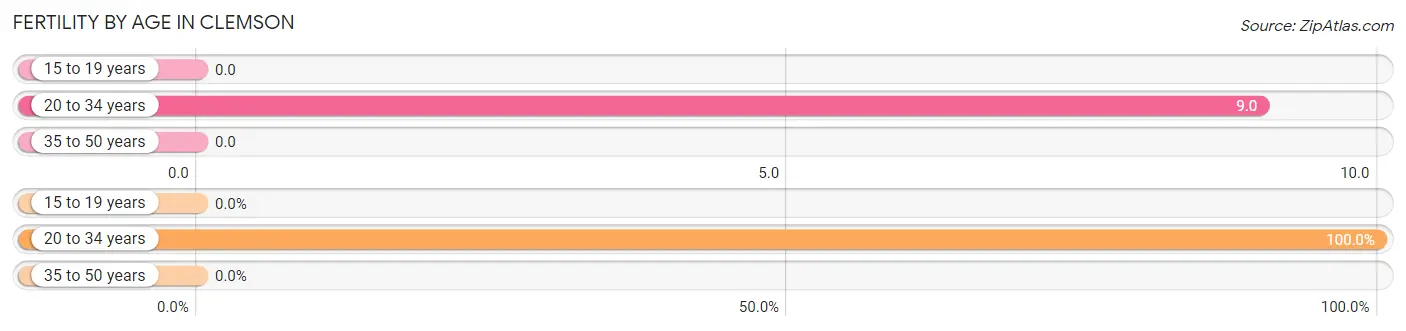
| Age Bracket | Women with Births | Births / 1,000 Women |
| 15 to 19 years | 0 (0.0%) | 0.0 |
| 20 to 34 years | 29 (100.0%) | 9.0 |
| 35 to 50 years | 0 (0.0%) | 0.0 |
| Total | 29 (100.0%) | 6.0 |
Fertility by Age by Marriage Status in Clemson
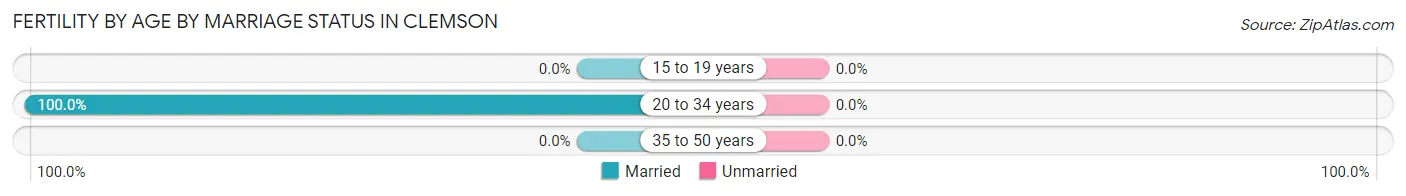
| Age Bracket | Married | Unmarried |
| 15 to 19 years | 0 (0.0%) | 0 (0.0%) |
| 20 to 34 years | 29 (100.0%) | 0 (0.0%) |
| 35 to 50 years | 0 (0.0%) | 0 (0.0%) |
| Total | 29 (100.0%) | 0 (0.0%) |
Fertility by Education in Clemson
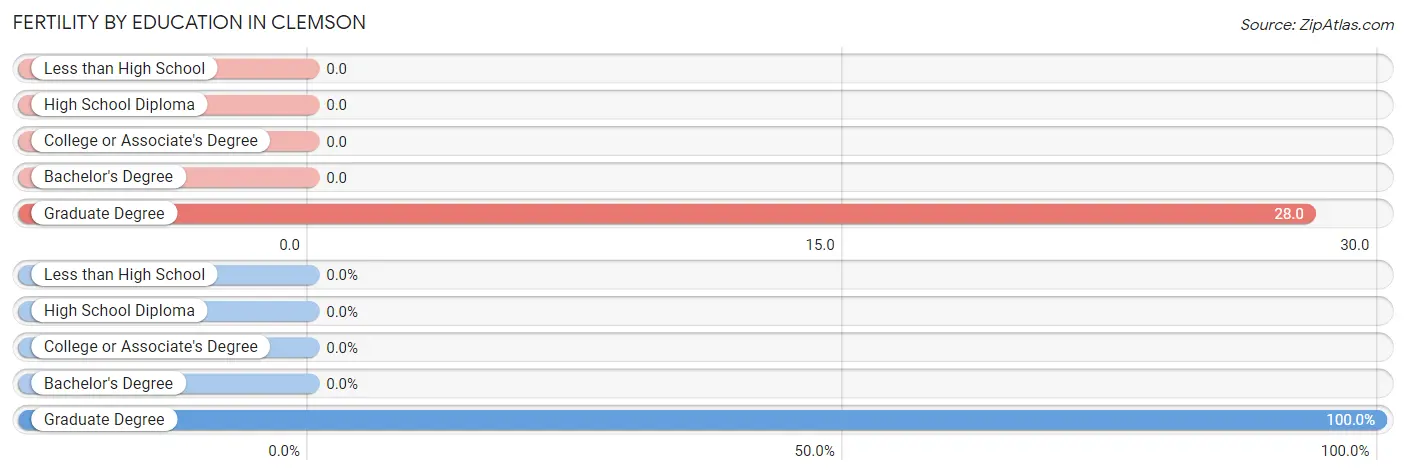
| Educational Attainment | Women with Births | Births / 1,000 Women |
| Less than High School | 0 (0.0%) | 0.0 |
| High School Diploma | 0 (0.0%) | 0.0 |
| College or Associate's Degree | 0 (0.0%) | 0.0 |
| Bachelor's Degree | 0 (0.0%) | 0.0 |
| Graduate Degree | 29 (100.0%) | 28.0 |
| Total | 29 (100.0%) | 6.0 |
Fertility by Education by Marriage Status in Clemson
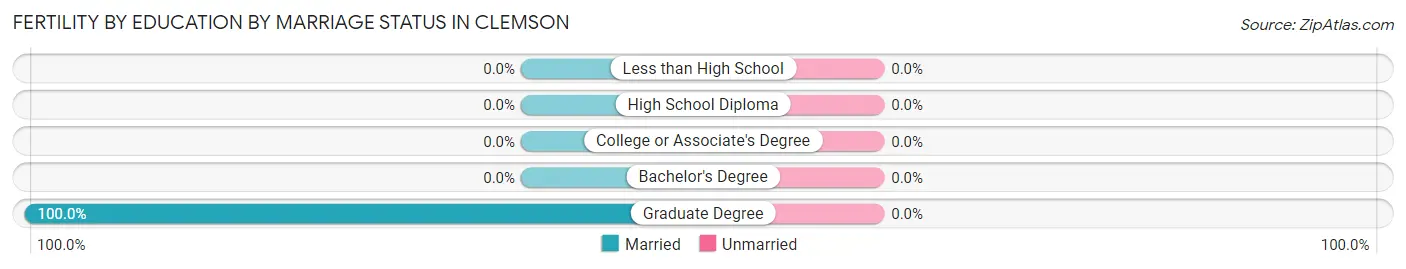
| Educational Attainment | Married | Unmarried |
| Less than High School | 0 (0.0%) | 0 (0.0%) |
| High School Diploma | 0 (0.0%) | 0 (0.0%) |
| College or Associate's Degree | 0 (0.0%) | 0 (0.0%) |
| Bachelor's Degree | 0 (0.0%) | 0 (0.0%) |
| Graduate Degree | 29 (100.0%) | 0 (0.0%) |
| Total | 29 (100.0%) | 0 (0.0%) |
Income in Clemson
Income Overview in Clemson
Per Capita Income in Clemson is $34,468, while median incomes of families and households are $121,995 and $50,263 respectively.
| Characteristic | Number | Measure |
| Per Capita Income | 17,557 | $34,468 |
| Median Family Income | 2,487 | $121,995 |
| Mean Family Income | 2,487 | $147,754 |
| Median Household Income | 7,398 | $50,263 |
| Mean Household Income | 7,398 | $81,151 |
| Income Deficit | 2,487 | $0 |
| Wage / Income Gap (%) | 17,557 | 6.06% |
| Wage / Income Gap ($) | 17,557 | 93.94¢ per $1 |
| Gini / Inequality Index | 17,557 | 0.54 |
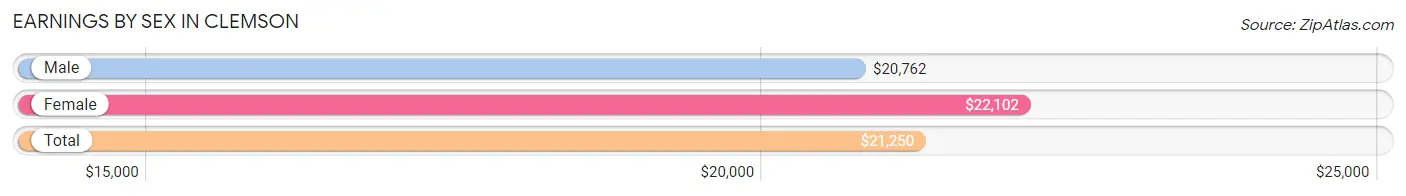
Earnings by Sex in Clemson
Average Earnings in Clemson are $21,250, $20,762 for men and $22,102 for women, a difference of 6.1%.
| Sex | Number | Average Earnings |
| Male | 6,776 (59.9%) | $20,762 |
| Female | 4,533 (40.1%) | $22,102 |
| Total | 11,309 (100.0%) | $21,250 |
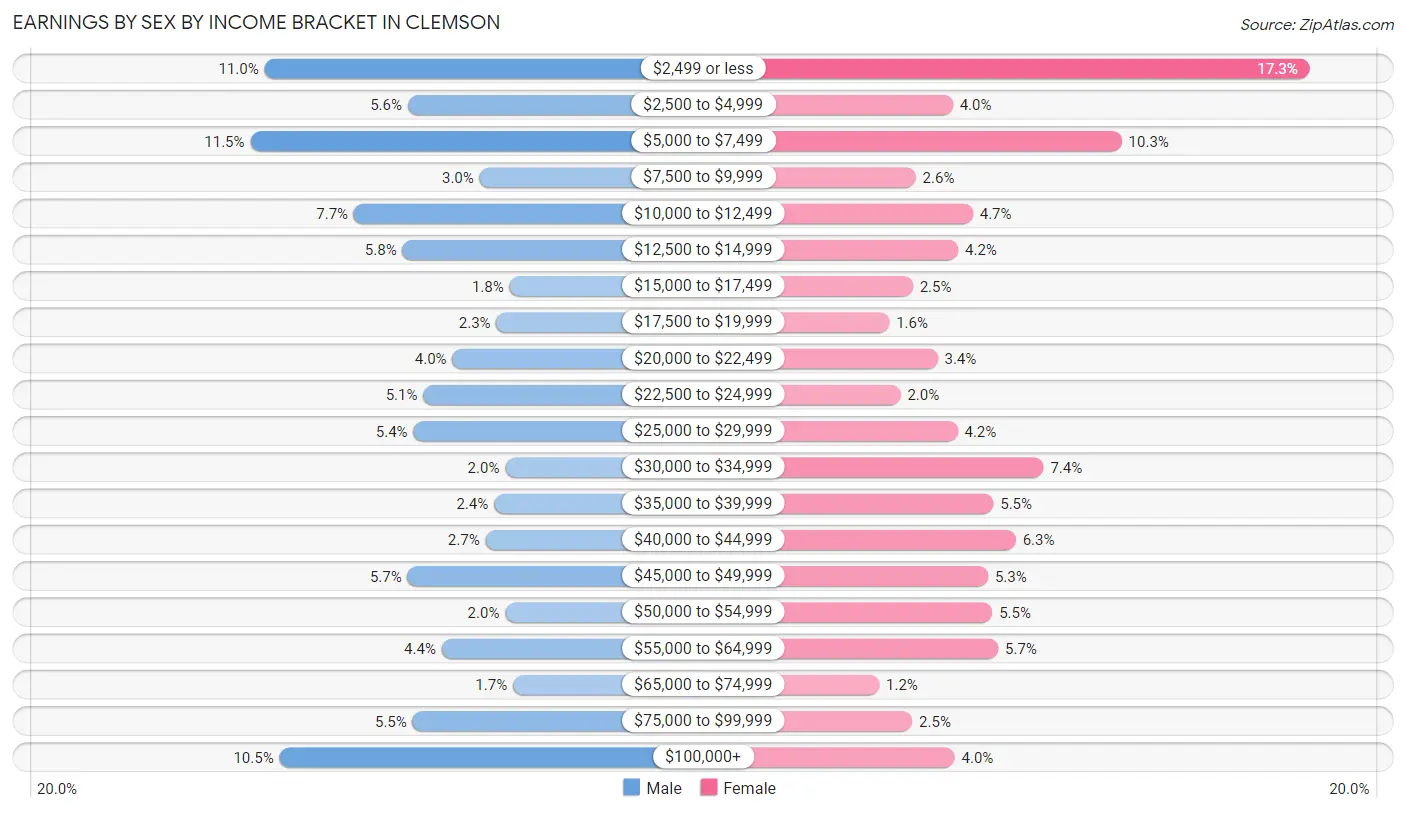
Earnings by Sex by Income Bracket in Clemson
The most common earnings brackets in Clemson are $5,000 to $7,499 for men (782 | 11.5%) and $2,499 or less for women (786 | 17.3%).
| Income | Male | Female |
| $2,499 or less | 746 (11.0%) | 786 (17.3%) |
| $2,500 to $4,999 | 382 (5.6%) | 180 (4.0%) |
| $5,000 to $7,499 | 782 (11.5%) | 467 (10.3%) |
| $7,500 to $9,999 | 200 (2.9%) | 117 (2.6%) |
| $10,000 to $12,499 | 519 (7.7%) | 214 (4.7%) |
| $12,500 to $14,999 | 396 (5.8%) | 189 (4.2%) |
| $15,000 to $17,499 | 124 (1.8%) | 112 (2.5%) |
| $17,500 to $19,999 | 157 (2.3%) | 72 (1.6%) |
| $20,000 to $22,499 | 269 (4.0%) | 154 (3.4%) |
| $22,500 to $24,999 | 343 (5.1%) | 91 (2.0%) |
| $25,000 to $29,999 | 368 (5.4%) | 188 (4.2%) |
| $30,000 to $34,999 | 135 (2.0%) | 334 (7.4%) |
| $35,000 to $39,999 | 163 (2.4%) | 249 (5.5%) |
| $40,000 to $44,999 | 185 (2.7%) | 287 (6.3%) |
| $45,000 to $49,999 | 383 (5.7%) | 240 (5.3%) |
| $50,000 to $54,999 | 135 (2.0%) | 247 (5.4%) |
| $55,000 to $64,999 | 296 (4.4%) | 257 (5.7%) |
| $65,000 to $74,999 | 115 (1.7%) | 55 (1.2%) |
| $75,000 to $99,999 | 370 (5.5%) | 111 (2.5%) |
| $100,000+ | 708 (10.4%) | 183 (4.0%) |
| Total | 6,776 (100.0%) | 4,533 (100.0%) |
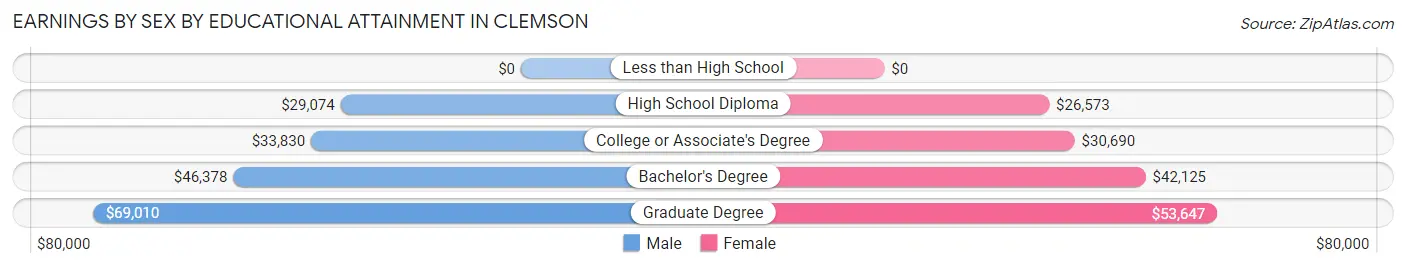
Earnings by Sex by Educational Attainment in Clemson
Average earnings in Clemson are $46,553 for men and $42,228 for women, a difference of 9.3%. Men with an educational attainment of graduate degree enjoy the highest average annual earnings of $69,010, while those with high school diploma education earn the least with $29,074. Women with an educational attainment of graduate degree earn the most with the average annual earnings of $53,647, while those with high school diploma education have the smallest earnings of $26,573.
| Educational Attainment | Male Income | Female Income |
| Less than High School | - | - |
| High School Diploma | $29,074 | $26,573 |
| College or Associate's Degree | $33,830 | $30,690 |
| Bachelor's Degree | $46,378 | $42,125 |
| Graduate Degree | $69,010 | $53,647 |
| Total | $46,553 | $42,228 |
Family Income in Clemson
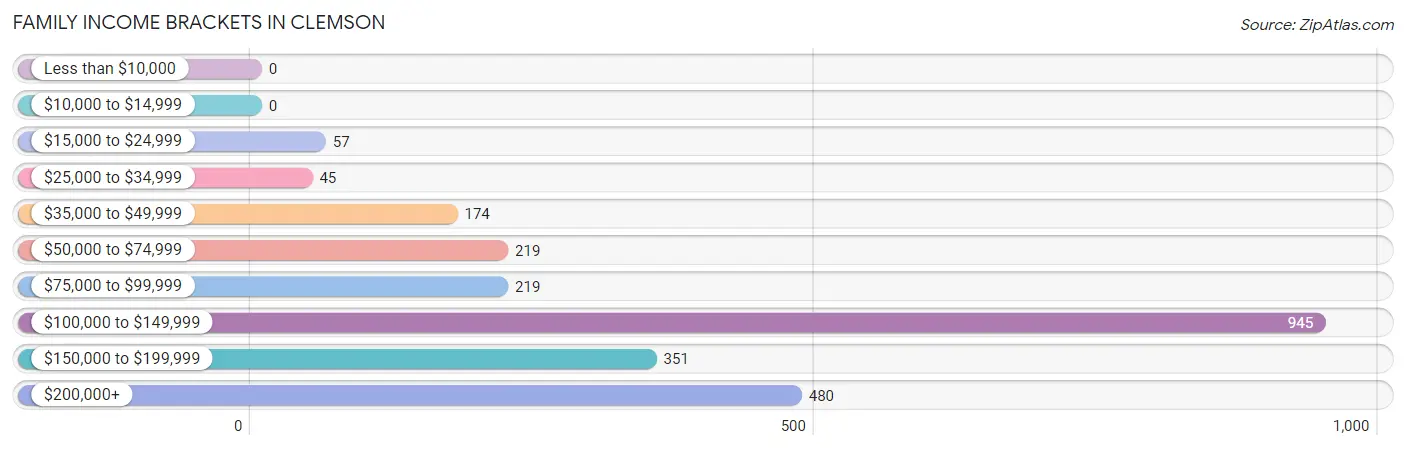
Family Income Brackets in Clemson
According to the Clemson family income data, there are 945 families falling into the $100,000 to $149,999 income range, which is the most common income bracket and makes up 38.0% of all families.
| Income Bracket | # Families | % Families |
| Less than $10,000 | 0 | 0.0% |
| $10,000 to $14,999 | 0 | 0.0% |
| $15,000 to $24,999 | 57 | 2.3% |
| $25,000 to $34,999 | 45 | 1.8% |
| $35,000 to $49,999 | 174 | 7.0% |
| $50,000 to $74,999 | 219 | 8.8% |
| $75,000 to $99,999 | 219 | 8.8% |
| $100,000 to $149,999 | 945 | 38.0% |
| $150,000 to $199,999 | 351 | 14.1% |
| $200,000+ | 480 | 19.3% |
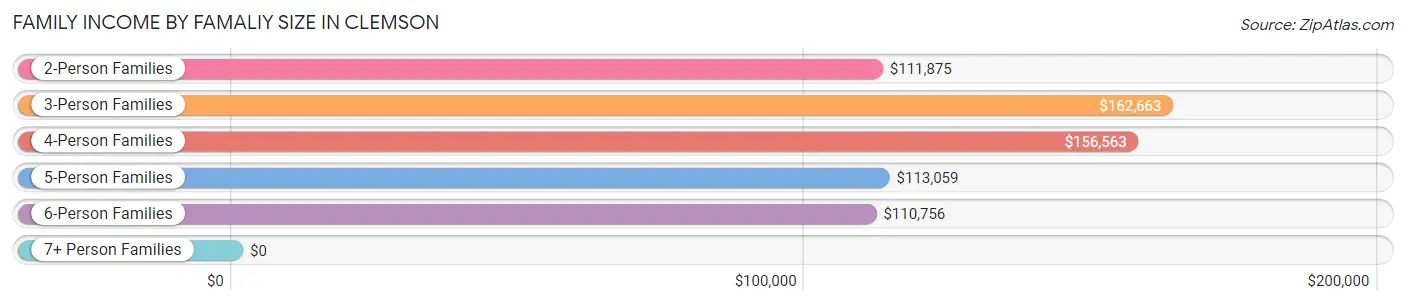
Family Income by Famaliy Size in Clemson
3-person families (601 | 24.2%) account for the highest median family income in Clemson with $162,663 per family, while 2-person families (1,270 | 51.1%) have the highest median income of $55,938 per family member.
| Income Bracket | # Families | Median Income |
| 2-Person Families | 1,270 (51.1%) | $111,875 |
| 3-Person Families | 601 (24.2%) | $162,663 |
| 4-Person Families | 282 (11.3%) | $156,563 |
| 5-Person Families | 262 (10.5%) | $113,059 |
| 6-Person Families | 60 (2.4%) | $110,756 |
| 7+ Person Families | 12 (0.5%) | $0 |
| Total | 2,487 (100.0%) | $121,995 |
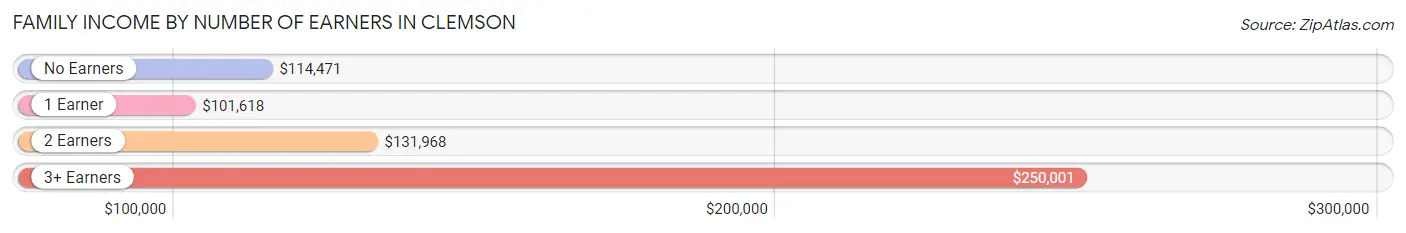
Family Income by Number of Earners in Clemson
The median family income in Clemson is $121,995, with families comprising 3+ earners (159) having the highest median family income of $250,001, while families with 1 earner (676) have the lowest median family income of $101,618, accounting for 6.4% and 27.2% of families, respectively.
| Number of Earners | # Families | Median Income |
| No Earners | 417 (16.8%) | $114,471 |
| 1 Earner | 676 (27.2%) | $101,618 |
| 2 Earners | 1,235 (49.7%) | $131,968 |
| 3+ Earners | 159 (6.4%) | $250,001 |
| Total | 2,487 (100.0%) | $121,995 |
Household Income in Clemson
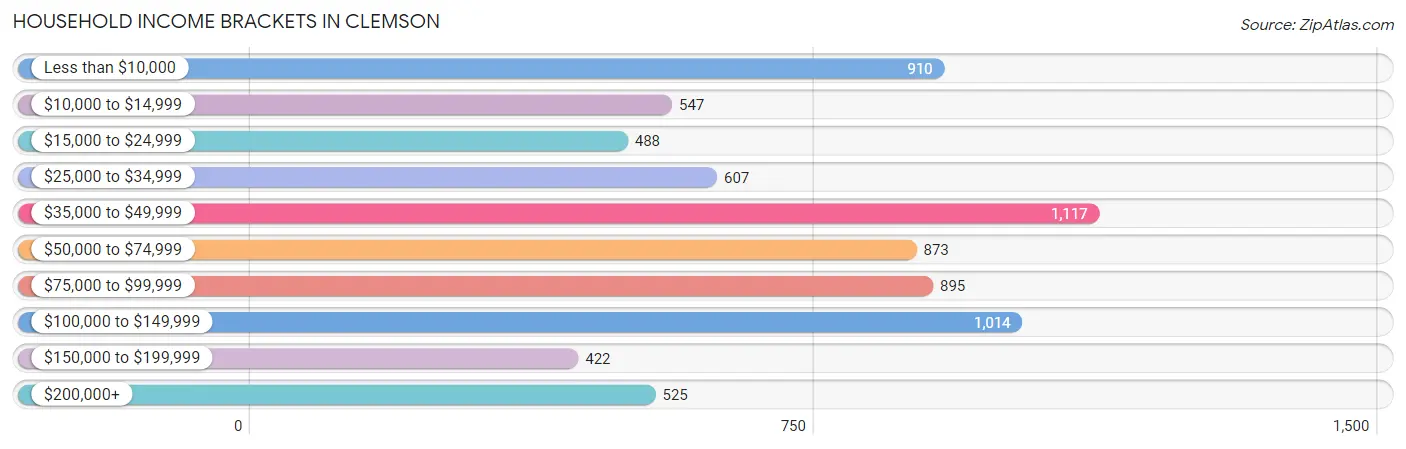
Household Income Brackets in Clemson
With 1,117 households falling in the category, the $35,000 to $49,999 income range is the most frequent in Clemson, accounting for 15.1% of all households. In contrast, only 422 households (5.7%) fall into the $150,000 to $199,999 income bracket, making it the least populous group.
| Income Bracket | # Households | % Households |
| Less than $10,000 | 910 | 12.3% |
| $10,000 to $14,999 | 547 | 7.4% |
| $15,000 to $24,999 | 488 | 6.6% |
| $25,000 to $34,999 | 607 | 8.2% |
| $35,000 to $49,999 | 1,117 | 15.1% |
| $50,000 to $74,999 | 873 | 11.8% |
| $75,000 to $99,999 | 895 | 12.1% |
| $100,000 to $149,999 | 1,014 | 13.7% |
| $150,000 to $199,999 | 422 | 5.7% |
| $200,000+ | 525 | 7.1% |
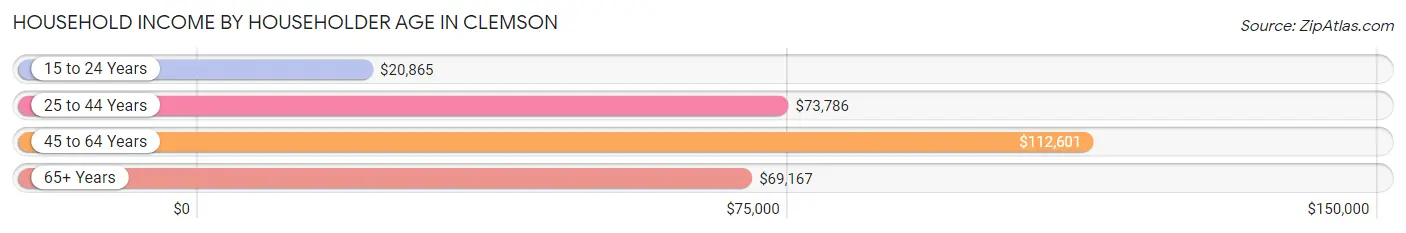
Household Income by Householder Age in Clemson
The median household income in Clemson is $50,263, with the highest median household income of $112,601 found in the 45 to 64 years age bracket for the primary householder. A total of 1,528 households (20.6%) fall into this category. Meanwhile, the 15 to 24 years age bracket for the primary householder has the lowest median household income of $20,865, with 2,438 households (33.0%) in this group.
| Income Bracket | # Households | Median Income |
| 15 to 24 Years | 2,438 (33.0%) | $20,865 |
| 25 to 44 Years | 1,758 (23.8%) | $73,786 |
| 45 to 64 Years | 1,528 (20.6%) | $112,601 |
| 65+ Years | 1,674 (22.6%) | $69,167 |
| Total | 7,398 (100.0%) | $50,263 |
Poverty in Clemson
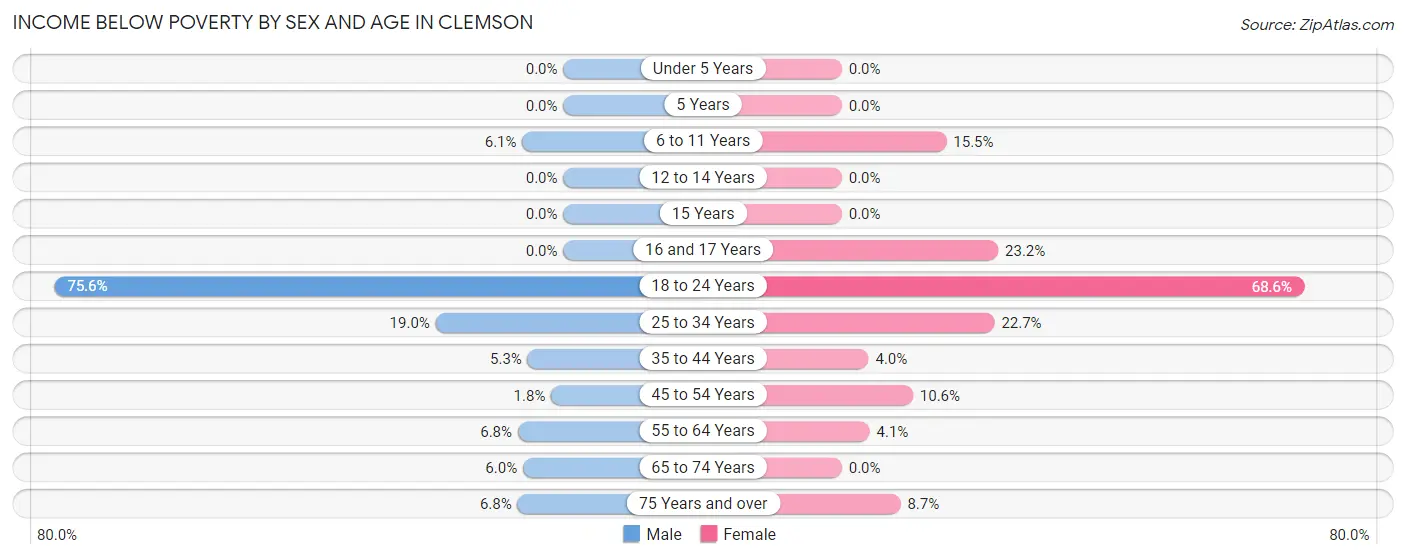
Income Below Poverty by Sex and Age in Clemson
With 39.6% poverty level for males and 30.8% for females among the residents of Clemson, 18 to 24 year old males and 18 to 24 year old females are the most vulnerable to poverty, with 3,650 males (75.6%) and 1,763 females (68.6%) in their respective age groups living below the poverty level.
| Age Bracket | Male | Female |
| Under 5 Years | 0 (0.0%) | 0 (0.0%) |
| 5 Years | 0 (0.0%) | 0 (0.0%) |
| 6 to 11 Years | 29 (6.1%) | 34 (15.5%) |
| 12 to 14 Years | 0 (0.0%) | 0 (0.0%) |
| 15 Years | 0 (0.0%) | 0 (0.0%) |
| 16 and 17 Years | 0 (0.0%) | 13 (23.2%) |
| 18 to 24 Years | 3,650 (75.6%) | 1,763 (68.6%) |
| 25 to 34 Years | 271 (19.0%) | 187 (22.7%) |
| 35 to 44 Years | 31 (5.3%) | 19 (4.0%) |
| 45 to 54 Years | 15 (1.8%) | 87 (10.5%) |
| 55 to 64 Years | 39 (6.8%) | 21 (4.1%) |
| 65 to 74 Years | 33 (6.0%) | 0 (0.0%) |
| 75 Years and over | 31 (6.8%) | 61 (8.7%) |
| Total | 4,099 (39.6%) | 2,185 (30.8%) |
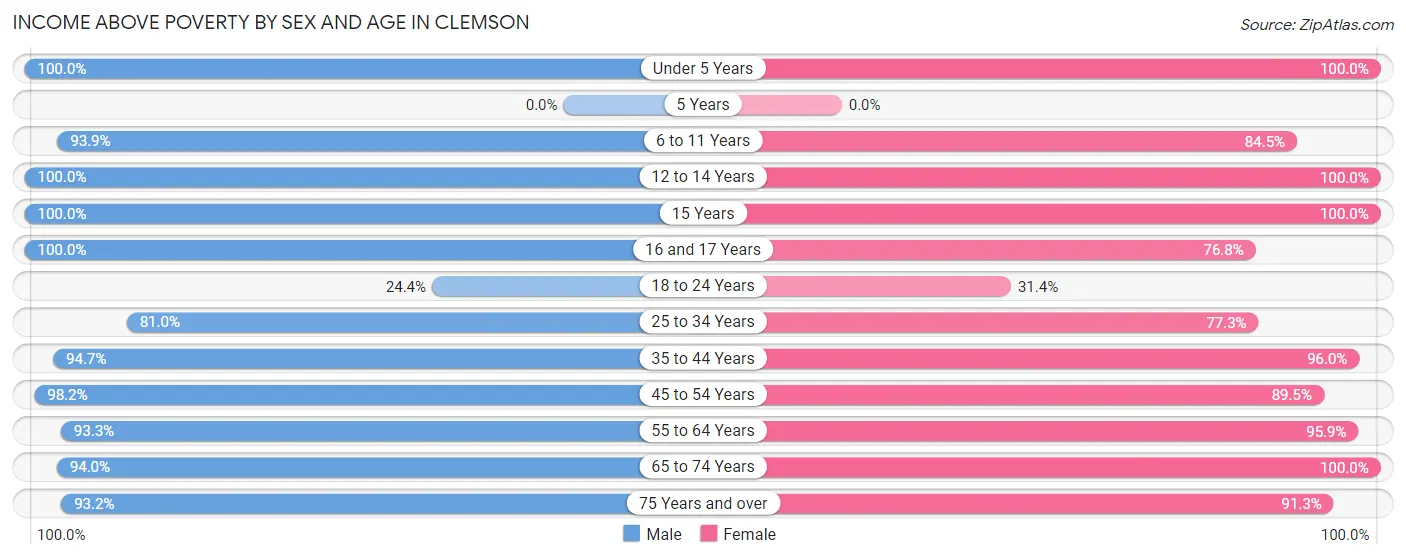
Income Above Poverty by Sex and Age in Clemson
According to the poverty statistics in Clemson, males aged under 5 years and females aged under 5 years are the age groups that are most secure financially, with 100.0% of males and 100.0% of females in these age groups living above the poverty line.
| Age Bracket | Male | Female |
| Under 5 Years | 97 (100.0%) | 50 (100.0%) |
| 5 Years | 0 (0.0%) | 0 (0.0%) |
| 6 to 11 Years | 447 (93.9%) | 185 (84.5%) |
| 12 to 14 Years | 243 (100.0%) | 120 (100.0%) |
| 15 Years | 117 (100.0%) | 101 (100.0%) |
| 16 and 17 Years | 153 (100.0%) | 43 (76.8%) |
| 18 to 24 Years | 1,179 (24.4%) | 807 (31.4%) |
| 25 to 34 Years | 1,158 (81.0%) | 638 (77.3%) |
| 35 to 44 Years | 554 (94.7%) | 460 (96.0%) |
| 45 to 54 Years | 817 (98.2%) | 738 (89.4%) |
| 55 to 64 Years | 539 (93.2%) | 487 (95.9%) |
| 65 to 74 Years | 518 (94.0%) | 636 (100.0%) |
| 75 Years and over | 425 (93.2%) | 639 (91.3%) |
| Total | 6,247 (60.4%) | 4,904 (69.2%) |
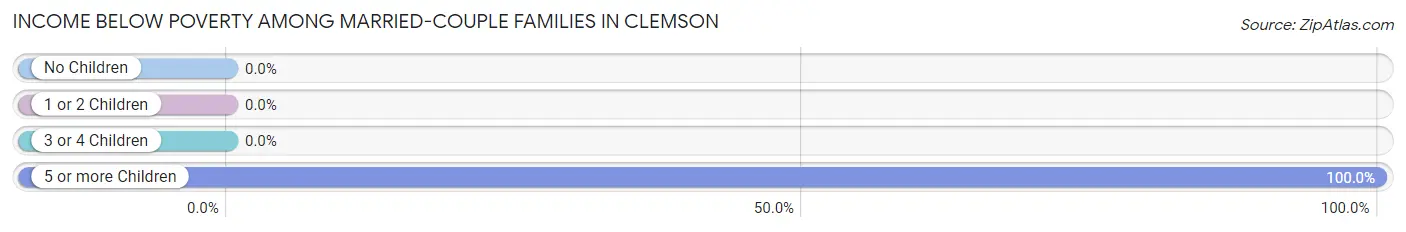
Income Below Poverty Among Married-Couple Families in Clemson
The poverty statistics for married-couple families in Clemson show that 0.5% or 12 of the total 2,222 families live below the poverty line. Families with 5 or more children have the highest poverty rate of 100.0%, comprising of 12 families. On the other hand, families with no children have the lowest poverty rate of 0.0%, which includes 0 families.
| Children | Above Poverty | Below Poverty |
| No Children | 1,344 (100.0%) | 0 (0.0%) |
| 1 or 2 Children | 610 (100.0%) | 0 (0.0%) |
| 3 or 4 Children | 256 (100.0%) | 0 (0.0%) |
| 5 or more Children | 0 (0.0%) | 12 (100.0%) |
| Total | 2,210 (99.5%) | 12 (0.5%) |
Income Below Poverty Among Single-Parent Households in Clemson
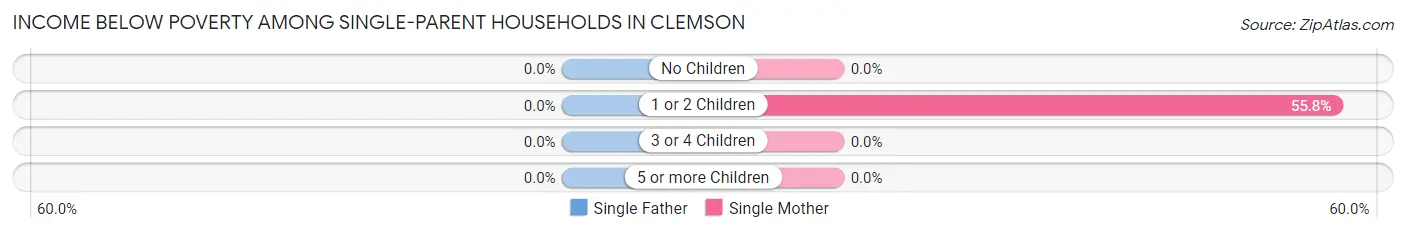
| Children | Single Father | Single Mother |
| No Children | 0 (0.0%) | 0 (0.0%) |
| 1 or 2 Children | 0 (0.0%) | 24 (55.8%) |
| 3 or 4 Children | 0 (0.0%) | 0 (0.0%) |
| 5 or more Children | 0 (0.0%) | 0 (0.0%) |
| Total | 0 (0.0%) | 24 (27.6%) |
Income Below Poverty Among Married-Couple vs Single-Parent Households in Clemson
The poverty data for Clemson shows that 12 of the married-couple family households (0.5%) and 24 of the single-parent households (9.1%) are living below the poverty level. Within the married-couple family households, those with 5 or more children have the highest poverty rate, with 12 households (100.0%) falling below the poverty line. Among the single-parent households, those with 1 or 2 children have the highest poverty rate, with 24 household (17.0%) living below poverty.
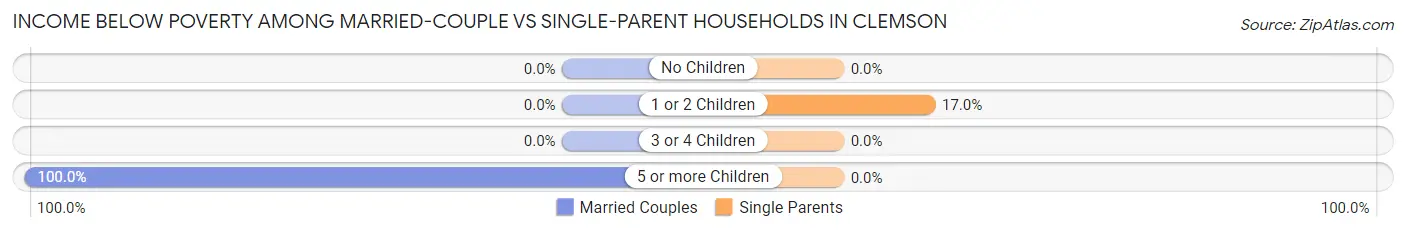
| Children | Married-Couple Families | Single-Parent Households |
| No Children | 0 (0.0%) | 0 (0.0%) |
| 1 or 2 Children | 0 (0.0%) | 24 (17.0%) |
| 3 or 4 Children | 0 (0.0%) | 0 (0.0%) |
| 5 or more Children | 12 (100.0%) | 0 (0.0%) |
| Total | 12 (0.5%) | 24 (9.1%) |
Employment Characteristics in Clemson
Employment by Class of Employer in Clemson
Among the 7,902 employed individuals in Clemson, private company employees (4,173 | 52.8%), state government employees (1,957 | 24.8%), and not-for-profit organizations (723 | 9.1%) make up the most common classes of employment.
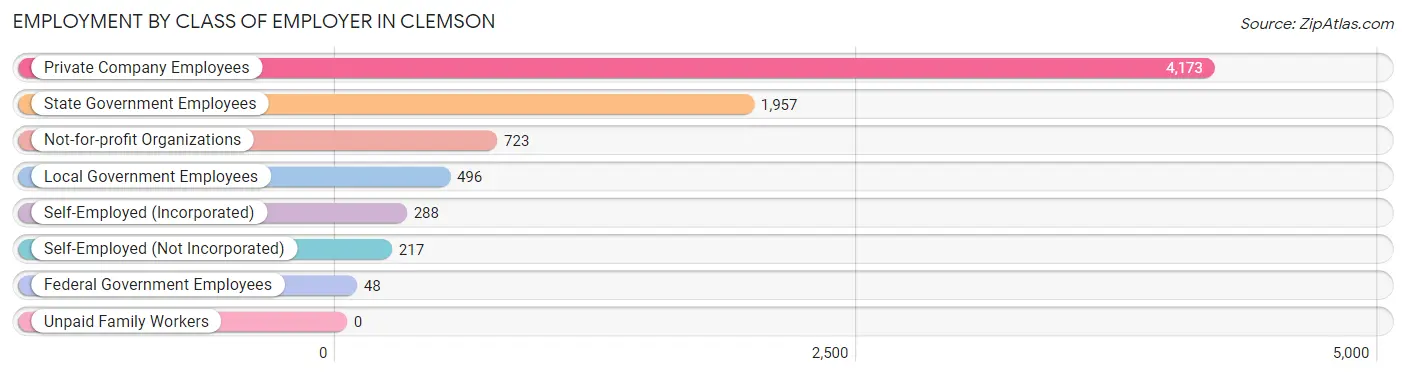
| Employer Class | # Employees | % Employees |
| Private Company Employees | 4,173 | 52.8% |
| Self-Employed (Incorporated) | 288 | 3.6% |
| Self-Employed (Not Incorporated) | 217 | 2.8% |
| Not-for-profit Organizations | 723 | 9.1% |
| Local Government Employees | 496 | 6.3% |
| State Government Employees | 1,957 | 24.8% |
| Federal Government Employees | 48 | 0.6% |
| Unpaid Family Workers | 0 | 0.0% |
| Total | 7,902 | 100.0% |
Employment Status by Age in Clemson
According to the labor force statistics for Clemson, out of the total population over 16 years of age (16,127), 55.2% or 8,902 individuals are in the labor force, with 4.3% or 383 of them unemployed. The age group with the highest labor force participation rate is 45 to 54 years, with 87.9% or 1,463 individuals in the labor force. Within the labor force, the 75 years and over age range has the highest percentage of unemployed individuals, with 18.7% or 17 of them being unemployed.
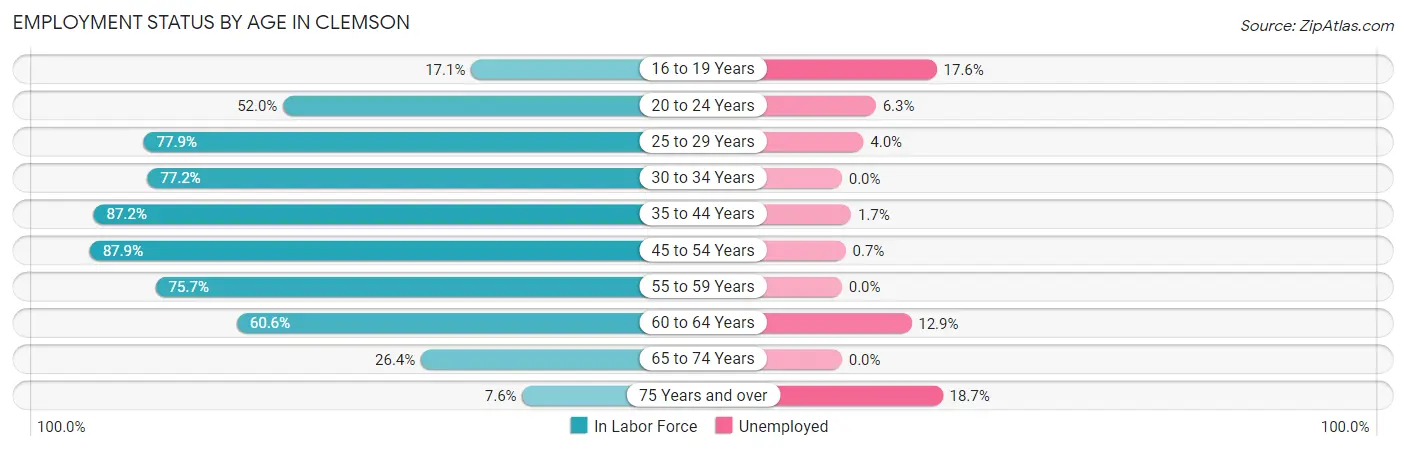
| Age Bracket | In Labor Force | Unemployed |
| 16 to 19 Years | 188 (17.1%) | 33 (17.6%) |
| 20 to 24 Years | 3,409 (52.0%) | 215 (6.3%) |
| 25 to 29 Years | 1,338 (77.9%) | 54 (4.0%) |
| 30 to 34 Years | 417 (77.2%) | 0 (0.0%) |
| 35 to 44 Years | 928 (87.2%) | 16 (1.7%) |
| 45 to 54 Years | 1,463 (87.9%) | 10 (0.7%) |
| 55 to 59 Years | 457 (75.7%) | 0 (0.0%) |
| 60 to 64 Years | 295 (60.6%) | 38 (12.9%) |
| 65 to 74 Years | 317 (26.4%) | 0 (0.0%) |
| 75 Years and over | 91 (7.6%) | 17 (18.7%) |
| Total | 8,902 (55.2%) | 383 (4.3%) |
Employment Status by Educational Attainment in Clemson
According to labor force statistics for Clemson, 80.6% of individuals (4,898) out of the total population between 25 and 64 years of age (6,077) are in the labor force, with 2.4% or 118 of them being unemployed. The group with the highest labor force participation rate are those with the educational attainment of college / associate degree, with 87.1% or 901 individuals in the labor force. Within the labor force, individuals with high school diploma education have the highest percentage of unemployment, with 13.1% or 68 of them being unemployed.
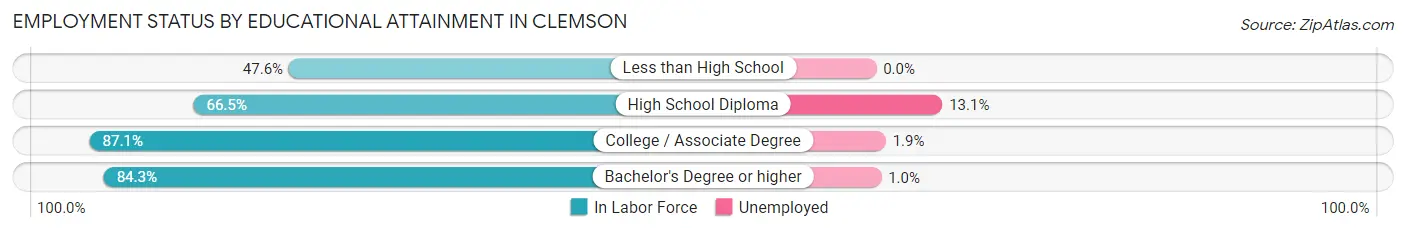
| Educational Attainment | In Labor Force | Unemployed |
| Less than High School | 147 (47.6%) | 0 (0.0%) |
| High School Diploma | 520 (66.5%) | 102 (13.1%) |
| College / Associate Degree | 901 (87.1%) | 20 (1.9%) |
| Bachelor's Degree or higher | 3,331 (84.3%) | 40 (1.0%) |
| Total | 4,898 (80.6%) | 146 (2.4%) |
Employment Occupations by Sex in Clemson
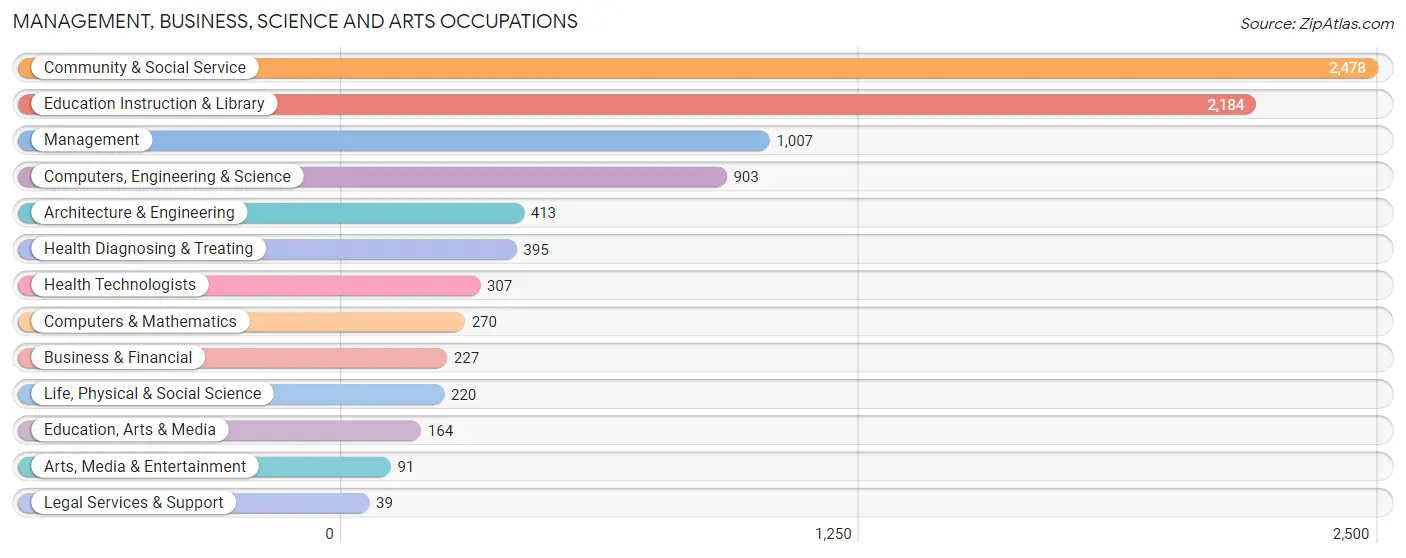
Management, Business, Science and Arts Occupations
The most common Management, Business, Science and Arts occupations in Clemson are Community & Social Service (2,478 | 29.1%), Education Instruction & Library (2,184 | 25.6%), Management (1,007 | 11.8%), Computers, Engineering & Science (903 | 10.6%), and Architecture & Engineering (413 | 4.9%).
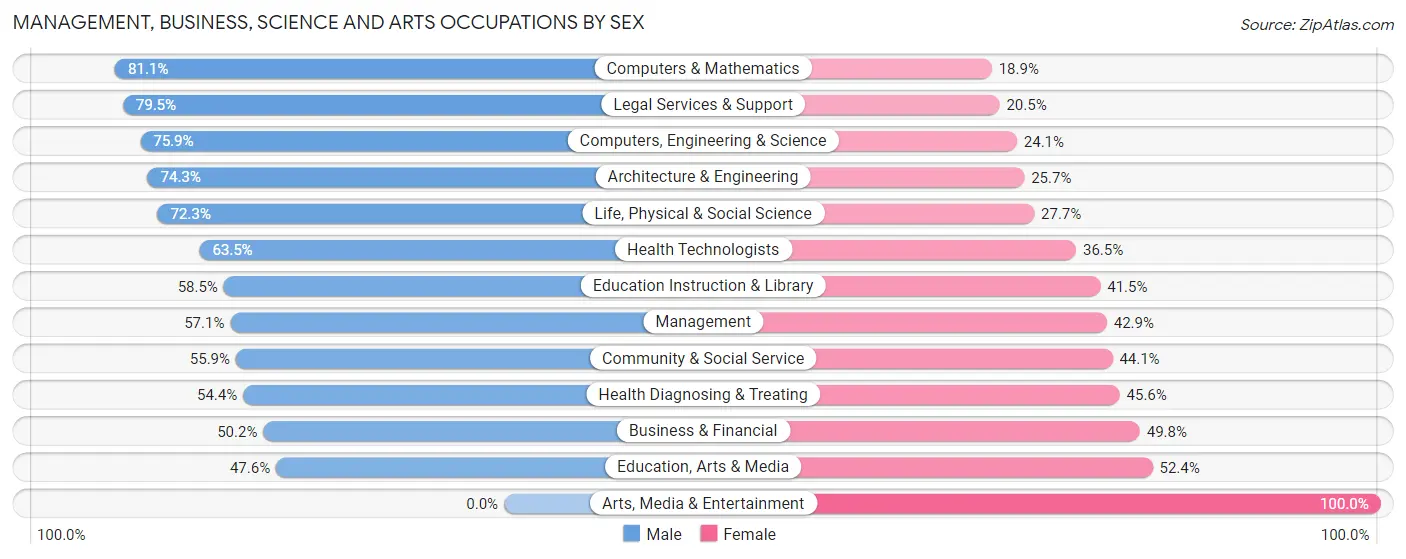
Management, Business, Science and Arts Occupations by Sex
Within the Management, Business, Science and Arts occupations in Clemson, the most male-oriented occupations are Computers & Mathematics (81.1%), Legal Services & Support (79.5%), and Computers, Engineering & Science (75.9%), while the most female-oriented occupations are Arts, Media & Entertainment (100.0%), Education, Arts & Media (52.4%), and Business & Financial (49.8%).
| Occupation | Male | Female |
| Management | 575 (57.1%) | 432 (42.9%) |
| Business & Financial | 114 (50.2%) | 113 (49.8%) |
| Computers, Engineering & Science | 685 (75.9%) | 218 (24.1%) |
| Computers & Mathematics | 219 (81.1%) | 51 (18.9%) |
| Architecture & Engineering | 307 (74.3%) | 106 (25.7%) |
| Life, Physical & Social Science | 159 (72.3%) | 61 (27.7%) |
| Community & Social Service | 1,386 (55.9%) | 1,092 (44.1%) |
| Education, Arts & Media | 78 (47.6%) | 86 (52.4%) |
| Legal Services & Support | 31 (79.5%) | 8 (20.5%) |
| Education Instruction & Library | 1,277 (58.5%) | 907 (41.5%) |
| Arts, Media & Entertainment | 0 (0.0%) | 91 (100.0%) |
| Health Diagnosing & Treating | 215 (54.4%) | 180 (45.6%) |
| Health Technologists | 195 (63.5%) | 112 (36.5%) |
| Total (Category) | 2,975 (59.4%) | 2,035 (40.6%) |
| Total (Overall) | 4,984 (58.5%) | 3,536 (41.5%) |
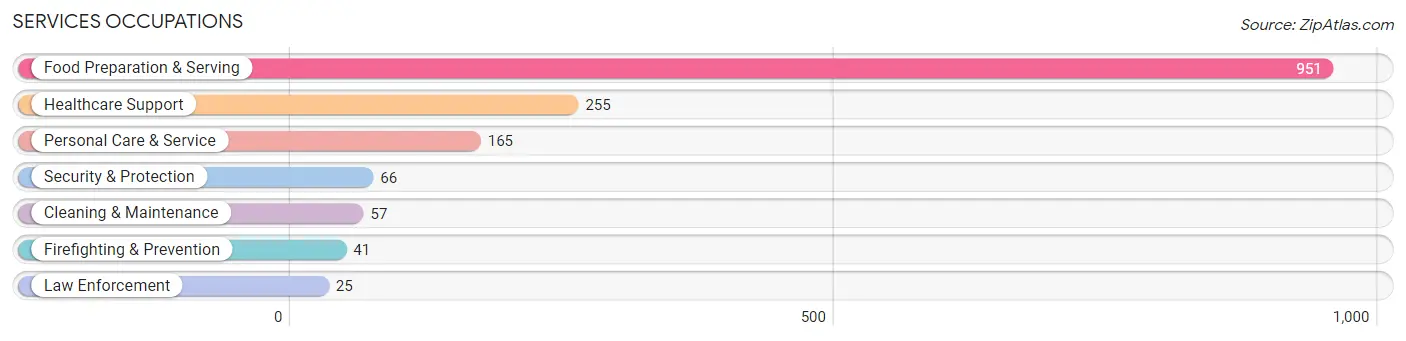
Services Occupations
The most common Services occupations in Clemson are Food Preparation & Serving (951 | 11.2%), Healthcare Support (255 | 3.0%), Personal Care & Service (165 | 1.9%), Security & Protection (66 | 0.8%), and Cleaning & Maintenance (57 | 0.7%).
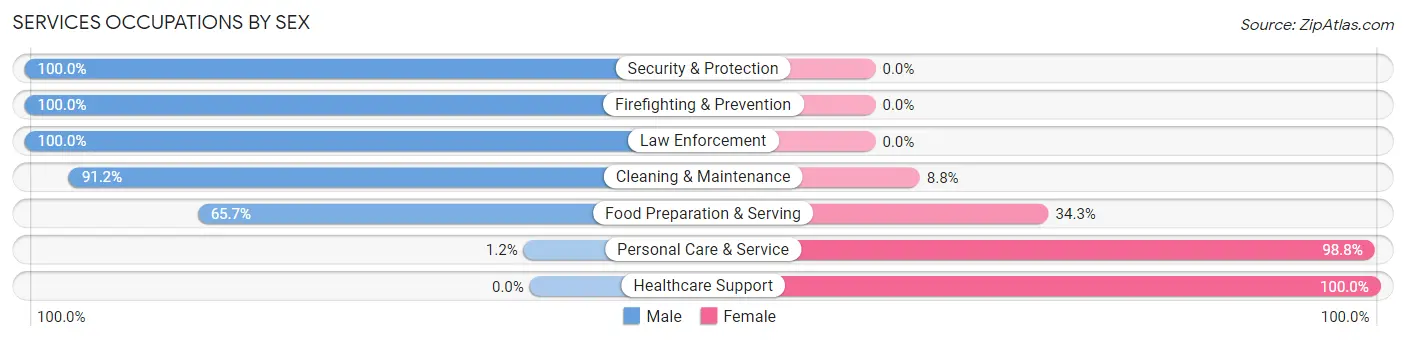
Services Occupations by Sex
Within the Services occupations in Clemson, the most male-oriented occupations are Security & Protection (100.0%), Firefighting & Prevention (100.0%), and Law Enforcement (100.0%), while the most female-oriented occupations are Healthcare Support (100.0%), Personal Care & Service (98.8%), and Food Preparation & Serving (34.3%).
| Occupation | Male | Female |
| Healthcare Support | 0 (0.0%) | 255 (100.0%) |
| Security & Protection | 66 (100.0%) | 0 (0.0%) |
| Firefighting & Prevention | 41 (100.0%) | 0 (0.0%) |
| Law Enforcement | 25 (100.0%) | 0 (0.0%) |
| Food Preparation & Serving | 625 (65.7%) | 326 (34.3%) |
| Cleaning & Maintenance | 52 (91.2%) | 5 (8.8%) |
| Personal Care & Service | 2 (1.2%) | 163 (98.8%) |
| Total (Category) | 745 (49.9%) | 749 (50.1%) |
| Total (Overall) | 4,984 (58.5%) | 3,536 (41.5%) |
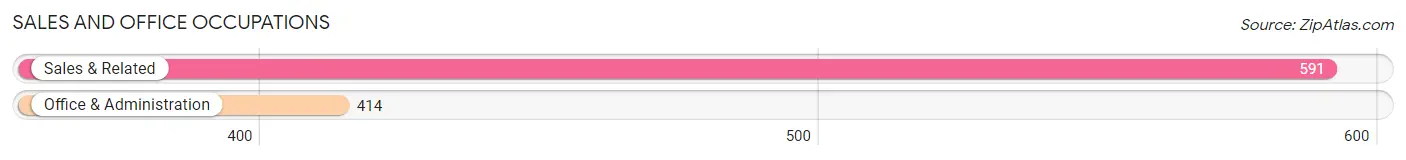
Sales and Office Occupations
The most common Sales and Office occupations in Clemson are Sales & Related (591 | 6.9%), and Office & Administration (414 | 4.9%).
Sales and Office Occupations by Sex
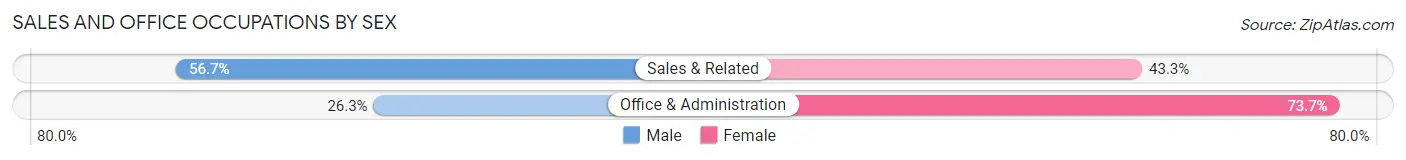
| Occupation | Male | Female |
| Sales & Related | 335 (56.7%) | 256 (43.3%) |
| Office & Administration | 109 (26.3%) | 305 (73.7%) |
| Total (Category) | 444 (44.2%) | 561 (55.8%) |
| Total (Overall) | 4,984 (58.5%) | 3,536 (41.5%) |
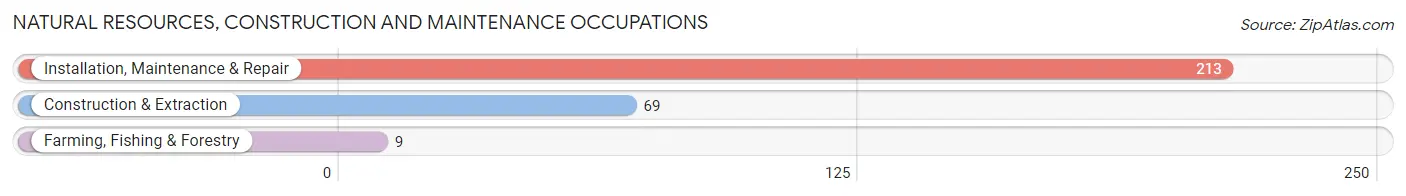
Natural Resources, Construction and Maintenance Occupations
The most common Natural Resources, Construction and Maintenance occupations in Clemson are Installation, Maintenance & Repair (213 | 2.5%), Construction & Extraction (69 | 0.8%), and Farming, Fishing & Forestry (9 | 0.1%).
Natural Resources, Construction and Maintenance Occupations by Sex
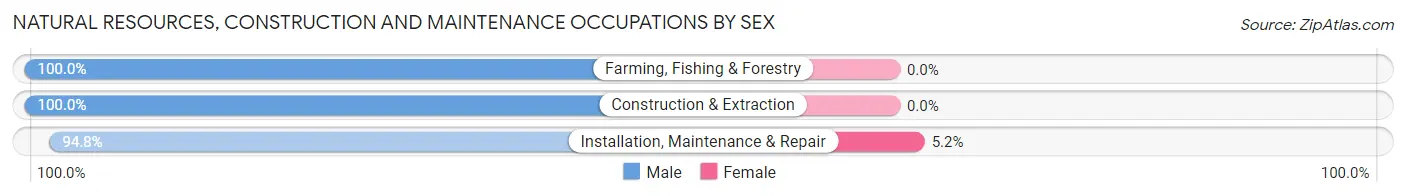
| Occupation | Male | Female |
| Farming, Fishing & Forestry | 9 (100.0%) | 0 (0.0%) |
| Construction & Extraction | 69 (100.0%) | 0 (0.0%) |
| Installation, Maintenance & Repair | 202 (94.8%) | 11 (5.2%) |
| Total (Category) | 280 (96.2%) | 11 (3.8%) |
| Total (Overall) | 4,984 (58.5%) | 3,536 (41.5%) |
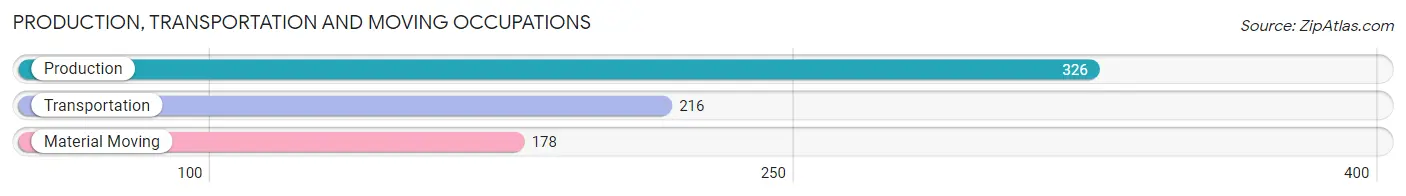
Production, Transportation and Moving Occupations
The most common Production, Transportation and Moving occupations in Clemson are Production (326 | 3.8%), Transportation (216 | 2.5%), and Material Moving (178 | 2.1%).
Production, Transportation and Moving Occupations by Sex
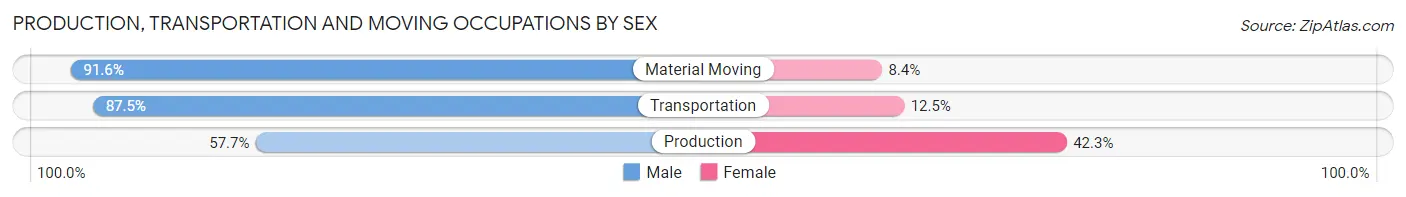
| Occupation | Male | Female |
| Production | 188 (57.7%) | 138 (42.3%) |
| Transportation | 189 (87.5%) | 27 (12.5%) |
| Material Moving | 163 (91.6%) | 15 (8.4%) |
| Total (Category) | 540 (75.0%) | 180 (25.0%) |
| Total (Overall) | 4,984 (58.5%) | 3,536 (41.5%) |
Employment Industries by Sex in Clemson
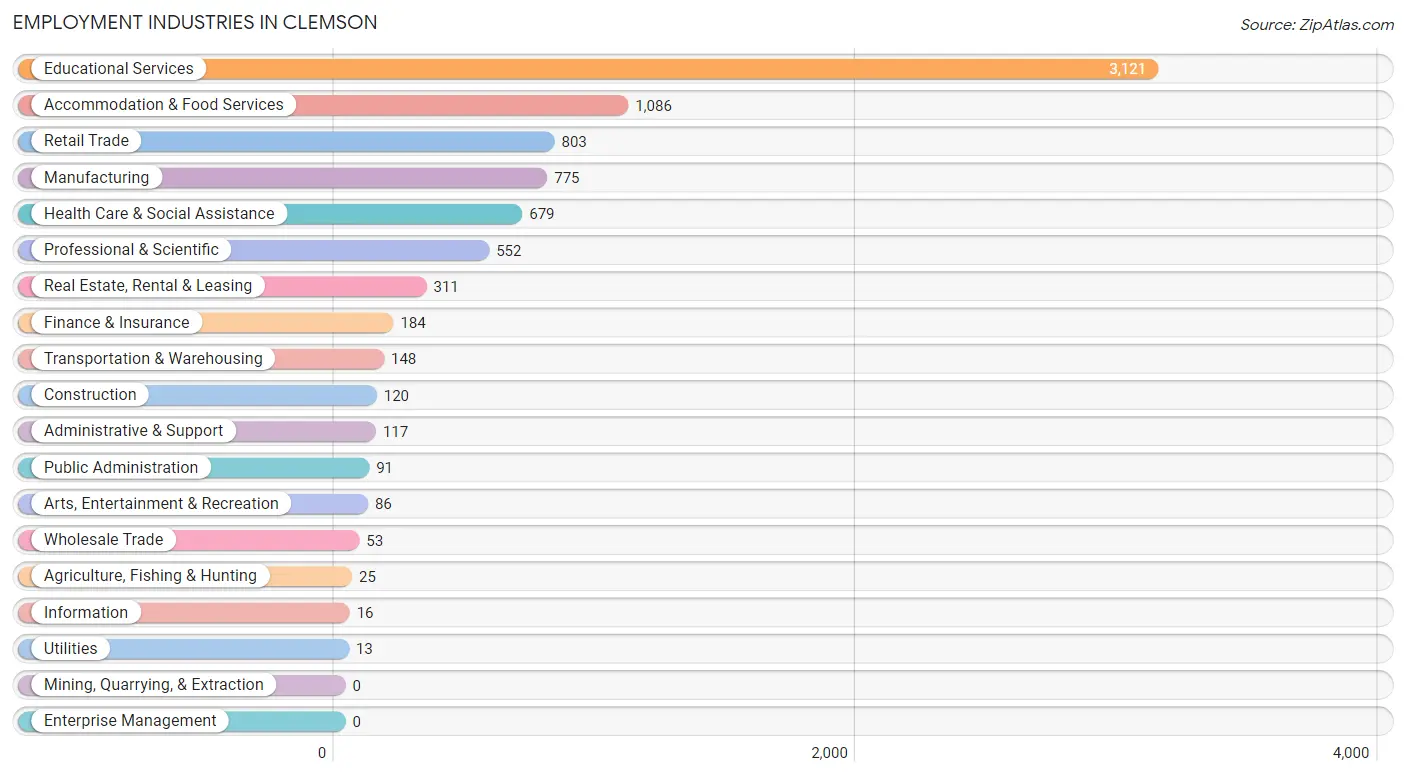
Employment Industries in Clemson
The major employment industries in Clemson include Educational Services (3,121 | 36.6%), Accommodation & Food Services (1,086 | 12.8%), Retail Trade (803 | 9.4%), Manufacturing (775 | 9.1%), and Health Care & Social Assistance (679 | 8.0%).
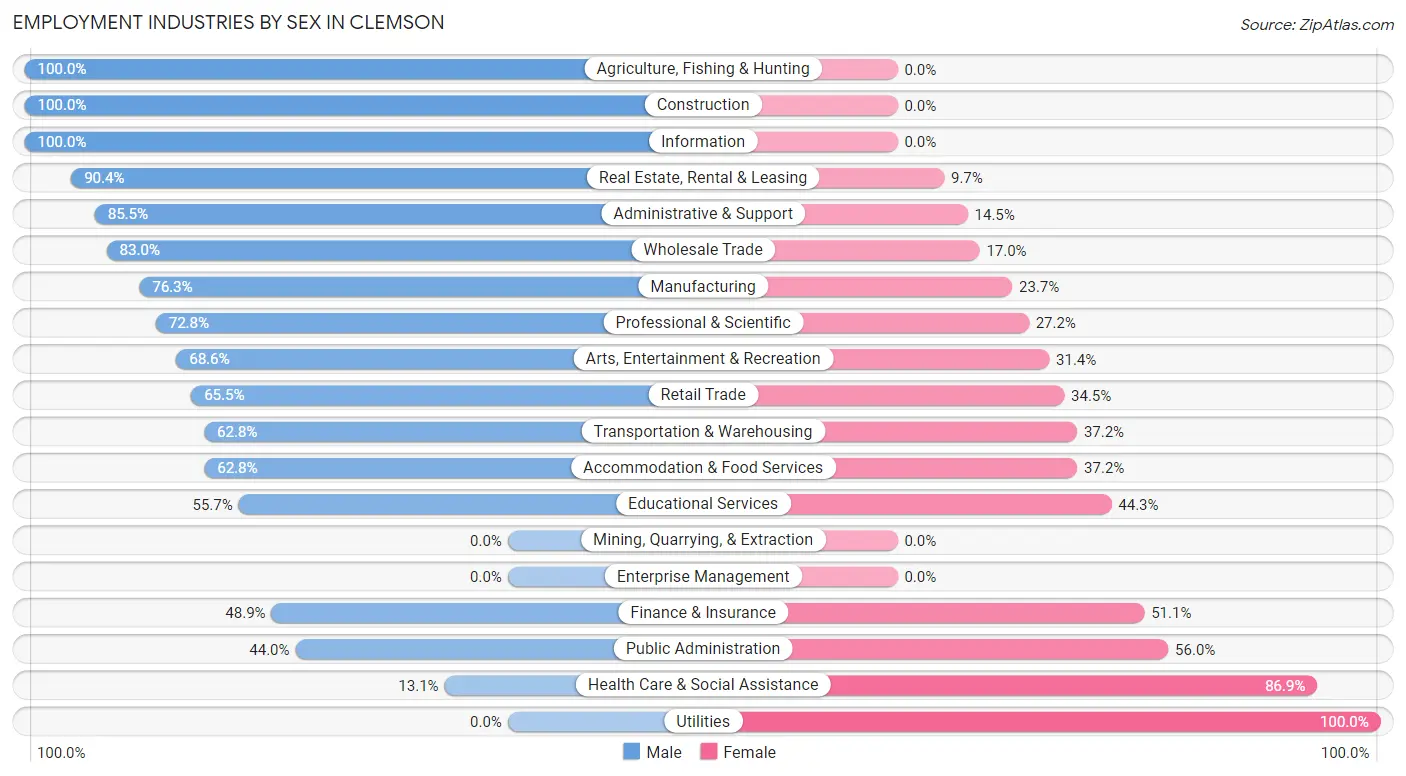
Employment Industries by Sex in Clemson
The Clemson industries that see more men than women are Agriculture, Fishing & Hunting (100.0%), Construction (100.0%), and Information (100.0%), whereas the industries that tend to have a higher number of women are Utilities (100.0%), Health Care & Social Assistance (86.9%), and Public Administration (56.0%).
| Industry | Male | Female |
| Agriculture, Fishing & Hunting | 25 (100.0%) | 0 (0.0%) |
| Mining, Quarrying, & Extraction | 0 (0.0%) | 0 (0.0%) |
| Construction | 120 (100.0%) | 0 (0.0%) |
| Manufacturing | 591 (76.3%) | 184 (23.7%) |
| Wholesale Trade | 44 (83.0%) | 9 (17.0%) |
| Retail Trade | 526 (65.5%) | 277 (34.5%) |
| Transportation & Warehousing | 93 (62.8%) | 55 (37.2%) |
| Utilities | 0 (0.0%) | 13 (100.0%) |
| Information | 16 (100.0%) | 0 (0.0%) |
| Finance & Insurance | 90 (48.9%) | 94 (51.1%) |
| Real Estate, Rental & Leasing | 281 (90.3%) | 30 (9.7%) |
| Professional & Scientific | 402 (72.8%) | 150 (27.2%) |
| Enterprise Management | 0 (0.0%) | 0 (0.0%) |
| Administrative & Support | 100 (85.5%) | 17 (14.5%) |
| Educational Services | 1,739 (55.7%) | 1,382 (44.3%) |
| Health Care & Social Assistance | 89 (13.1%) | 590 (86.9%) |
| Arts, Entertainment & Recreation | 59 (68.6%) | 27 (31.4%) |
| Accommodation & Food Services | 682 (62.8%) | 404 (37.2%) |
| Public Administration | 40 (44.0%) | 51 (56.0%) |
| Total | 4,984 (58.5%) | 3,536 (41.5%) |
Education in Clemson
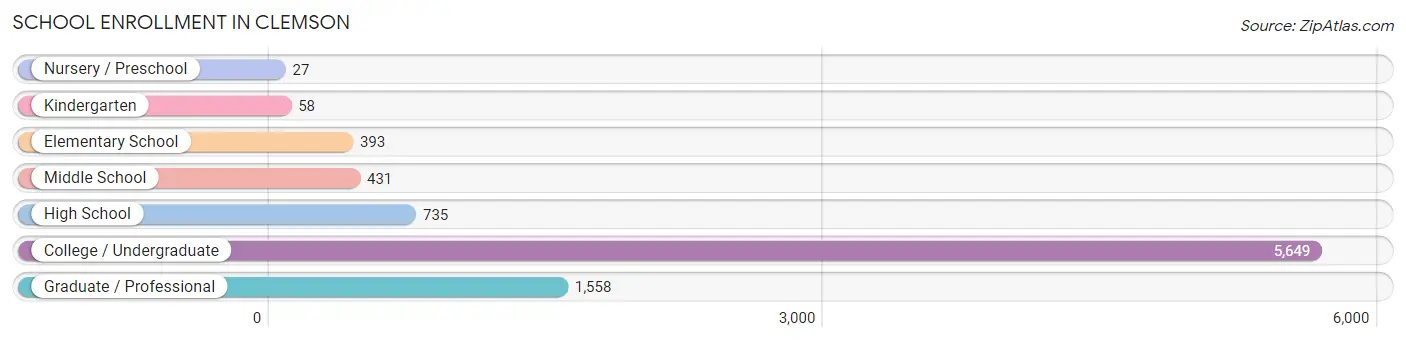
School Enrollment in Clemson
The most common levels of schooling among the 8,851 students in Clemson are college / undergraduate (5,649 | 63.8%), graduate / professional (1,558 | 17.6%), and high school (735 | 8.3%).
| School Level | # Students | % Students |
| Nursery / Preschool | 27 | 0.3% |
| Kindergarten | 58 | 0.7% |
| Elementary School | 393 | 4.4% |
| Middle School | 431 | 4.9% |
| High School | 735 | 8.3% |
| College / Undergraduate | 5,649 | 63.8% |
| Graduate / Professional | 1,558 | 17.6% |
| Total | 8,851 | 100.0% |
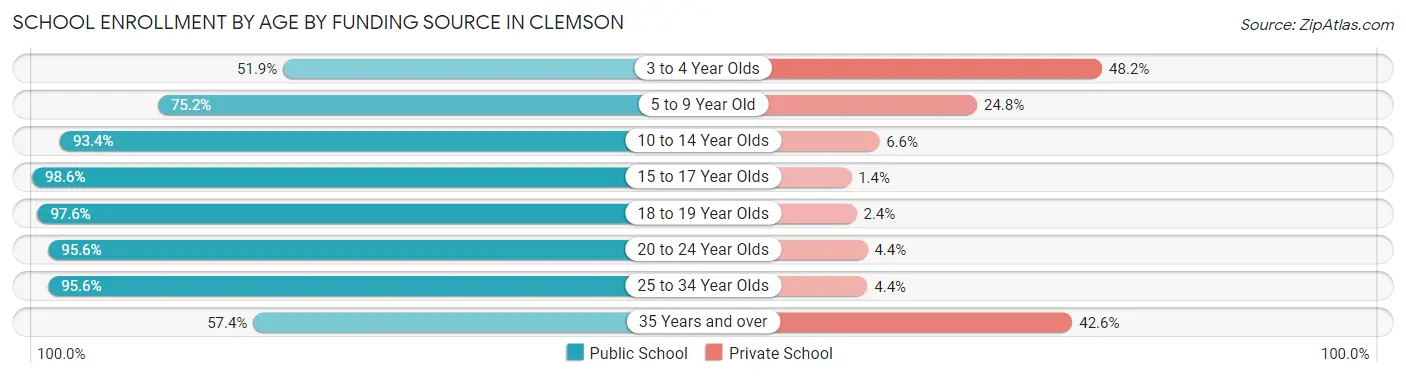
School Enrollment by Age by Funding Source in Clemson
Out of a total of 8,851 students who are enrolled in schools in Clemson, 513 (5.8%) attend a private institution, while the remaining 8,338 (94.2%) are enrolled in public schools. The age group of 3 to 4 year olds has the highest likelihood of being enrolled in private schools, with 13 (48.1% in the age bracket) enrolled. Conversely, the age group of 15 to 17 year olds has the lowest likelihood of being enrolled in a private school, with 421 (98.6% in the age bracket) attending a public institution.
| Age Bracket | Public School | Private School |
| 3 to 4 Year Olds | 14 (51.8%) | 13 (48.1%) |
| 5 to 9 Year Old | 236 (75.2%) | 78 (24.8%) |
| 10 to 14 Year Olds | 620 (93.4%) | 44 (6.6%) |
| 15 to 17 Year Olds | 421 (98.6%) | 6 (1.4%) |
| 18 to 19 Year Olds | 812 (97.6%) | 20 (2.4%) |
| 20 to 24 Year Olds | 5,324 (95.6%) | 247 (4.4%) |
| 25 to 34 Year Olds | 823 (95.6%) | 38 (4.4%) |
| 35 Years and over | 89 (57.4%) | 66 (42.6%) |
| Total | 8,338 (94.2%) | 513 (5.8%) |
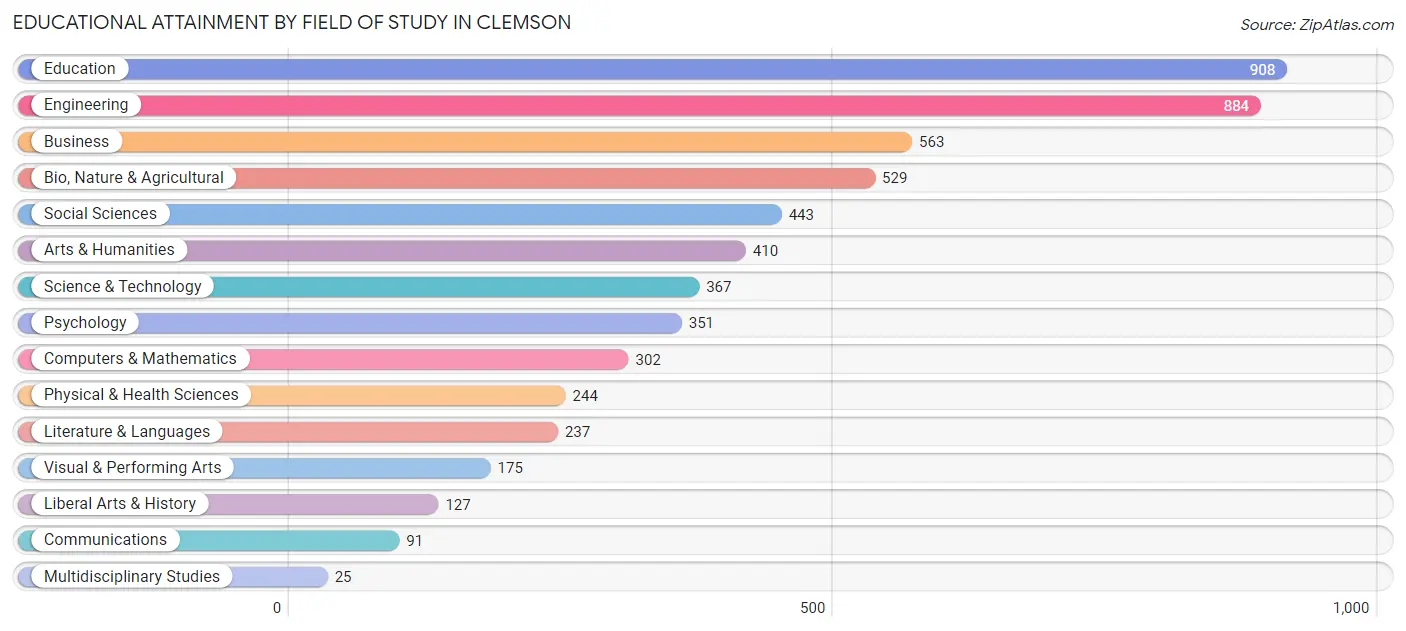
Educational Attainment by Field of Study in Clemson
Education (908 | 16.1%), engineering (884 | 15.6%), business (563 | 10.0%), bio, nature & agricultural (529 | 9.3%), and social sciences (443 | 7.8%) are the most common fields of study among 5,656 individuals in Clemson who have obtained a bachelor's degree or higher.
| Field of Study | # Graduates | % Graduates |
| Computers & Mathematics | 302 | 5.3% |
| Bio, Nature & Agricultural | 529 | 9.3% |
| Physical & Health Sciences | 244 | 4.3% |
| Psychology | 351 | 6.2% |
| Social Sciences | 443 | 7.8% |
| Engineering | 884 | 15.6% |
| Multidisciplinary Studies | 25 | 0.4% |
| Science & Technology | 367 | 6.5% |
| Business | 563 | 10.0% |
| Education | 908 | 16.1% |
| Literature & Languages | 237 | 4.2% |
| Liberal Arts & History | 127 | 2.2% |
| Visual & Performing Arts | 175 | 3.1% |
| Communications | 91 | 1.6% |
| Arts & Humanities | 410 | 7.2% |
| Total | 5,656 | 100.0% |
Transportation & Commute in Clemson
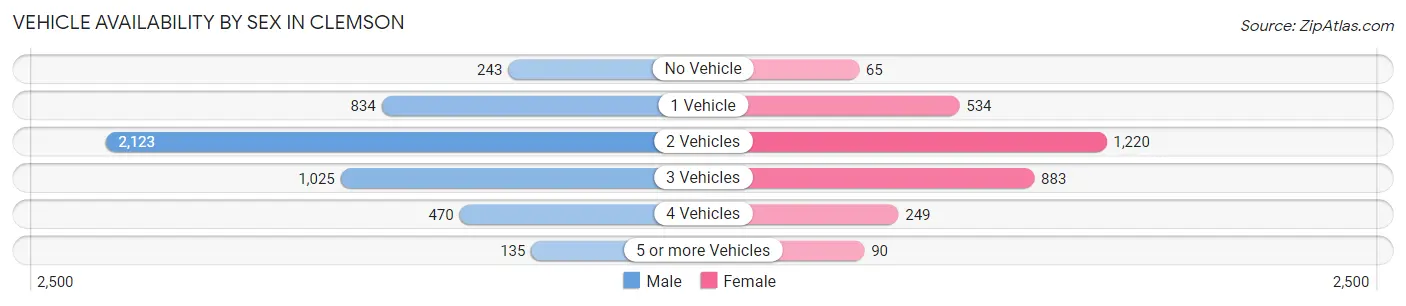
Vehicle Availability by Sex in Clemson
The most prevalent vehicle ownership categories in Clemson are males with 2 vehicles (2,123, accounting for 44.0%) and females with 2 vehicles (1,220, making up 69.8%).
| Vehicles Available | Male | Female |
| No Vehicle | 243 (5.0%) | 65 (2.1%) |
| 1 Vehicle | 834 (17.3%) | 534 (17.6%) |
| 2 Vehicles | 2,123 (44.0%) | 1,220 (40.1%) |
| 3 Vehicles | 1,025 (21.2%) | 883 (29.0%) |
| 4 Vehicles | 470 (9.7%) | 249 (8.2%) |
| 5 or more Vehicles | 135 (2.8%) | 90 (3.0%) |
| Total | 4,830 (100.0%) | 3,041 (100.0%) |
Commute Time in Clemson
The most frequently occuring commute durations in Clemson are 10 to 14 minutes (1,443 commuters, 20.4%), 15 to 19 minutes (1,387 commuters, 19.6%), and 5 to 9 minutes (1,058 commuters, 15.0%).
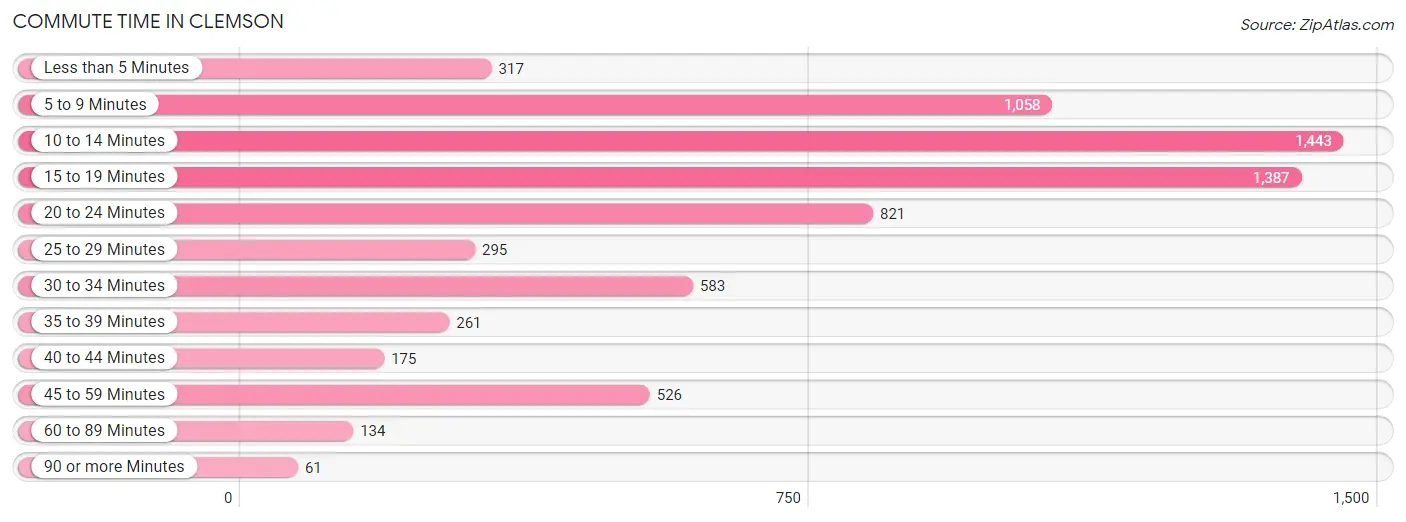
| Commute Time | # Commuters | % Commuters |
| Less than 5 Minutes | 317 | 4.5% |
| 5 to 9 Minutes | 1,058 | 15.0% |
| 10 to 14 Minutes | 1,443 | 20.4% |
| 15 to 19 Minutes | 1,387 | 19.6% |
| 20 to 24 Minutes | 821 | 11.6% |
| 25 to 29 Minutes | 295 | 4.2% |
| 30 to 34 Minutes | 583 | 8.3% |
| 35 to 39 Minutes | 261 | 3.7% |
| 40 to 44 Minutes | 175 | 2.5% |
| 45 to 59 Minutes | 526 | 7.4% |
| 60 to 89 Minutes | 134 | 1.9% |
| 90 or more Minutes | 61 | 0.9% |
Commute Time by Sex in Clemson
The most common commute times in Clemson are 15 to 19 minutes (987 commuters, 22.5%) for males and 5 to 9 minutes (660 commuters, 24.7%) for females.
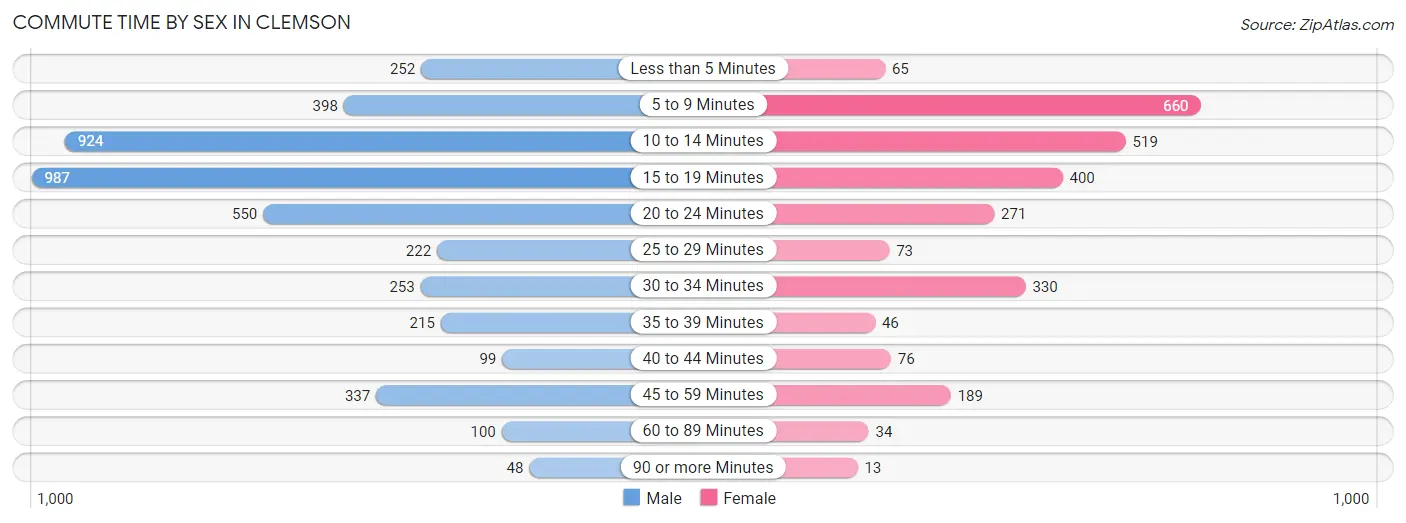
| Commute Time | Male | Female |
| Less than 5 Minutes | 252 (5.8%) | 65 (2.4%) |
| 5 to 9 Minutes | 398 (9.1%) | 660 (24.7%) |
| 10 to 14 Minutes | 924 (21.1%) | 519 (19.4%) |
| 15 to 19 Minutes | 987 (22.5%) | 400 (14.9%) |
| 20 to 24 Minutes | 550 (12.5%) | 271 (10.1%) |
| 25 to 29 Minutes | 222 (5.1%) | 73 (2.7%) |
| 30 to 34 Minutes | 253 (5.8%) | 330 (12.3%) |
| 35 to 39 Minutes | 215 (4.9%) | 46 (1.7%) |
| 40 to 44 Minutes | 99 (2.3%) | 76 (2.8%) |
| 45 to 59 Minutes | 337 (7.7%) | 189 (7.1%) |
| 60 to 89 Minutes | 100 (2.3%) | 34 (1.3%) |
| 90 or more Minutes | 48 (1.1%) | 13 (0.5%) |
Time of Departure to Work by Sex in Clemson
The most frequent times of departure to work in Clemson are 7:30 AM to 7:59 AM (982, 22.4%) for males and 8:00 AM to 8:29 AM (789, 29.5%) for females.
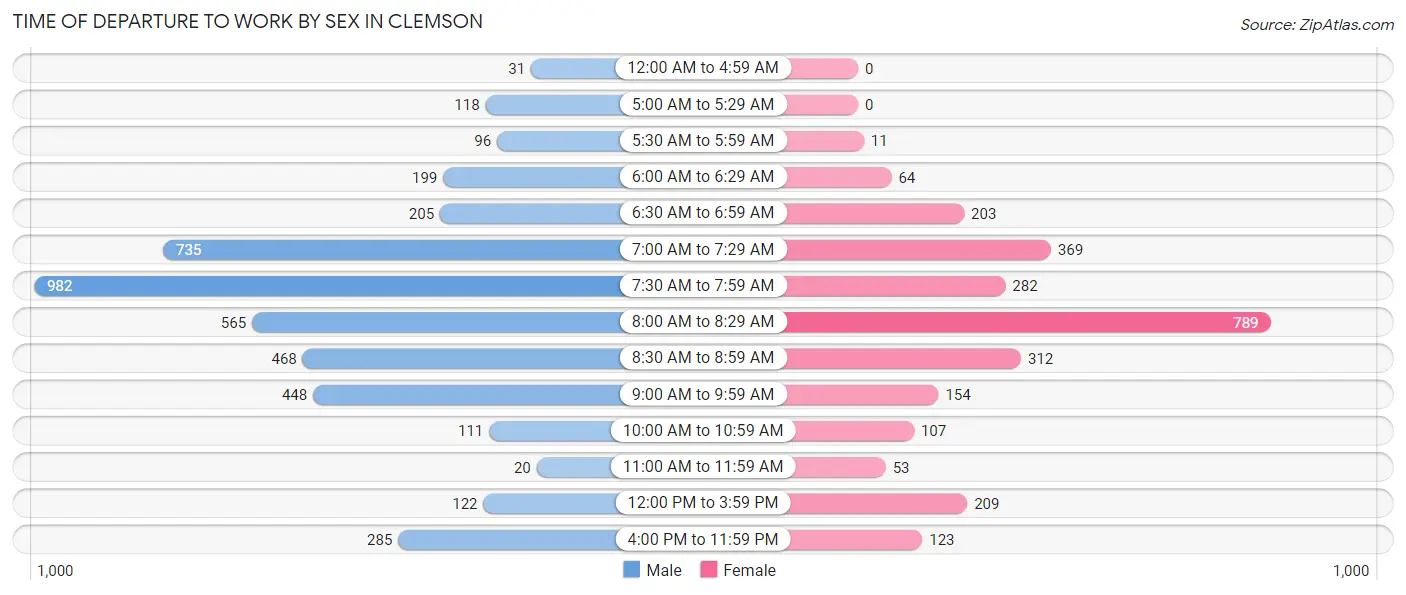
| Time of Departure | Male | Female |
| 12:00 AM to 4:59 AM | 31 (0.7%) | 0 (0.0%) |
| 5:00 AM to 5:29 AM | 118 (2.7%) | 0 (0.0%) |
| 5:30 AM to 5:59 AM | 96 (2.2%) | 11 (0.4%) |
| 6:00 AM to 6:29 AM | 199 (4.5%) | 64 (2.4%) |
| 6:30 AM to 6:59 AM | 205 (4.7%) | 203 (7.6%) |
| 7:00 AM to 7:29 AM | 735 (16.8%) | 369 (13.8%) |
| 7:30 AM to 7:59 AM | 982 (22.4%) | 282 (10.5%) |
| 8:00 AM to 8:29 AM | 565 (12.9%) | 789 (29.5%) |
| 8:30 AM to 8:59 AM | 468 (10.7%) | 312 (11.7%) |
| 9:00 AM to 9:59 AM | 448 (10.2%) | 154 (5.8%) |
| 10:00 AM to 10:59 AM | 111 (2.5%) | 107 (4.0%) |
| 11:00 AM to 11:59 AM | 20 (0.5%) | 53 (2.0%) |
| 12:00 PM to 3:59 PM | 122 (2.8%) | 209 (7.8%) |
| 4:00 PM to 11:59 PM | 285 (6.5%) | 123 (4.6%) |
| Total | 4,385 (100.0%) | 2,676 (100.0%) |
Housing Occupancy in Clemson
Occupancy by Ownership in Clemson
Of the total 7,398 dwellings in Clemson, owner-occupied units account for 2,640 (35.7%), while renter-occupied units make up 4,758 (64.3%).
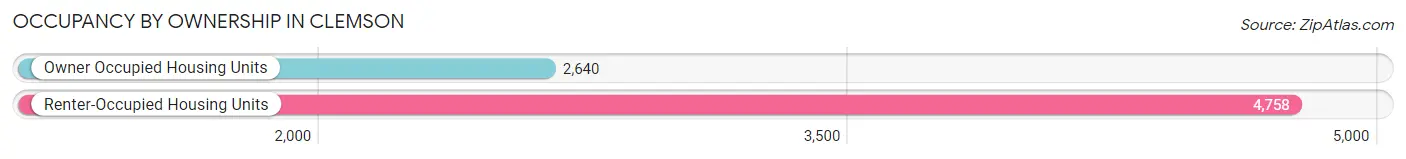
| Occupancy | # Housing Units | % Housing Units |
| Owner Occupied Housing Units | 2,640 | 35.7% |
| Renter-Occupied Housing Units | 4,758 | 64.3% |
| Total Occupied Housing Units | 7,398 | 100.0% |
Occupancy by Household Size in Clemson
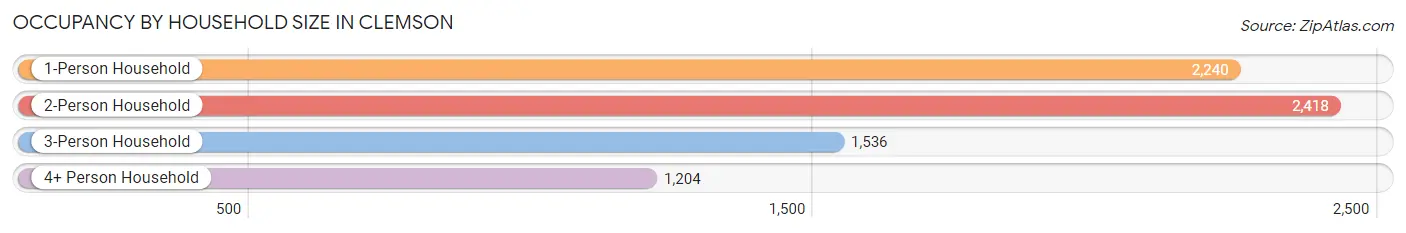
| Household Size | # Housing Units | % Housing Units |
| 1-Person Household | 2,240 | 30.3% |
| 2-Person Household | 2,418 | 32.7% |
| 3-Person Household | 1,536 | 20.8% |
| 4+ Person Household | 1,204 | 16.3% |
| Total Housing Units | 7,398 | 100.0% |
Occupancy by Ownership by Household Size in Clemson
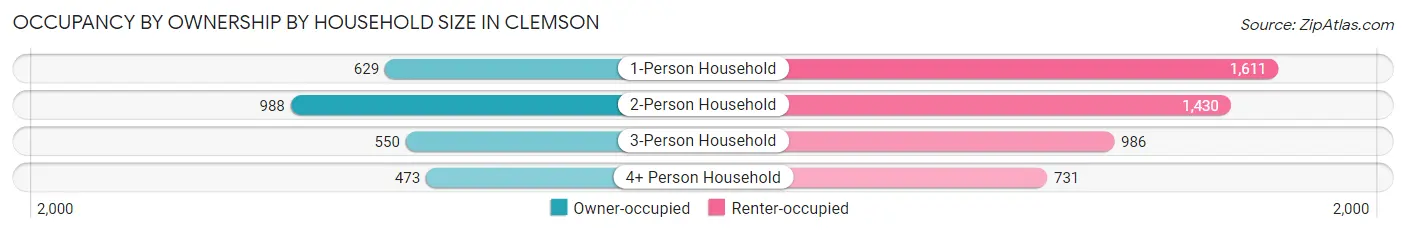
| Household Size | Owner-occupied | Renter-occupied |
| 1-Person Household | 629 (28.1%) | 1,611 (71.9%) |
| 2-Person Household | 988 (40.9%) | 1,430 (59.1%) |
| 3-Person Household | 550 (35.8%) | 986 (64.2%) |
| 4+ Person Household | 473 (39.3%) | 731 (60.7%) |
| Total Housing Units | 2,640 (35.7%) | 4,758 (64.3%) |
Occupancy by Educational Attainment in Clemson
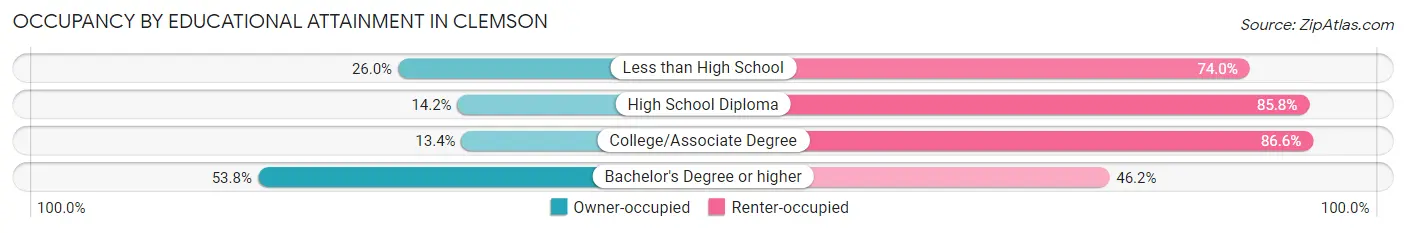
| Household Size | Owner-occupied | Renter-occupied |
| Less than High School | 53 (26.0%) | 151 (74.0%) |
| High School Diploma | 115 (14.2%) | 696 (85.8%) |
| College/Associate Degree | 319 (13.4%) | 2,061 (86.6%) |
| Bachelor's Degree or higher | 2,153 (53.8%) | 1,850 (46.2%) |
Occupancy by Age of Householder in Clemson
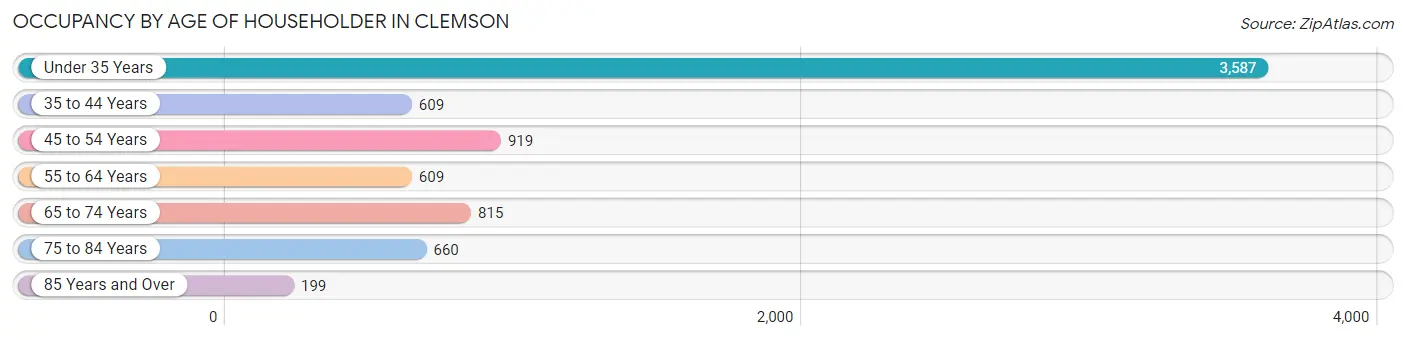
| Age Bracket | # Households | % Households |
| Under 35 Years | 3,587 | 48.5% |
| 35 to 44 Years | 609 | 8.2% |
| 45 to 54 Years | 919 | 12.4% |
| 55 to 64 Years | 609 | 8.2% |
| 65 to 74 Years | 815 | 11.0% |
| 75 to 84 Years | 660 | 8.9% |
| 85 Years and Over | 199 | 2.7% |
| Total | 7,398 | 100.0% |
Housing Finances in Clemson
Median Income by Occupancy in Clemson
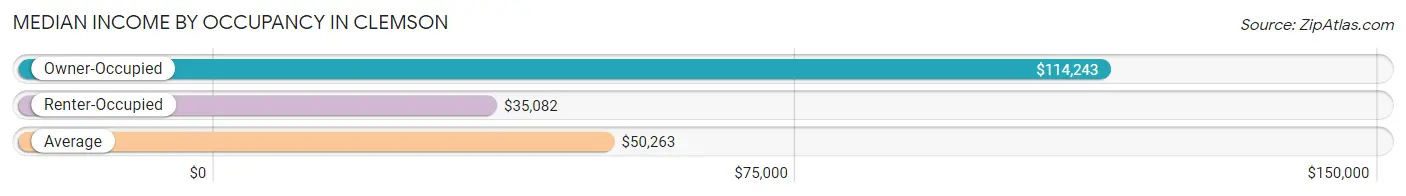
| Occupancy Type | # Households | Median Income |
| Owner-Occupied | 2,640 (35.7%) | $114,243 |
| Renter-Occupied | 4,758 (64.3%) | $35,082 |
| Average | 7,398 (100.0%) | $50,263 |
Occupancy by Householder Income Bracket in Clemson
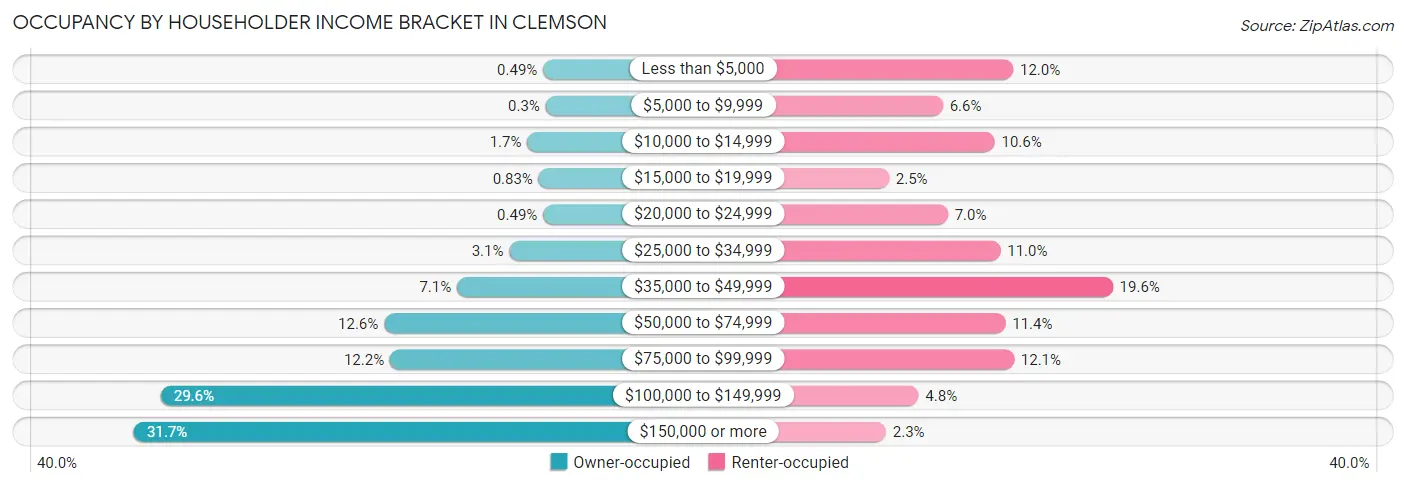
| Income Bracket | Owner-occupied | Renter-occupied |
| Less than $5,000 | 13 (0.5%) | 571 (12.0%) |
| $5,000 to $9,999 | 8 (0.3%) | 316 (6.6%) |
| $10,000 to $14,999 | 45 (1.7%) | 504 (10.6%) |
| $15,000 to $19,999 | 22 (0.8%) | 121 (2.5%) |
| $20,000 to $24,999 | 13 (0.5%) | 334 (7.0%) |
| $25,000 to $34,999 | 81 (3.1%) | 525 (11.0%) |
| $35,000 to $49,999 | 186 (7.0%) | 932 (19.6%) |
| $50,000 to $74,999 | 333 (12.6%) | 543 (11.4%) |
| $75,000 to $99,999 | 321 (12.2%) | 574 (12.1%) |
| $100,000 to $149,999 | 782 (29.6%) | 228 (4.8%) |
| $150,000 or more | 836 (31.7%) | 110 (2.3%) |
| Total | 2,640 (100.0%) | 4,758 (100.0%) |
Monthly Housing Cost Tiers in Clemson
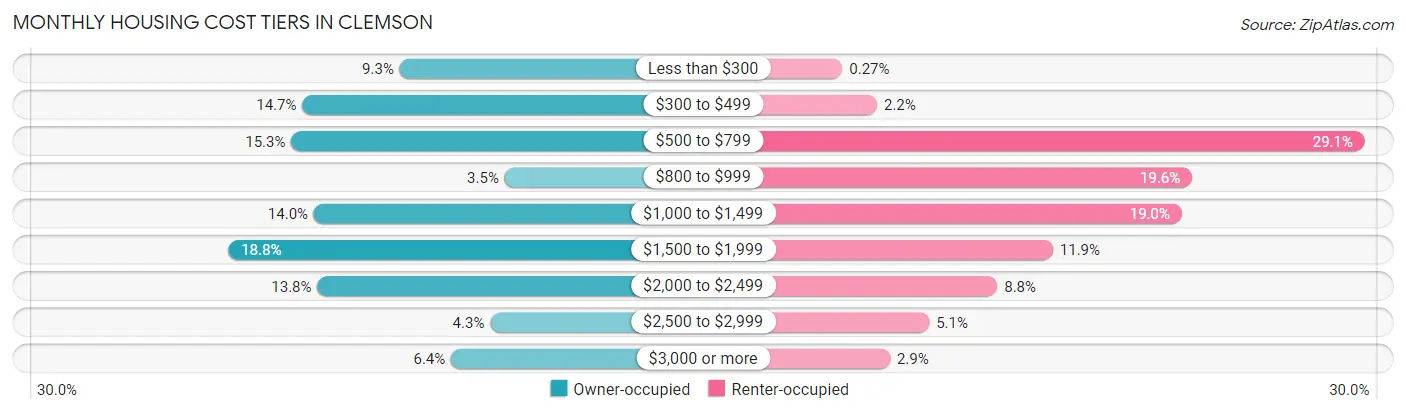
| Monthly Cost | Owner-occupied | Renter-occupied |
| Less than $300 | 245 (9.3%) | 13 (0.3%) |
| $300 to $499 | 387 (14.7%) | 104 (2.2%) |
| $500 to $799 | 403 (15.3%) | 1,386 (29.1%) |
| $800 to $999 | 92 (3.5%) | 932 (19.6%) |
| $1,000 to $1,499 | 370 (14.0%) | 905 (19.0%) |
| $1,500 to $1,999 | 495 (18.8%) | 566 (11.9%) |
| $2,000 to $2,499 | 365 (13.8%) | 420 (8.8%) |
| $2,500 to $2,999 | 113 (4.3%) | 241 (5.1%) |
| $3,000 or more | 170 (6.4%) | 138 (2.9%) |
| Total | 2,640 (100.0%) | 4,758 (100.0%) |
Physical Housing Characteristics in Clemson
Housing Structures in Clemson
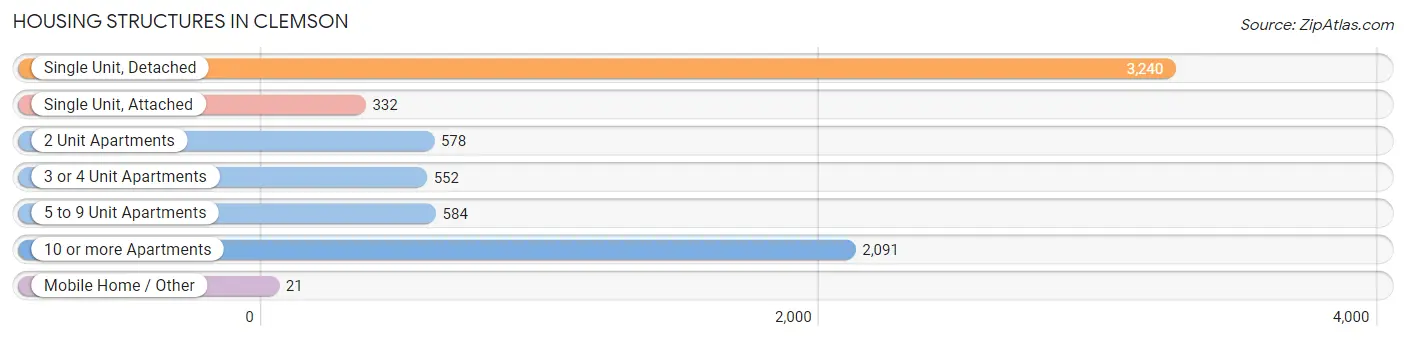
| Structure Type | # Housing Units | % Housing Units |
| Single Unit, Detached | 3,240 | 43.8% |
| Single Unit, Attached | 332 | 4.5% |
| 2 Unit Apartments | 578 | 7.8% |
| 3 or 4 Unit Apartments | 552 | 7.5% |
| 5 to 9 Unit Apartments | 584 | 7.9% |
| 10 or more Apartments | 2,091 | 28.3% |
| Mobile Home / Other | 21 | 0.3% |
| Total | 7,398 | 100.0% |
Housing Structures by Occupancy in Clemson
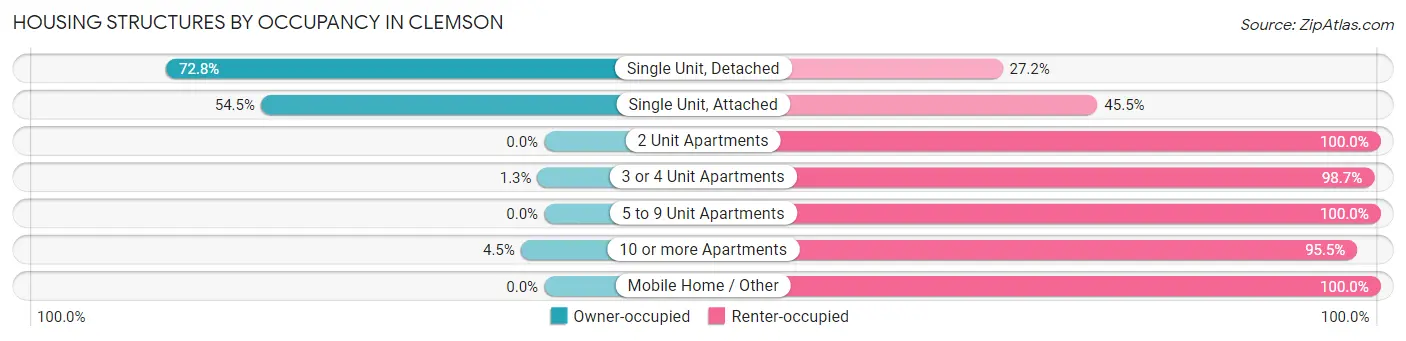
| Structure Type | Owner-occupied | Renter-occupied |
| Single Unit, Detached | 2,358 (72.8%) | 882 (27.2%) |
| Single Unit, Attached | 181 (54.5%) | 151 (45.5%) |
| 2 Unit Apartments | 0 (0.0%) | 578 (100.0%) |
| 3 or 4 Unit Apartments | 7 (1.3%) | 545 (98.7%) |
| 5 to 9 Unit Apartments | 0 (0.0%) | 584 (100.0%) |
| 10 or more Apartments | 94 (4.5%) | 1,997 (95.5%) |
| Mobile Home / Other | 0 (0.0%) | 21 (100.0%) |
| Total | 2,640 (35.7%) | 4,758 (64.3%) |
Housing Structures by Number of Rooms in Clemson
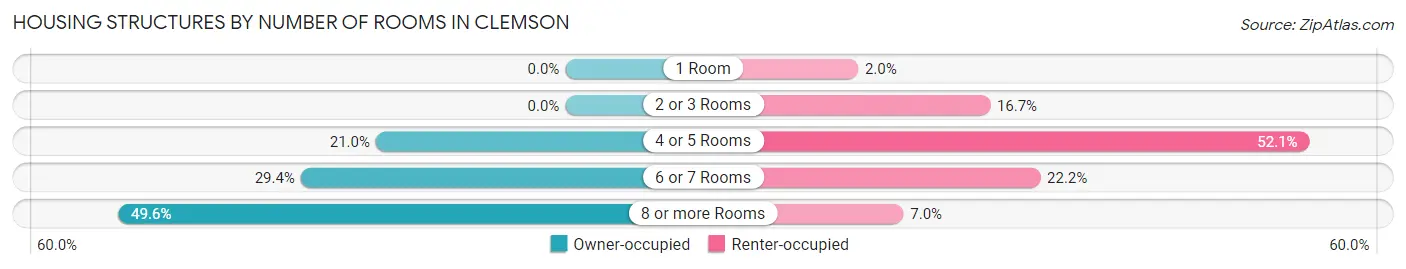
| Number of Rooms | Owner-occupied | Renter-occupied |
| 1 Room | 0 (0.0%) | 95 (2.0%) |
| 2 or 3 Rooms | 0 (0.0%) | 792 (16.7%) |
| 4 or 5 Rooms | 555 (21.0%) | 2,479 (52.1%) |
| 6 or 7 Rooms | 775 (29.4%) | 1,057 (22.2%) |
| 8 or more Rooms | 1,310 (49.6%) | 335 (7.0%) |
| Total | 2,640 (100.0%) | 4,758 (100.0%) |
Housing Structure by Heating Type in Clemson
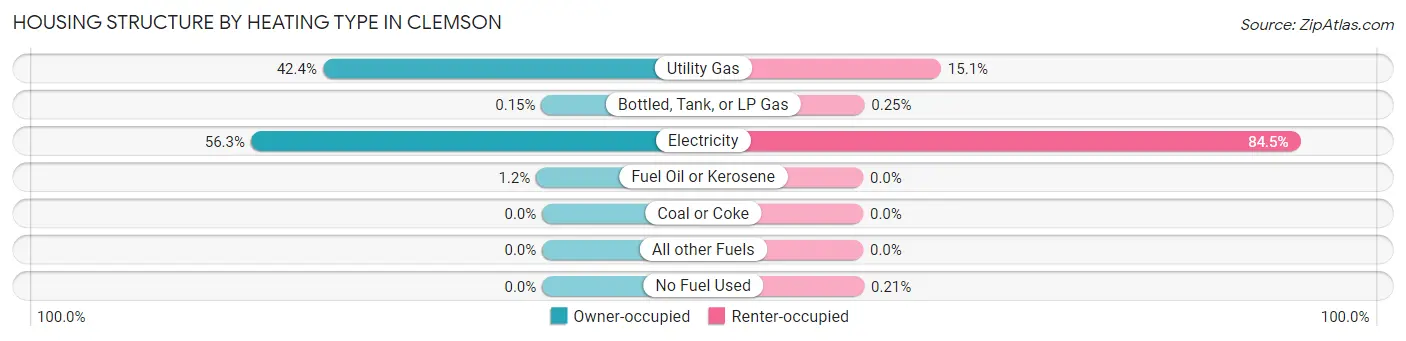
| Heating Type | Owner-occupied | Renter-occupied |
| Utility Gas | 1,119 (42.4%) | 716 (15.0%) |
| Bottled, Tank, or LP Gas | 4 (0.2%) | 12 (0.3%) |
| Electricity | 1,486 (56.3%) | 4,020 (84.5%) |
| Fuel Oil or Kerosene | 31 (1.2%) | 0 (0.0%) |
| Coal or Coke | 0 (0.0%) | 0 (0.0%) |
| All other Fuels | 0 (0.0%) | 0 (0.0%) |
| No Fuel Used | 0 (0.0%) | 10 (0.2%) |
| Total | 2,640 (100.0%) | 4,758 (100.0%) |
Household Vehicle Usage in Clemson
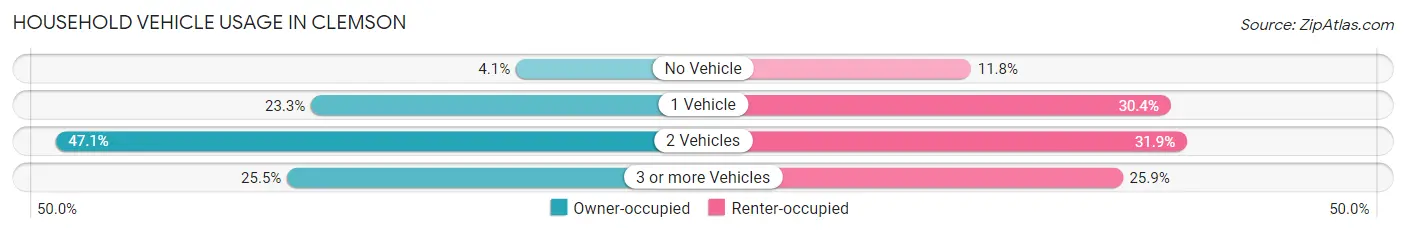
| Vehicles per Household | Owner-occupied | Renter-occupied |
| No Vehicle | 109 (4.1%) | 559 (11.7%) |
| 1 Vehicle | 614 (23.3%) | 1,447 (30.4%) |
| 2 Vehicles | 1,244 (47.1%) | 1,519 (31.9%) |
| 3 or more Vehicles | 673 (25.5%) | 1,233 (25.9%) |
| Total | 2,640 (100.0%) | 4,758 (100.0%) |
Real Estate & Mortgages in Clemson
Real Estate and Mortgage Overview in Clemson
| Characteristic | Without Mortgage | With Mortgage |
| Housing Units | 1,113 | 1,527 |
| Median Property Value | $323,100 | $356,300 |
| Median Household Income | $109,732 | $467 |
| Monthly Housing Costs | $461 | $170 |
| Real Estate Taxes | $1,763 | $20 |
Property Value by Mortgage Status in Clemson
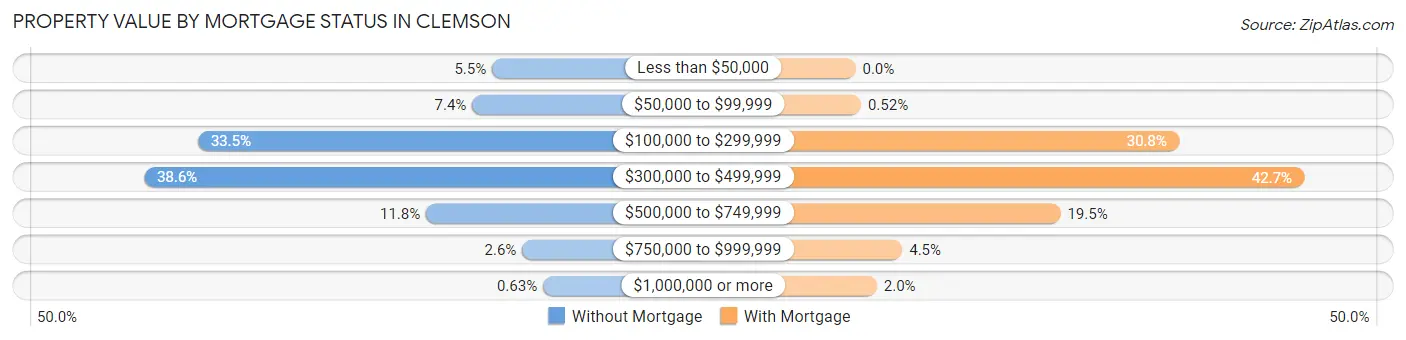
| Property Value | Without Mortgage | With Mortgage |
| Less than $50,000 | 61 (5.5%) | 0 (0.0%) |
| $50,000 to $99,999 | 82 (7.4%) | 8 (0.5%) |
| $100,000 to $299,999 | 373 (33.5%) | 470 (30.8%) |
| $300,000 to $499,999 | 430 (38.6%) | 652 (42.7%) |
| $500,000 to $749,999 | 131 (11.8%) | 298 (19.5%) |
| $750,000 to $999,999 | 29 (2.6%) | 68 (4.4%) |
| $1,000,000 or more | 7 (0.6%) | 31 (2.0%) |
| Total | 1,113 (100.0%) | 1,527 (100.0%) |
Household Income by Mortgage Status in Clemson
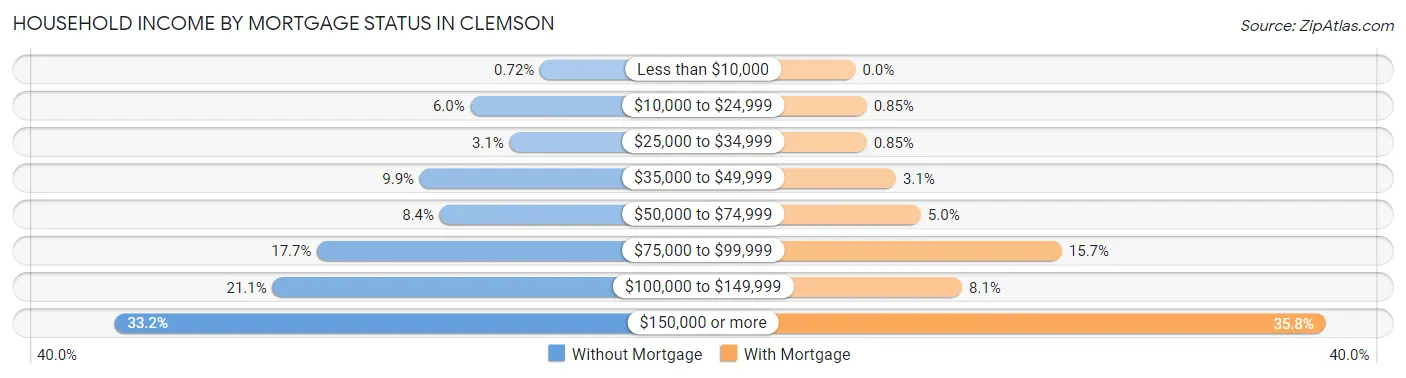
| Household Income | Without Mortgage | With Mortgage |
| Less than $10,000 | 8 (0.7%) | 0 (0.0%) |
| $10,000 to $24,999 | 67 (6.0%) | 13 (0.9%) |
| $25,000 to $34,999 | 34 (3.0%) | 13 (0.9%) |
| $35,000 to $49,999 | 110 (9.9%) | 47 (3.1%) |
| $50,000 to $74,999 | 93 (8.4%) | 76 (5.0%) |
| $75,000 to $99,999 | 197 (17.7%) | 240 (15.7%) |
| $100,000 to $149,999 | 235 (21.1%) | 124 (8.1%) |
| $150,000 or more | 369 (33.2%) | 547 (35.8%) |
| Total | 1,113 (100.0%) | 1,527 (100.0%) |
Property Value to Household Income Ratio in Clemson
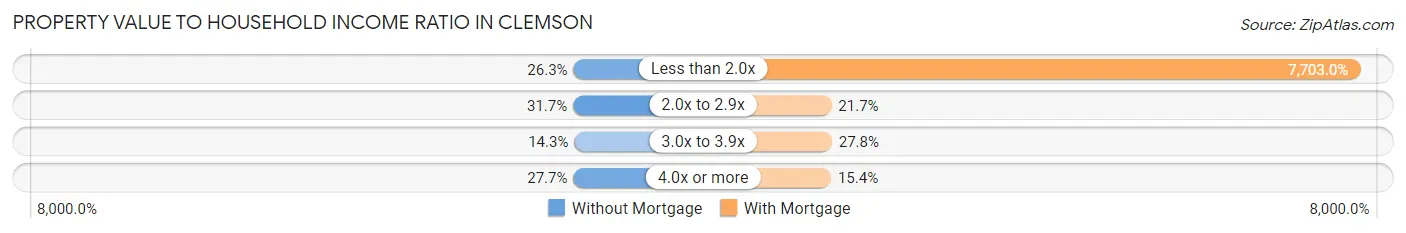
| Value-to-Income Ratio | Without Mortgage | With Mortgage |
| Less than 2.0x | 293 (26.3%) | 117,625 (7,703.0%) |
| 2.0x to 2.9x | 353 (31.7%) | 331 (21.7%) |
| 3.0x to 3.9x | 159 (14.3%) | 424 (27.8%) |
| 4.0x or more | 308 (27.7%) | 235 (15.4%) |
| Total | 1,113 (100.0%) | 1,527 (100.0%) |
Real Estate Taxes by Mortgage Status in Clemson
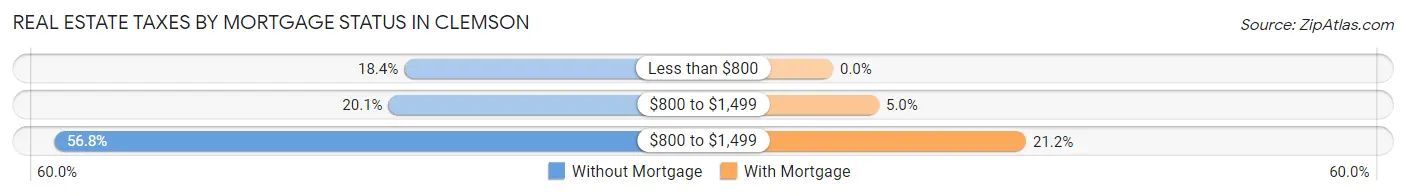
| Property Taxes | Without Mortgage | With Mortgage |
| Less than $800 | 205 (18.4%) | 0 (0.0%) |
| $800 to $1,499 | 224 (20.1%) | 77 (5.0%) |
| $800 to $1,499 | 632 (56.8%) | 323 (21.1%) |
| Total | 1,113 (100.0%) | 1,527 (100.0%) |
Health & Disability in Clemson
Health Insurance Coverage by Age in Clemson
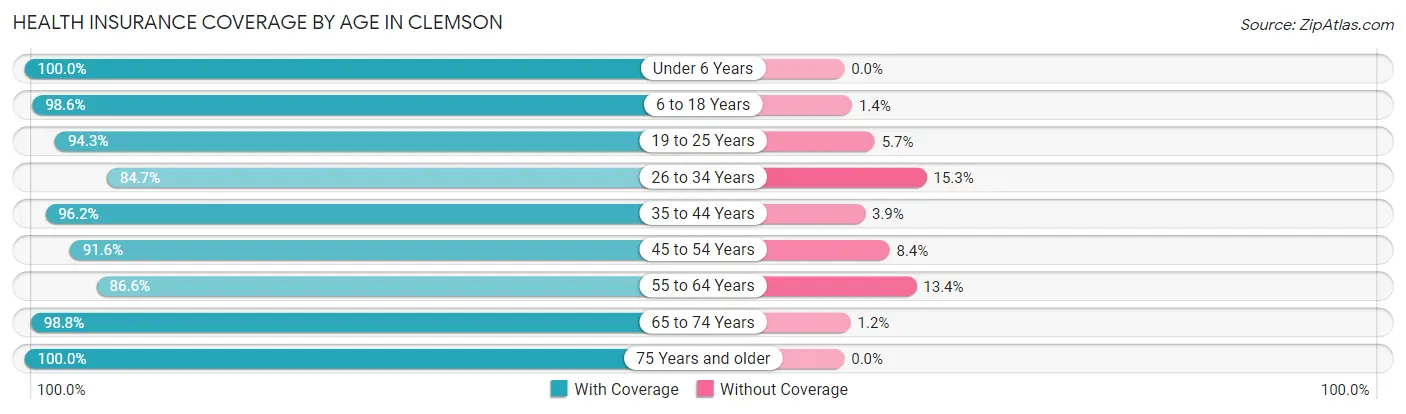
| Age Bracket | With Coverage | Without Coverage |
| Under 6 Years | 147 (100.0%) | 0 (0.0%) |
| 6 to 18 Years | 1,588 (98.6%) | 23 (1.4%) |
| 19 to 25 Years | 7,607 (94.3%) | 457 (5.7%) |
| 26 to 34 Years | 1,287 (84.7%) | 233 (15.3%) |
| 35 to 44 Years | 1,023 (96.2%) | 41 (3.8%) |
| 45 to 54 Years | 1,519 (91.6%) | 140 (8.4%) |
| 55 to 64 Years | 940 (86.6%) | 146 (13.4%) |
| 65 to 74 Years | 1,173 (98.8%) | 14 (1.2%) |
| 75 Years and older | 1,156 (100.0%) | 0 (0.0%) |
| Total | 16,440 (94.0%) | 1,054 (6.0%) |
Health Insurance Coverage by Citizenship Status in Clemson
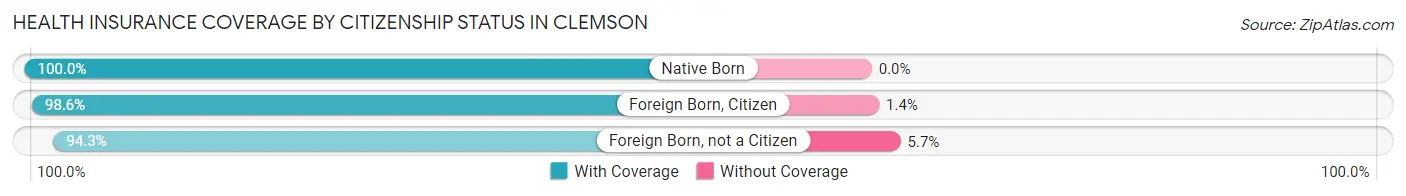
| Citizenship Status | With Coverage | Without Coverage |
| Native Born | 147 (100.0%) | 0 (0.0%) |
| Foreign Born, Citizen | 1,588 (98.6%) | 23 (1.4%) |
| Foreign Born, not a Citizen | 7,607 (94.3%) | 457 (5.7%) |
Health Insurance Coverage by Household Income in Clemson
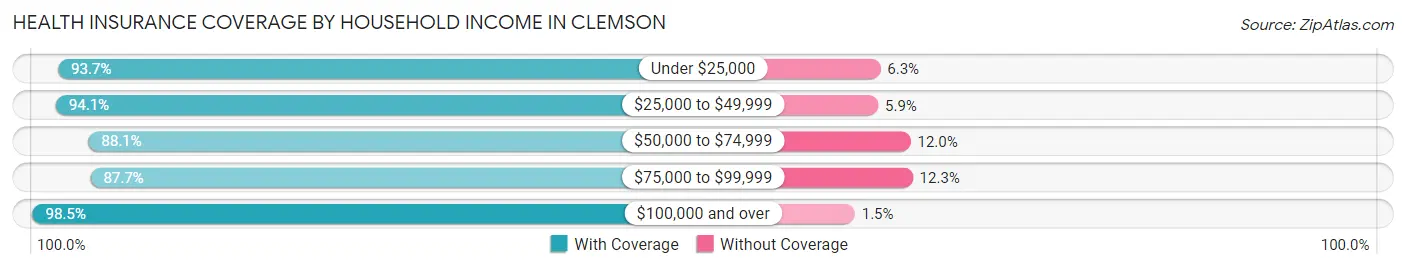
| Household Income | With Coverage | Without Coverage |
| Under $25,000 | 4,163 (93.7%) | 279 (6.3%) |
| $25,000 to $49,999 | 3,397 (94.1%) | 212 (5.9%) |
| $50,000 to $74,999 | 1,710 (88.0%) | 232 (11.9%) |
| $75,000 to $99,999 | 1,762 (87.7%) | 248 (12.3%) |
| $100,000 and over | 5,328 (98.5%) | 81 (1.5%) |
Public vs Private Health Insurance Coverage by Age in Clemson
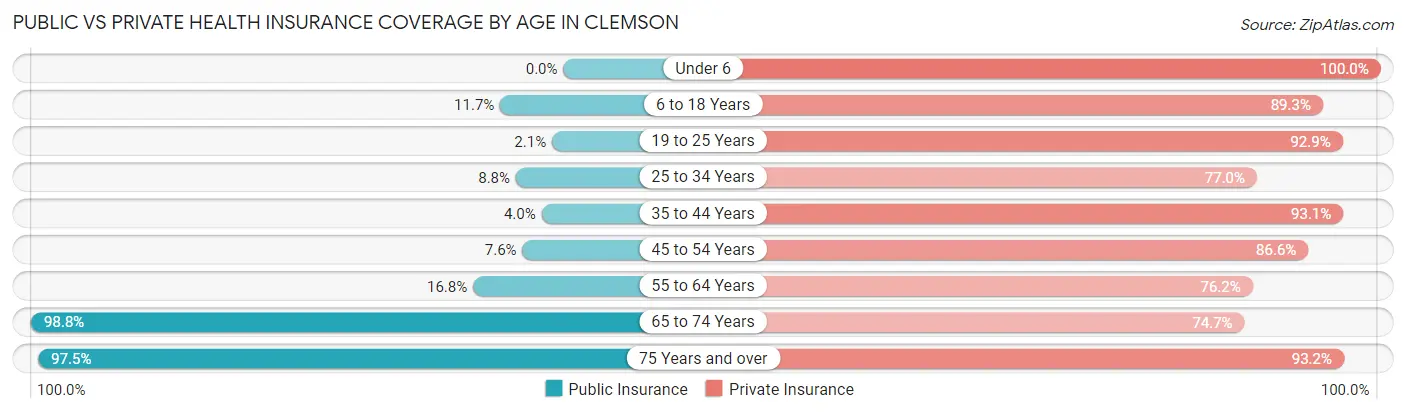
| Age Bracket | Public Insurance | Private Insurance |
| Under 6 | 0 (0.0%) | 147 (100.0%) |
| 6 to 18 Years | 189 (11.7%) | 1,438 (89.3%) |
| 19 to 25 Years | 170 (2.1%) | 7,494 (92.9%) |
| 25 to 34 Years | 134 (8.8%) | 1,171 (77.0%) |
| 35 to 44 Years | 43 (4.0%) | 990 (93.0%) |
| 45 to 54 Years | 126 (7.6%) | 1,436 (86.6%) |
| 55 to 64 Years | 182 (16.8%) | 828 (76.2%) |
| 65 to 74 Years | 1,173 (98.8%) | 887 (74.7%) |
| 75 Years and over | 1,127 (97.5%) | 1,077 (93.2%) |
| Total | 3,144 (18.0%) | 15,468 (88.4%) |
Disability Status by Sex by Age in Clemson
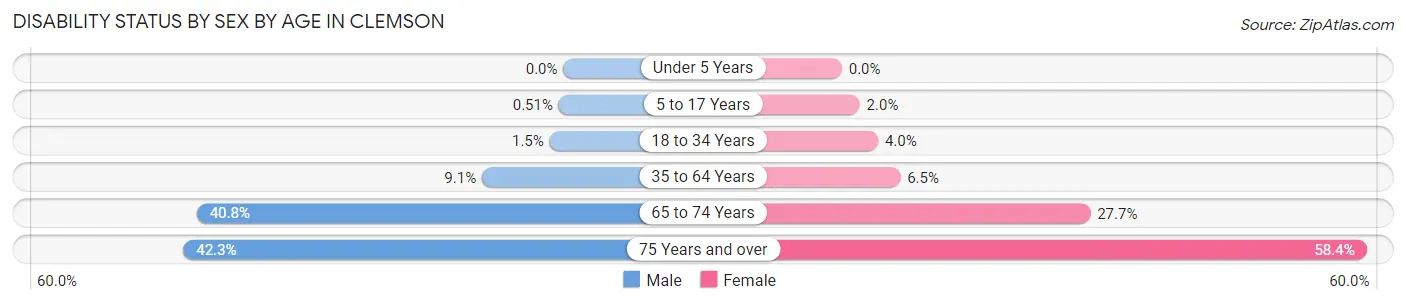
| Age Bracket | Male | Female |
| Under 5 Years | 0 (0.0%) | 0 (0.0%) |
| 5 to 17 Years | 5 (0.5%) | 10 (2.0%) |
| 18 to 34 Years | 96 (1.5%) | 138 (4.0%) |
| 35 to 64 Years | 181 (9.1%) | 118 (6.5%) |
| 65 to 74 Years | 225 (40.8%) | 176 (27.7%) |
| 75 Years and over | 193 (42.3%) | 409 (58.4%) |
Disability Class by Sex by Age in Clemson
Disability Class: Hearing Difficulty
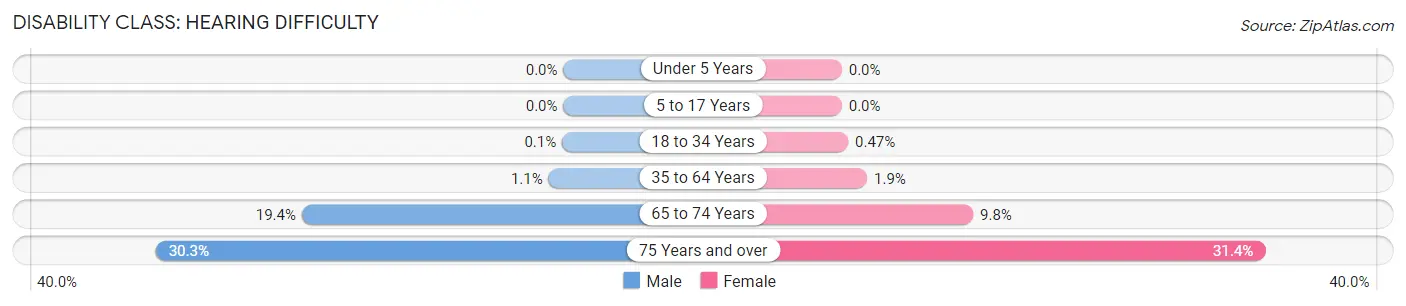
| Age Bracket | Male | Female |
| Under 5 Years | 0 (0.0%) | 0 (0.0%) |
| 5 to 17 Years | 0 (0.0%) | 0 (0.0%) |
| 18 to 34 Years | 6 (0.1%) | 16 (0.5%) |
| 35 to 64 Years | 22 (1.1%) | 34 (1.9%) |
| 65 to 74 Years | 107 (19.4%) | 62 (9.8%) |
| 75 Years and over | 138 (30.3%) | 220 (31.4%) |
Disability Class: Vision Difficulty
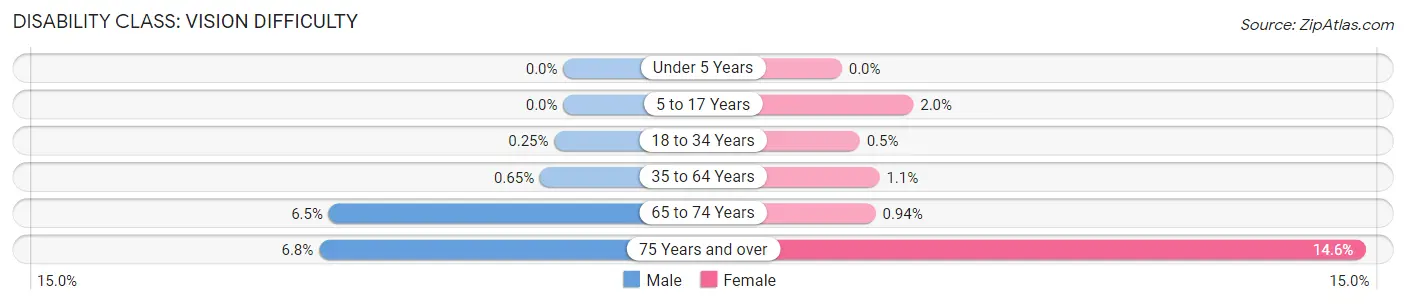
| Age Bracket | Male | Female |
| Under 5 Years | 0 (0.0%) | 0 (0.0%) |
| 5 to 17 Years | 0 (0.0%) | 10 (2.0%) |
| 18 to 34 Years | 16 (0.3%) | 17 (0.5%) |
| 35 to 64 Years | 13 (0.6%) | 19 (1.1%) |
| 65 to 74 Years | 36 (6.5%) | 6 (0.9%) |
| 75 Years and over | 31 (6.8%) | 102 (14.6%) |
Disability Class: Cognitive Difficulty
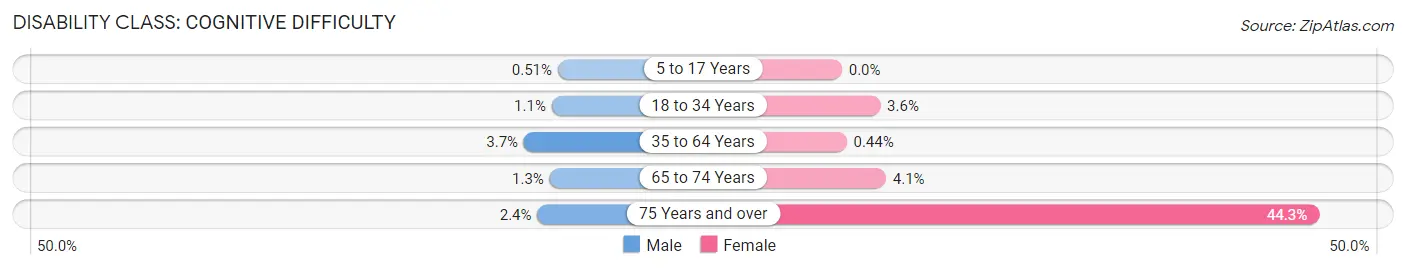
| Age Bracket | Male | Female |
| 5 to 17 Years | 5 (0.5%) | 0 (0.0%) |
| 18 to 34 Years | 68 (1.1%) | 122 (3.6%) |
| 35 to 64 Years | 73 (3.7%) | 8 (0.4%) |
| 65 to 74 Years | 7 (1.3%) | 26 (4.1%) |
| 75 Years and over | 11 (2.4%) | 310 (44.3%) |
Disability Class: Ambulatory Difficulty
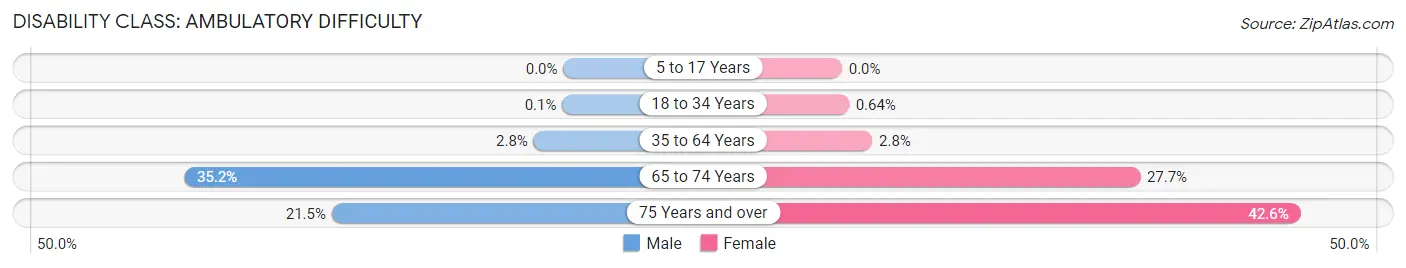
| Age Bracket | Male | Female |
| 5 to 17 Years | 0 (0.0%) | 0 (0.0%) |
| 18 to 34 Years | 6 (0.1%) | 22 (0.6%) |
| 35 to 64 Years | 55 (2.8%) | 51 (2.8%) |
| 65 to 74 Years | 194 (35.2%) | 176 (27.7%) |
| 75 Years and over | 98 (21.5%) | 298 (42.6%) |
Disability Class: Self-Care Difficulty
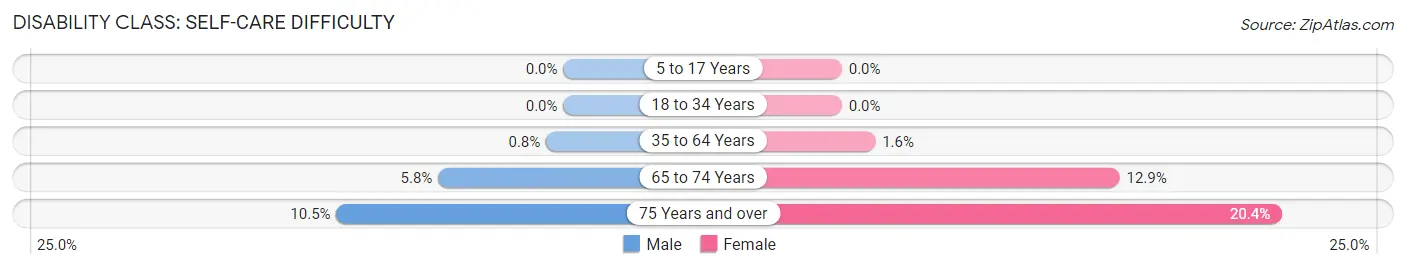
| Age Bracket | Male | Female |
| 5 to 17 Years | 0 (0.0%) | 0 (0.0%) |
| 18 to 34 Years | 0 (0.0%) | 0 (0.0%) |
| 35 to 64 Years | 16 (0.8%) | 28 (1.5%) |
| 65 to 74 Years | 32 (5.8%) | 82 (12.9%) |
| 75 Years and over | 48 (10.5%) | 143 (20.4%) |
Technology Access in Clemson
Computing Device Access in Clemson
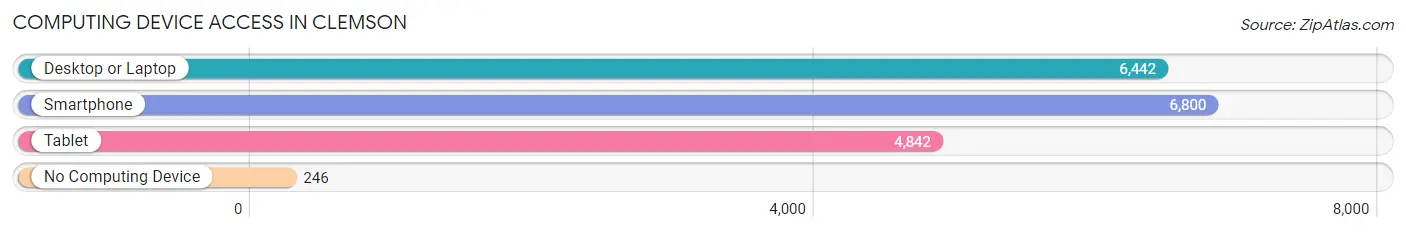
| Device Type | # Households | % Households |
| Desktop or Laptop | 6,442 | 87.1% |
| Smartphone | 6,800 | 91.9% |
| Tablet | 4,842 | 65.4% |
| No Computing Device | 246 | 3.3% |
| Total | 7,398 | 100.0% |
Internet Access in Clemson
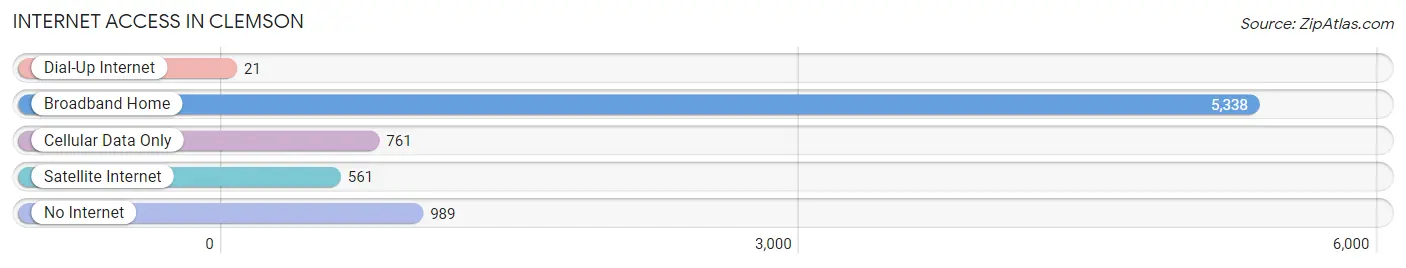
| Internet Type | # Households | % Households |
| Dial-Up Internet | 21 | 0.3% |
| Broadband Home | 5,338 | 72.2% |
| Cellular Data Only | 761 | 10.3% |
| Satellite Internet | 561 | 7.6% |
| No Internet | 989 | 13.4% |
| Total | 7,398 | 100.0% |
Clemson Summary
Clemson, South Carolina is a small city located in the foothills of the Blue Ridge Mountains in the northwest corner of the state. It is the home of Clemson University, one of the top public universities in the United States. The city has a population of approximately 15,000 people and is located in Pickens County.
Geography
Clemson is located in the foothills of the Blue Ridge Mountains in the northwest corner of South Carolina. The city is situated on the banks of Lake Hartwell, a large reservoir created by the Hartwell Dam on the Savannah River. The city is surrounded by rolling hills and forests, and is located about halfway between Atlanta, Georgia and Charlotte, North Carolina.
History
Clemson was founded in 1889 by Thomas Green Clemson, a former Confederate soldier and the founder of Clemson University. The city was named after him and was incorporated in 1893. The city was originally a small agricultural community, but it grew rapidly after the establishment of Clemson University in 1893. The university has since become one of the top public universities in the United States.
Economy
The economy of Clemson is largely driven by the presence of Clemson University. The university is the largest employer in the city, and it provides jobs for thousands of people. In addition, the university is a major source of tourism for the city, as it attracts thousands of visitors each year. Other major employers in the city include the Clemson University Medical Center, the Clemson Research Park, and the Clemson Extension Service.
The city also has a thriving retail sector, with several shopping centers and malls located in the city. The city is also home to several manufacturing companies, including the Clemson Manufacturing Company, which produces automotive parts.
Demographics
As of the 2010 census, the population of Clemson was 14,907. The racial makeup of the city was 79.2% White, 14.3% African American, 0.3% Native American, 3.2% Asian, 0.1% Pacific Islander, and 2.9% from two or more races. The median household income was $37,837, and the median family income was $50,945.
Conclusion
Clemson, South Carolina is a small city located in the foothills of the Blue Ridge Mountains in the northwest corner of the state. It is the home of Clemson University, one of the top public universities in the United States. The city has a population of approximately 15,000 people and is located in Pickens County. The economy of Clemson is largely driven by the presence of Clemson University, and the city also has a thriving retail sector. The racial makeup of the city is 79.2% White, 14.3% African American, 0.3% Native American, 3.2% Asian, 0.1% Pacific Islander, and 2.9% from two or more races. The median household income was $37,837, and the median family income was $50,945.
Common Questions
What is the Total Population of Clemson?
Total Population of Clemson is 17,557.
What is the Total Male Population of Clemson?
Total Male Population of Clemson is 10,381.
What is the Total Female Population of Clemson?
Total Female Population of Clemson is 7,176.
What is the Ratio of Males per 100 Females in Clemson?
There are 144.66 Males per 100 Females in Clemson.
What is the Ratio of Females per 100 Males in Clemson?
There are 69.13 Females per 100 Males in Clemson.
What is the Median Population Age in Clemson?
Median Population Age in Clemson is 24.6 Years.
What is the Average Family Size in Clemson
Average Family Size in Clemson is 2.9 People.
What is the Average Household Size in Clemson
Average Household Size in Clemson is 2.4 People.
What is Per Capita Income in Clemson?
Per Capita income in Clemson is $34,468.
What is the Median Family Income in Clemson?
Median Family Income in Clemson is $121,995.
What is the Median Household income in Clemson?
Median Household Income in Clemson is $50,263.
What is Income or Wage Gap in Clemson?
Income or Wage Gap in Clemson is 6.1%.
Women in Clemson earn 93.9 cents for every dollar earned by a man.
What is Inequality or Gini Index in Clemson?
Inequality or Gini Index in Clemson is 0.54.
How Large is the Labor Force in Clemson?
There are 8,902 People in the Labor Forcein in Clemson.
What is the Percentage of People in the Labor Force in Clemson?
55.2% of People are in the Labor Force in Clemson.
What is the Unemployment Rate in Clemson?
Unemployment Rate in Clemson is 4.3%.