Utica, SC
Utica Map
Utica Overview
1,654
TOTAL POPULATION
741
MALE POPULATION
913
FEMALE POPULATION
81.16
MALES / 100 FEMALES
123.21
FEMALES / 100 MALES
33.7
MEDIAN AGE
2.6
AVG FAMILY SIZE
2.1
AVG HOUSEHOLD SIZE
$25,409
PER CAPITA INCOME
51.5%
WAGE / INCOME GAP [ % ]
48.5¢/ $1
WAGE / INCOME GAP [ $ ]
$12,098
FAMILY INCOME DEFICIT
0.37
INEQUALITY / GINI INDEX
805
LABOR FORCE [ PEOPLE ]
69.2%
PERCENT IN LABOR FORCE
2.1%
UNEMPLOYMENT RATE
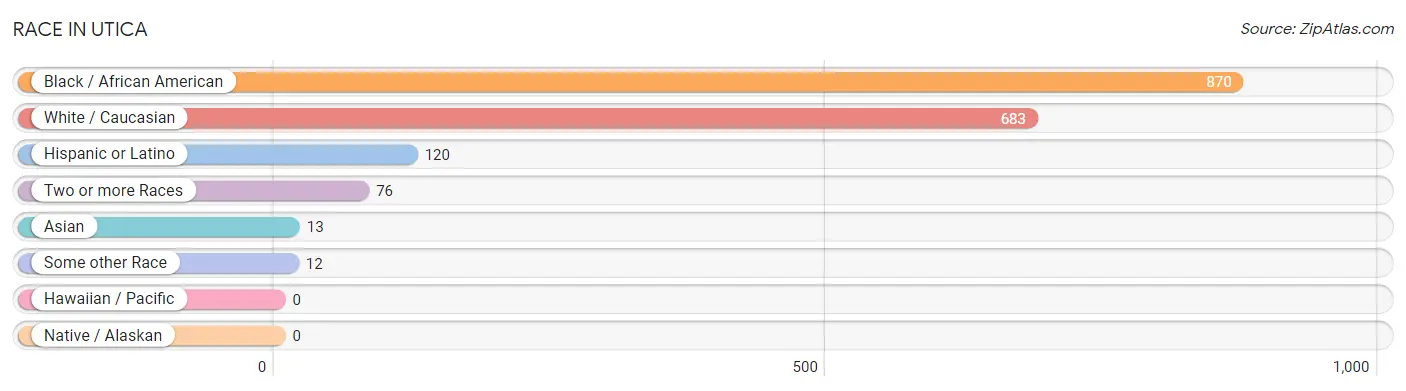
Race in Utica
The most populous races in Utica are Black / African American (870 | 52.6%), White / Caucasian (683 | 41.3%), and Hispanic or Latino (120 | 7.3%).
| Race | # Population | % Population |
| Asian | 13 | 0.8% |
| Black / African American | 870 | 52.6% |
| Hawaiian / Pacific | 0 | 0.0% |
| Hispanic or Latino | 120 | 7.3% |
| Native / Alaskan | 0 | 0.0% |
| White / Caucasian | 683 | 41.3% |
| Two or more Races | 76 | 4.6% |
| Some other Race | 12 | 0.7% |
| Total | 1,654 | 100.0% |
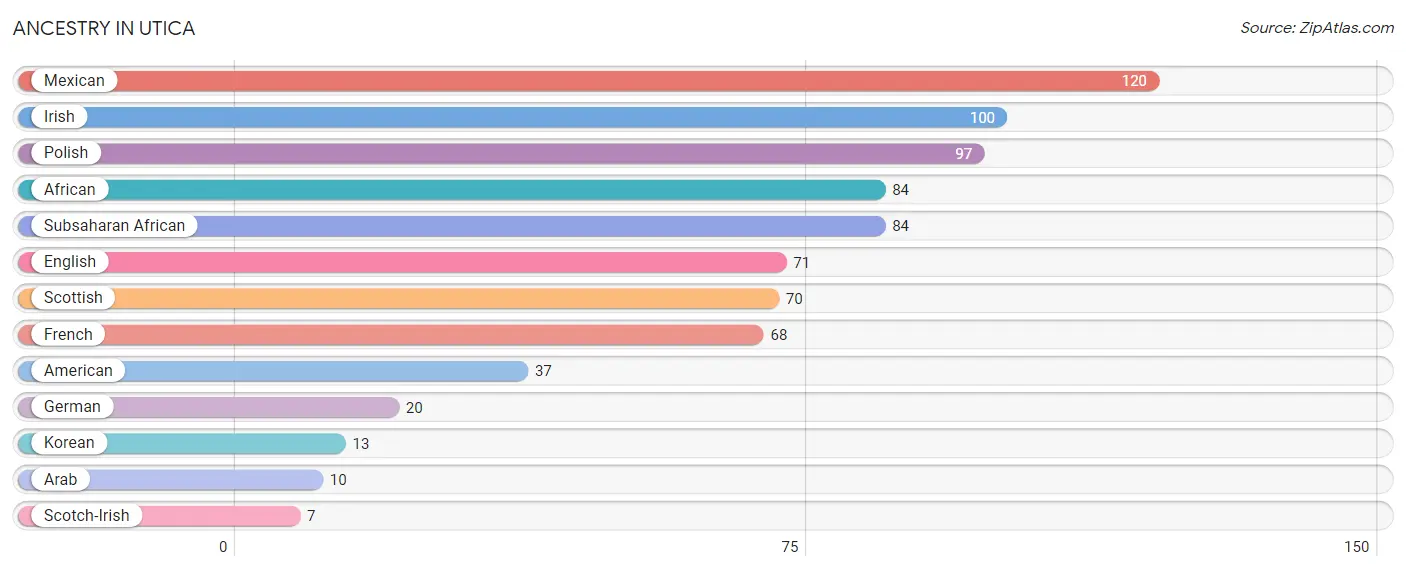
Ancestry in Utica
The most populous ancestries reported in Utica are Mexican (120 | 7.3%), Irish (100 | 6.0%), Polish (97 | 5.9%), African (84 | 5.1%), and Subsaharan African (84 | 5.1%), together accounting for 29.3% of all Utica residents.
| Ancestry | # Population | % Population |
| African | 84 | 5.1% |
| American | 37 | 2.2% |
| Arab | 10 | 0.6% |
| English | 71 | 4.3% |
| French | 68 | 4.1% |
| German | 20 | 1.2% |
| Irish | 100 | 6.0% |
| Korean | 13 | 0.8% |
| Mexican | 120 | 7.3% |
| Polish | 97 | 5.9% |
| Scotch-Irish | 7 | 0.4% |
| Scottish | 70 | 4.2% |
| Subsaharan African | 84 | 5.1% | View All 13 Rows |
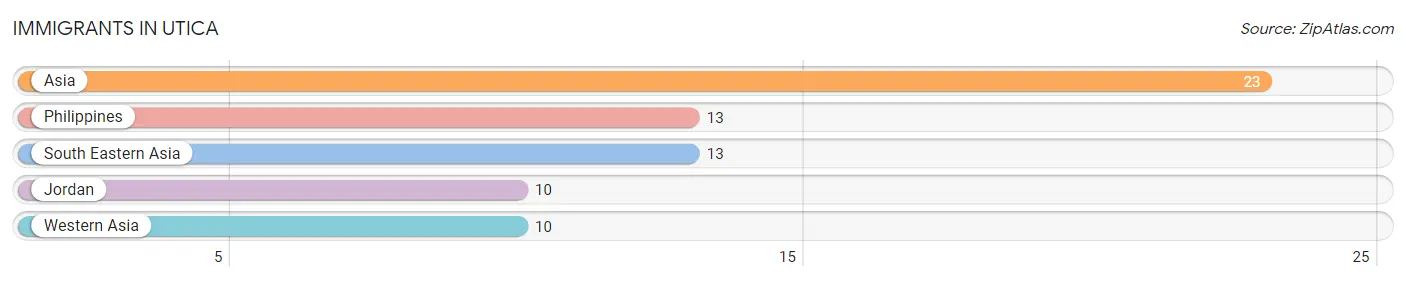
Immigrants in Utica
The most numerous immigrant groups reported in Utica came from Asia (23 | 1.4%), Philippines (13 | 0.8%), South Eastern Asia (13 | 0.8%), Jordan (10 | 0.6%), and Western Asia (10 | 0.6%), together accounting for 4.2% of all Utica residents.
| Immigration Origin | # Population | % Population |
| Asia | 23 | 1.4% |
| Jordan | 10 | 0.6% |
| Philippines | 13 | 0.8% |
| South Eastern Asia | 13 | 0.8% |
| Western Asia | 10 | 0.6% | View All 5 Rows |
Sex and Age in Utica
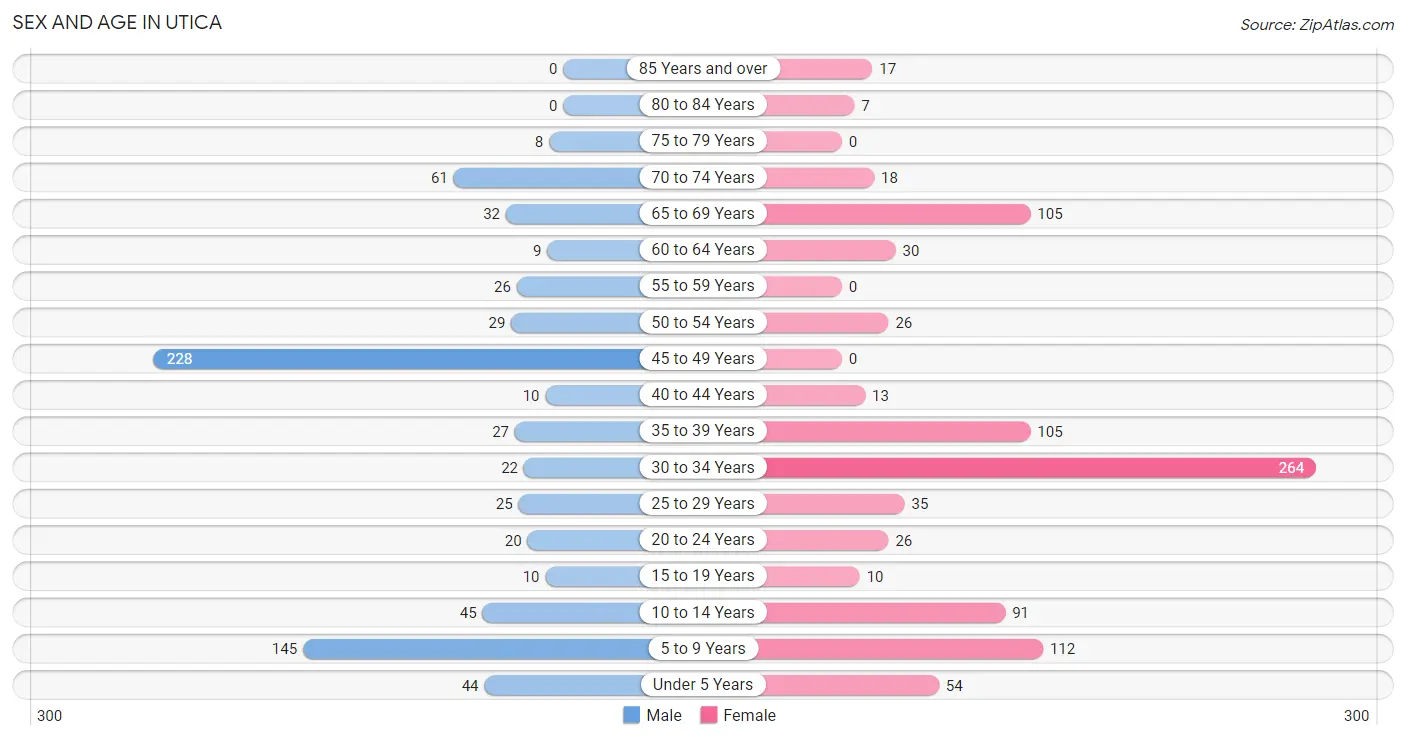
Sex and Age in Utica
The most populous age groups in Utica are 45 to 49 Years (228 | 30.8%) for men and 30 to 34 Years (264 | 28.9%) for women.
| Age Bracket | Male | Female |
| Under 5 Years | 44 (5.9%) | 54 (5.9%) |
| 5 to 9 Years | 145 (19.6%) | 112 (12.3%) |
| 10 to 14 Years | 45 (6.1%) | 91 (10.0%) |
| 15 to 19 Years | 10 (1.3%) | 10 (1.1%) |
| 20 to 24 Years | 20 (2.7%) | 26 (2.9%) |
| 25 to 29 Years | 25 (3.4%) | 35 (3.8%) |
| 30 to 34 Years | 22 (3.0%) | 264 (28.9%) |
| 35 to 39 Years | 27 (3.6%) | 105 (11.5%) |
| 40 to 44 Years | 10 (1.3%) | 13 (1.4%) |
| 45 to 49 Years | 228 (30.8%) | 0 (0.0%) |
| 50 to 54 Years | 29 (3.9%) | 26 (2.9%) |
| 55 to 59 Years | 26 (3.5%) | 0 (0.0%) |
| 60 to 64 Years | 9 (1.2%) | 30 (3.3%) |
| 65 to 69 Years | 32 (4.3%) | 105 (11.5%) |
| 70 to 74 Years | 61 (8.2%) | 18 (2.0%) |
| 75 to 79 Years | 8 (1.1%) | 0 (0.0%) |
| 80 to 84 Years | 0 (0.0%) | 7 (0.8%) |
| 85 Years and over | 0 (0.0%) | 17 (1.9%) |
| Total | 741 (100.0%) | 913 (100.0%) |
Families and Households in Utica
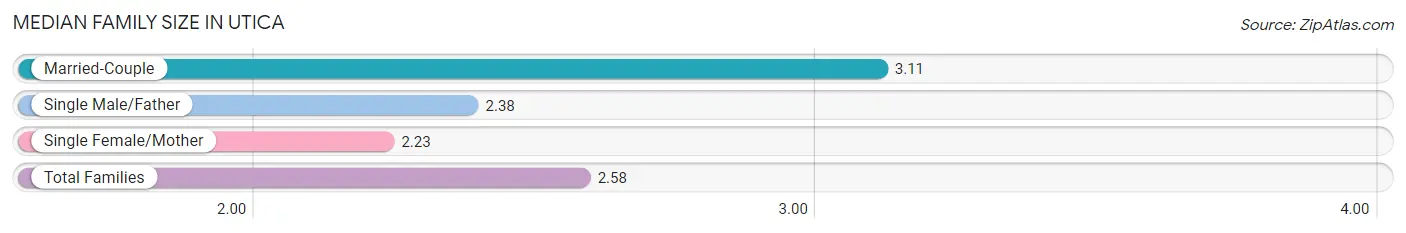
Median Family Size in Utica
The median family size in Utica is 2.58 persons per family, with married-couple families (197 | 38.3%) accounting for the largest median family size of 3.11 persons per family. On the other hand, single female/mother families (288 | 56.0%) represent the smallest median family size with 2.23 persons per family.
| Family Type | # Families | Family Size |
| Married-Couple | 197 (38.3%) | 3.11 |
| Single Male/Father | 29 (5.6%) | 2.38 |
| Single Female/Mother | 288 (56.0%) | 2.23 |
| Total Families | 514 (100.0%) | 2.58 |
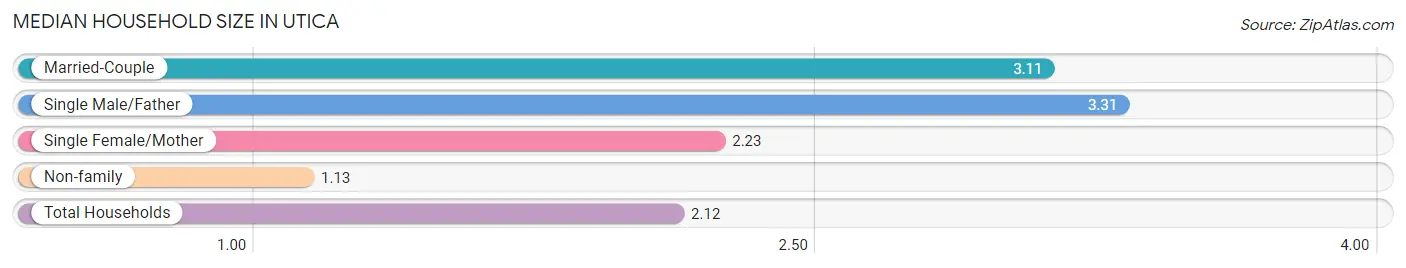
Median Household Size in Utica
The median household size in Utica is 2.12 persons per household, with single male/father households (29 | 3.7%) accounting for the largest median household size of 3.31 persons per household. non-family households (268 | 34.3%) represent the smallest median household size with 1.13 persons per household.
| Household Type | # Households | Household Size |
| Married-Couple | 197 (25.2%) | 3.11 |
| Single Male/Father | 29 (3.7%) | 3.31 |
| Single Female/Mother | 288 (36.8%) | 2.23 |
| Non-family | 268 (34.3%) | 1.13 |
| Total Households | 782 (100.0%) | 2.12 |
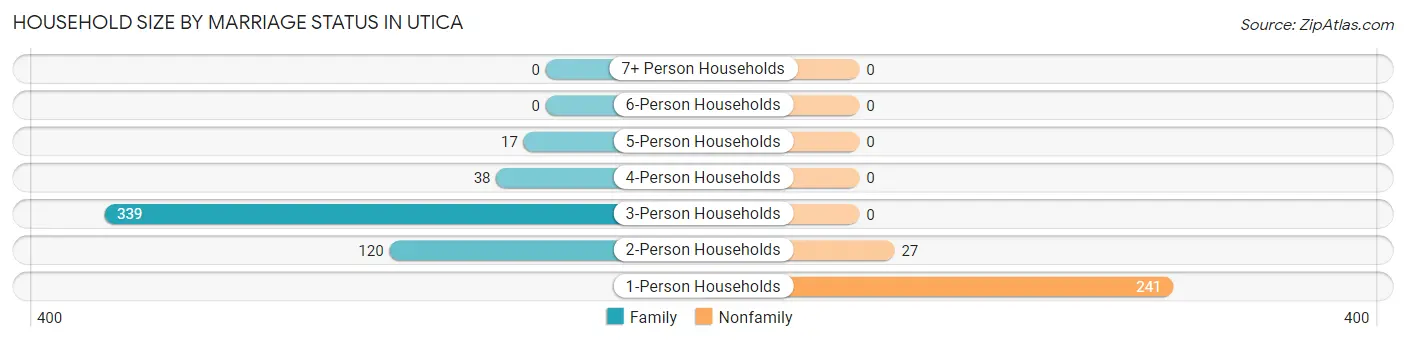
Household Size by Marriage Status in Utica
Out of a total of 782 households in Utica, 514 (65.7%) are family households, while 268 (34.3%) are nonfamily households. The most numerous type of family households are 3-person households, comprising 339, and the most common type of nonfamily households are 1-person households, comprising 241.
| Household Size | Family Households | Nonfamily Households |
| 1-Person Households | - | 241 (30.8%) |
| 2-Person Households | 120 (15.3%) | 27 (3.5%) |
| 3-Person Households | 339 (43.3%) | 0 (0.0%) |
| 4-Person Households | 38 (4.9%) | 0 (0.0%) |
| 5-Person Households | 17 (2.2%) | 0 (0.0%) |
| 6-Person Households | 0 (0.0%) | 0 (0.0%) |
| 7+ Person Households | 0 (0.0%) | 0 (0.0%) |
| Total | 514 (65.7%) | 268 (34.3%) |
Female Fertility in Utica
Fertility by Age in Utica
Average fertility rate in Utica is 77.0 births per 1,000 women. Women in the age bracket of 35 to 50 years have the highest fertility rate with 229.0 births per 1,000 women. Women in the age bracket of 35 to 50 years acount for 77.1% of all women with births.
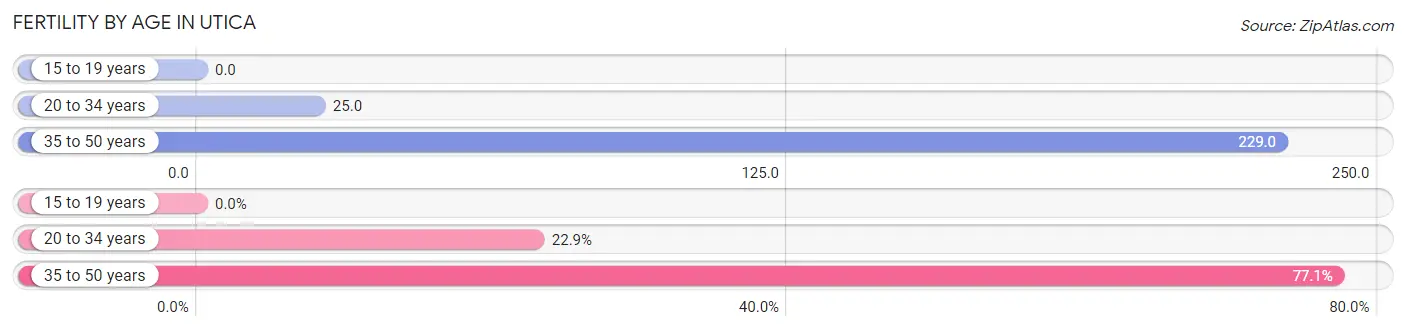
| Age Bracket | Women with Births | Births / 1,000 Women |
| 15 to 19 years | 0 (0.0%) | 0.0 |
| 20 to 34 years | 8 (22.9%) | 25.0 |
| 35 to 50 years | 27 (77.1%) | 229.0 |
| Total | 35 (100.0%) | 77.0 |
Fertility by Age by Marriage Status in Utica
22.9% of women with births (35) in Utica are married. The highest percentage of unmarried women with births falls into 35 to 50 years age bracket with 100.0% of them unmarried at the time of birth, while the lowest percentage of unmarried women with births belong to 20 to 34 years age bracket with 0.0% of them unmarried.
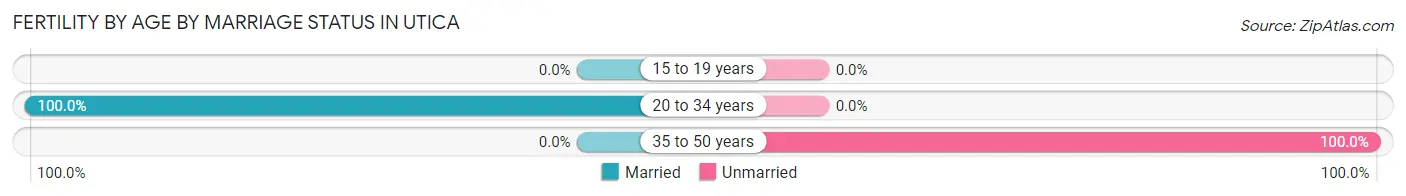
| Age Bracket | Married | Unmarried |
| 15 to 19 years | 0 (0.0%) | 0 (0.0%) |
| 20 to 34 years | 8 (100.0%) | 0 (0.0%) |
| 35 to 50 years | 0 (0.0%) | 27 (100.0%) |
| Total | 8 (22.9%) | 27 (77.1%) |
Fertility by Education in Utica
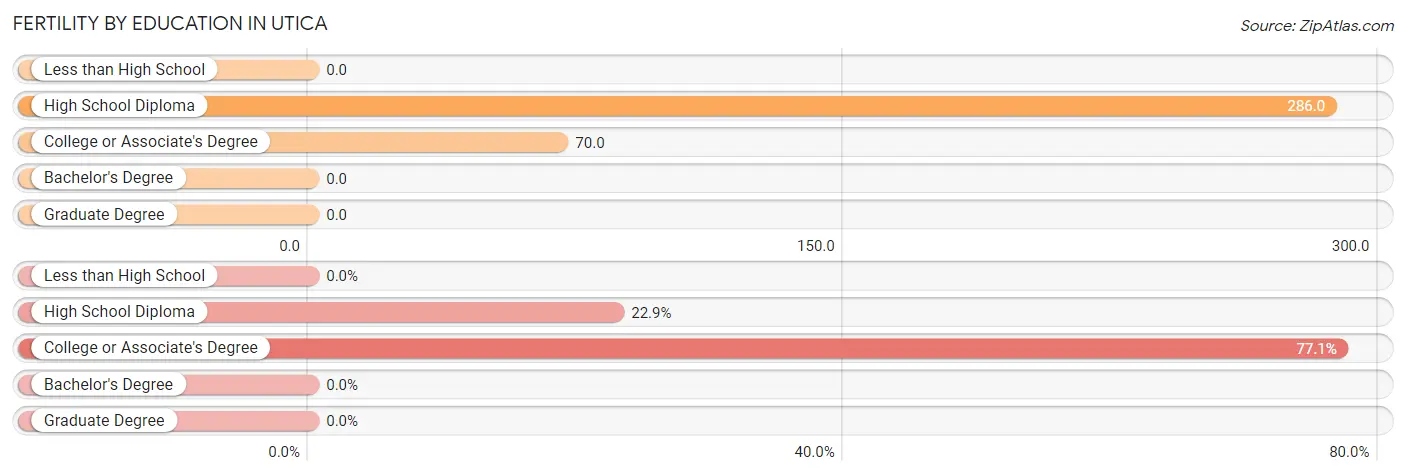
| Educational Attainment | Women with Births | Births / 1,000 Women |
| Less than High School | 0 (0.0%) | 0.0 |
| High School Diploma | 8 (22.9%) | 286.0 |
| College or Associate's Degree | 27 (77.1%) | 70.0 |
| Bachelor's Degree | 0 (0.0%) | 0.0 |
| Graduate Degree | 0 (0.0%) | 0.0 |
| Total | 35 (100.0%) | 77.0 |
Fertility by Education by Marriage Status in Utica
77.1% of women with births in Utica are unmarried. Women with the educational attainment of high school diploma are most likely to be married with 100.0% of them married at childbirth, while women with the educational attainment of college or associate's degree are least likely to be married with 100.0% of them unmarried at childbirth.
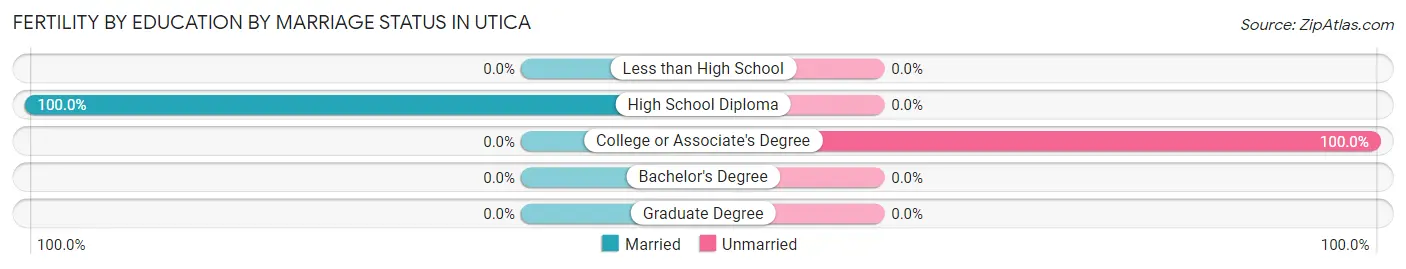
| Educational Attainment | Married | Unmarried |
| Less than High School | 0 (0.0%) | 0 (0.0%) |
| High School Diploma | 8 (100.0%) | 0 (0.0%) |
| College or Associate's Degree | 0 (0.0%) | 27 (100.0%) |
| Bachelor's Degree | 0 (0.0%) | 0 (0.0%) |
| Graduate Degree | 0 (0.0%) | 0 (0.0%) |
| Total | 8 (22.9%) | 27 (77.1%) |
Income in Utica
Income Overview in Utica
| Characteristic | Number | Measure |
| Per Capita Income | 1,654 | $25,409 |
| Median Family Income | 514 | $0 |
| Mean Family Income | 514 | $49,645 |
| Median Household Income | 782 | $0 |
| Mean Household Income | 782 | $49,065 |
| Income Deficit | 514 | $12,098 |
| Wage / Income Gap (%) | 1,654 | 51.48% |
| Wage / Income Gap ($) | 1,654 | 48.52¢ per $1 |
| Gini / Inequality Index | 1,654 | 0.37 |
Earnings by Sex in Utica
Average Earnings in Utica are $31,875, $63,614 for men and $30,868 for women, a difference of 51.5%.
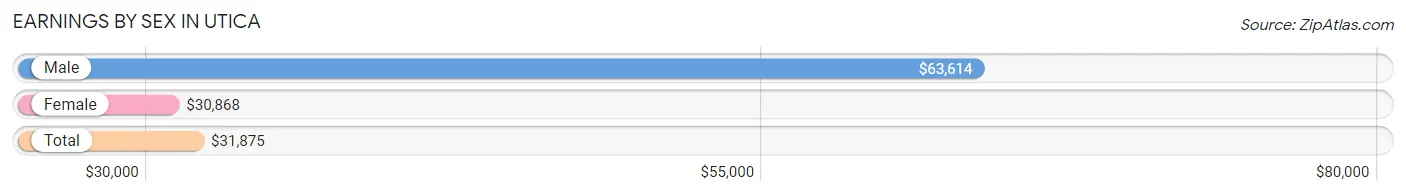
| Sex | Number | Average Earnings |
| Male | 337 (41.4%) | $63,614 |
| Female | 476 (58.6%) | $30,868 |
| Total | 813 (100.0%) | $31,875 |
Earnings by Sex by Income Bracket in Utica
The most common earnings brackets in Utica are $55,000 to $64,999 for men (145 | 43.0%) and $30,000 to $34,999 for women (242 | 50.8%).
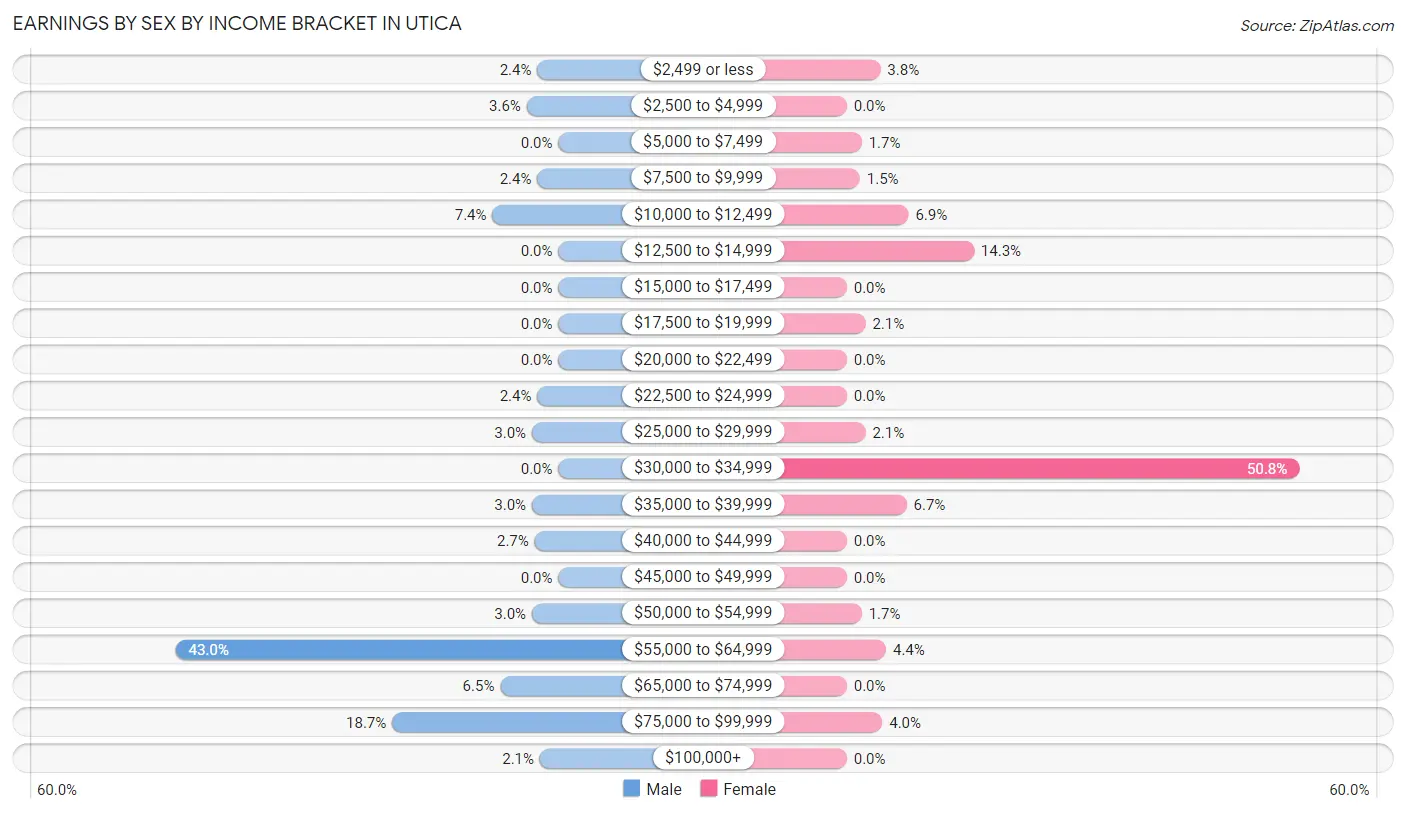
| Income | Male | Female |
| $2,499 or less | 8 (2.4%) | 18 (3.8%) |
| $2,500 to $4,999 | 12 (3.6%) | 0 (0.0%) |
| $5,000 to $7,499 | 0 (0.0%) | 8 (1.7%) |
| $7,500 to $9,999 | 8 (2.4%) | 7 (1.5%) |
| $10,000 to $12,499 | 25 (7.4%) | 33 (6.9%) |
| $12,500 to $14,999 | 0 (0.0%) | 68 (14.3%) |
| $15,000 to $17,499 | 0 (0.0%) | 0 (0.0%) |
| $17,500 to $19,999 | 0 (0.0%) | 10 (2.1%) |
| $20,000 to $22,499 | 0 (0.0%) | 0 (0.0%) |
| $22,500 to $24,999 | 8 (2.4%) | 0 (0.0%) |
| $25,000 to $29,999 | 10 (3.0%) | 10 (2.1%) |
| $30,000 to $34,999 | 0 (0.0%) | 242 (50.8%) |
| $35,000 to $39,999 | 10 (3.0%) | 32 (6.7%) |
| $40,000 to $44,999 | 9 (2.7%) | 0 (0.0%) |
| $45,000 to $49,999 | 0 (0.0%) | 0 (0.0%) |
| $50,000 to $54,999 | 10 (3.0%) | 8 (1.7%) |
| $55,000 to $64,999 | 145 (43.0%) | 21 (4.4%) |
| $65,000 to $74,999 | 22 (6.5%) | 0 (0.0%) |
| $75,000 to $99,999 | 63 (18.7%) | 19 (4.0%) |
| $100,000+ | 7 (2.1%) | 0 (0.0%) |
| Total | 337 (100.0%) | 476 (100.0%) |
Earnings by Sex by Educational Attainment in Utica
Average earnings in Utica are $63,886 for men and $31,054 for women, a difference of 51.4%. Men with an educational attainment of high school diploma enjoy the highest average annual earnings of $65,227, while those with less than high school education earn the least with $35,750. Women with an educational attainment of college or associate's degree earn the most with the average annual earnings of $31,043, while those with college or associate's degree education have the smallest earnings of $31,043.
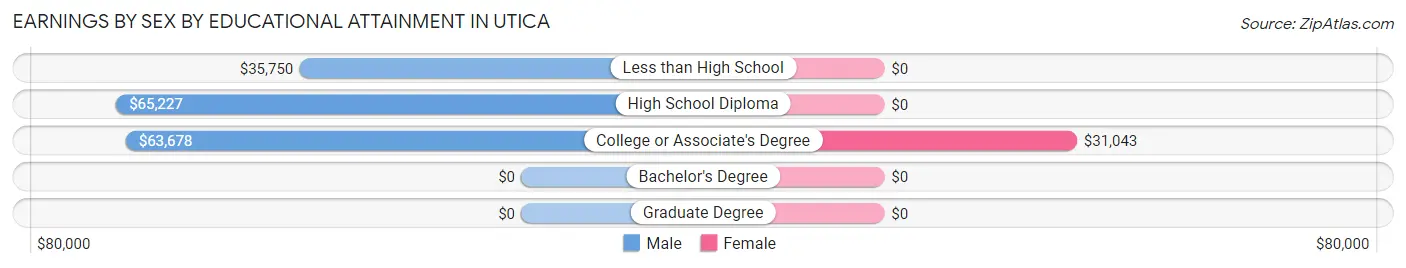
| Educational Attainment | Male Income | Female Income |
| Less than High School | $35,750 | $0 |
| High School Diploma | $65,227 | $0 |
| College or Associate's Degree | $63,678 | $31,043 |
| Bachelor's Degree | - | - |
| Graduate Degree | - | - |
| Total | $63,886 | $31,054 |
Family Income in Utica
Family Income Brackets in Utica
According to the Utica family income data, there are 259 families falling into the $25,000 to $34,999 income range, which is the most common income bracket and makes up 50.4% of all families.
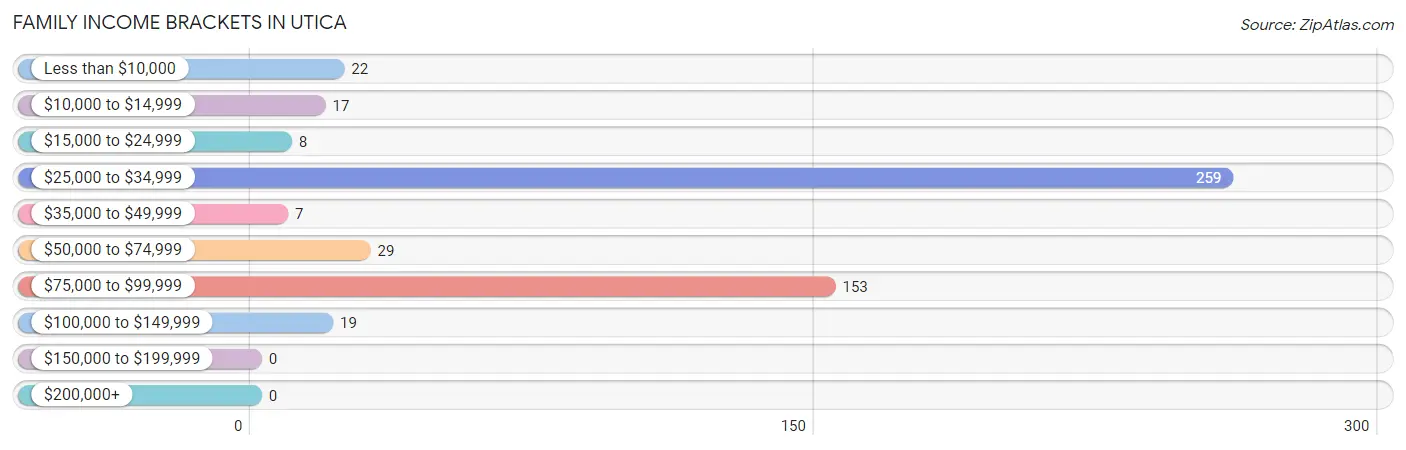
| Income Bracket | # Families | % Families |
| Less than $10,000 | 22 | 4.3% |
| $10,000 to $14,999 | 17 | 3.3% |
| $15,000 to $24,999 | 8 | 1.6% |
| $25,000 to $34,999 | 259 | 50.4% |
| $35,000 to $49,999 | 7 | 1.4% |
| $50,000 to $74,999 | 29 | 5.6% |
| $75,000 to $99,999 | 153 | 29.8% |
| $100,000 to $149,999 | 19 | 3.7% |
| $150,000 to $199,999 | 0 | 0.0% |
| $200,000+ | 0 | 0.0% |
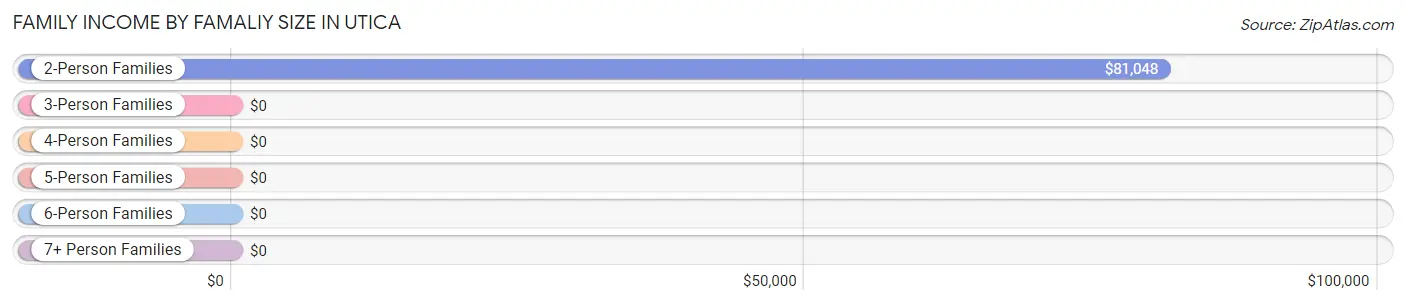
Family Income by Famaliy Size in Utica
2-person families (142 | 27.6%) account for the highest median family income in Utica with $81,048 per family, while 2-person families (142 | 27.6%) have the highest median income of $40,524 per family member.
| Income Bracket | # Families | Median Income |
| 2-Person Families | 142 (27.6%) | $81,048 |
| 3-Person Families | 317 (61.7%) | $0 |
| 4-Person Families | 38 (7.4%) | $0 |
| 5-Person Families | 17 (3.3%) | $0 |
| 6-Person Families | 0 (0.0%) | $0 |
| 7+ Person Families | 0 (0.0%) | $0 |
| Total | 514 (100.0%) | $0 |
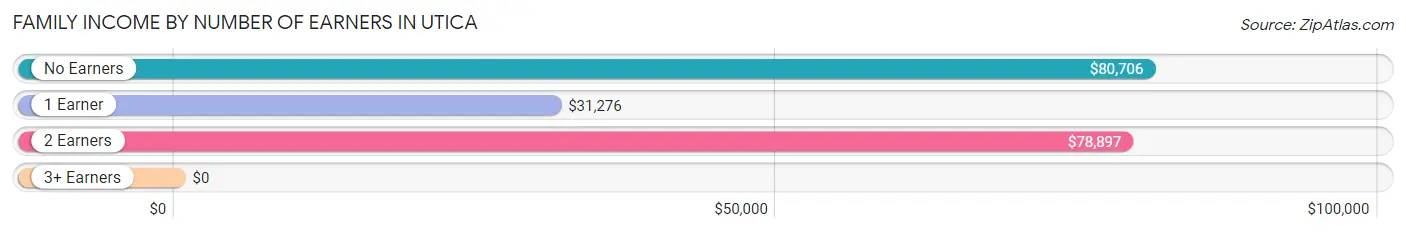
Family Income by Number of Earners in Utica
| Number of Earners | # Families | Median Income |
| No Earners | 113 (22.0%) | $80,706 |
| 1 Earner | 281 (54.7%) | $31,276 |
| 2 Earners | 106 (20.6%) | $78,897 |
| 3+ Earners | 14 (2.7%) | $0 |
| Total | 514 (100.0%) | $0 |
Household Income in Utica
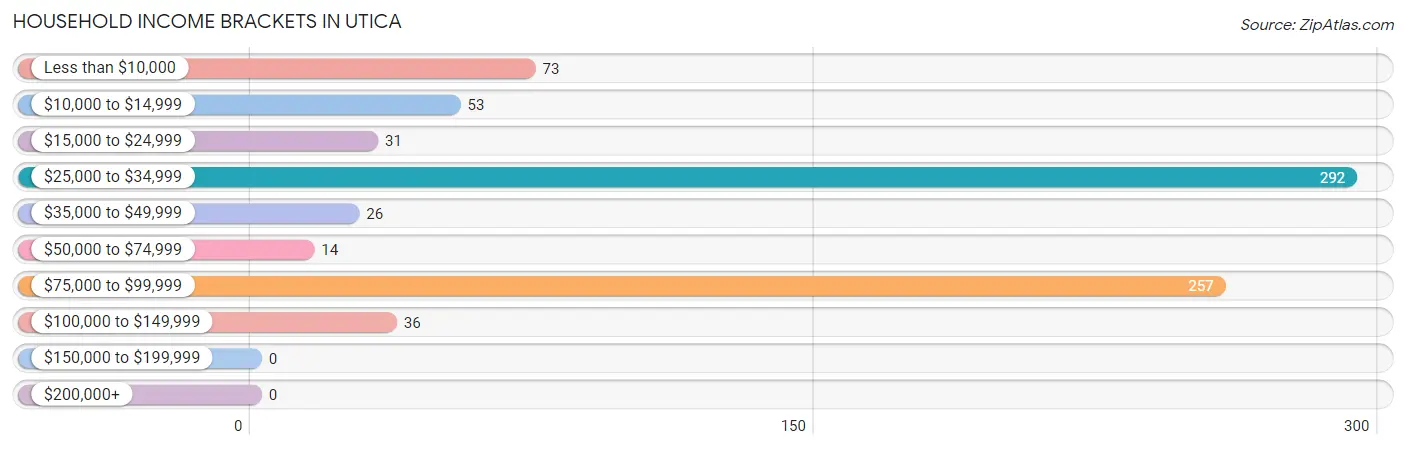
Household Income Brackets in Utica
With 292 households falling in the category, the $25,000 to $34,999 income range is the most frequent in Utica, accounting for 37.3% of all households.
| Income Bracket | # Households | % Households |
| Less than $10,000 | 73 | 9.3% |
| $10,000 to $14,999 | 53 | 6.8% |
| $15,000 to $24,999 | 31 | 4.0% |
| $25,000 to $34,999 | 292 | 37.3% |
| $35,000 to $49,999 | 26 | 3.3% |
| $50,000 to $74,999 | 14 | 1.8% |
| $75,000 to $99,999 | 257 | 32.9% |
| $100,000 to $149,999 | 36 | 4.6% |
| $150,000 to $199,999 | 0 | 0.0% |
| $200,000+ | 0 | 0.0% |
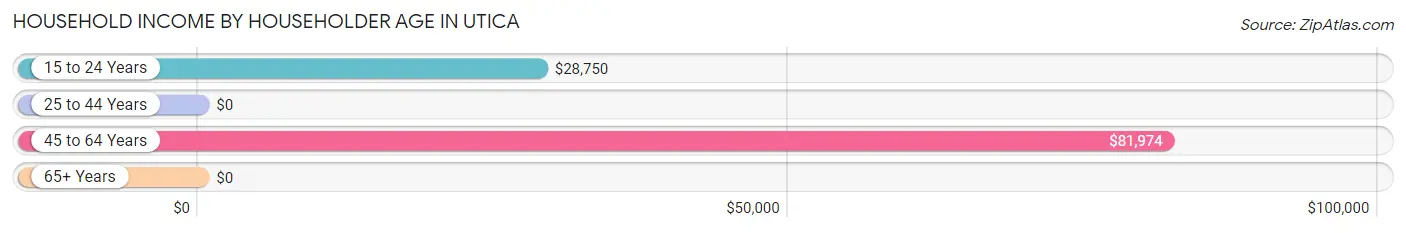
Household Income by Householder Age in Utica
The median household income in Utica is $0, with the highest median household income of $81,974 found in the 45 to 64 years age bracket for the primary householder. A total of 180 households (23.0%) fall into this category. Meanwhile, the 25 to 44 years age bracket for the primary householder has the lowest median household income of $0, with 396 households (50.6%) in this group.
| Income Bracket | # Households | Median Income |
| 15 to 24 Years | 28 (3.6%) | $28,750 |
| 25 to 44 Years | 396 (50.6%) | $0 |
| 45 to 64 Years | 180 (23.0%) | $81,974 |
| 65+ Years | 178 (22.8%) | $0 |
| Total | 782 (100.0%) | $0 |
Poverty in Utica
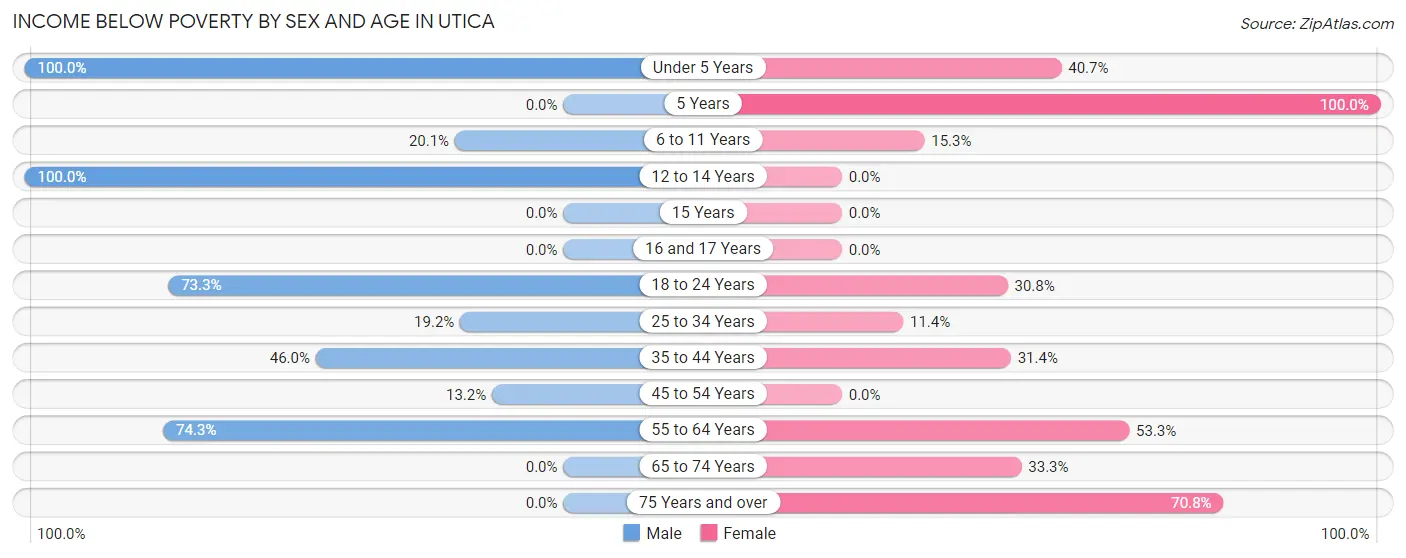
Income Below Poverty by Sex and Age in Utica
With 27.9% poverty level for males and 23.2% for females among the residents of Utica, under 5 year old males and 5 year old females are the most vulnerable to poverty, with 44 males (100.0%) and 7 females (100.0%) in their respective age groups living below the poverty level.
| Age Bracket | Male | Female |
| Under 5 Years | 44 (100.0%) | 22 (40.7%) |
| 5 Years | 0 (0.0%) | 7 (100.0%) |
| 6 to 11 Years | 34 (20.1%) | 30 (15.3%) |
| 12 to 14 Years | 21 (100.0%) | 0 (0.0%) |
| 15 Years | 0 (0.0%) | 0 (0.0%) |
| 16 and 17 Years | 0 (0.0%) | 0 (0.0%) |
| 18 to 24 Years | 22 (73.3%) | 8 (30.8%) |
| 25 to 34 Years | 9 (19.2%) | 34 (11.4%) |
| 35 to 44 Years | 17 (46.0%) | 37 (31.4%) |
| 45 to 54 Years | 34 (13.2%) | 0 (0.0%) |
| 55 to 64 Years | 26 (74.3%) | 16 (53.3%) |
| 65 to 74 Years | 0 (0.0%) | 41 (33.3%) |
| 75 Years and over | 0 (0.0%) | 17 (70.8%) |
| Total | 207 (27.9%) | 212 (23.2%) |
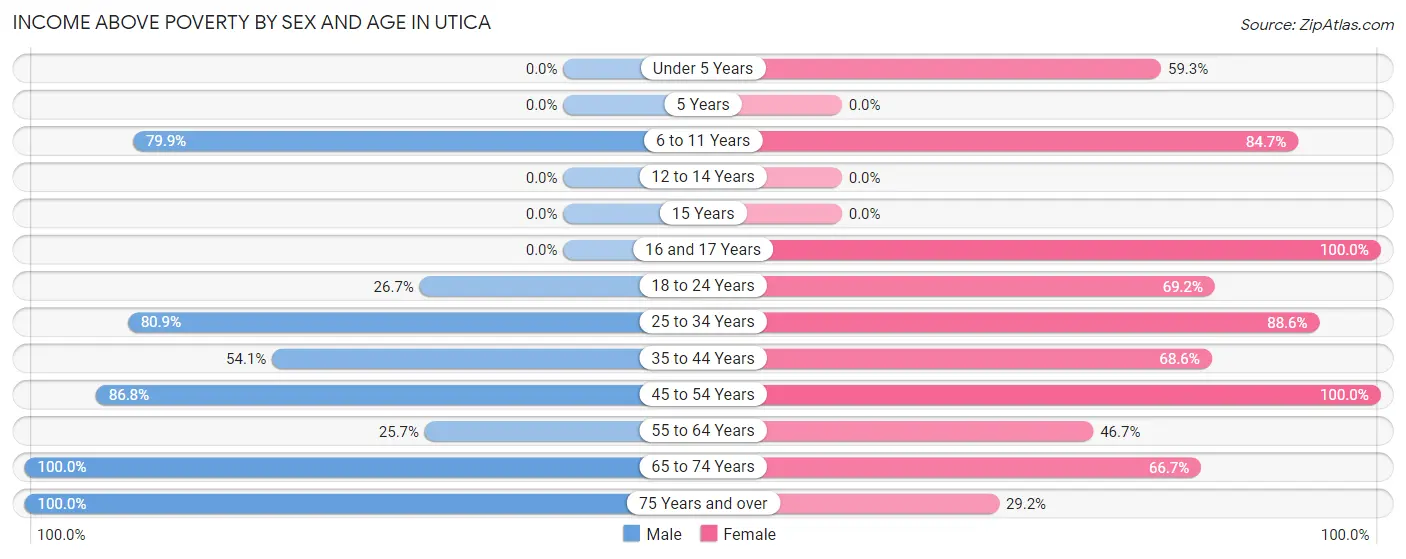
Income Above Poverty by Sex and Age in Utica
According to the poverty statistics in Utica, males aged 65 to 74 years and females aged 16 and 17 years are the age groups that are most secure financially, with 100.0% of males and 100.0% of females in these age groups living above the poverty line.
| Age Bracket | Male | Female |
| Under 5 Years | 0 (0.0%) | 32 (59.3%) |
| 5 Years | 0 (0.0%) | 0 (0.0%) |
| 6 to 11 Years | 135 (79.9%) | 166 (84.7%) |
| 12 to 14 Years | 0 (0.0%) | 0 (0.0%) |
| 15 Years | 0 (0.0%) | 0 (0.0%) |
| 16 and 17 Years | 0 (0.0%) | 10 (100.0%) |
| 18 to 24 Years | 8 (26.7%) | 18 (69.2%) |
| 25 to 34 Years | 38 (80.8%) | 265 (88.6%) |
| 35 to 44 Years | 20 (54.0%) | 81 (68.6%) |
| 45 to 54 Years | 223 (86.8%) | 26 (100.0%) |
| 55 to 64 Years | 9 (25.7%) | 14 (46.7%) |
| 65 to 74 Years | 93 (100.0%) | 82 (66.7%) |
| 75 Years and over | 8 (100.0%) | 7 (29.2%) |
| Total | 534 (72.1%) | 701 (76.8%) |
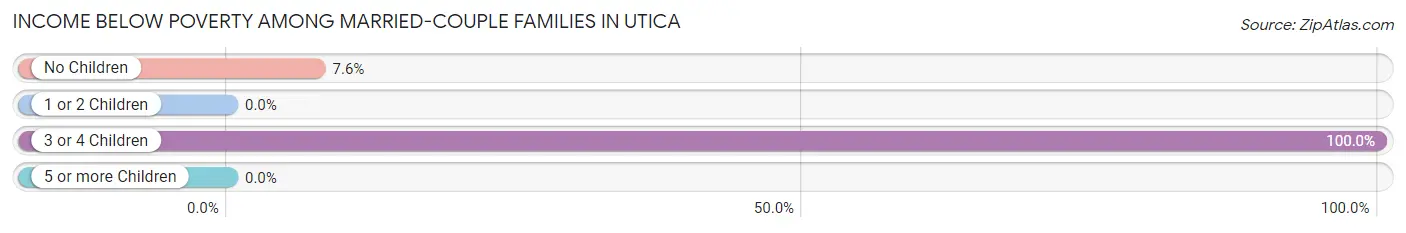
Income Below Poverty Among Married-Couple Families in Utica
The poverty statistics for married-couple families in Utica show that 12.7% or 25 of the total 197 families live below the poverty line. Families with 3 or 4 children have the highest poverty rate of 100.0%, comprising of 17 families. On the other hand, families with 1 or 2 children have the lowest poverty rate of 0.0%, which includes 0 families.
| Children | Above Poverty | Below Poverty |
| No Children | 97 (92.4%) | 8 (7.6%) |
| 1 or 2 Children | 75 (100.0%) | 0 (0.0%) |
| 3 or 4 Children | 0 (0.0%) | 17 (100.0%) |
| 5 or more Children | 0 (0.0%) | 0 (0.0%) |
| Total | 172 (87.3%) | 25 (12.7%) |
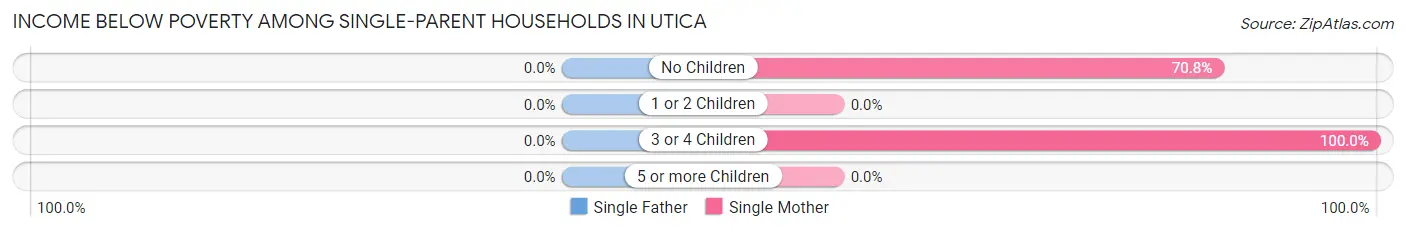
Income Below Poverty Among Single-Parent Households in Utica
| Children | Single Father | Single Mother |
| No Children | 0 (0.0%) | 17 (70.8%) |
| 1 or 2 Children | 0 (0.0%) | 0 (0.0%) |
| 3 or 4 Children | 0 (0.0%) | 22 (100.0%) |
| 5 or more Children | 0 (0.0%) | 0 (0.0%) |
| Total | 0 (0.0%) | 39 (13.5%) |
Income Below Poverty Among Married-Couple vs Single-Parent Households in Utica
The poverty data for Utica shows that 25 of the married-couple family households (12.7%) and 39 of the single-parent households (12.3%) are living below the poverty level. Within the married-couple family households, those with 3 or 4 children have the highest poverty rate, with 17 households (100.0%) falling below the poverty line. Among the single-parent households, those with 3 or 4 children have the highest poverty rate, with 22 household (100.0%) living below poverty.
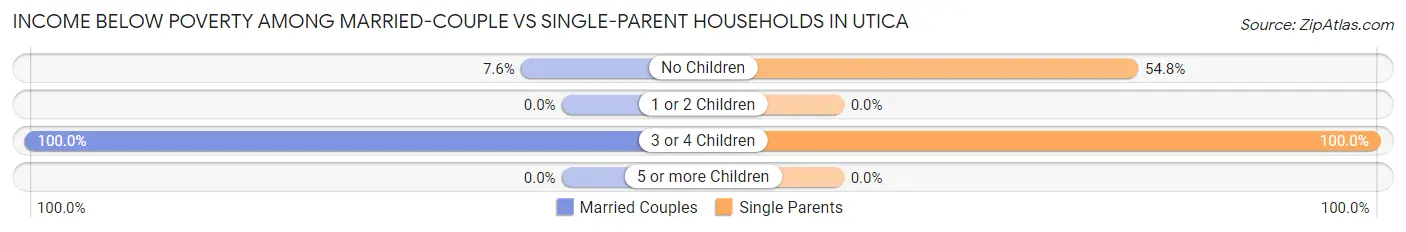
| Children | Married-Couple Families | Single-Parent Households |
| No Children | 8 (7.6%) | 17 (54.8%) |
| 1 or 2 Children | 0 (0.0%) | 0 (0.0%) |
| 3 or 4 Children | 17 (100.0%) | 22 (100.0%) |
| 5 or more Children | 0 (0.0%) | 0 (0.0%) |
| Total | 25 (12.7%) | 39 (12.3%) |
Employment Characteristics in Utica
Employment by Class of Employer in Utica
Among the 742 employed individuals in Utica, private company employees (566 | 76.3%), self-employed (not incorporated) (148 | 20.0%), and state government employees (20 | 2.7%) make up the most common classes of employment.
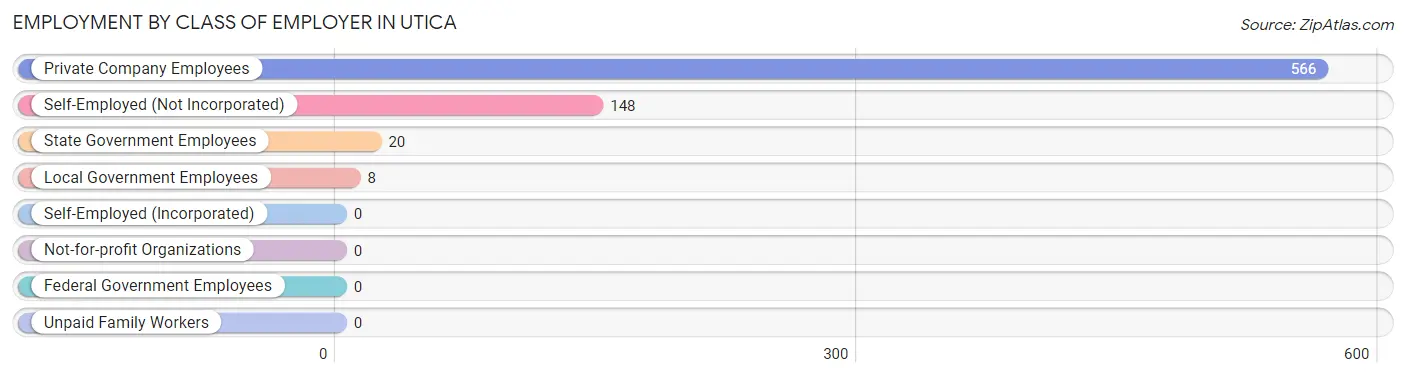
| Employer Class | # Employees | % Employees |
| Private Company Employees | 566 | 76.3% |
| Self-Employed (Incorporated) | 0 | 0.0% |
| Self-Employed (Not Incorporated) | 148 | 20.0% |
| Not-for-profit Organizations | 0 | 0.0% |
| Local Government Employees | 8 | 1.1% |
| State Government Employees | 20 | 2.7% |
| Federal Government Employees | 0 | 0.0% |
| Unpaid Family Workers | 0 | 0.0% |
| Total | 742 | 100.0% |
Employment Status by Age in Utica
According to the labor force statistics for Utica, out of the total population over 16 years of age (1,163), 69.2% or 805 individuals are in the labor force, with 2.1% or 17 of them unemployed. The age group with the highest labor force participation rate is 16 to 19 years, with 100.0% or 20 individuals in the labor force. Within the labor force, the 35 to 44 years age range has the highest percentage of unemployed individuals, with 6.8% or 10 of them being unemployed.
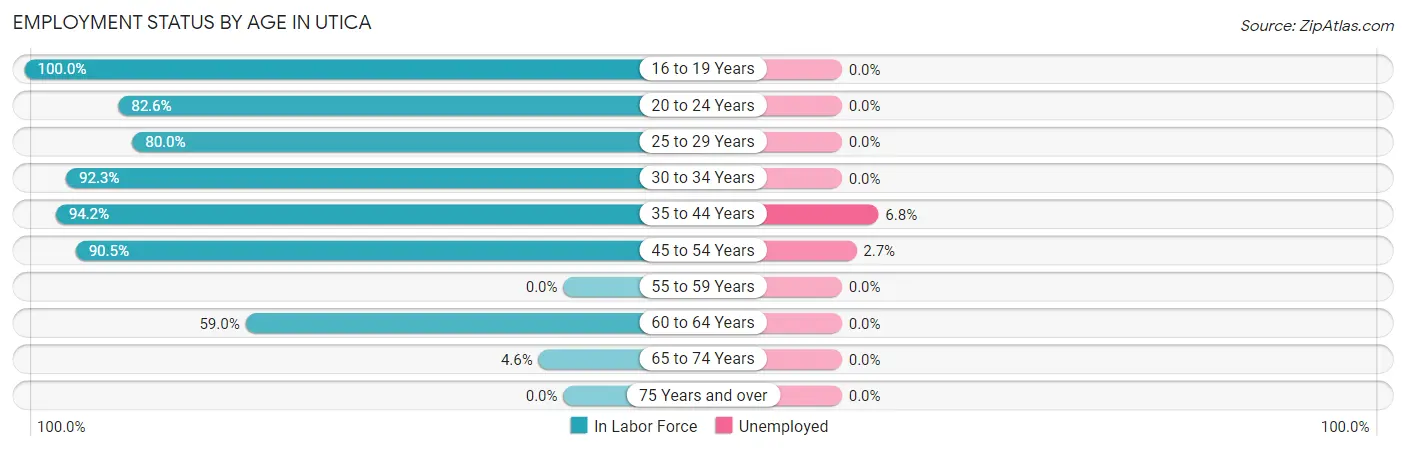
| Age Bracket | In Labor Force | Unemployed |
| 16 to 19 Years | 20 (100.0%) | 0 (0.0%) |
| 20 to 24 Years | 38 (82.6%) | 0 (0.0%) |
| 25 to 29 Years | 48 (80.0%) | 0 (0.0%) |
| 30 to 34 Years | 264 (92.3%) | 0 (0.0%) |
| 35 to 44 Years | 146 (94.2%) | 10 (6.8%) |
| 45 to 54 Years | 256 (90.5%) | 7 (2.7%) |
| 55 to 59 Years | 0 (0.0%) | 0 (0.0%) |
| 60 to 64 Years | 23 (59.0%) | 0 (0.0%) |
| 65 to 74 Years | 10 (4.6%) | 0 (0.0%) |
| 75 Years and over | 0 (0.0%) | 0 (0.0%) |
| Total | 805 (69.2%) | 17 (2.1%) |
Employment Status by Educational Attainment in Utica
According to labor force statistics for Utica, 86.8% of individuals (737) out of the total population between 25 and 64 years of age (849) are in the labor force, with 2.3% or 17 of them being unemployed. The group with the highest labor force participation rate are those with the educational attainment of college / associate degree, with 92.4% or 559 individuals in the labor force. Within the labor force, individuals with less than high school education have the highest percentage of unemployment, with 41.5% or 17 of them being unemployed.
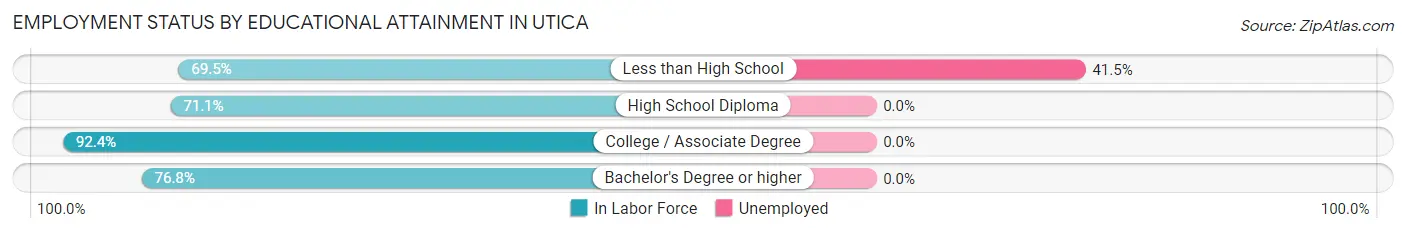
| Educational Attainment | In Labor Force | Unemployed |
| Less than High School | 41 (69.5%) | 24 (41.5%) |
| High School Diploma | 64 (71.1%) | 0 (0.0%) |
| College / Associate Degree | 559 (92.4%) | 0 (0.0%) |
| Bachelor's Degree or higher | 73 (76.8%) | 0 (0.0%) |
| Total | 737 (86.8%) | 20 (2.3%) |
Employment Occupations by Sex in Utica
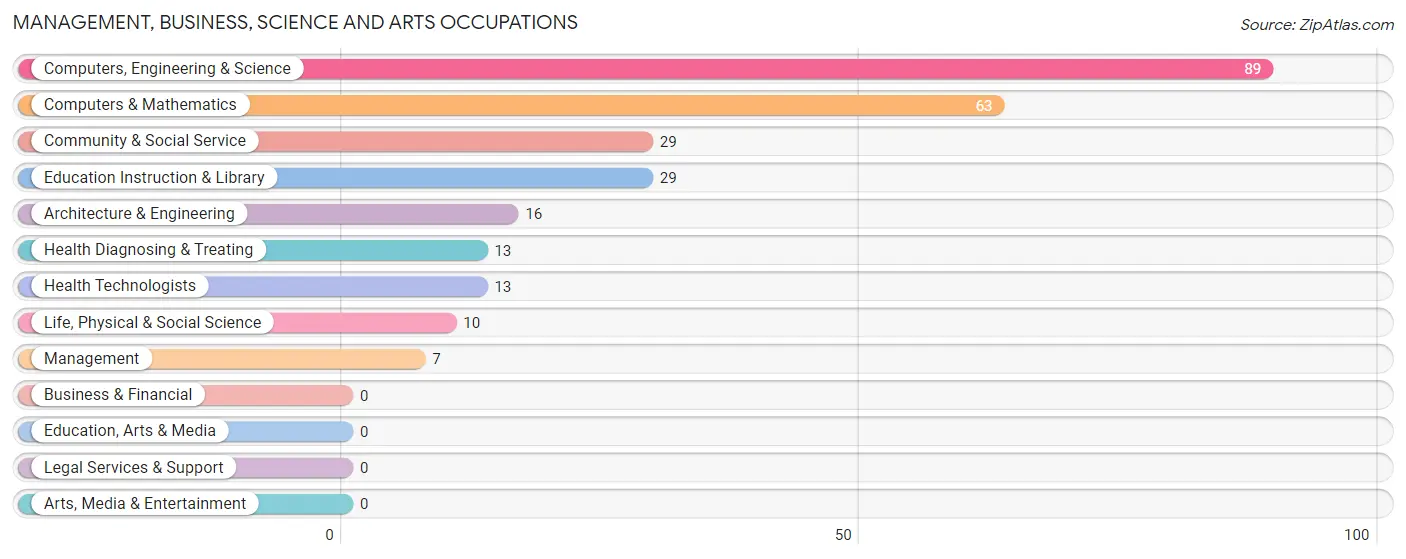
Management, Business, Science and Arts Occupations
The most common Management, Business, Science and Arts occupations in Utica are Computers, Engineering & Science (89 | 11.3%), Computers & Mathematics (63 | 8.0%), Community & Social Service (29 | 3.7%), Education Instruction & Library (29 | 3.7%), and Architecture & Engineering (16 | 2.0%).
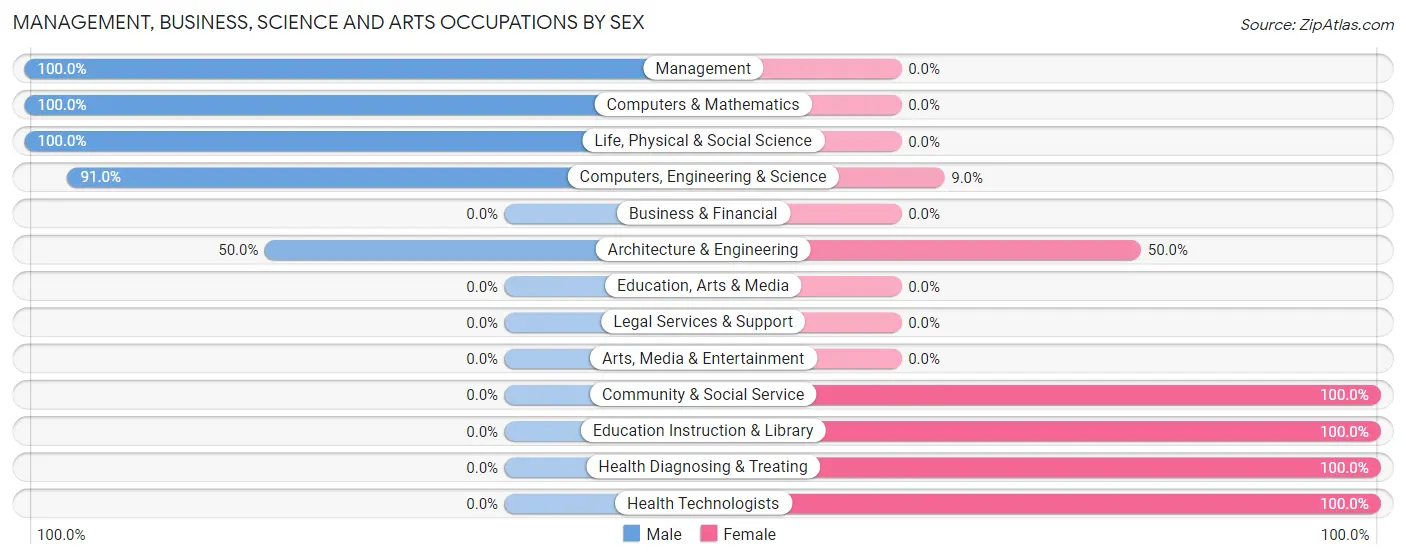
Management, Business, Science and Arts Occupations by Sex
Within the Management, Business, Science and Arts occupations in Utica, the most male-oriented occupations are Management (100.0%), Computers & Mathematics (100.0%), and Life, Physical & Social Science (100.0%), while the most female-oriented occupations are Community & Social Service (100.0%), Education Instruction & Library (100.0%), and Health Diagnosing & Treating (100.0%).
| Occupation | Male | Female |
| Management | 7 (100.0%) | 0 (0.0%) |
| Business & Financial | 0 (0.0%) | 0 (0.0%) |
| Computers, Engineering & Science | 81 (91.0%) | 8 (9.0%) |
| Computers & Mathematics | 63 (100.0%) | 0 (0.0%) |
| Architecture & Engineering | 8 (50.0%) | 8 (50.0%) |
| Life, Physical & Social Science | 10 (100.0%) | 0 (0.0%) |
| Community & Social Service | 0 (0.0%) | 29 (100.0%) |
| Education, Arts & Media | 0 (0.0%) | 0 (0.0%) |
| Legal Services & Support | 0 (0.0%) | 0 (0.0%) |
| Education Instruction & Library | 0 (0.0%) | 29 (100.0%) |
| Arts, Media & Entertainment | 0 (0.0%) | 0 (0.0%) |
| Health Diagnosing & Treating | 0 (0.0%) | 13 (100.0%) |
| Health Technologists | 0 (0.0%) | 13 (100.0%) |
| Total (Category) | 88 (63.8%) | 50 (36.2%) |
| Total (Overall) | 327 (41.5%) | 461 (58.5%) |
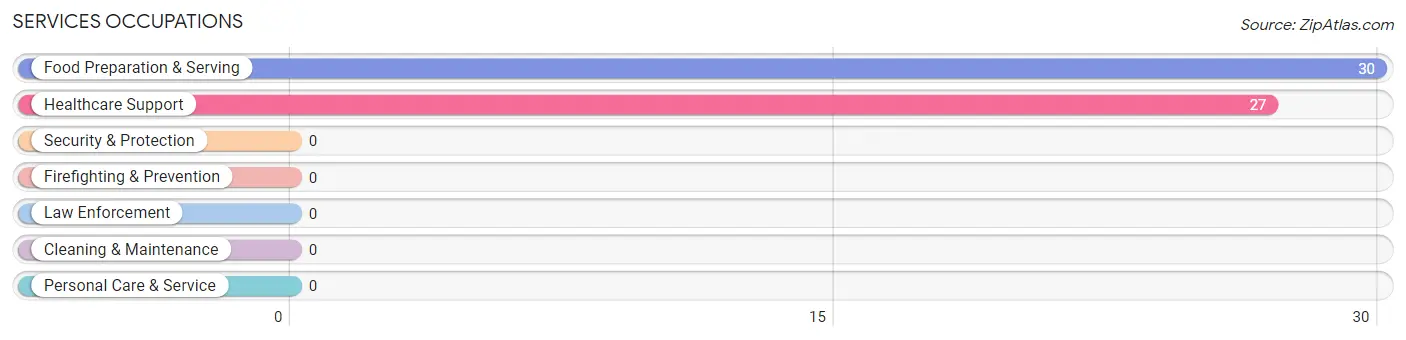
Services Occupations
The most common Services occupations in Utica are Food Preparation & Serving (30 | 3.8%), and Healthcare Support (27 | 3.4%).
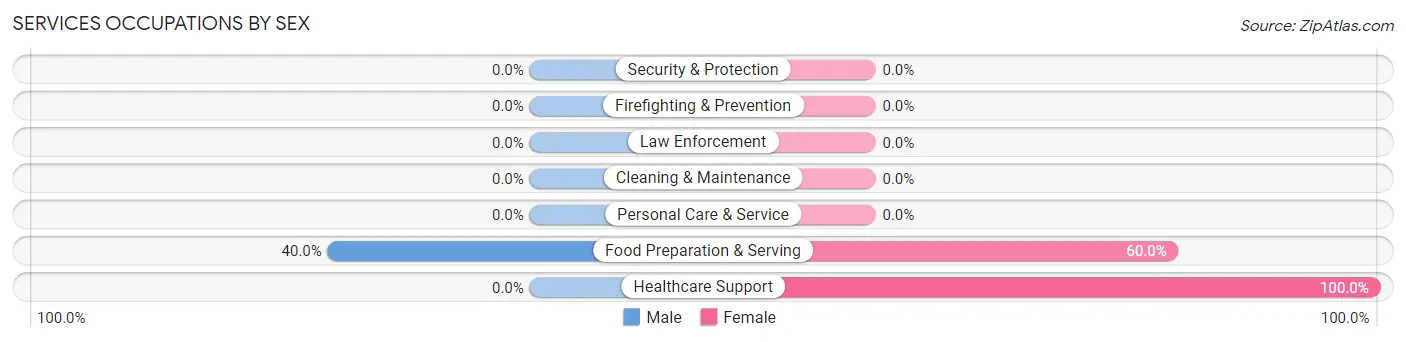
Services Occupations by Sex
| Occupation | Male | Female |
| Healthcare Support | 0 (0.0%) | 27 (100.0%) |
| Security & Protection | 0 (0.0%) | 0 (0.0%) |
| Firefighting & Prevention | 0 (0.0%) | 0 (0.0%) |
| Law Enforcement | 0 (0.0%) | 0 (0.0%) |
| Food Preparation & Serving | 12 (40.0%) | 18 (60.0%) |
| Cleaning & Maintenance | 0 (0.0%) | 0 (0.0%) |
| Personal Care & Service | 0 (0.0%) | 0 (0.0%) |
| Total (Category) | 12 (21.0%) | 45 (78.9%) |
| Total (Overall) | 327 (41.5%) | 461 (58.5%) |
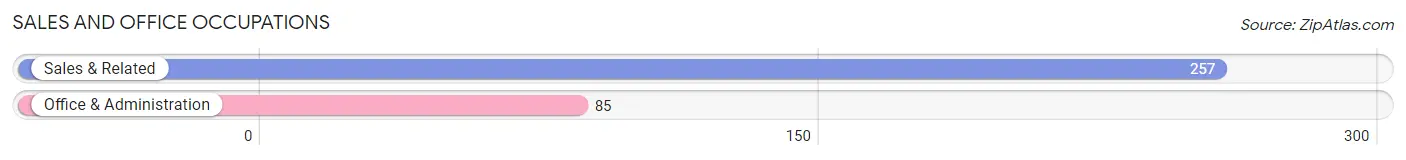
Sales and Office Occupations
The most common Sales and Office occupations in Utica are Sales & Related (257 | 32.6%), and Office & Administration (85 | 10.8%).
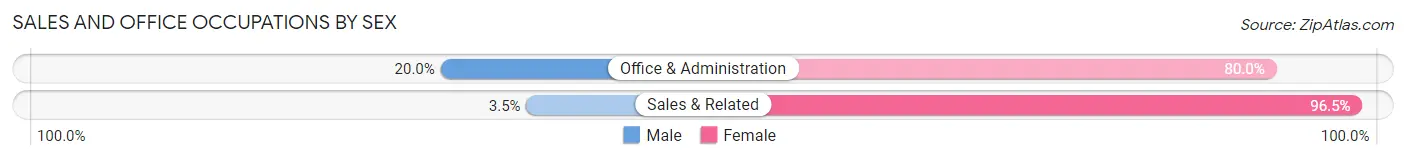
Sales and Office Occupations by Sex
| Occupation | Male | Female |
| Sales & Related | 9 (3.5%) | 248 (96.5%) |
| Office & Administration | 17 (20.0%) | 68 (80.0%) |
| Total (Category) | 26 (7.6%) | 316 (92.4%) |
| Total (Overall) | 327 (41.5%) | 461 (58.5%) |
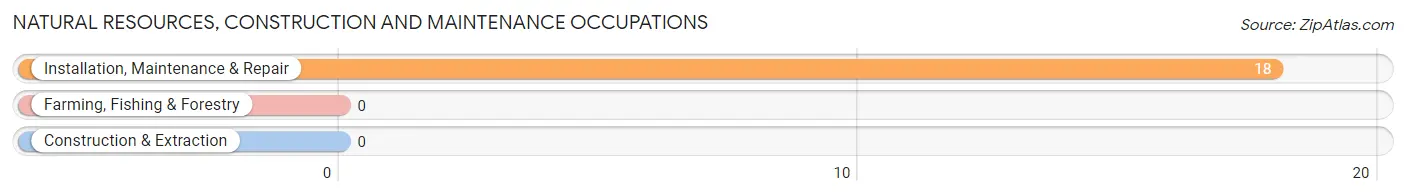
Natural Resources, Construction and Maintenance Occupations
The most common Natural Resources, Construction and Maintenance occupations in Utica are , and Installation, Maintenance & Repair (18 | 2.3%).
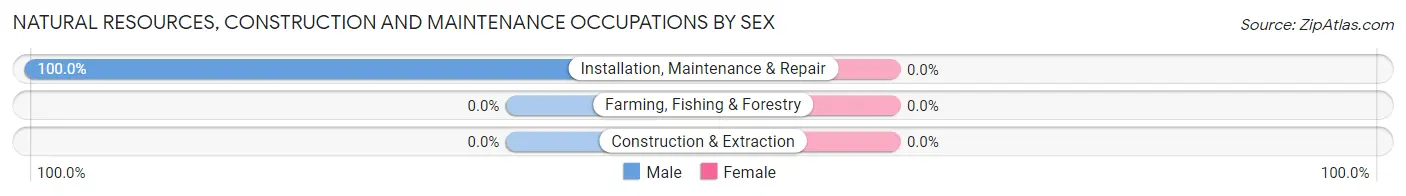
Natural Resources, Construction and Maintenance Occupations by Sex
| Occupation | Male | Female |
| Farming, Fishing & Forestry | 0 (0.0%) | 0 (0.0%) |
| Construction & Extraction | 0 (0.0%) | 0 (0.0%) |
| Installation, Maintenance & Repair | 18 (100.0%) | 0 (0.0%) |
| Total (Category) | 18 (100.0%) | 0 (0.0%) |
| Total (Overall) | 327 (41.5%) | 461 (58.5%) |
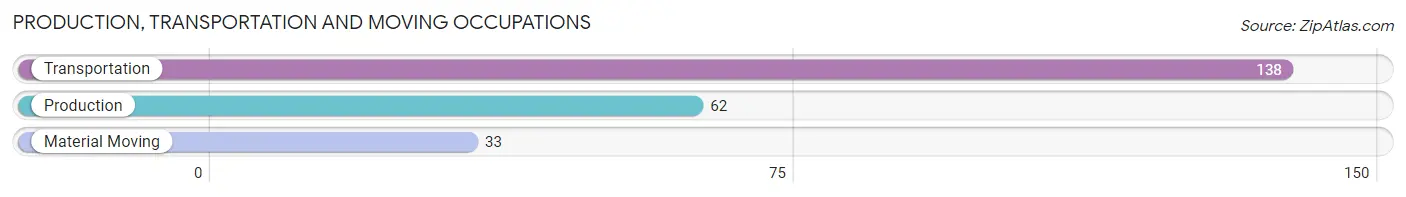
Production, Transportation and Moving Occupations
The most common Production, Transportation and Moving occupations in Utica are Transportation (138 | 17.5%), Production (62 | 7.9%), and Material Moving (33 | 4.2%).
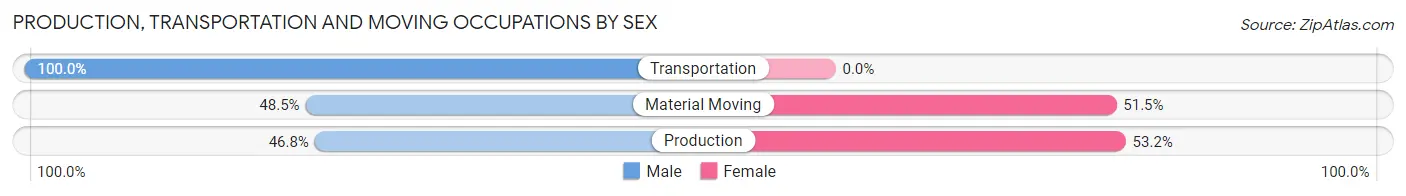
Production, Transportation and Moving Occupations by Sex
| Occupation | Male | Female |
| Production | 29 (46.8%) | 33 (53.2%) |
| Transportation | 138 (100.0%) | 0 (0.0%) |
| Material Moving | 16 (48.5%) | 17 (51.5%) |
| Total (Category) | 183 (78.5%) | 50 (21.5%) |
| Total (Overall) | 327 (41.5%) | 461 (58.5%) |
Employment Industries by Sex in Utica
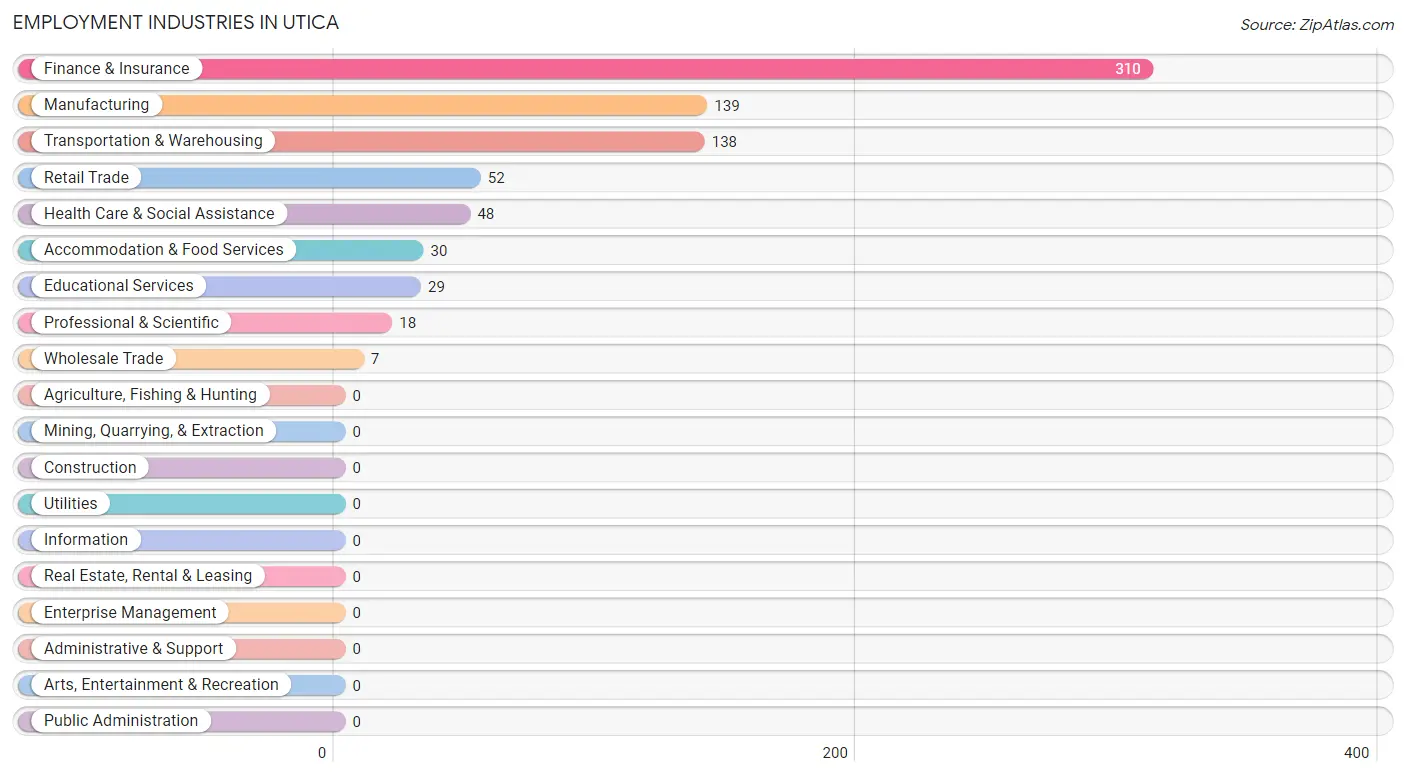
Employment Industries in Utica
The major employment industries in Utica include Finance & Insurance (310 | 39.3%), Manufacturing (139 | 17.6%), Transportation & Warehousing (138 | 17.5%), Retail Trade (52 | 6.6%), and Health Care & Social Assistance (48 | 6.1%).
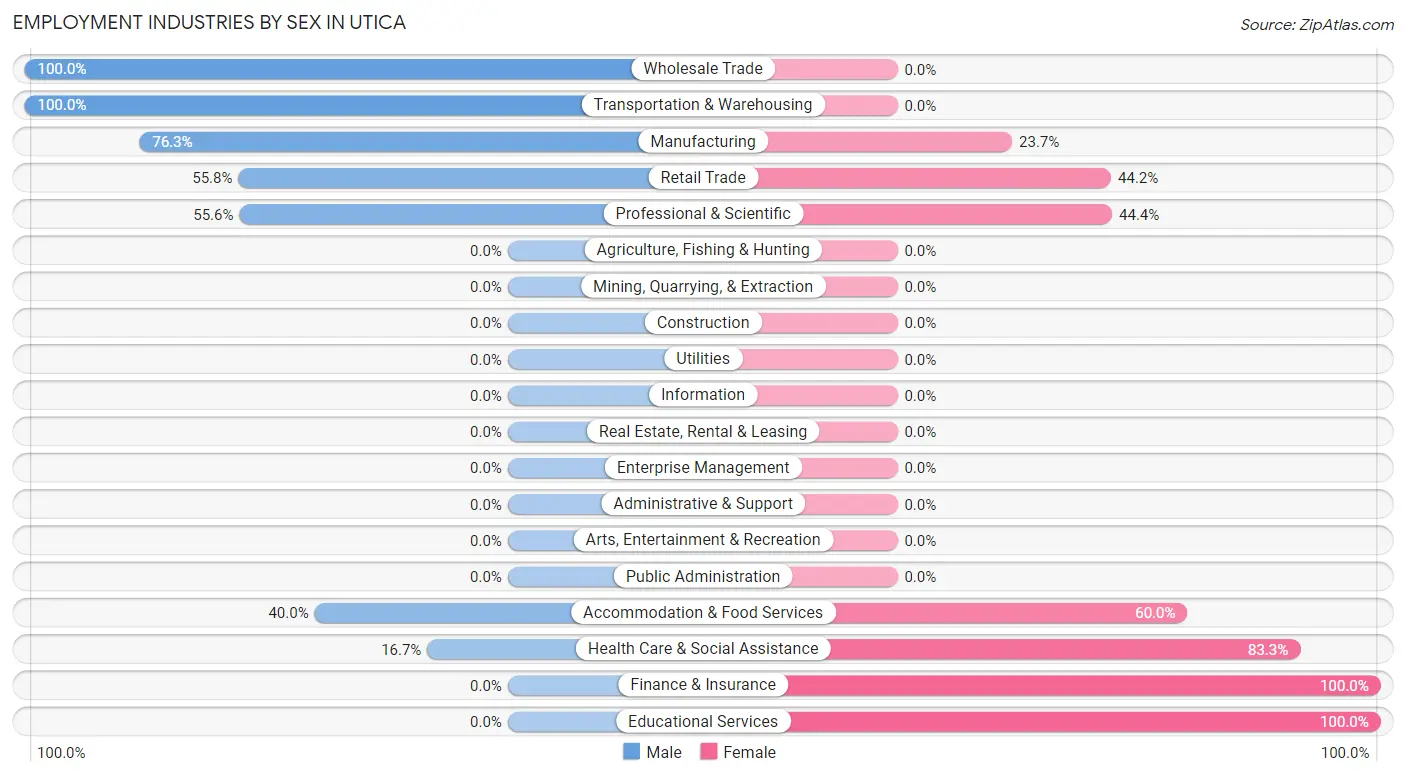
Employment Industries by Sex in Utica
The Utica industries that see more men than women are Wholesale Trade (100.0%), Transportation & Warehousing (100.0%), and Manufacturing (76.3%), whereas the industries that tend to have a higher number of women are Finance & Insurance (100.0%), Educational Services (100.0%), and Health Care & Social Assistance (83.3%).
| Industry | Male | Female |
| Agriculture, Fishing & Hunting | 0 (0.0%) | 0 (0.0%) |
| Mining, Quarrying, & Extraction | 0 (0.0%) | 0 (0.0%) |
| Construction | 0 (0.0%) | 0 (0.0%) |
| Manufacturing | 106 (76.3%) | 33 (23.7%) |
| Wholesale Trade | 7 (100.0%) | 0 (0.0%) |
| Retail Trade | 29 (55.8%) | 23 (44.2%) |
| Transportation & Warehousing | 138 (100.0%) | 0 (0.0%) |
| Utilities | 0 (0.0%) | 0 (0.0%) |
| Information | 0 (0.0%) | 0 (0.0%) |
| Finance & Insurance | 0 (0.0%) | 310 (100.0%) |
| Real Estate, Rental & Leasing | 0 (0.0%) | 0 (0.0%) |
| Professional & Scientific | 10 (55.6%) | 8 (44.4%) |
| Enterprise Management | 0 (0.0%) | 0 (0.0%) |
| Administrative & Support | 0 (0.0%) | 0 (0.0%) |
| Educational Services | 0 (0.0%) | 29 (100.0%) |
| Health Care & Social Assistance | 8 (16.7%) | 40 (83.3%) |
| Arts, Entertainment & Recreation | 0 (0.0%) | 0 (0.0%) |
| Accommodation & Food Services | 12 (40.0%) | 18 (60.0%) |
| Public Administration | 0 (0.0%) | 0 (0.0%) |
| Total | 327 (41.5%) | 461 (58.5%) |
Education in Utica
School Enrollment in Utica
The most common levels of schooling among the 522 students in Utica are kindergarten (142 | 27.2%), middle school (136 | 26.1%), and elementary school (115 | 22.0%).
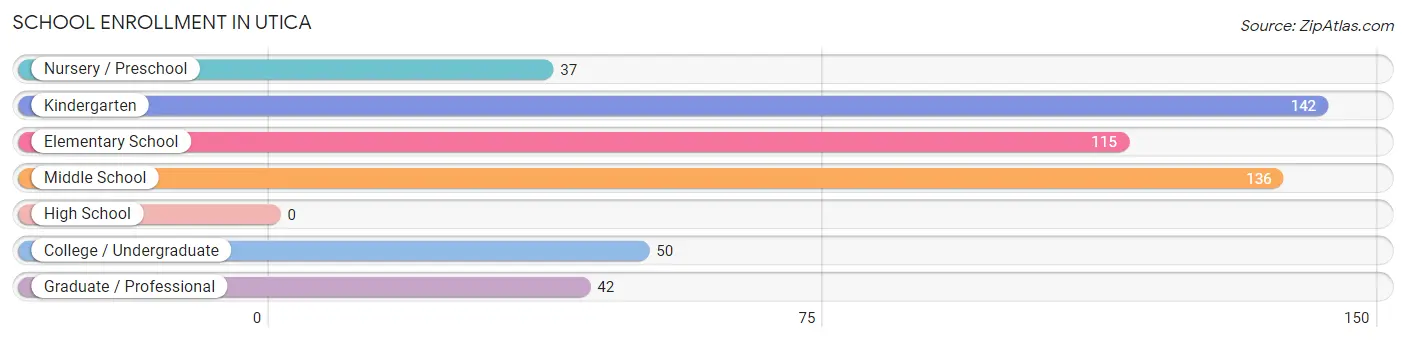
| School Level | # Students | % Students |
| Nursery / Preschool | 37 | 7.1% |
| Kindergarten | 142 | 27.2% |
| Elementary School | 115 | 22.0% |
| Middle School | 136 | 26.1% |
| High School | 0 | 0.0% |
| College / Undergraduate | 50 | 9.6% |
| Graduate / Professional | 42 | 8.1% |
| Total | 522 | 100.0% |
School Enrollment by Age by Funding Source in Utica
Out of a total of 522 students who are enrolled in schools in Utica, 85 (16.3%) attend a private institution, while the remaining 437 (83.7%) are enrolled in public schools. The age group of 18 to 19 year olds has the highest likelihood of being enrolled in private schools, with 10 (100.0% in the age bracket) enrolled. Conversely, the age group of 3 to 4 year olds has the lowest likelihood of being enrolled in a private school, with 37 (100.0% in the age bracket) attending a public institution.
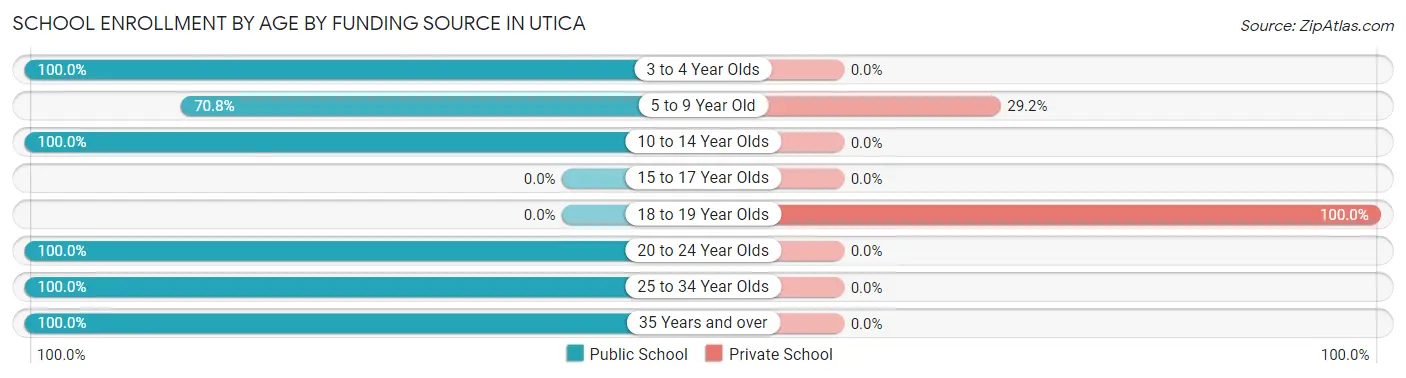
| Age Bracket | Public School | Private School |
| 3 to 4 Year Olds | 37 (100.0%) | 0 (0.0%) |
| 5 to 9 Year Old | 182 (70.8%) | 75 (29.2%) |
| 10 to 14 Year Olds | 136 (100.0%) | 0 (0.0%) |
| 15 to 17 Year Olds | 0 (0.0%) | 0 (0.0%) |
| 18 to 19 Year Olds | 0 (0.0%) | 10 (100.0%) |
| 20 to 24 Year Olds | 22 (100.0%) | 0 (0.0%) |
| 25 to 34 Year Olds | 41 (100.0%) | 0 (0.0%) |
| 35 Years and over | 19 (100.0%) | 0 (0.0%) |
| Total | 437 (83.7%) | 85 (16.3%) |
Educational Attainment by Field of Study in Utica
Visual & performing arts (63 | 61.8%), liberal arts & history (22 | 21.6%), engineering (10 | 9.8%), and business (7 | 6.9%) are the most common fields of study among 102 individuals in Utica who have obtained a bachelor's degree or higher.
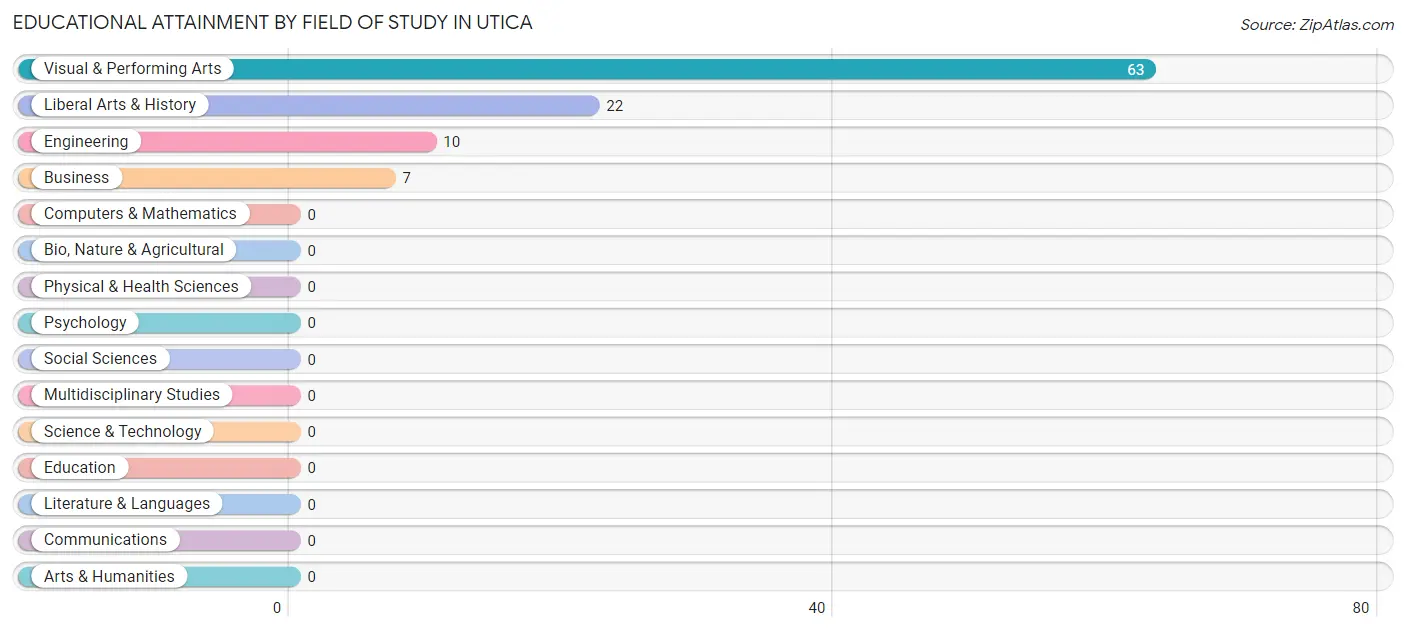
| Field of Study | # Graduates | % Graduates |
| Computers & Mathematics | 0 | 0.0% |
| Bio, Nature & Agricultural | 0 | 0.0% |
| Physical & Health Sciences | 0 | 0.0% |
| Psychology | 0 | 0.0% |
| Social Sciences | 0 | 0.0% |
| Engineering | 10 | 9.8% |
| Multidisciplinary Studies | 0 | 0.0% |
| Science & Technology | 0 | 0.0% |
| Business | 7 | 6.9% |
| Education | 0 | 0.0% |
| Literature & Languages | 0 | 0.0% |
| Liberal Arts & History | 22 | 21.6% |
| Visual & Performing Arts | 63 | 61.8% |
| Communications | 0 | 0.0% |
| Arts & Humanities | 0 | 0.0% |
| Total | 102 | 100.0% |
Transportation & Commute in Utica
Vehicle Availability by Sex in Utica
The most prevalent vehicle ownership categories in Utica are males with 2 vehicles (197, accounting for 60.2%) and females with 2 vehicles (92, making up 47.5%).
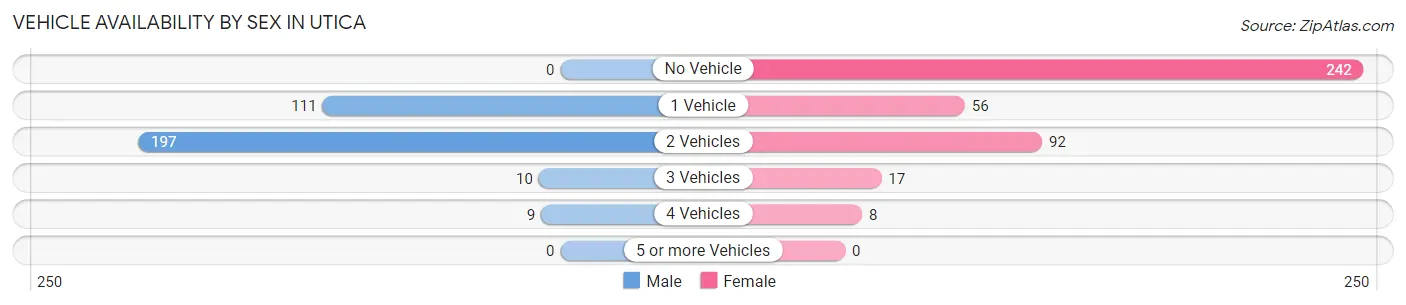
| Vehicles Available | Male | Female |
| No Vehicle | 0 (0.0%) | 242 (58.3%) |
| 1 Vehicle | 111 (33.9%) | 56 (13.5%) |
| 2 Vehicles | 197 (60.2%) | 92 (22.2%) |
| 3 Vehicles | 10 (3.1%) | 17 (4.1%) |
| 4 Vehicles | 9 (2.8%) | 8 (1.9%) |
| 5 or more Vehicles | 0 (0.0%) | 0 (0.0%) |
| Total | 327 (100.0%) | 415 (100.0%) |
Commute Time in Utica
The most frequently occuring commute durations in Utica are 15 to 19 minutes (283 commuters, 43.1%), 60 to 89 minutes (168 commuters, 25.6%), and 25 to 29 minutes (70 commuters, 10.7%).
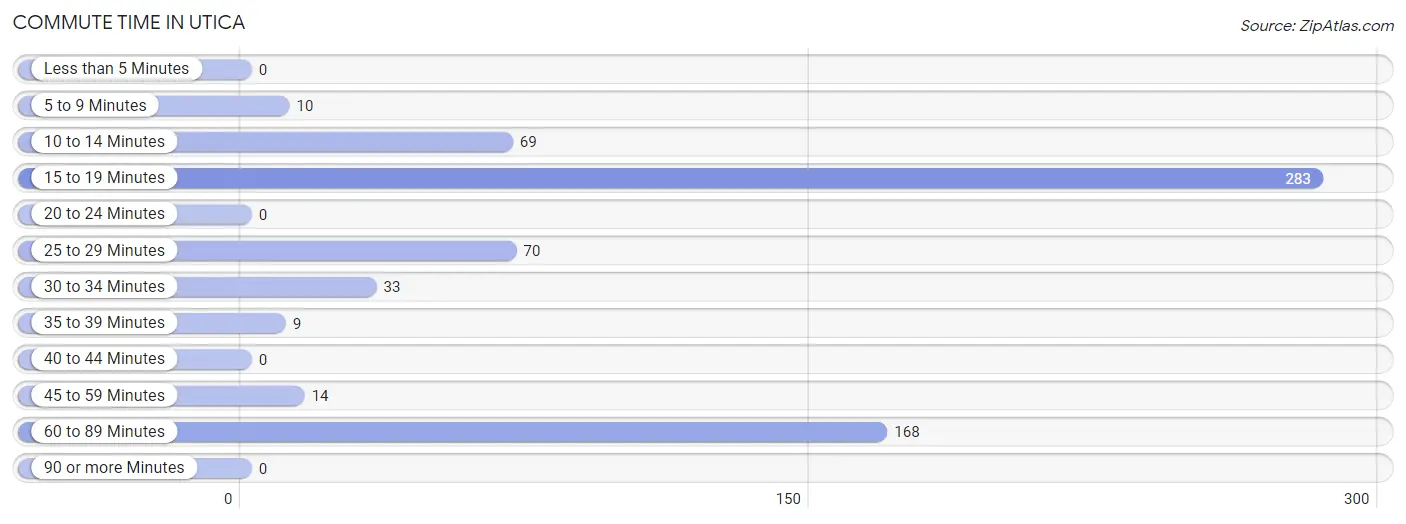
| Commute Time | # Commuters | % Commuters |
| Less than 5 Minutes | 0 | 0.0% |
| 5 to 9 Minutes | 10 | 1.5% |
| 10 to 14 Minutes | 69 | 10.5% |
| 15 to 19 Minutes | 283 | 43.1% |
| 20 to 24 Minutes | 0 | 0.0% |
| 25 to 29 Minutes | 70 | 10.7% |
| 30 to 34 Minutes | 33 | 5.0% |
| 35 to 39 Minutes | 9 | 1.4% |
| 40 to 44 Minutes | 0 | 0.0% |
| 45 to 59 Minutes | 14 | 2.1% |
| 60 to 89 Minutes | 168 | 25.6% |
| 90 or more Minutes | 0 | 0.0% |
Commute Time by Sex in Utica
The most common commute times in Utica are 60 to 89 minutes (160 commuters, 50.5%) for males and 15 to 19 minutes (242 commuters, 71.4%) for females.
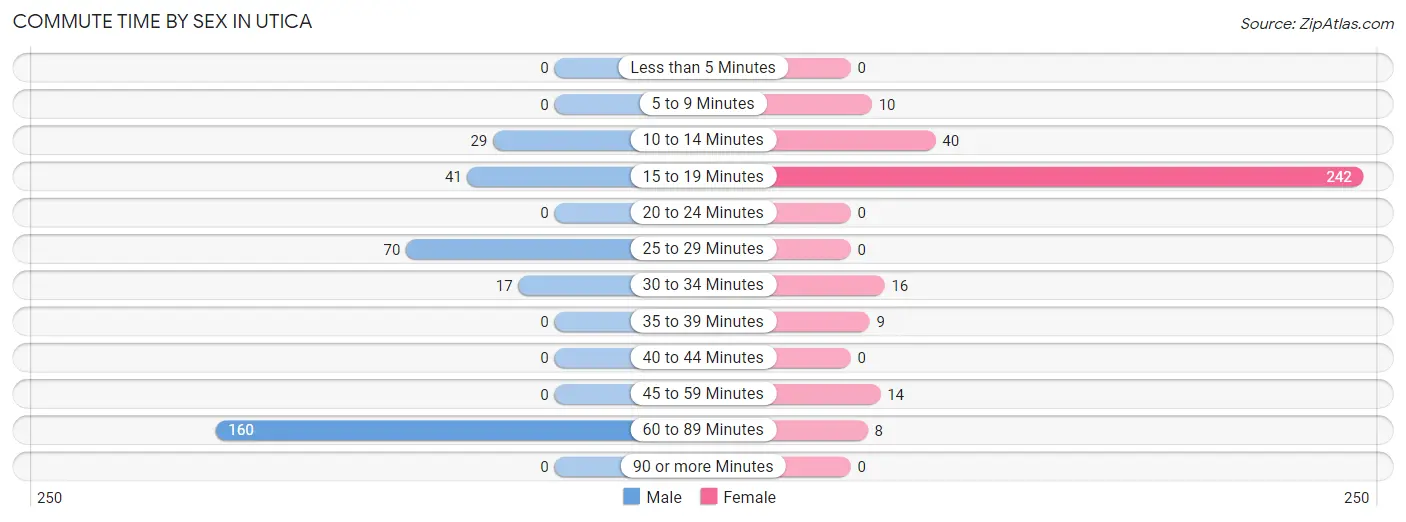
| Commute Time | Male | Female |
| Less than 5 Minutes | 0 (0.0%) | 0 (0.0%) |
| 5 to 9 Minutes | 0 (0.0%) | 10 (2.9%) |
| 10 to 14 Minutes | 29 (9.1%) | 40 (11.8%) |
| 15 to 19 Minutes | 41 (12.9%) | 242 (71.4%) |
| 20 to 24 Minutes | 0 (0.0%) | 0 (0.0%) |
| 25 to 29 Minutes | 70 (22.1%) | 0 (0.0%) |
| 30 to 34 Minutes | 17 (5.4%) | 16 (4.7%) |
| 35 to 39 Minutes | 0 (0.0%) | 9 (2.6%) |
| 40 to 44 Minutes | 0 (0.0%) | 0 (0.0%) |
| 45 to 59 Minutes | 0 (0.0%) | 14 (4.1%) |
| 60 to 89 Minutes | 160 (50.5%) | 8 (2.4%) |
| 90 or more Minutes | 0 (0.0%) | 0 (0.0%) |
Time of Departure to Work by Sex in Utica
The most frequent times of departure to work in Utica are 12:00 AM to 4:59 AM (160, 50.5%) for males and 6:00 AM to 6:29 AM (250, 73.8%) for females.
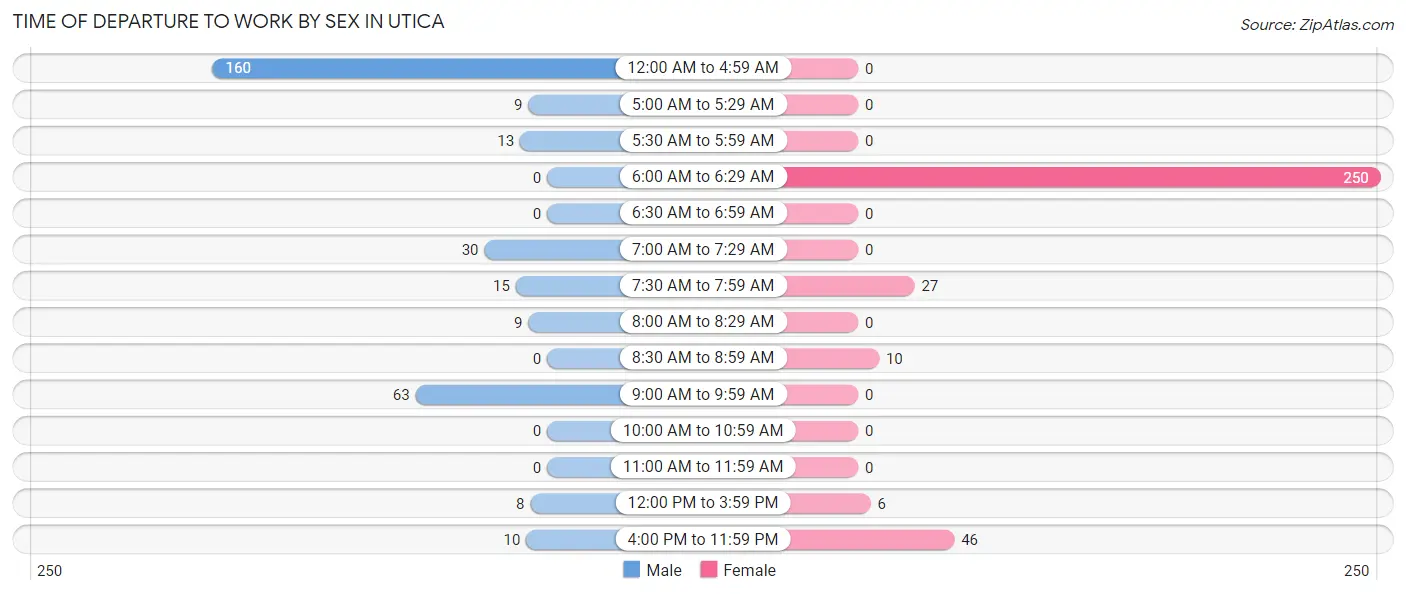
| Time of Departure | Male | Female |
| 12:00 AM to 4:59 AM | 160 (50.5%) | 0 (0.0%) |
| 5:00 AM to 5:29 AM | 9 (2.8%) | 0 (0.0%) |
| 5:30 AM to 5:59 AM | 13 (4.1%) | 0 (0.0%) |
| 6:00 AM to 6:29 AM | 0 (0.0%) | 250 (73.8%) |
| 6:30 AM to 6:59 AM | 0 (0.0%) | 0 (0.0%) |
| 7:00 AM to 7:29 AM | 30 (9.5%) | 0 (0.0%) |
| 7:30 AM to 7:59 AM | 15 (4.7%) | 27 (8.0%) |
| 8:00 AM to 8:29 AM | 9 (2.8%) | 0 (0.0%) |
| 8:30 AM to 8:59 AM | 0 (0.0%) | 10 (2.9%) |
| 9:00 AM to 9:59 AM | 63 (19.9%) | 0 (0.0%) |
| 10:00 AM to 10:59 AM | 0 (0.0%) | 0 (0.0%) |
| 11:00 AM to 11:59 AM | 0 (0.0%) | 0 (0.0%) |
| 12:00 PM to 3:59 PM | 8 (2.5%) | 6 (1.8%) |
| 4:00 PM to 11:59 PM | 10 (3.2%) | 46 (13.6%) |
| Total | 317 (100.0%) | 339 (100.0%) |
Housing Occupancy in Utica
Occupancy by Ownership in Utica
Of the total 782 dwellings in Utica, owner-occupied units account for 330 (42.2%), while renter-occupied units make up 452 (57.8%).
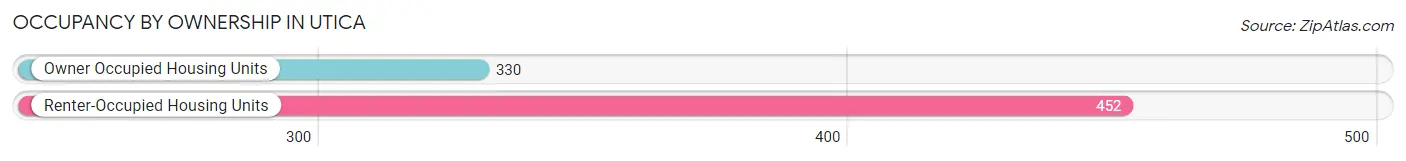
| Occupancy | # Housing Units | % Housing Units |
| Owner Occupied Housing Units | 330 | 42.2% |
| Renter-Occupied Housing Units | 452 | 57.8% |
| Total Occupied Housing Units | 782 | 100.0% |
Occupancy by Household Size in Utica
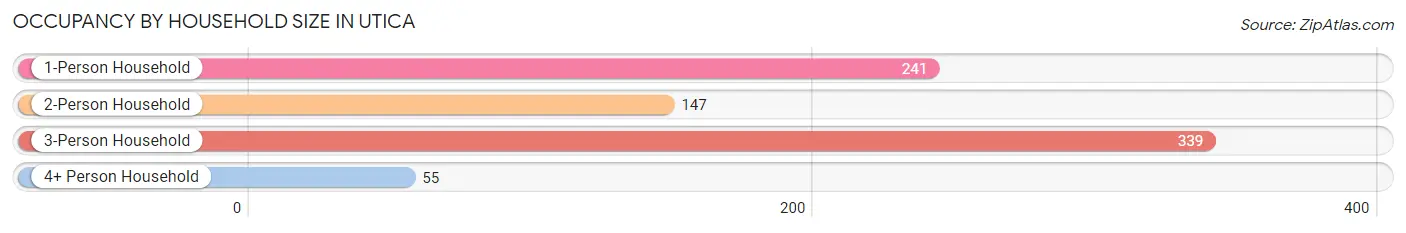
| Household Size | # Housing Units | % Housing Units |
| 1-Person Household | 241 | 30.8% |
| 2-Person Household | 147 | 18.8% |
| 3-Person Household | 339 | 43.3% |
| 4+ Person Household | 55 | 7.0% |
| Total Housing Units | 782 | 100.0% |
Occupancy by Ownership by Household Size in Utica
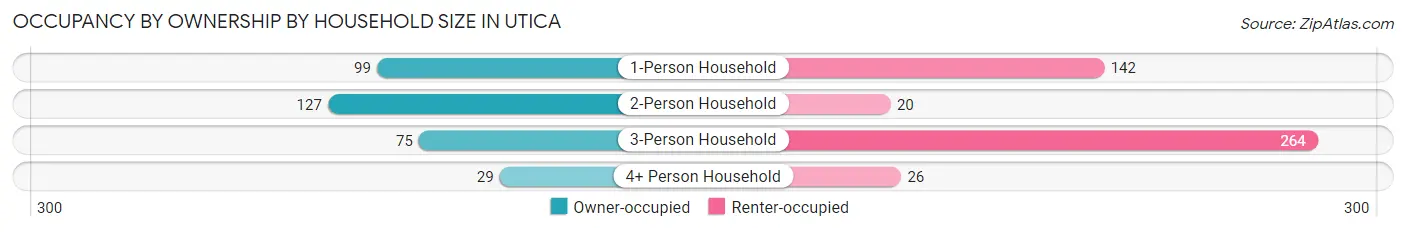
| Household Size | Owner-occupied | Renter-occupied |
| 1-Person Household | 99 (41.1%) | 142 (58.9%) |
| 2-Person Household | 127 (86.4%) | 20 (13.6%) |
| 3-Person Household | 75 (22.1%) | 264 (77.9%) |
| 4+ Person Household | 29 (52.7%) | 26 (47.3%) |
| Total Housing Units | 330 (42.2%) | 452 (57.8%) |
Occupancy by Educational Attainment in Utica
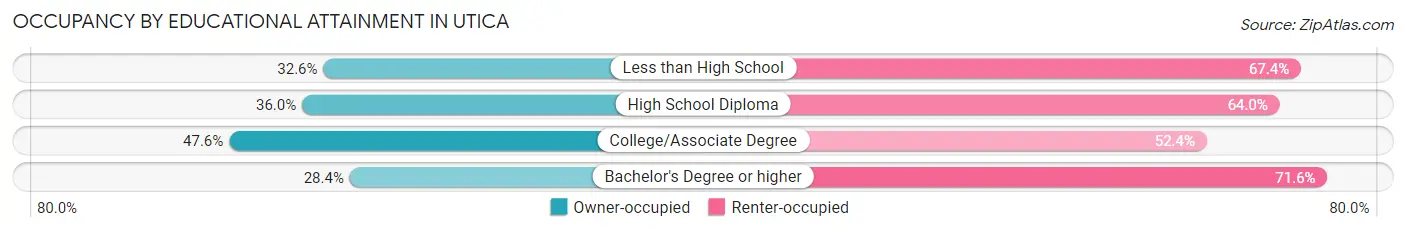
| Household Size | Owner-occupied | Renter-occupied |
| Less than High School | 30 (32.6%) | 62 (67.4%) |
| High School Diploma | 27 (36.0%) | 48 (64.0%) |
| College/Associate Degree | 244 (47.6%) | 269 (52.4%) |
| Bachelor's Degree or higher | 29 (28.4%) | 73 (71.6%) |
Occupancy by Age of Householder in Utica
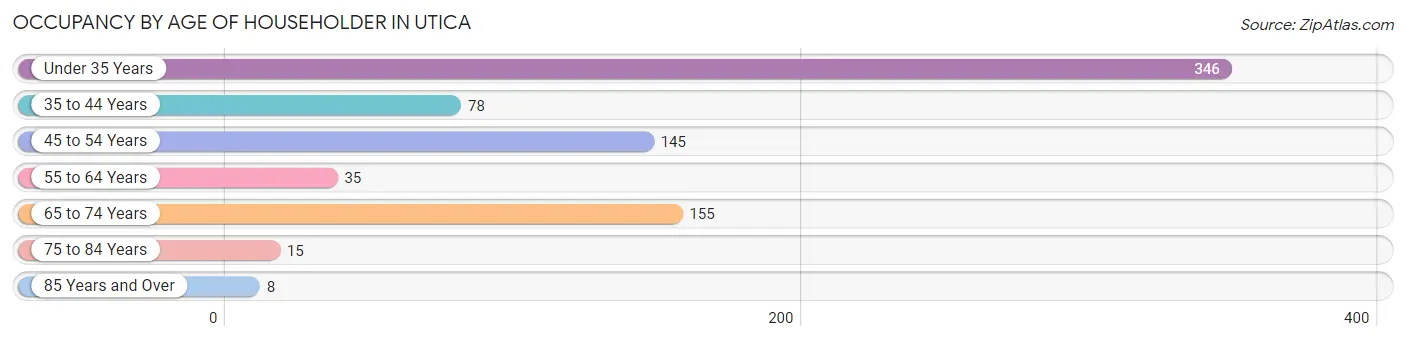
| Age Bracket | # Households | % Households |
| Under 35 Years | 346 | 44.3% |
| 35 to 44 Years | 78 | 10.0% |
| 45 to 54 Years | 145 | 18.5% |
| 55 to 64 Years | 35 | 4.5% |
| 65 to 74 Years | 155 | 19.8% |
| 75 to 84 Years | 15 | 1.9% |
| 85 Years and Over | 8 | 1.0% |
| Total | 782 | 100.0% |
Housing Finances in Utica
Median Income by Occupancy in Utica
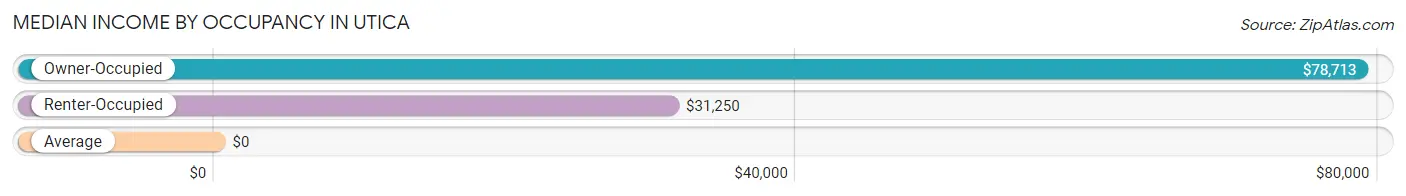
| Occupancy Type | # Households | Median Income |
| Owner-Occupied | 330 (42.2%) | $78,713 |
| Renter-Occupied | 452 (57.8%) | $31,250 |
| Average | 782 (100.0%) | $0 |
Occupancy by Householder Income Bracket in Utica
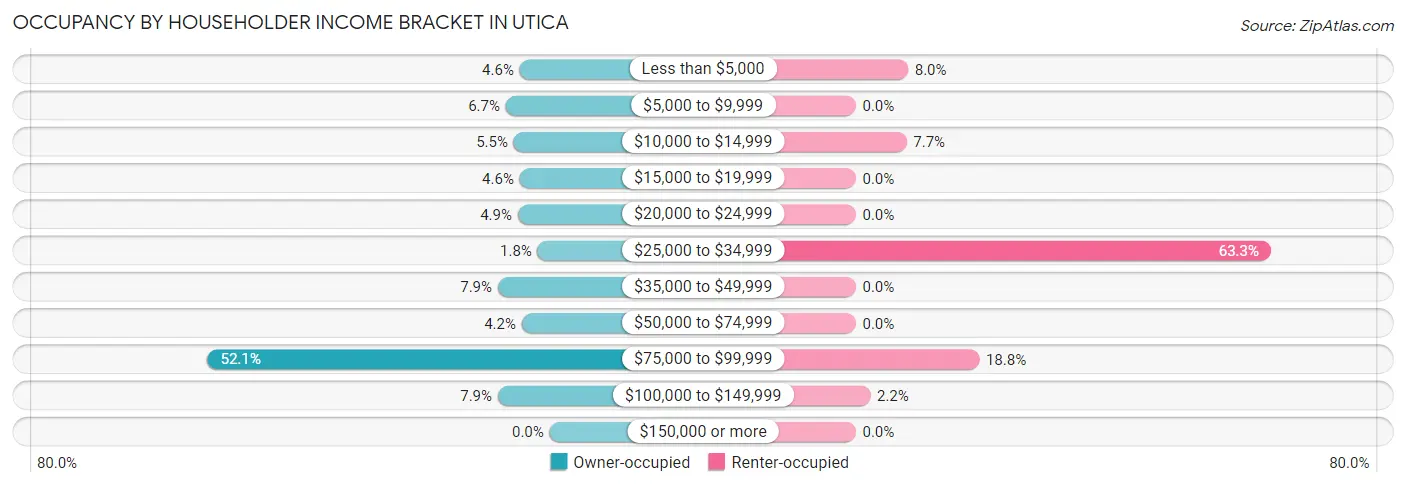
| Income Bracket | Owner-occupied | Renter-occupied |
| Less than $5,000 | 15 (4.5%) | 36 (8.0%) |
| $5,000 to $9,999 | 22 (6.7%) | 0 (0.0%) |
| $10,000 to $14,999 | 18 (5.4%) | 35 (7.7%) |
| $15,000 to $19,999 | 15 (4.5%) | 0 (0.0%) |
| $20,000 to $24,999 | 16 (4.9%) | 0 (0.0%) |
| $25,000 to $34,999 | 6 (1.8%) | 286 (63.3%) |
| $35,000 to $49,999 | 26 (7.9%) | 0 (0.0%) |
| $50,000 to $74,999 | 14 (4.2%) | 0 (0.0%) |
| $75,000 to $99,999 | 172 (52.1%) | 85 (18.8%) |
| $100,000 to $149,999 | 26 (7.9%) | 10 (2.2%) |
| $150,000 or more | 0 (0.0%) | 0 (0.0%) |
| Total | 330 (100.0%) | 452 (100.0%) |
Monthly Housing Cost Tiers in Utica
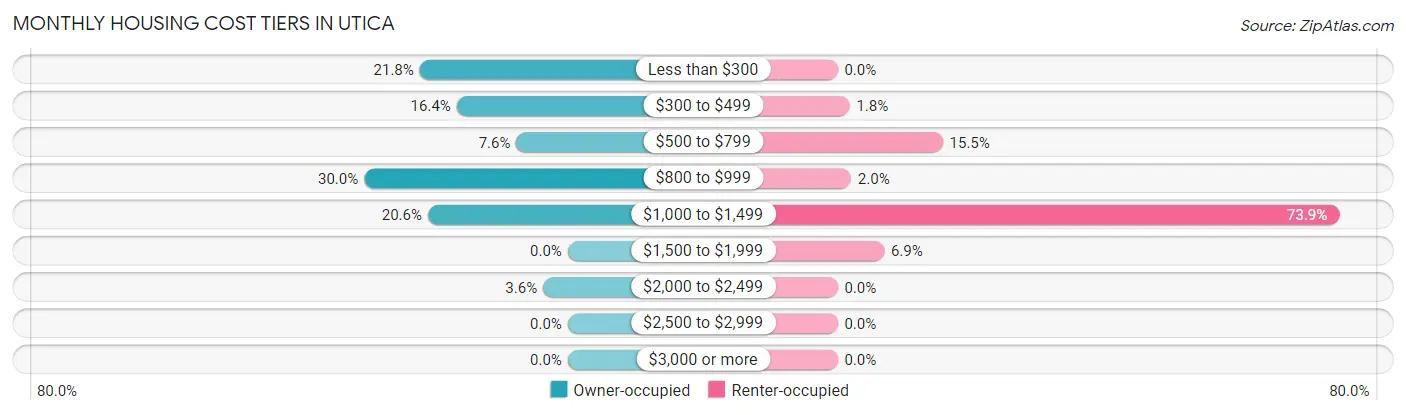
| Monthly Cost | Owner-occupied | Renter-occupied |
| Less than $300 | 72 (21.8%) | 0 (0.0%) |
| $300 to $499 | 54 (16.4%) | 8 (1.8%) |
| $500 to $799 | 25 (7.6%) | 70 (15.5%) |
| $800 to $999 | 99 (30.0%) | 9 (2.0%) |
| $1,000 to $1,499 | 68 (20.6%) | 334 (73.9%) |
| $1,500 to $1,999 | 0 (0.0%) | 31 (6.9%) |
| $2,000 to $2,499 | 12 (3.6%) | 0 (0.0%) |
| $2,500 to $2,999 | 0 (0.0%) | 0 (0.0%) |
| $3,000 or more | 0 (0.0%) | 0 (0.0%) |
| Total | 330 (100.0%) | 452 (100.0%) |
Physical Housing Characteristics in Utica
Housing Structures in Utica
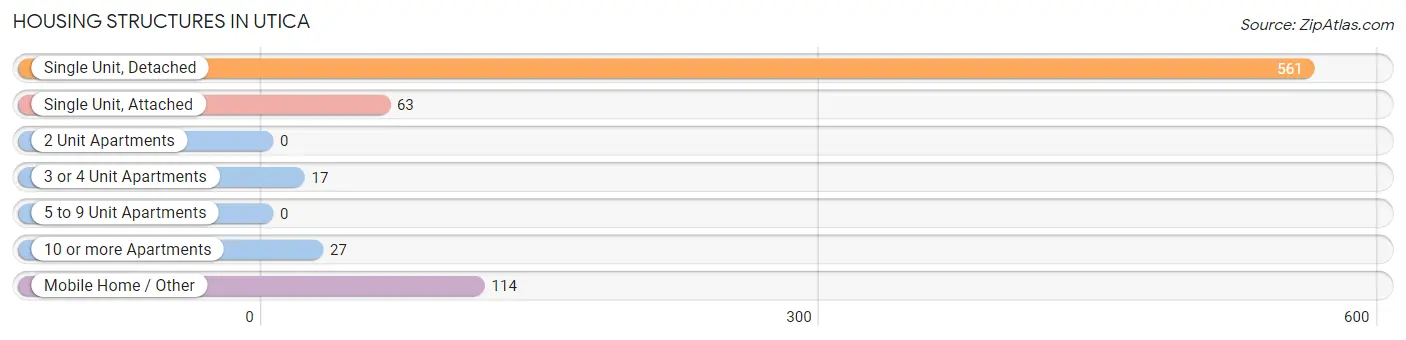
| Structure Type | # Housing Units | % Housing Units |
| Single Unit, Detached | 561 | 71.7% |
| Single Unit, Attached | 63 | 8.1% |
| 2 Unit Apartments | 0 | 0.0% |
| 3 or 4 Unit Apartments | 17 | 2.2% |
| 5 to 9 Unit Apartments | 0 | 0.0% |
| 10 or more Apartments | 27 | 3.5% |
| Mobile Home / Other | 114 | 14.6% |
| Total | 782 | 100.0% |
Housing Structures by Occupancy in Utica
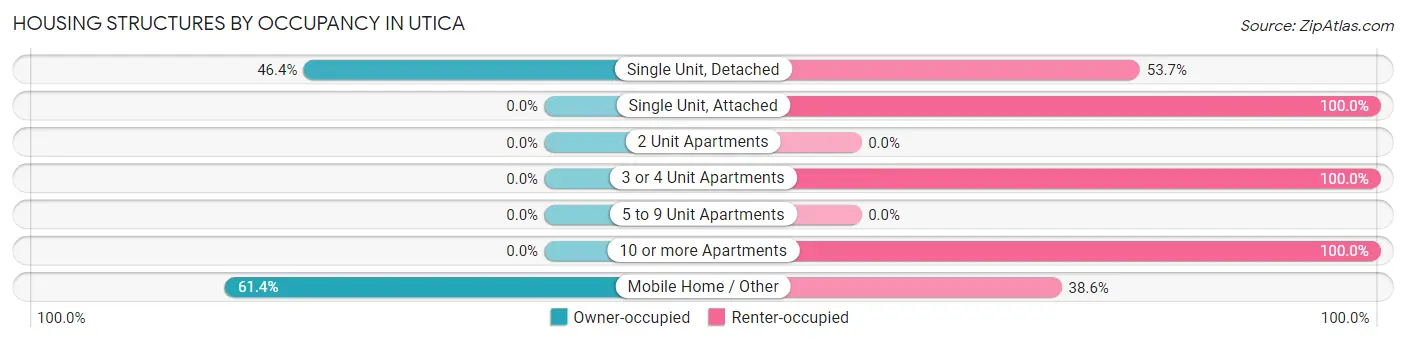
| Structure Type | Owner-occupied | Renter-occupied |
| Single Unit, Detached | 260 (46.4%) | 301 (53.6%) |
| Single Unit, Attached | 0 (0.0%) | 63 (100.0%) |
| 2 Unit Apartments | 0 (0.0%) | 0 (0.0%) |
| 3 or 4 Unit Apartments | 0 (0.0%) | 17 (100.0%) |
| 5 to 9 Unit Apartments | 0 (0.0%) | 0 (0.0%) |
| 10 or more Apartments | 0 (0.0%) | 27 (100.0%) |
| Mobile Home / Other | 70 (61.4%) | 44 (38.6%) |
| Total | 330 (42.2%) | 452 (57.8%) |
Housing Structures by Number of Rooms in Utica
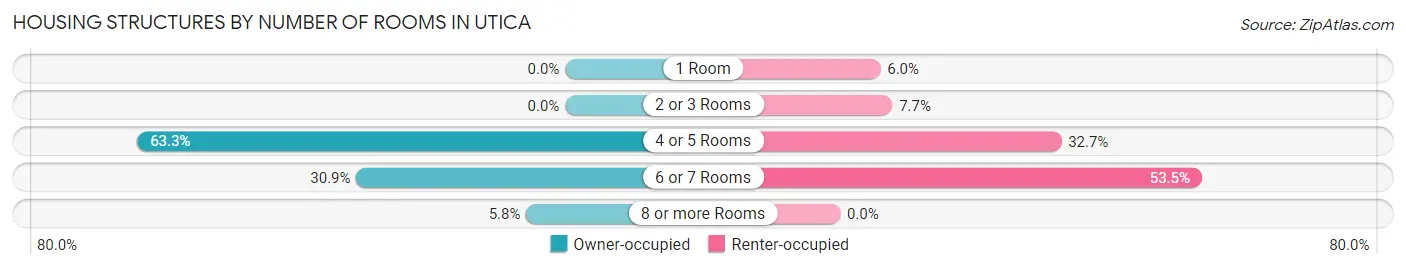
| Number of Rooms | Owner-occupied | Renter-occupied |
| 1 Room | 0 (0.0%) | 27 (6.0%) |
| 2 or 3 Rooms | 0 (0.0%) | 35 (7.7%) |
| 4 or 5 Rooms | 209 (63.3%) | 148 (32.7%) |
| 6 or 7 Rooms | 102 (30.9%) | 242 (53.5%) |
| 8 or more Rooms | 19 (5.8%) | 0 (0.0%) |
| Total | 330 (100.0%) | 452 (100.0%) |
Housing Structure by Heating Type in Utica
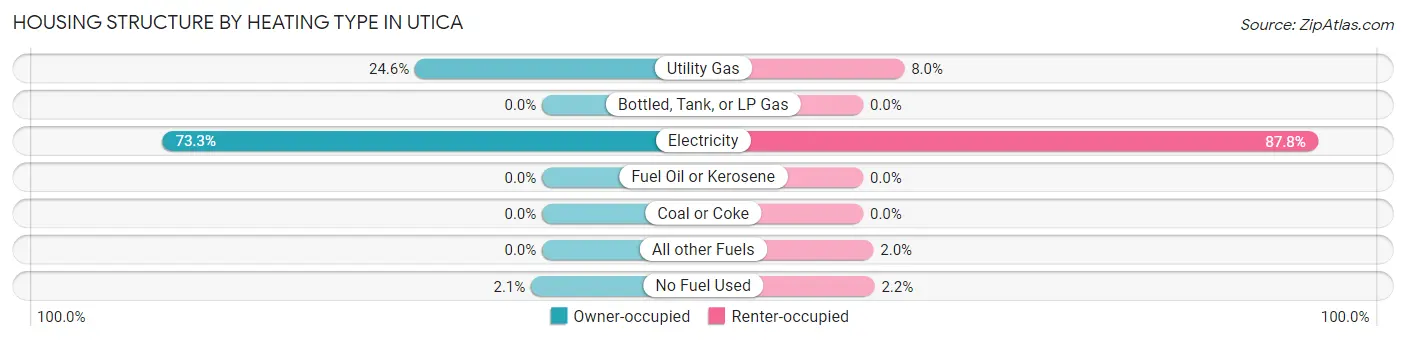
| Heating Type | Owner-occupied | Renter-occupied |
| Utility Gas | 81 (24.5%) | 36 (8.0%) |
| Bottled, Tank, or LP Gas | 0 (0.0%) | 0 (0.0%) |
| Electricity | 242 (73.3%) | 397 (87.8%) |
| Fuel Oil or Kerosene | 0 (0.0%) | 0 (0.0%) |
| Coal or Coke | 0 (0.0%) | 0 (0.0%) |
| All other Fuels | 0 (0.0%) | 9 (2.0%) |
| No Fuel Used | 7 (2.1%) | 10 (2.2%) |
| Total | 330 (100.0%) | 452 (100.0%) |
Household Vehicle Usage in Utica
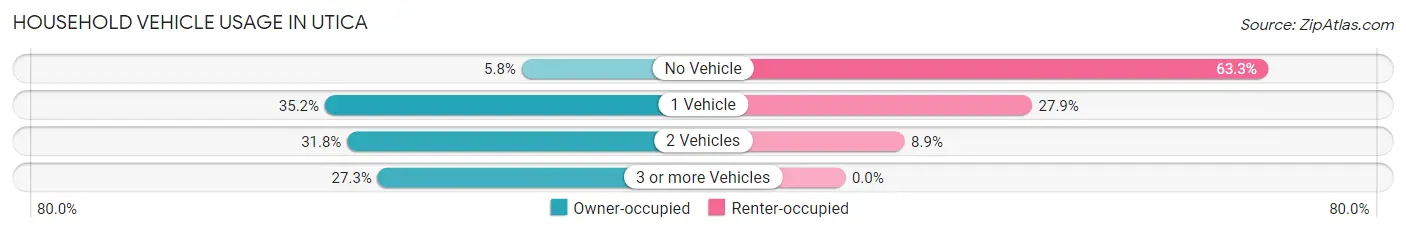
| Vehicles per Household | Owner-occupied | Renter-occupied |
| No Vehicle | 19 (5.8%) | 286 (63.3%) |
| 1 Vehicle | 116 (35.1%) | 126 (27.9%) |
| 2 Vehicles | 105 (31.8%) | 40 (8.8%) |
| 3 or more Vehicles | 90 (27.3%) | 0 (0.0%) |
| Total | 330 (100.0%) | 452 (100.0%) |
Real Estate & Mortgages in Utica
Real Estate and Mortgage Overview in Utica
| Characteristic | Without Mortgage | With Mortgage |
| Housing Units | 126 | 204 |
| Median Property Value | $28,400 | $145,800 |
| Median Household Income | - | - |
| Monthly Housing Costs | $292 | $0 |
| Real Estate Taxes | $239 | $12 |
Property Value by Mortgage Status in Utica
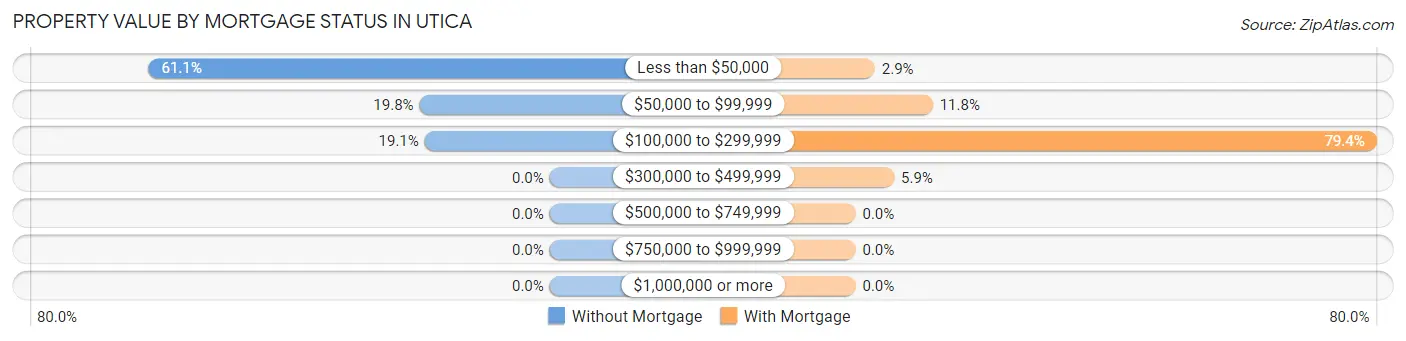
| Property Value | Without Mortgage | With Mortgage |
| Less than $50,000 | 77 (61.1%) | 6 (2.9%) |
| $50,000 to $99,999 | 25 (19.8%) | 24 (11.8%) |
| $100,000 to $299,999 | 24 (19.1%) | 162 (79.4%) |
| $300,000 to $499,999 | 0 (0.0%) | 12 (5.9%) |
| $500,000 to $749,999 | 0 (0.0%) | 0 (0.0%) |
| $750,000 to $999,999 | 0 (0.0%) | 0 (0.0%) |
| $1,000,000 or more | 0 (0.0%) | 0 (0.0%) |
| Total | 126 (100.0%) | 204 (100.0%) |
Household Income by Mortgage Status in Utica
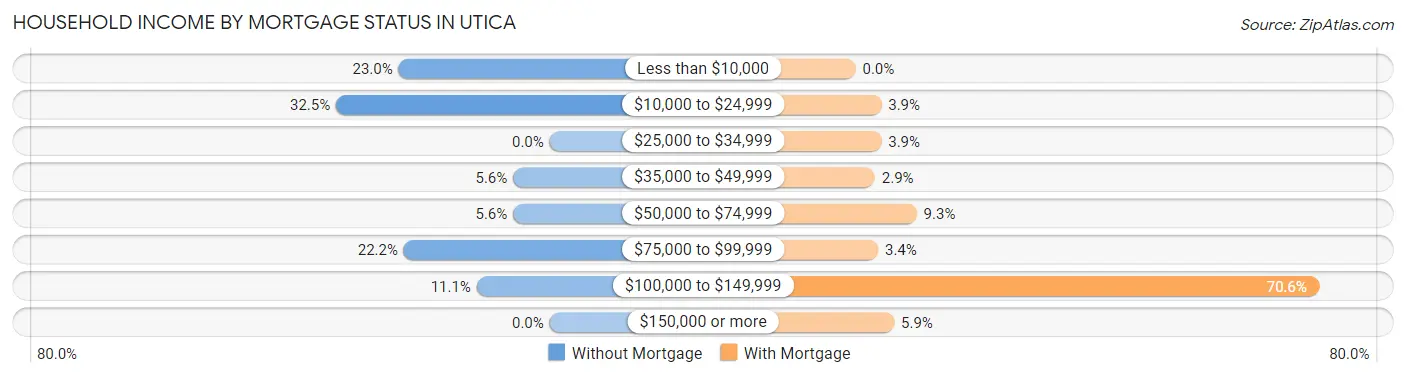
| Household Income | Without Mortgage | With Mortgage |
| Less than $10,000 | 29 (23.0%) | 0 (0.0%) |
| $10,000 to $24,999 | 41 (32.5%) | 8 (3.9%) |
| $25,000 to $34,999 | 0 (0.0%) | 8 (3.9%) |
| $35,000 to $49,999 | 7 (5.6%) | 6 (2.9%) |
| $50,000 to $74,999 | 7 (5.6%) | 19 (9.3%) |
| $75,000 to $99,999 | 28 (22.2%) | 7 (3.4%) |
| $100,000 to $149,999 | 14 (11.1%) | 144 (70.6%) |
| $150,000 or more | 0 (0.0%) | 12 (5.9%) |
| Total | 126 (100.0%) | 204 (100.0%) |
Property Value to Household Income Ratio in Utica
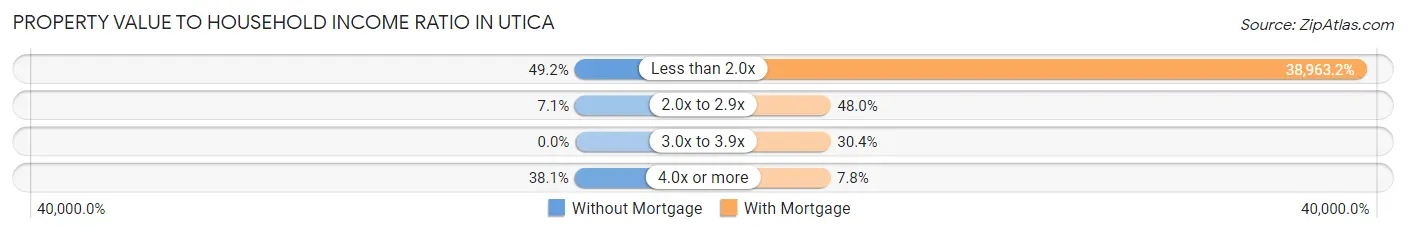
| Value-to-Income Ratio | Without Mortgage | With Mortgage |
| Less than 2.0x | 62 (49.2%) | 79,485 (38,963.2%) |
| 2.0x to 2.9x | 9 (7.1%) | 98 (48.0%) |
| 3.0x to 3.9x | 0 (0.0%) | 62 (30.4%) |
| 4.0x or more | 48 (38.1%) | 16 (7.8%) |
| Total | 126 (100.0%) | 204 (100.0%) |
Real Estate Taxes by Mortgage Status in Utica
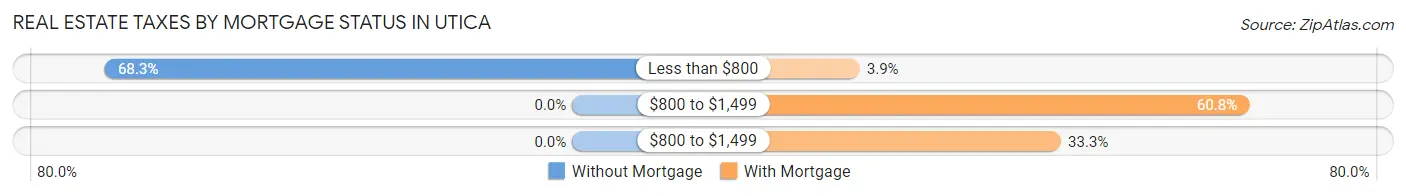
| Property Taxes | Without Mortgage | With Mortgage |
| Less than $800 | 86 (68.2%) | 8 (3.9%) |
| $800 to $1,499 | 0 (0.0%) | 124 (60.8%) |
| $800 to $1,499 | 0 (0.0%) | 68 (33.3%) |
| Total | 126 (100.0%) | 204 (100.0%) |
Health & Disability in Utica
Health Insurance Coverage by Age in Utica
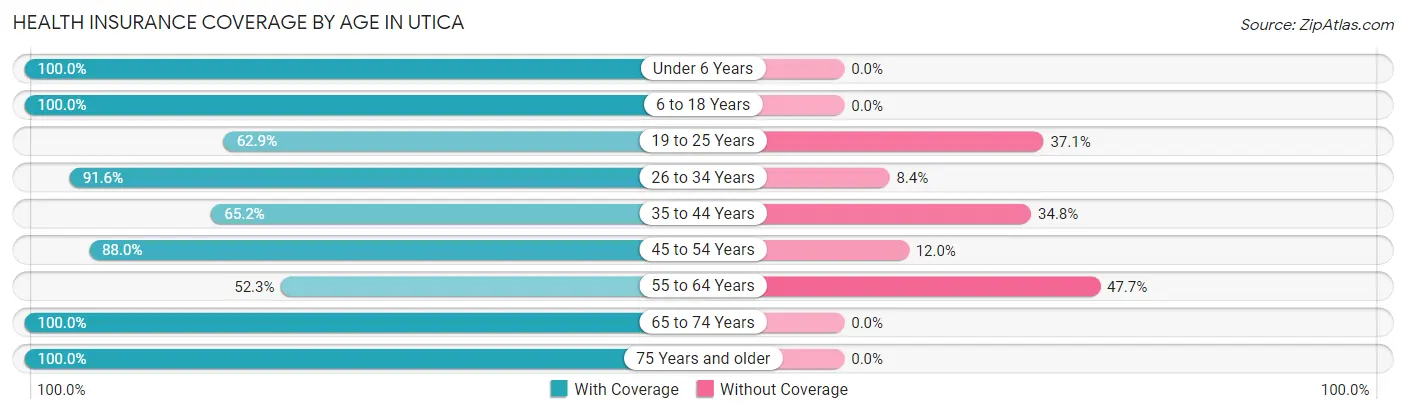
| Age Bracket | With Coverage | Without Coverage |
| Under 6 Years | 105 (100.0%) | 0 (0.0%) |
| 6 to 18 Years | 396 (100.0%) | 0 (0.0%) |
| 19 to 25 Years | 44 (62.9%) | 26 (37.1%) |
| 26 to 34 Years | 304 (91.6%) | 28 (8.4%) |
| 35 to 44 Years | 101 (65.2%) | 54 (34.8%) |
| 45 to 54 Years | 249 (88.0%) | 34 (12.0%) |
| 55 to 64 Years | 34 (52.3%) | 31 (47.7%) |
| 65 to 74 Years | 216 (100.0%) | 0 (0.0%) |
| 75 Years and older | 32 (100.0%) | 0 (0.0%) |
| Total | 1,481 (89.5%) | 173 (10.5%) |
Health Insurance Coverage by Citizenship Status in Utica
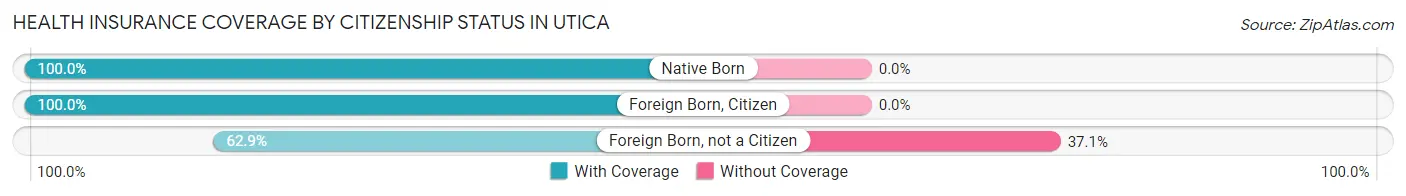
| Citizenship Status | With Coverage | Without Coverage |
| Native Born | 105 (100.0%) | 0 (0.0%) |
| Foreign Born, Citizen | 396 (100.0%) | 0 (0.0%) |
| Foreign Born, not a Citizen | 44 (62.9%) | 26 (37.1%) |
Health Insurance Coverage by Household Income in Utica
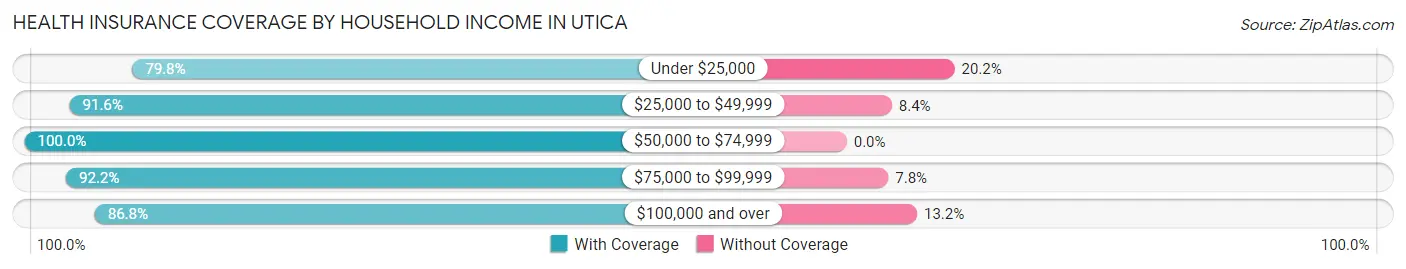
| Household Income | With Coverage | Without Coverage |
| Under $25,000 | 249 (79.8%) | 63 (20.2%) |
| $25,000 to $49,999 | 586 (91.6%) | 54 (8.4%) |
| $50,000 to $74,999 | 35 (100.0%) | 0 (0.0%) |
| $75,000 to $99,999 | 545 (92.2%) | 46 (7.8%) |
| $100,000 and over | 66 (86.8%) | 10 (13.2%) |
Public vs Private Health Insurance Coverage by Age in Utica
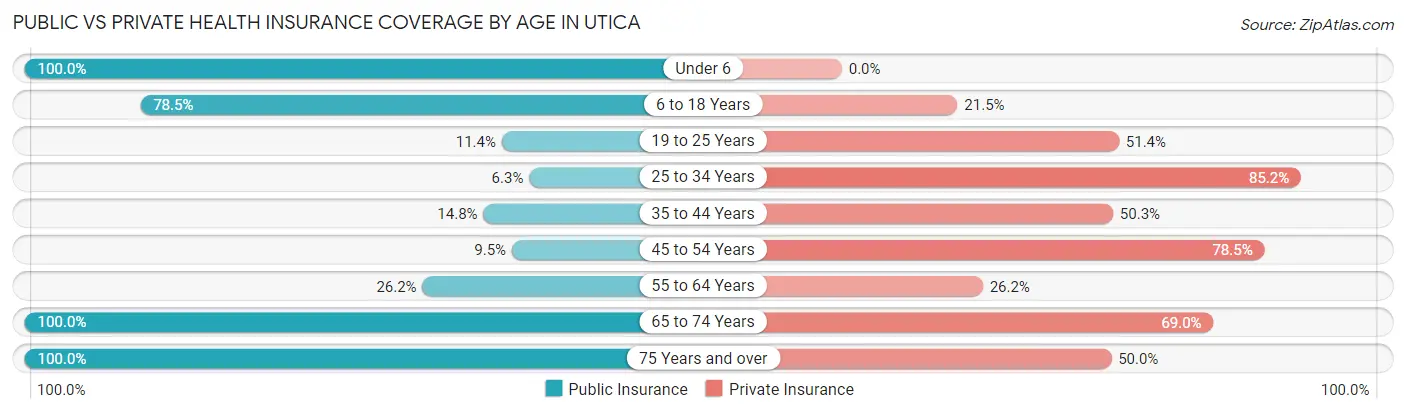
| Age Bracket | Public Insurance | Private Insurance |
| Under 6 | 105 (100.0%) | 0 (0.0%) |
| 6 to 18 Years | 311 (78.5%) | 85 (21.5%) |
| 19 to 25 Years | 8 (11.4%) | 36 (51.4%) |
| 25 to 34 Years | 21 (6.3%) | 283 (85.2%) |
| 35 to 44 Years | 23 (14.8%) | 78 (50.3%) |
| 45 to 54 Years | 27 (9.5%) | 222 (78.4%) |
| 55 to 64 Years | 17 (26.2%) | 17 (26.2%) |
| 65 to 74 Years | 216 (100.0%) | 149 (69.0%) |
| 75 Years and over | 32 (100.0%) | 16 (50.0%) |
| Total | 760 (46.0%) | 886 (53.6%) |
Disability Status by Sex by Age in Utica
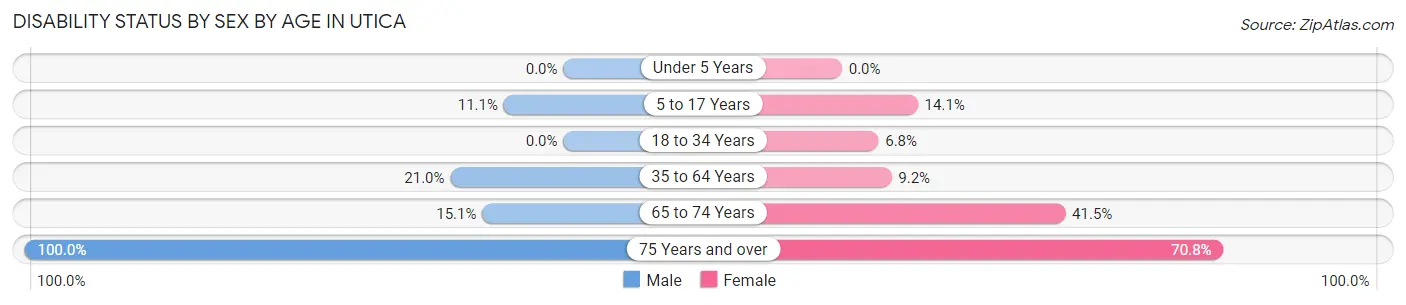
| Age Bracket | Male | Female |
| Under 5 Years | 0 (0.0%) | 0 (0.0%) |
| 5 to 17 Years | 21 (11.1%) | 30 (14.1%) |
| 18 to 34 Years | 0 (0.0%) | 22 (6.8%) |
| 35 to 64 Years | 69 (21.0%) | 16 (9.2%) |
| 65 to 74 Years | 14 (15.0%) | 51 (41.5%) |
| 75 Years and over | 8 (100.0%) | 17 (70.8%) |
Disability Class by Sex by Age in Utica
Disability Class: Hearing Difficulty
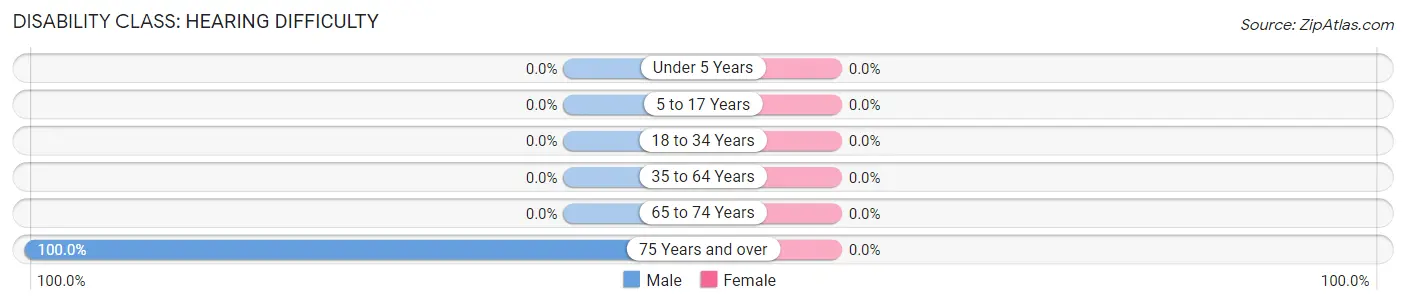
| Age Bracket | Male | Female |
| Under 5 Years | 0 (0.0%) | 0 (0.0%) |
| 5 to 17 Years | 0 (0.0%) | 0 (0.0%) |
| 18 to 34 Years | 0 (0.0%) | 0 (0.0%) |
| 35 to 64 Years | 0 (0.0%) | 0 (0.0%) |
| 65 to 74 Years | 0 (0.0%) | 0 (0.0%) |
| 75 Years and over | 8 (100.0%) | 0 (0.0%) |
Disability Class: Vision Difficulty
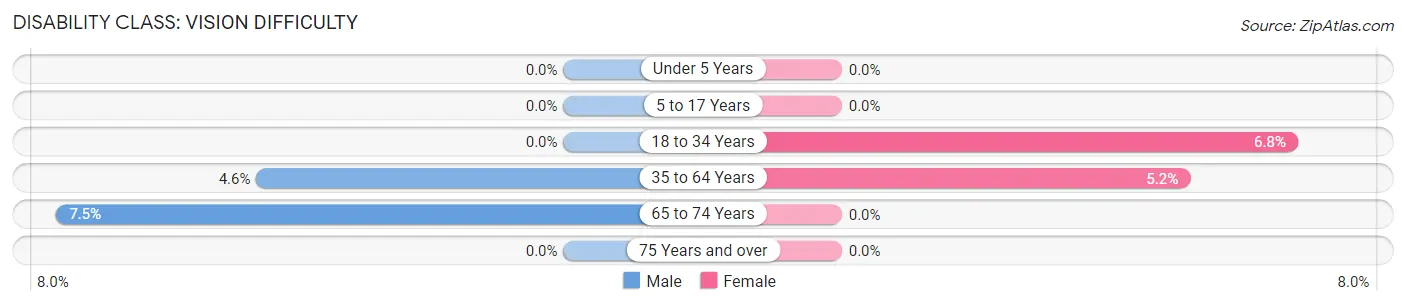
| Age Bracket | Male | Female |
| Under 5 Years | 0 (0.0%) | 0 (0.0%) |
| 5 to 17 Years | 0 (0.0%) | 0 (0.0%) |
| 18 to 34 Years | 0 (0.0%) | 22 (6.8%) |
| 35 to 64 Years | 15 (4.6%) | 9 (5.2%) |
| 65 to 74 Years | 7 (7.5%) | 0 (0.0%) |
| 75 Years and over | 0 (0.0%) | 0 (0.0%) |
Disability Class: Cognitive Difficulty
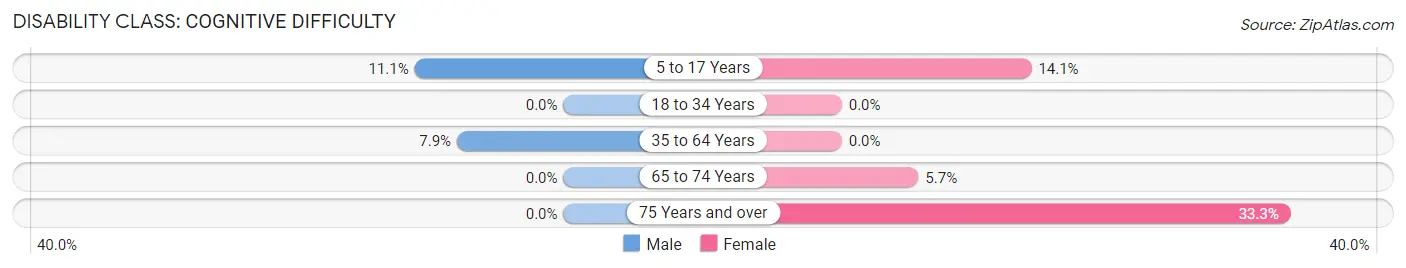
| Age Bracket | Male | Female |
| 5 to 17 Years | 21 (11.1%) | 30 (14.1%) |
| 18 to 34 Years | 0 (0.0%) | 0 (0.0%) |
| 35 to 64 Years | 26 (7.9%) | 0 (0.0%) |
| 65 to 74 Years | 0 (0.0%) | 7 (5.7%) |
| 75 Years and over | 0 (0.0%) | 8 (33.3%) |
Disability Class: Ambulatory Difficulty
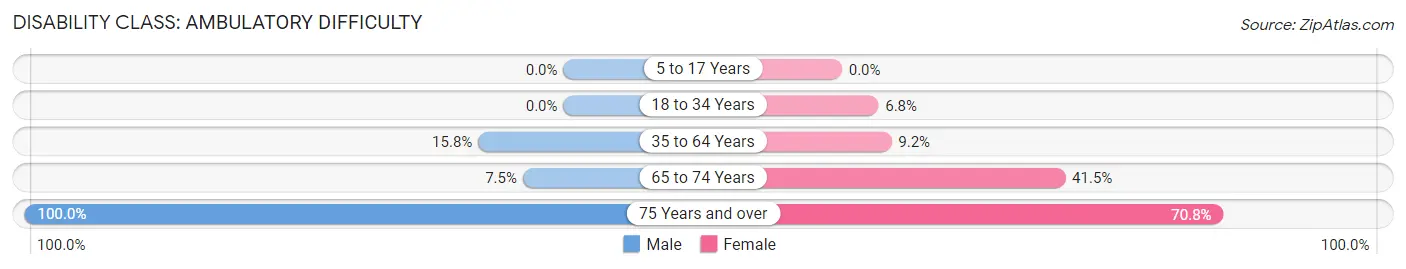
| Age Bracket | Male | Female |
| 5 to 17 Years | 0 (0.0%) | 0 (0.0%) |
| 18 to 34 Years | 0 (0.0%) | 22 (6.8%) |
| 35 to 64 Years | 52 (15.8%) | 16 (9.2%) |
| 65 to 74 Years | 7 (7.5%) | 51 (41.5%) |
| 75 Years and over | 8 (100.0%) | 17 (70.8%) |
Disability Class: Self-Care Difficulty
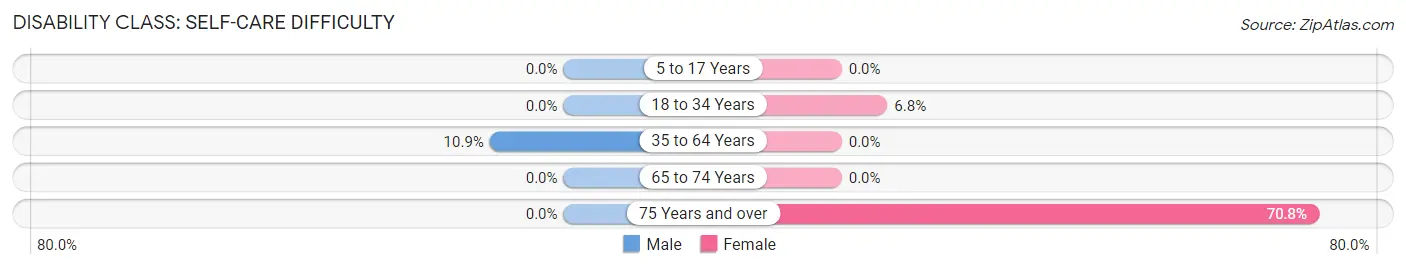
| Age Bracket | Male | Female |
| 5 to 17 Years | 0 (0.0%) | 0 (0.0%) |
| 18 to 34 Years | 0 (0.0%) | 22 (6.8%) |
| 35 to 64 Years | 36 (10.9%) | 0 (0.0%) |
| 65 to 74 Years | 0 (0.0%) | 0 (0.0%) |
| 75 Years and over | 0 (0.0%) | 17 (70.8%) |
Technology Access in Utica
Computing Device Access in Utica
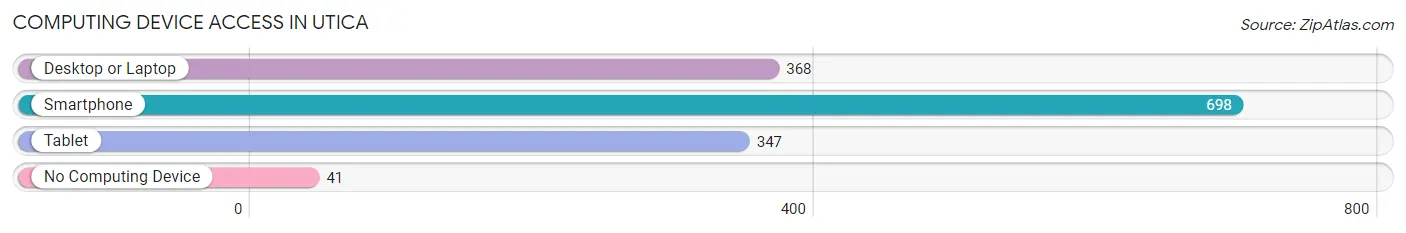
| Device Type | # Households | % Households |
| Desktop or Laptop | 368 | 47.1% |
| Smartphone | 698 | 89.3% |
| Tablet | 347 | 44.4% |
| No Computing Device | 41 | 5.2% |
| Total | 782 | 100.0% |
Internet Access in Utica
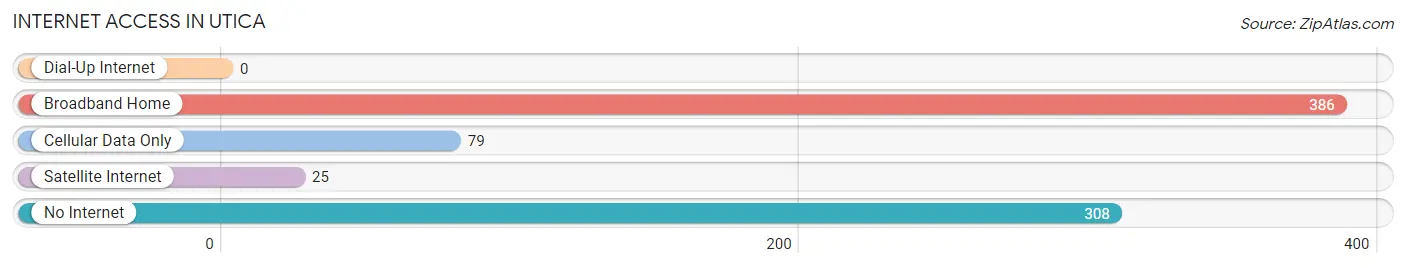
| Internet Type | # Households | % Households |
| Dial-Up Internet | 0 | 0.0% |
| Broadband Home | 386 | 49.4% |
| Cellular Data Only | 79 | 10.1% |
| Satellite Internet | 25 | 3.2% |
| No Internet | 308 | 39.4% |
| Total | 782 | 100.0% |
Utica Summary
Utica is a small town located in South Carolina, United States. It is situated in the northern part of the state, in the foothills of the Blue Ridge Mountains. The town is located in Union County, and is part of the Spartanburg-Greenville-Anderson Combined Statistical Area. As of the 2010 census, the population of Utica was 1,845.
History
Utica was founded in 1820 by a group of settlers from North Carolina. The town was named after the city of Utica, New York, which was the hometown of one of the settlers. The town was originally known as “Utica Crossroads”, as it was located at the intersection of two major roads.
The town grew slowly, but steadily, and by the mid-19th century, it had become a thriving community. The town was home to several businesses, including a cotton mill, a grist mill, and a sawmill. The town also had a post office, a school, and several churches.
In the late 19th century, the town began to decline. The cotton mill closed, and the population began to dwindle. By the early 20th century, the town was nearly abandoned.
In the late 20th century, the town began to experience a resurgence. The population began to grow, and new businesses began to open. Today, Utica is a small, but vibrant, community.
Geography
Utica is located in the northern part of South Carolina, in the foothills of the Blue Ridge Mountains. The town is situated in Union County, and is part of the Spartanburg-Greenville-Anderson Combined Statistical Area.
The town is located at the intersection of two major roads, US Highway 176 and SC Highway 11. The town is situated at an elevation of 890 feet above sea level.
The climate in Utica is mild and temperate. The average annual temperature is around 60 degrees Fahrenheit. The average annual precipitation is around 45 inches.
Economy
The economy of Utica is largely based on agriculture and tourism. The town is home to several farms, which produce a variety of crops, including corn, soybeans, and wheat.
The town is also home to several tourist attractions, including the Utica Mill, which is a historic grist mill that has been in operation since the 19th century. The town is also home to several wineries, which produce a variety of wines.
Demographics
As of the 2010 census, the population of Utica was 1,845. The racial makeup of the town was 94.3% White, 3.2% African American, 0.3% Native American, 0.2% Asian, 0.1% Pacific Islander, 0.7% from other races, and 1.3% from two or more races. Hispanic or Latino of any race were 1.7% of the population.
The median household income in Utica was $37,917, and the median family income was $45,625. The per capita income was $19,945. About 11.2% of families and 14.2% of the population were below the poverty line, including 19.3% of those under age 18 and 8.2% of those age 65 or over.
Common Questions
What is the Total Population of Utica?
Total Population of Utica is 1,654.
What is the Total Male Population of Utica?
Total Male Population of Utica is 741.
What is the Total Female Population of Utica?
Total Female Population of Utica is 913.
What is the Ratio of Males per 100 Females in Utica?
There are 81.16 Males per 100 Females in Utica.
What is the Ratio of Females per 100 Males in Utica?
There are 123.21 Females per 100 Males in Utica.
What is the Median Population Age in Utica?
Median Population Age in Utica is 33.7 Years.
What is the Average Family Size in Utica
Average Family Size in Utica is 2.6 People.
What is the Average Household Size in Utica
Average Household Size in Utica is 2.1 People.
What is Per Capita Income in Utica?
Per Capita income in Utica is $25,409.
What is Income or Wage Gap in Utica?
Income or Wage Gap in Utica is 51.5%.
Women in Utica earn 48.5 cents for every dollar earned by a man.
What is Family Income Deficit in Utica?
Family Income Deficit in Utica is $12,098.
Families that are below poverty line in Utica earn $12,098 less on average than the poverty threshold level.
What is Inequality or Gini Index in Utica?
Inequality or Gini Index in Utica is 0.37.
How Large is the Labor Force in Utica?
There are 805 People in the Labor Forcein in Utica.
What is the Percentage of People in the Labor Force in Utica?
69.2% of People are in the Labor Force in Utica.
What is the Unemployment Rate in Utica?
Unemployment Rate in Utica is 2.1%.