Cities with the Highest Percentage of Households with Income Above $100,000 in South Carolina
RELATED REPORTS & OPTIONS
Household Income | $100k+
South Carolina
Compare Cities
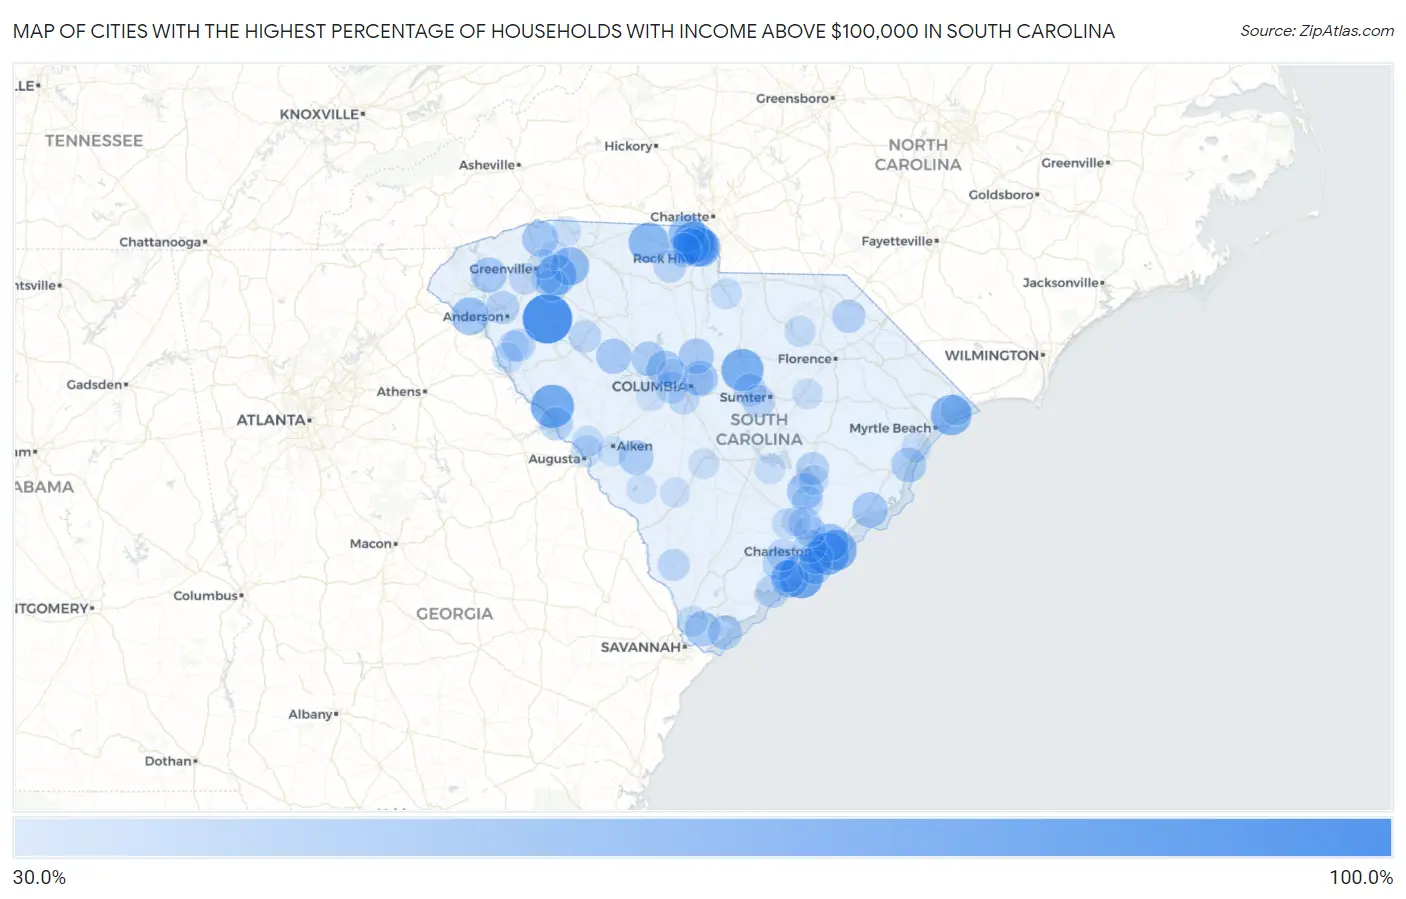
Map of Cities with the Highest Percentage of Households with Income Above $100,000 in South Carolina
0.0%
100.0%
Cities with the Highest Percentage of Households with Income Above $100,000 in South Carolina
| City | Households with Income > $100k | vs State | vs National | |
| 1. | Princeton | 100.0% | 29.7%(+70.3)#1 | 37.3%(+62.7)#82 |
| 2. | Daufuskie Island | 83.7% | 29.7%(+54.0)#2 | 37.3%(+46.4)#379 |
| 3. | Pimlico | 82.0% | 29.7%(+52.3)#3 | 37.3%(+44.7)#458 |
| 4. | Kiawah Island | 80.5% | 29.7%(+50.8)#4 | 37.3%(+43.2)#527 |
| 5. | Baxter | 78.8% | 29.7%(+49.1)#5 | 37.3%(+41.5)#627 |
| 6. | Plum Branch | 77.4% | 29.7%(+47.7)#6 | 37.3%(+40.1)#740 |
| 7. | Boykin | 74.3% | 29.7%(+44.6)#7 | 37.3%(+37.0)#958 |
| 8. | Sullivan S Island | 73.9% | 29.7%(+44.2)#8 | 37.3%(+36.6)#989 |
| 9. | Tega Cay | 72.2% | 29.7%(+42.5)#9 | 37.3%(+34.9)#1,133 |
| 10. | Debordieu Colony | 71.7% | 29.7%(+42.0)#10 | 37.3%(+34.4)#1,189 |
| 11. | Isle Of Palms | 69.4% | 29.7%(+39.7)#11 | 37.3%(+32.1)#1,391 |
| 12. | Riverview | 68.7% | 29.7%(+39.0)#12 | 37.3%(+31.4)#1,479 |
| 13. | Briarcliffe Acres | 68.3% | 29.7%(+38.6)#13 | 37.3%(+31.0)#1,539 |
| 14. | Five Forks | 67.1% | 29.7%(+37.4)#14 | 37.3%(+29.8)#1,664 |
| 15. | Smyrna | 66.7% | 29.7%(+37.0)#15 | 37.3%(+29.4)#1,726 |
| 16. | The Cliffs Valley | 63.9% | 29.7%(+34.2)#16 | 37.3%(+26.6)#2,088 |
| 17. | Fort Mill | 61.0% | 29.7%(+31.3)#17 | 37.3%(+23.7)#2,560 |
| 18. | Reidville | 60.2% | 29.7%(+30.5)#18 | 37.3%(+22.9)#2,699 |
| 19. | Seabrook Island | 58.6% | 29.7%(+28.9)#19 | 37.3%(+21.3)#2,976 |
| 20. | Lake Wylie | 58.2% | 29.7%(+28.5)#20 | 37.3%(+20.9)#3,038 |
| 21. | Fair Play | 58.2% | 29.7%(+28.5)#21 | 37.3%(+20.9)#3,048 |
| 22. | Mount Pleasant | 56.8% | 29.7%(+27.1)#22 | 37.3%(+19.5)#3,264 |
| 23. | Keowee Key | 56.6% | 29.7%(+26.9)#23 | 37.3%(+19.3)#3,309 |
| 24. | Danwood | 53.0% | 29.7%(+23.3)#24 | 37.3%(+15.7)#4,020 |
| 25. | India Hook | 52.9% | 29.7%(+23.2)#25 | 37.3%(+15.6)#4,036 |
| 26. | Lake Murray Of Richland | 52.7% | 29.7%(+23.0)#26 | 37.3%(+15.4)#4,076 |
| 27. | Pinopolis | 52.6% | 29.7%(+22.9)#27 | 37.3%(+15.3)#4,105 |
| 28. | Tigerville | 51.6% | 29.7%(+21.9)#28 | 37.3%(+14.3)#4,342 |
| 29. | Dacusville | 51.0% | 29.7%(+21.3)#29 | 37.3%(+13.7)#4,484 |
| 30. | Arcadia Lakes | 50.9% | 29.7%(+21.2)#30 | 37.3%(+13.6)#4,507 |
| 31. | Blythewood | 50.6% | 29.7%(+20.9)#31 | 37.3%(+13.3)#4,566 |
| 32. | Mcclellanville | 50.6% | 29.7%(+20.9)#32 | 37.3%(+13.3)#4,574 |
| 33. | Six Mile | 50.4% | 29.7%(+20.7)#33 | 37.3%(+13.1)#4,608 |
| 34. | Silverstreet | 50.0% | 29.7%(+20.3)#34 | 37.3%(+12.7)#4,719 |
| 35. | Bluffton | 49.5% | 29.7%(+19.8)#35 | 37.3%(+12.2)#4,876 |
| 36. | Grover | 49.0% | 29.7%(+19.3)#36 | 37.3%(+11.7)#5,015 |
| 37. | Pawleys Island | 48.5% | 29.7%(+18.8)#37 | 37.3%(+11.2)#5,141 |
| 38. | Windsor | 48.2% | 29.7%(+18.5)#38 | 37.3%(+10.9)#5,207 |
| 39. | Little Mountain | 47.8% | 29.7%(+18.1)#39 | 37.3%(+10.5)#5,314 |
| 40. | Newport | 46.9% | 29.7%(+17.2)#40 | 37.3%(+9.60)#5,564 |
| 41. | Hilton Head Island | 46.5% | 29.7%(+16.8)#41 | 37.3%(+9.20)#5,677 |
| 42. | Fripp Island | 45.6% | 29.7%(+15.9)#42 | 37.3%(+8.30)#5,954 |
| 43. | Folly Beach | 45.2% | 29.7%(+15.5)#43 | 37.3%(+7.90)#6,063 |
| 44. | Buford | 44.8% | 29.7%(+15.1)#44 | 37.3%(+7.50)#6,185 |
| 45. | Northlake | 43.7% | 29.7%(+14.0)#45 | 37.3%(+6.40)#6,496 |
| 46. | James Island | 43.3% | 29.7%(+13.6)#46 | 37.3%(+6.00)#6,623 |
| 47. | Modoc | 43.3% | 29.7%(+13.6)#47 | 37.3%(+6.00)#6,644 |
| 48. | Blenheim | 43.3% | 29.7%(+13.6)#48 | 37.3%(+6.00)#6,656 |
| 49. | Russellville | 43.2% | 29.7%(+13.5)#49 | 37.3%(+5.90)#6,675 |
| 50. | Edisto Beach | 42.9% | 29.7%(+13.2)#50 | 37.3%(+5.60)#6,758 |
| 51. | La France | 42.8% | 29.7%(+13.1)#51 | 37.3%(+5.50)#6,796 |
| 52. | Charleston | 42.7% | 29.7%(+13.0)#52 | 37.3%(+5.40)#6,811 |
| 53. | Stateburg | 42.5% | 29.7%(+12.8)#53 | 37.3%(+5.20)#6,887 |
| 54. | Cane Savannah | 42.3% | 29.7%(+12.6)#54 | 37.3%(+5.00)#6,965 |
| 55. | Antreville | 41.7% | 29.7%(+12.0)#55 | 37.3%(+4.40)#7,140 |
| 56. | Goose Creek | 41.1% | 29.7%(+11.4)#56 | 37.3%(+3.80)#7,332 |
| 57. | Mcconnells | 41.1% | 29.7%(+11.4)#57 | 37.3%(+3.80)#7,354 |
| 58. | Meggett | 41.0% | 29.7%(+11.3)#58 | 37.3%(+3.70)#7,371 |
| 59. | Mountville | 40.3% | 29.7%(+10.6)#59 | 37.3%(+3.00)#7,636 |
| 60. | Simpsonville | 40.2% | 29.7%(+10.5)#60 | 37.3%(+2.90)#7,639 |
| 61. | Rockville | 40.0% | 29.7%(+10.3)#61 | 37.3%(+2.70)#7,735 |
| 62. | Lexington | 39.5% | 29.7%(+9.80)#62 | 37.3%(+2.20)#7,890 |
| 63. | Hollywood | 39.3% | 29.7%(+9.60)#63 | 37.3%(+2.00)#7,945 |
| 64. | Furman | 39.3% | 29.7%(+9.60)#64 | 37.3%(+2.00)#7,960 |
| 65. | Powdersville | 38.8% | 29.7%(+9.10)#65 | 37.3%(+1.50)#8,143 |
| 66. | Hanahan | 38.4% | 29.7%(+8.70)#66 | 37.3%(+1.10)#8,316 |
| 67. | Dunbar | 38.0% | 29.7%(+8.30)#67 | 37.3%(+0.700)#8,474 |
| 68. | Pine Ridge | 37.9% | 29.7%(+8.20)#68 | 37.3%(+0.600)#8,502 |
| 69. | Lake Secession | 37.5% | 29.7%(+7.80)#69 | 37.3%(+0.200)#8,658 |
| 70. | North Augusta | 37.4% | 29.7%(+7.70)#70 | 37.3%(+0.100)#8,694 |
| 71. | North Myrtle Beach | 37.2% | 29.7%(+7.50)#71 | 37.3%(-0.100)#8,775 |
| 72. | Litchfield Beach | 37.2% | 29.7%(+7.50)#72 | 37.3%(-0.100)#8,779 |
| 73. | North Hartsville | 37.2% | 29.7%(+7.50)#73 | 37.3%(-0.100)#8,783 |
| 74. | South Union | 36.4% | 29.7%(+6.70)#74 | 37.3%(-0.900)#9,105 |
| 75. | Summerville | 36.1% | 29.7%(+6.40)#75 | 37.3%(-1.20)#9,194 |
| 76. | Elgin | 35.9% | 29.7%(+6.20)#76 | 37.3%(-1.40)#9,316 |
| 77. | Hardeeville | 35.8% | 29.7%(+6.10)#77 | 37.3%(-1.50)#9,340 |
| 78. | Murphys Estates | 35.8% | 29.7%(+6.10)#78 | 37.3%(-1.50)#9,356 |
| 79. | Moncks Corner | 35.6% | 29.7%(+5.90)#79 | 37.3%(-1.70)#9,414 |
| 80. | Eutawville | 35.3% | 29.7%(+5.60)#80 | 37.3%(-2.00)#9,580 |
| 81. | Lowndesville | 35.3% | 29.7%(+5.60)#81 | 37.3%(-2.00)#9,588 |
| 82. | Caesars Head | 35.3% | 29.7%(+5.60)#82 | 37.3%(-2.00)#9,597 |
| 83. | Dale | 35.1% | 29.7%(+5.40)#83 | 37.3%(-2.20)#9,659 |
| 84. | Mauldin | 34.7% | 29.7%(+5.00)#84 | 37.3%(-2.60)#9,820 |
| 85. | Cordova | 34.6% | 29.7%(+4.90)#85 | 37.3%(-2.70)#9,903 |
| 86. | Forest Acres | 34.5% | 29.7%(+4.80)#86 | 37.3%(-2.80)#9,918 |
| 87. | Helena | 34.5% | 29.7%(+4.80)#87 | 37.3%(-2.80)#9,951 |
| 88. | Shiloh | 34.4% | 29.7%(+4.70)#88 | 37.3%(-2.90)#10,006 |
| 89. | Irmo | 34.0% | 29.7%(+4.30)#89 | 37.3%(-3.30)#10,165 |
| 90. | Murrells Inlet | 33.8% | 29.7%(+4.10)#90 | 37.3%(-3.50)#10,251 |
| 91. | Snelling | 33.7% | 29.7%(+4.00)#91 | 37.3%(-3.60)#10,323 |
| 92. | Aiken | 33.3% | 29.7%(+3.60)#92 | 37.3%(-4.00)#10,445 |
| 93. | Govan | 33.3% | 29.7%(+3.60)#93 | 37.3%(-4.00)#10,523 |
| 94. | Greer | 33.2% | 29.7%(+3.50)#94 | 37.3%(-4.10)#10,552 |
| 95. | Cateechee | 33.1% | 29.7%(+3.40)#95 | 37.3%(-4.20)#10,628 |
| 96. | Campobello | 33.1% | 29.7%(+3.40)#96 | 37.3%(-4.20)#10,629 |
| 97. | Ladson | 32.8% | 29.7%(+3.10)#97 | 37.3%(-4.50)#10,737 |
| 98. | Bonneau | 32.6% | 29.7%(+2.90)#98 | 37.3%(-4.70)#10,860 |
| 99. | Gilbert | 32.6% | 29.7%(+2.90)#99 | 37.3%(-4.70)#10,861 |
| 100. | Wade Hampton | 32.5% | 29.7%(+2.80)#100 | 37.3%(-4.80)#10,875 |
Common Questions
What are the Top 10 Cities with the Highest Percentage of Households with Income Above $100,000 in South Carolina?
Top 10 Cities with the Highest Percentage of Households with Income Above $100,000 in South Carolina are:
#1
100.0%
#2
80.5%
#3
77.4%
#4
74.3%
#5
73.9%
#6
72.2%
#7
69.4%
#8
68.7%
#9
68.3%
#10
67.1%
What city has the Highest Percentage of Households with Income Above $100,000 in South Carolina?
Princeton has the Highest Percentage of Households with Income Above $100,000 in South Carolina with 100.0%.
What is the Percentage of Households with Income Above $100,000 in the State of South Carolina?
Percentage of Households with Income Above $100,000 in South Carolina is 29.7%.
What is the Percentage of Households with Income Above $100,000 in the United States?
Percentage of Households with Income Above $100,000 in the United States is 37.3%.