Arial, SC
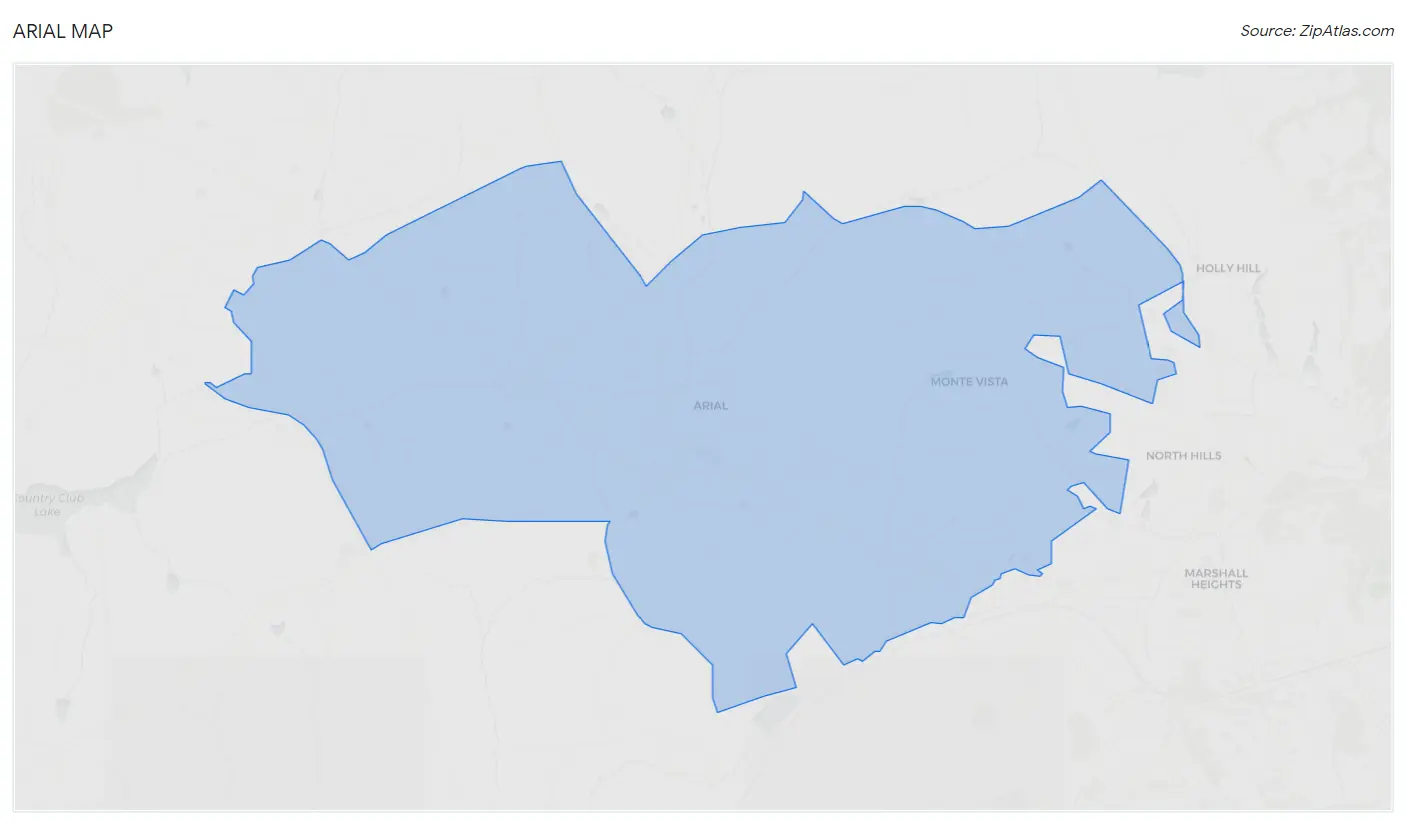
Arial Map
Arial Overview
1,750
TOTAL POPULATION
972
MALE POPULATION
778
FEMALE POPULATION
124.94
MALES / 100 FEMALES
80.04
FEMALES / 100 MALES
54.8
MEDIAN AGE
2.5
AVG FAMILY SIZE
2.1
AVG HOUSEHOLD SIZE
$30,491
PER CAPITA INCOME
$72,250
AVG FAMILY INCOME
$54,453
AVG HOUSEHOLD INCOME
33.5%
WAGE / INCOME GAP [ % ]
66.5¢/ $1
WAGE / INCOME GAP [ $ ]
$9,266
FAMILY INCOME DEFICIT
0.36
INEQUALITY / GINI INDEX
789
LABOR FORCE [ PEOPLE ]
50.3%
PERCENT IN LABOR FORCE
1.3%
UNEMPLOYMENT RATE
Race in Arial
The most populous races in Arial are White / Caucasian (1,548 | 88.5%), Two or more Races (88 | 5.0%), and Black / African American (84 | 4.8%).
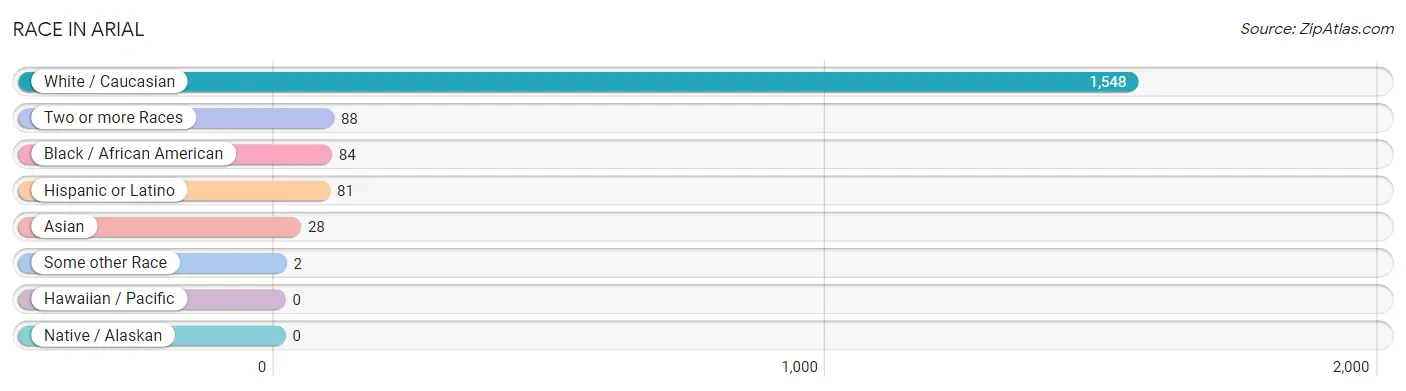
| Race | # Population | % Population |
| Asian | 28 | 1.6% |
| Black / African American | 84 | 4.8% |
| Hawaiian / Pacific | 0 | 0.0% |
| Hispanic or Latino | 81 | 4.6% |
| Native / Alaskan | 0 | 0.0% |
| White / Caucasian | 1,548 | 88.5% |
| Two or more Races | 88 | 5.0% |
| Some other Race | 2 | 0.1% |
| Total | 1,750 | 100.0% |
Ancestry in Arial
The most populous ancestries reported in Arial are Irish (340 | 19.4%), German (193 | 11.0%), English (157 | 9.0%), American (153 | 8.7%), and European (63 | 3.6%), together accounting for 51.8% of all Arial residents.
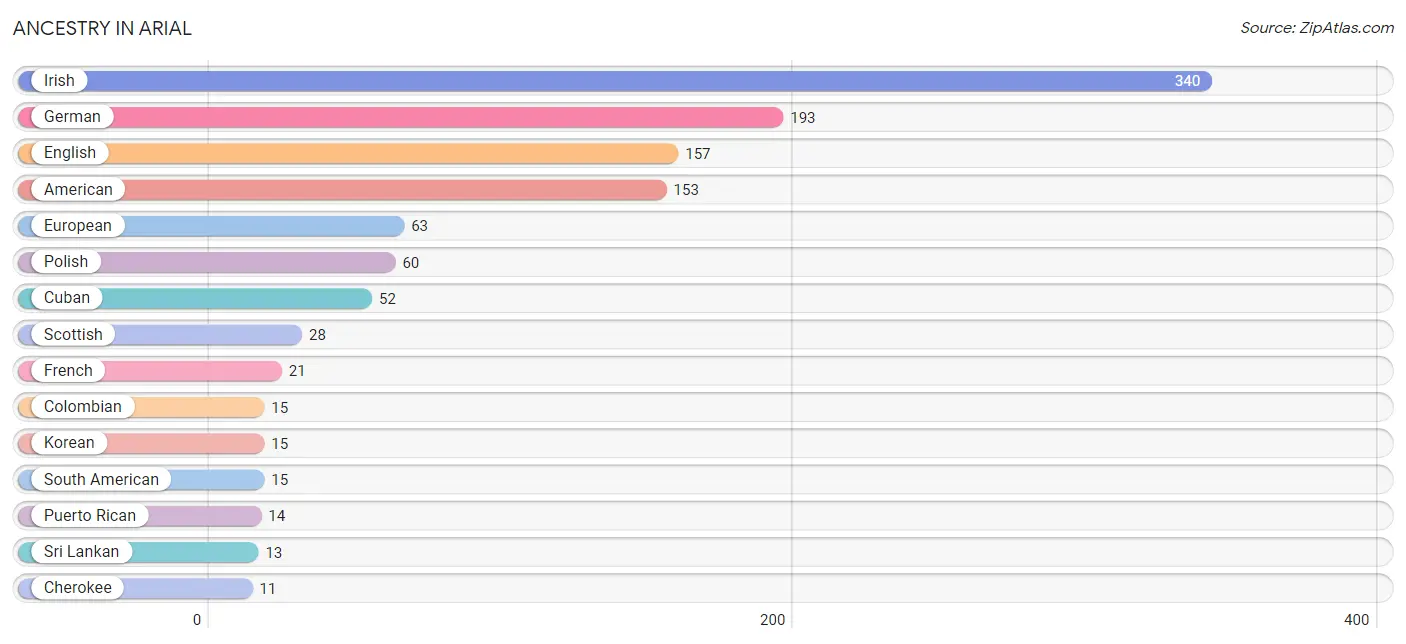
| Ancestry | # Population | % Population |
| American | 153 | 8.7% |
| Canadian | 10 | 0.6% |
| Cherokee | 11 | 0.6% |
| Colombian | 15 | 0.9% |
| Cuban | 52 | 3.0% |
| Dutch | 6 | 0.3% |
| English | 157 | 9.0% |
| European | 63 | 3.6% |
| French | 21 | 1.2% |
| German | 193 | 11.0% |
| Irish | 340 | 19.4% |
| Italian | 6 | 0.3% |
| Korean | 15 | 0.9% |
| Norwegian | 9 | 0.5% |
| Polish | 60 | 3.4% |
| Puerto Rican | 14 | 0.8% |
| Scottish | 28 | 1.6% |
| South American | 15 | 0.9% |
| Sri Lankan | 13 | 0.7% |
| Welsh | 9 | 0.5% | View All 20 Rows |
Immigrants in Arial
The most numerous immigrant groups reported in Arial came from Asia (28 | 1.6%), South Eastern Asia (28 | 1.6%), Philippines (15 | 0.9%), Vietnam (13 | 0.7%), and Colombia (2 | 0.1%), together accounting for 4.9% of all Arial residents.
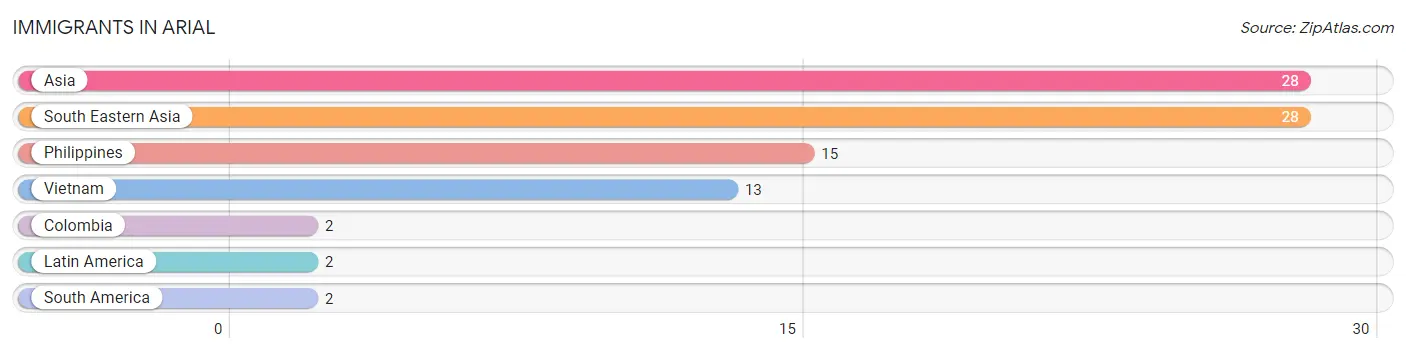
| Immigration Origin | # Population | % Population |
| Asia | 28 | 1.6% |
| Colombia | 2 | 0.1% |
| Latin America | 2 | 0.1% |
| Philippines | 15 | 0.9% |
| South America | 2 | 0.1% |
| South Eastern Asia | 28 | 1.6% |
| Vietnam | 13 | 0.7% | View All 7 Rows |
Sex and Age in Arial
Sex and Age in Arial
The most populous age groups in Arial are 65 to 69 Years (107 | 11.0%) for men and 55 to 59 Years (127 | 16.3%) for women.
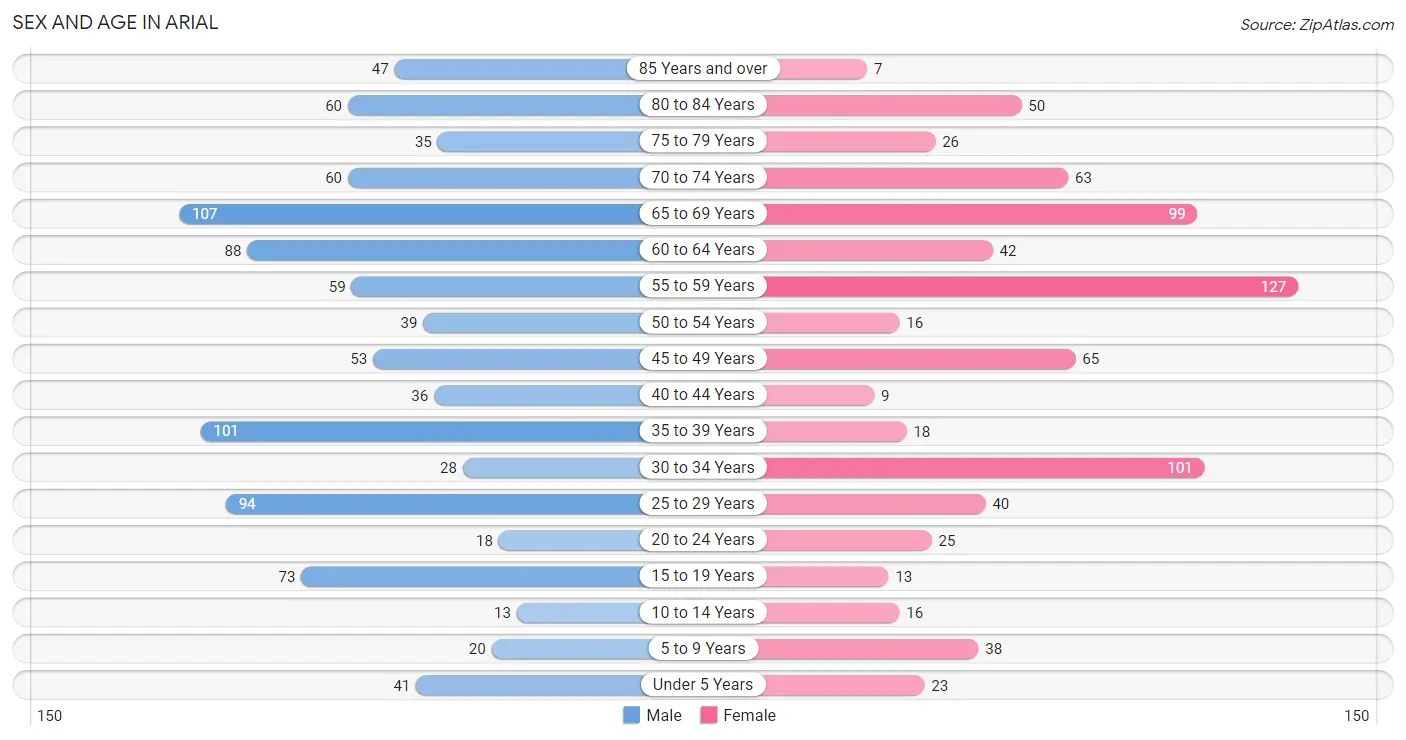
| Age Bracket | Male | Female |
| Under 5 Years | 41 (4.2%) | 23 (3.0%) |
| 5 to 9 Years | 20 (2.1%) | 38 (4.9%) |
| 10 to 14 Years | 13 (1.3%) | 16 (2.1%) |
| 15 to 19 Years | 73 (7.5%) | 13 (1.7%) |
| 20 to 24 Years | 18 (1.8%) | 25 (3.2%) |
| 25 to 29 Years | 94 (9.7%) | 40 (5.1%) |
| 30 to 34 Years | 28 (2.9%) | 101 (13.0%) |
| 35 to 39 Years | 101 (10.4%) | 18 (2.3%) |
| 40 to 44 Years | 36 (3.7%) | 9 (1.2%) |
| 45 to 49 Years | 53 (5.4%) | 65 (8.4%) |
| 50 to 54 Years | 39 (4.0%) | 16 (2.1%) |
| 55 to 59 Years | 59 (6.1%) | 127 (16.3%) |
| 60 to 64 Years | 88 (9.0%) | 42 (5.4%) |
| 65 to 69 Years | 107 (11.0%) | 99 (12.7%) |
| 70 to 74 Years | 60 (6.2%) | 63 (8.1%) |
| 75 to 79 Years | 35 (3.6%) | 26 (3.3%) |
| 80 to 84 Years | 60 (6.2%) | 50 (6.4%) |
| 85 Years and over | 47 (4.8%) | 7 (0.9%) |
| Total | 972 (100.0%) | 778 (100.0%) |
Families and Households in Arial
Median Family Size in Arial
The median family size in Arial is 2.51 persons per family, with married-couple families (441 | 81.2%) accounting for the largest median family size of 2.55 persons per family. On the other hand, single male/father families (25 | 4.6%) represent the smallest median family size with 1.96 persons per family.
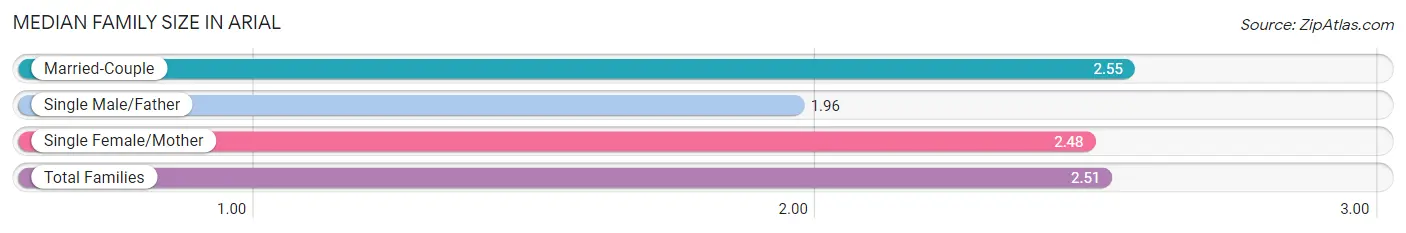
| Family Type | # Families | Family Size |
| Married-Couple | 441 (81.2%) | 2.55 |
| Single Male/Father | 25 (4.6%) | 1.96 |
| Single Female/Mother | 77 (14.2%) | 2.48 |
| Total Families | 543 (100.0%) | 2.51 |
Median Household Size in Arial
The median household size in Arial is 2.06 persons per household, with single female/mother households (77 | 9.1%) accounting for the largest median household size of 2.91 persons per household. non-family households (307 | 36.1%) represent the smallest median household size with 1.12 persons per household.
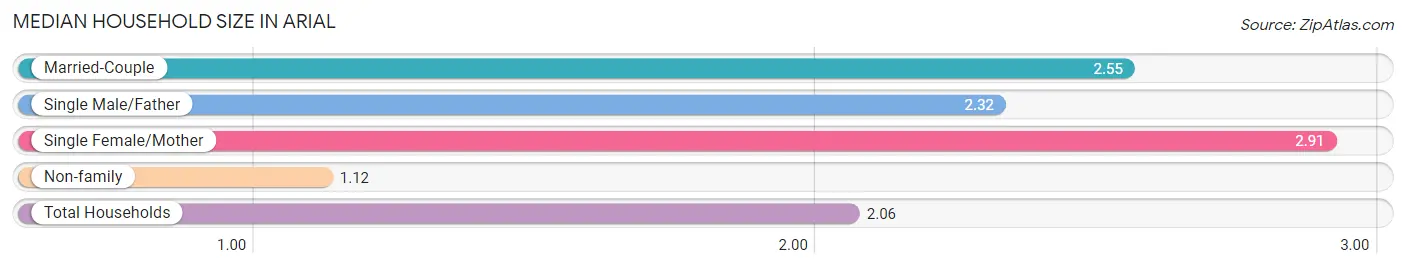
| Household Type | # Households | Household Size |
| Married-Couple | 441 (51.9%) | 2.55 |
| Single Male/Father | 25 (2.9%) | 2.32 |
| Single Female/Mother | 77 (9.1%) | 2.91 |
| Non-family | 307 (36.1%) | 1.12 |
| Total Households | 850 (100.0%) | 2.06 |
Household Size by Marriage Status in Arial
Out of a total of 850 households in Arial, 543 (63.9%) are family households, while 307 (36.1%) are nonfamily households. The most numerous type of family households are 3-person households, comprising 321, and the most common type of nonfamily households are 1-person households, comprising 266.
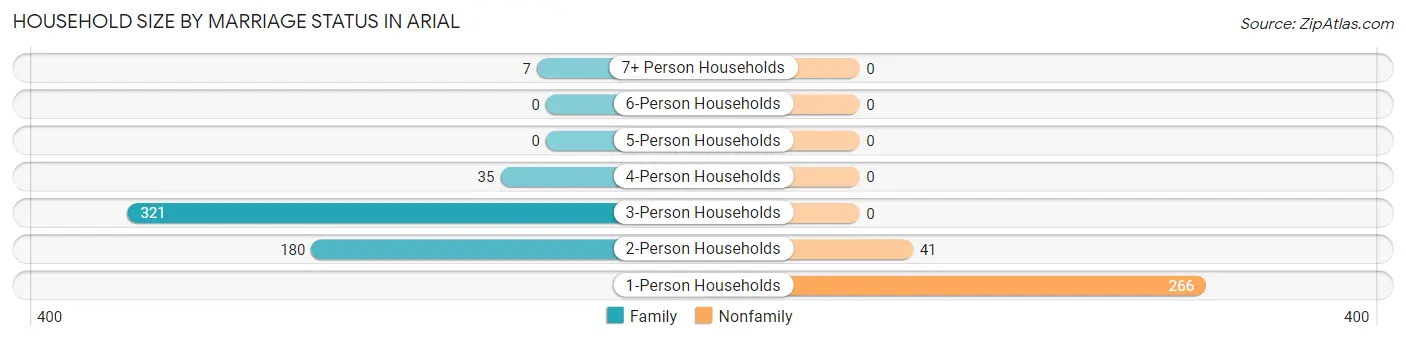
| Household Size | Family Households | Nonfamily Households |
| 1-Person Households | - | 266 (31.3%) |
| 2-Person Households | 180 (21.2%) | 41 (4.8%) |
| 3-Person Households | 321 (37.8%) | 0 (0.0%) |
| 4-Person Households | 35 (4.1%) | 0 (0.0%) |
| 5-Person Households | 0 (0.0%) | 0 (0.0%) |
| 6-Person Households | 0 (0.0%) | 0 (0.0%) |
| 7+ Person Households | 7 (0.8%) | 0 (0.0%) |
| Total | 543 (63.9%) | 307 (36.1%) |
Female Fertility in Arial
Fertility by Age in Arial
Average fertility rate in Arial is 32.0 births per 1,000 women. Women in the age bracket of 20 to 34 years have the highest fertility rate with 54.0 births per 1,000 women. Women in the age bracket of 20 to 34 years acount for 100.0% of all women with births.
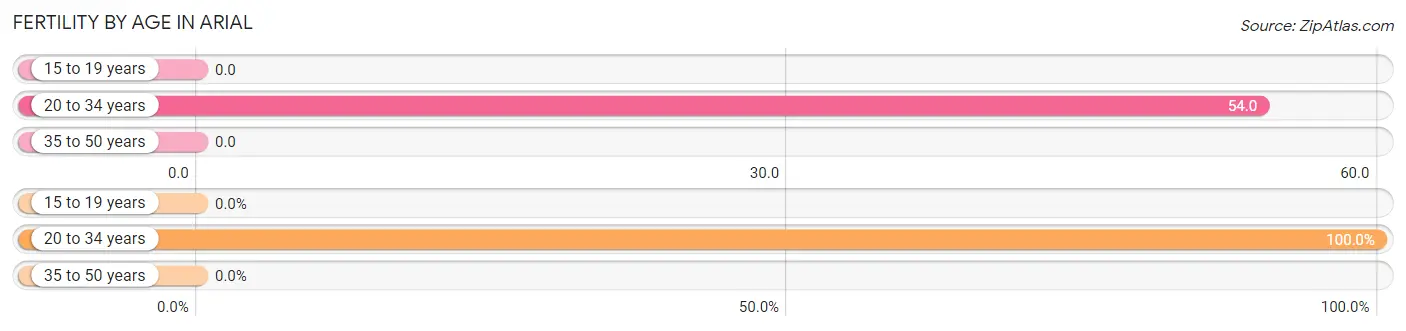
| Age Bracket | Women with Births | Births / 1,000 Women |
| 15 to 19 years | 0 (0.0%) | 0.0 |
| 20 to 34 years | 9 (100.0%) | 54.0 |
| 35 to 50 years | 0 (0.0%) | 0.0 |
| Total | 9 (100.0%) | 32.0 |
Fertility by Age by Marriage Status in Arial
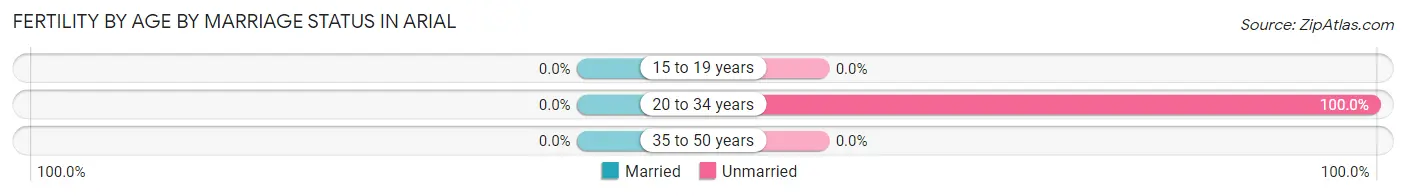
| Age Bracket | Married | Unmarried |
| 15 to 19 years | 0 (0.0%) | 0 (0.0%) |
| 20 to 34 years | 0 (0.0%) | 9 (100.0%) |
| 35 to 50 years | 0 (0.0%) | 0 (0.0%) |
| Total | 0 (0.0%) | 9 (100.0%) |
Fertility by Education in Arial
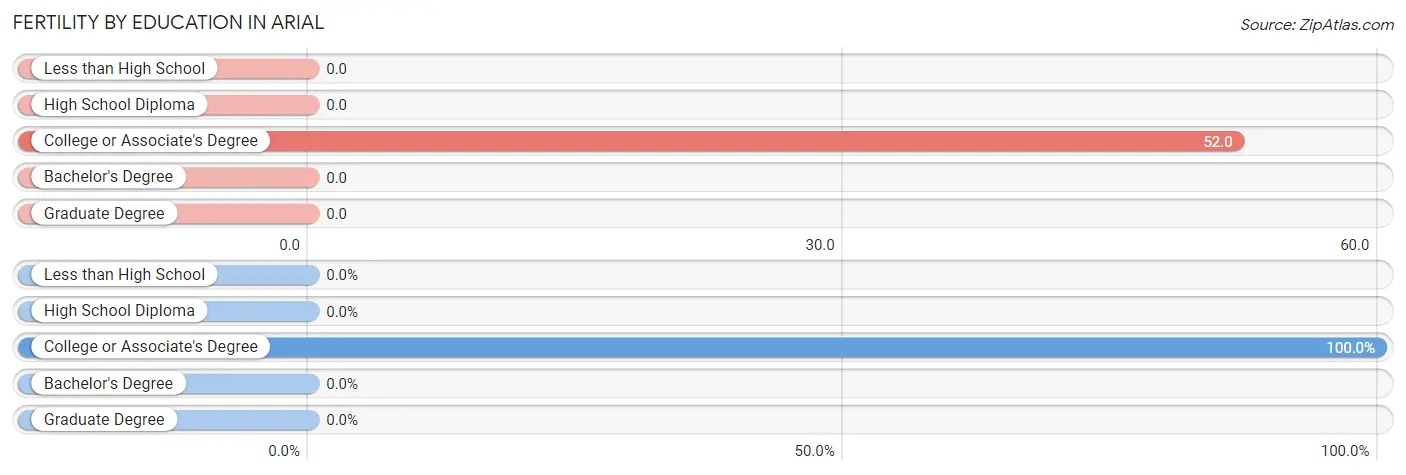
| Educational Attainment | Women with Births | Births / 1,000 Women |
| Less than High School | 0 (0.0%) | 0.0 |
| High School Diploma | 0 (0.0%) | 0.0 |
| College or Associate's Degree | 9 (100.0%) | 52.0 |
| Bachelor's Degree | 0 (0.0%) | 0.0 |
| Graduate Degree | 0 (0.0%) | 0.0 |
| Total | 9 (100.0%) | 32.0 |
Fertility by Education by Marriage Status in Arial
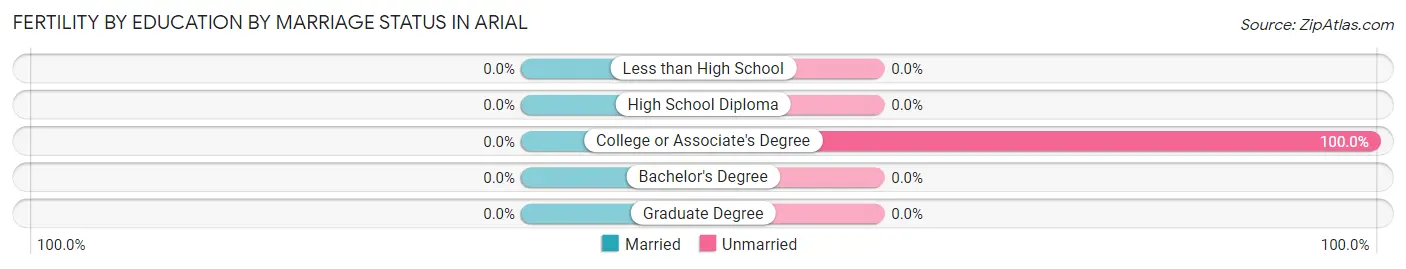
| Educational Attainment | Married | Unmarried |
| Less than High School | 0 (0.0%) | 0 (0.0%) |
| High School Diploma | 0 (0.0%) | 0 (0.0%) |
| College or Associate's Degree | 0 (0.0%) | 9 (100.0%) |
| Bachelor's Degree | 0 (0.0%) | 0 (0.0%) |
| Graduate Degree | 0 (0.0%) | 0 (0.0%) |
| Total | 0 (0.0%) | 9 (100.0%) |
Income in Arial
Income Overview in Arial
Per Capita Income in Arial is $30,491, while median incomes of families and households are $72,250 and $54,453 respectively.
| Characteristic | Number | Measure |
| Per Capita Income | 1,750 | $30,491 |
| Median Family Income | 543 | $72,250 |
| Mean Family Income | 543 | $73,846 |
| Median Household Income | 850 | $54,453 |
| Mean Household Income | 850 | $64,836 |
| Income Deficit | 543 | $9,266 |
| Wage / Income Gap (%) | 1,750 | 33.47% |
| Wage / Income Gap ($) | 1,750 | 66.53¢ per $1 |
| Gini / Inequality Index | 1,750 | 0.36 |
Earnings by Sex in Arial
Average Earnings in Arial are $38,389, $43,026 for men and $28,625 for women, a difference of 33.5%.
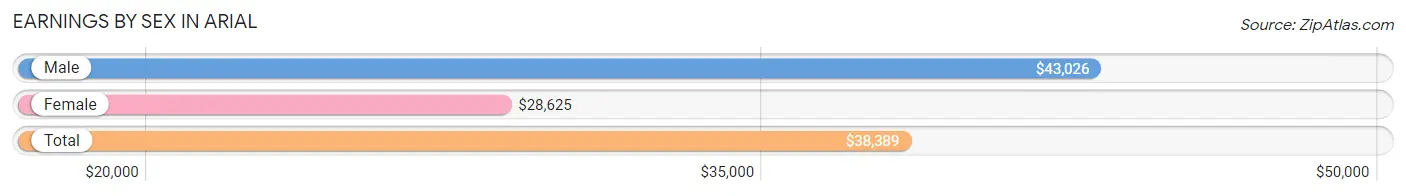
| Sex | Number | Average Earnings |
| Male | 476 (57.8%) | $43,026 |
| Female | 348 (42.2%) | $28,625 |
| Total | 824 (100.0%) | $38,389 |
Earnings by Sex by Income Bracket in Arial
The most common earnings brackets in Arial are $55,000 to $64,999 for men (103 | 21.6%) and $12,500 to $14,999 for women (70 | 20.1%).
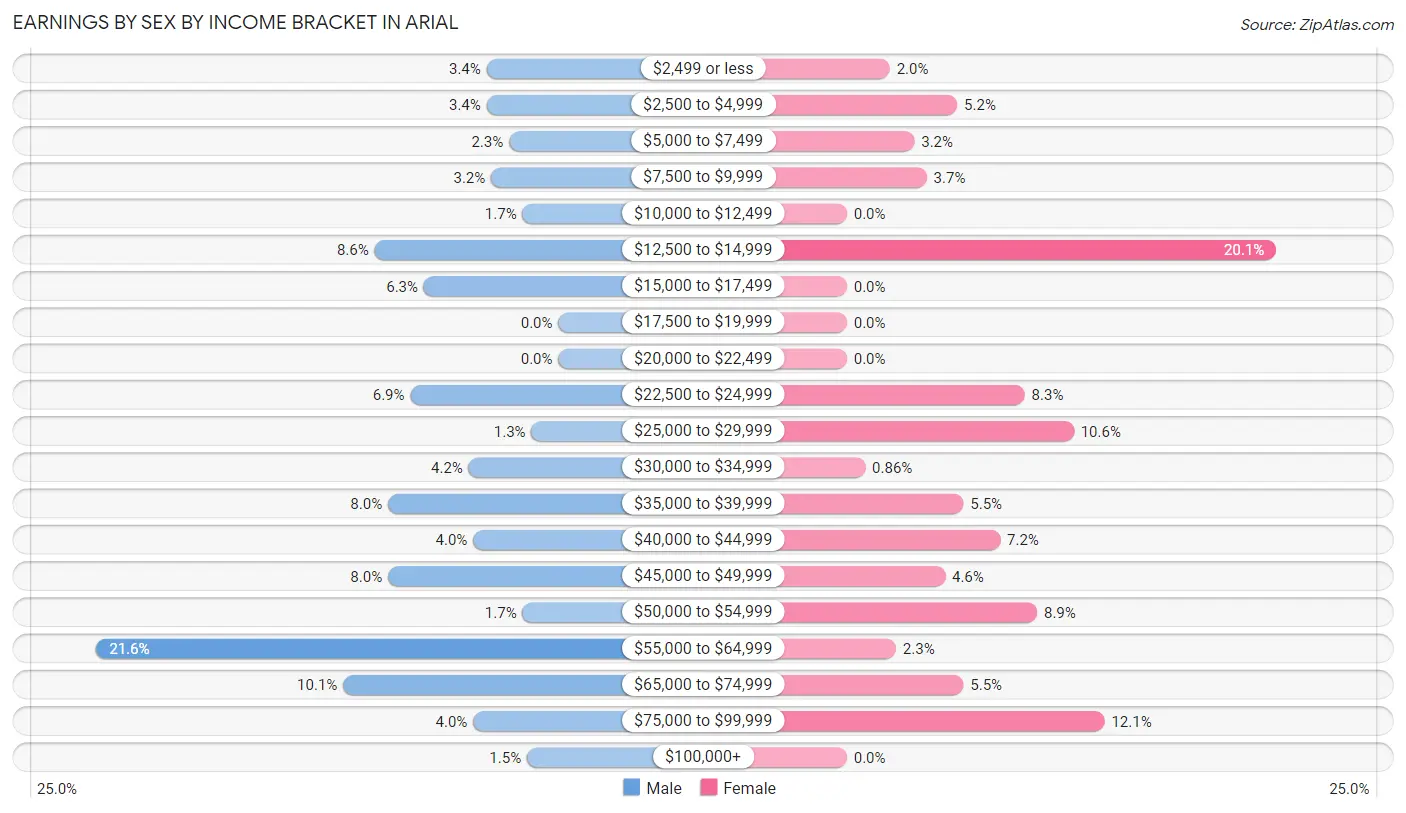
| Income | Male | Female |
| $2,499 or less | 16 (3.4%) | 7 (2.0%) |
| $2,500 to $4,999 | 16 (3.4%) | 18 (5.2%) |
| $5,000 to $7,499 | 11 (2.3%) | 11 (3.2%) |
| $7,500 to $9,999 | 15 (3.2%) | 13 (3.7%) |
| $10,000 to $12,499 | 8 (1.7%) | 0 (0.0%) |
| $12,500 to $14,999 | 41 (8.6%) | 70 (20.1%) |
| $15,000 to $17,499 | 30 (6.3%) | 0 (0.0%) |
| $17,500 to $19,999 | 0 (0.0%) | 0 (0.0%) |
| $20,000 to $22,499 | 0 (0.0%) | 0 (0.0%) |
| $22,500 to $24,999 | 33 (6.9%) | 29 (8.3%) |
| $25,000 to $29,999 | 6 (1.3%) | 37 (10.6%) |
| $30,000 to $34,999 | 20 (4.2%) | 3 (0.9%) |
| $35,000 to $39,999 | 38 (8.0%) | 19 (5.5%) |
| $40,000 to $44,999 | 19 (4.0%) | 25 (7.2%) |
| $45,000 to $49,999 | 38 (8.0%) | 16 (4.6%) |
| $50,000 to $54,999 | 8 (1.7%) | 31 (8.9%) |
| $55,000 to $64,999 | 103 (21.6%) | 8 (2.3%) |
| $65,000 to $74,999 | 48 (10.1%) | 19 (5.5%) |
| $75,000 to $99,999 | 19 (4.0%) | 42 (12.1%) |
| $100,000+ | 7 (1.5%) | 0 (0.0%) |
| Total | 476 (100.0%) | 348 (100.0%) |
Earnings by Sex by Educational Attainment in Arial
Average earnings in Arial are $45,766 for men and $37,632 for women, a difference of 17.8%. Men with an educational attainment of bachelor's degree enjoy the highest average annual earnings of $61,250, while those with less than high school education earn the least with $36,458. Women with an educational attainment of college or associate's degree earn the most with the average annual earnings of $41,100, while those with high school diploma education have the smallest earnings of $26,827.
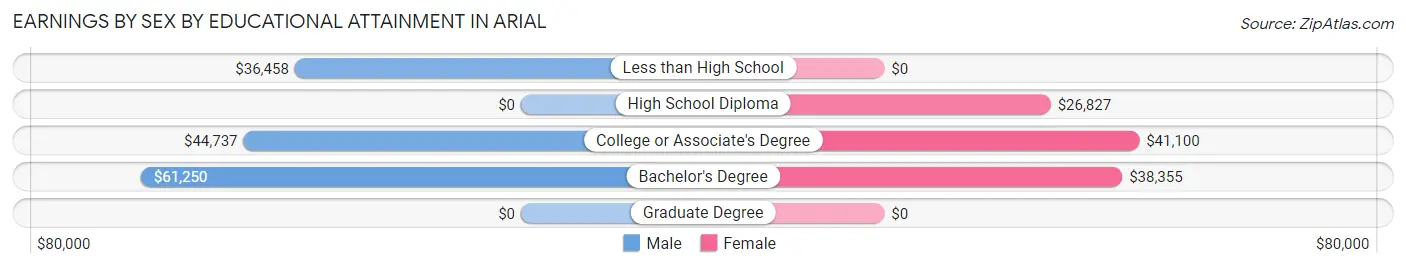
| Educational Attainment | Male Income | Female Income |
| Less than High School | $36,458 | $0 |
| High School Diploma | - | - |
| College or Associate's Degree | $44,737 | $41,100 |
| Bachelor's Degree | $61,250 | $38,355 |
| Graduate Degree | - | - |
| Total | $45,766 | $37,632 |
Family Income in Arial
Family Income Brackets in Arial
According to the Arial family income data, there are 124 families falling into the $75,000 to $99,999 income range, which is the most common income bracket and makes up 22.8% of all families. Conversely, the $200,000+ income bracket is the least frequent group with only 7 families (1.3%) belonging to this category.
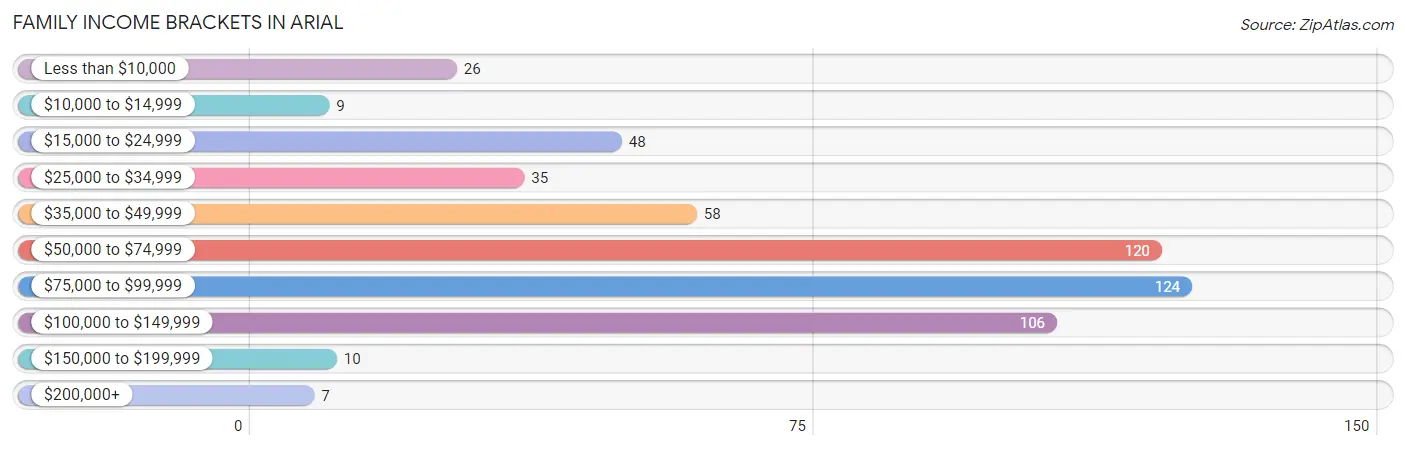
| Income Bracket | # Families | % Families |
| Less than $10,000 | 26 | 4.8% |
| $10,000 to $14,999 | 9 | 1.7% |
| $15,000 to $24,999 | 48 | 8.8% |
| $25,000 to $34,999 | 35 | 6.4% |
| $35,000 to $49,999 | 58 | 10.7% |
| $50,000 to $74,999 | 120 | 22.1% |
| $75,000 to $99,999 | 124 | 22.8% |
| $100,000 to $149,999 | 106 | 19.5% |
| $150,000 to $199,999 | 10 | 1.8% |
| $200,000+ | 7 | 1.3% |
Family Income by Famaliy Size in Arial
4-person families (35 | 6.5%) account for the highest median family income in Arial with $101,094 per family, while 3-person families (285 | 52.5%) have the highest median income of $29,222 per family member.
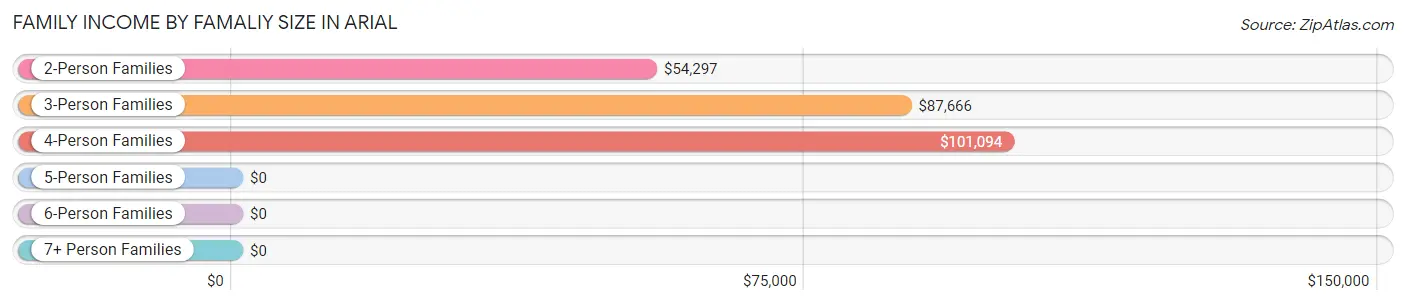
| Income Bracket | # Families | Median Income |
| 2-Person Families | 216 (39.8%) | $54,297 |
| 3-Person Families | 285 (52.5%) | $87,666 |
| 4-Person Families | 35 (6.5%) | $101,094 |
| 5-Person Families | 0 (0.0%) | $0 |
| 6-Person Families | 0 (0.0%) | $0 |
| 7+ Person Families | 7 (1.3%) | $0 |
| Total | 543 (100.0%) | $72,250 |
Family Income by Number of Earners in Arial
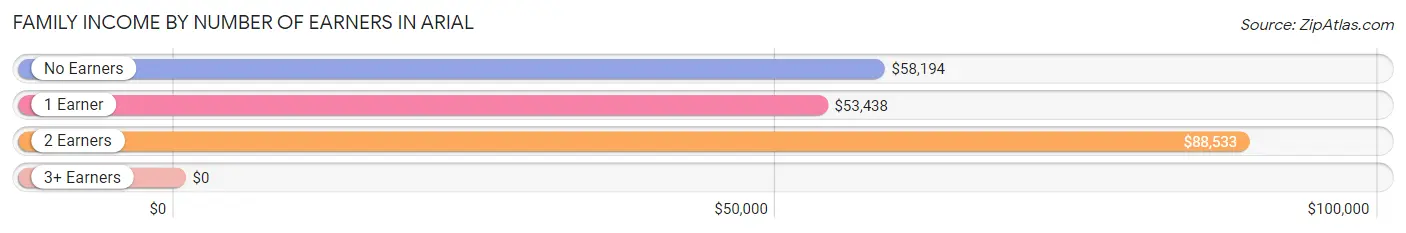
| Number of Earners | # Families | Median Income |
| No Earners | 97 (17.9%) | $58,194 |
| 1 Earner | 188 (34.6%) | $53,438 |
| 2 Earners | 245 (45.1%) | $88,533 |
| 3+ Earners | 13 (2.4%) | $0 |
| Total | 543 (100.0%) | $72,250 |
Household Income in Arial
Household Income Brackets in Arial
With 156 households falling in the category, the $75,000 to $99,999 income range is the most frequent in Arial, accounting for 18.3% of all households. In contrast, only 7 households (0.8%) fall into the $200,000+ income bracket, making it the least populous group.
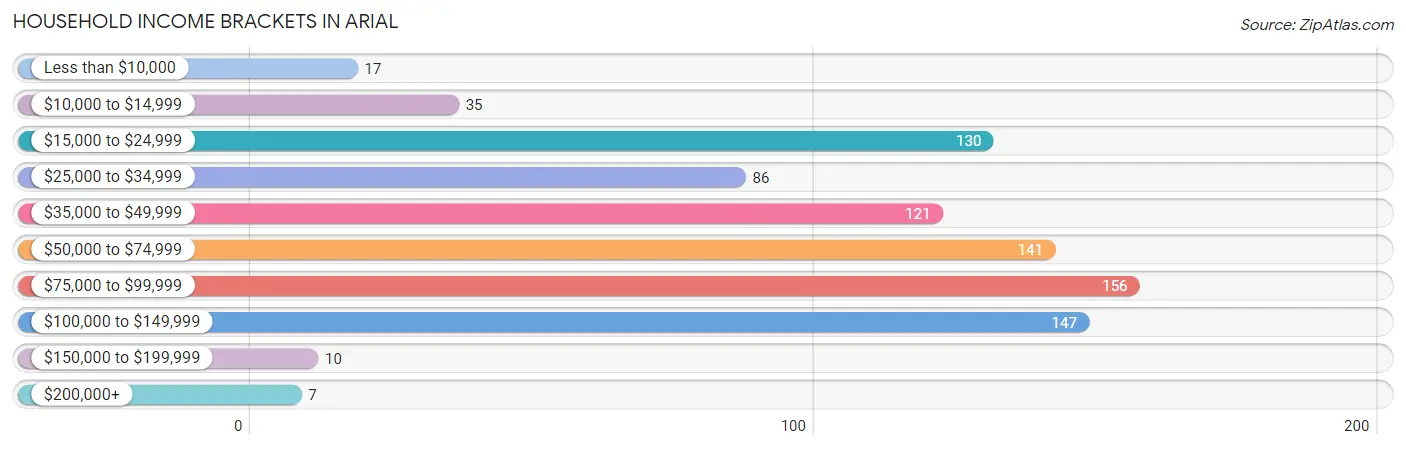
| Income Bracket | # Households | % Households |
| Less than $10,000 | 17 | 2.0% |
| $10,000 to $14,999 | 35 | 4.1% |
| $15,000 to $24,999 | 130 | 15.3% |
| $25,000 to $34,999 | 86 | 10.1% |
| $35,000 to $49,999 | 121 | 14.2% |
| $50,000 to $74,999 | 141 | 16.6% |
| $75,000 to $99,999 | 156 | 18.4% |
| $100,000 to $149,999 | 147 | 17.3% |
| $150,000 to $199,999 | 10 | 1.2% |
| $200,000+ | 7 | 0.8% |
Household Income by Householder Age in Arial
The median household income in Arial is $54,453, with the highest median household income of $87,747 found in the 25 to 44 years age bracket for the primary householder. A total of 205 households (24.1%) fall into this category. Meanwhile, the 15 to 24 years age bracket for the primary householder has the lowest median household income of $0, with 17 households (2.0%) in this group.
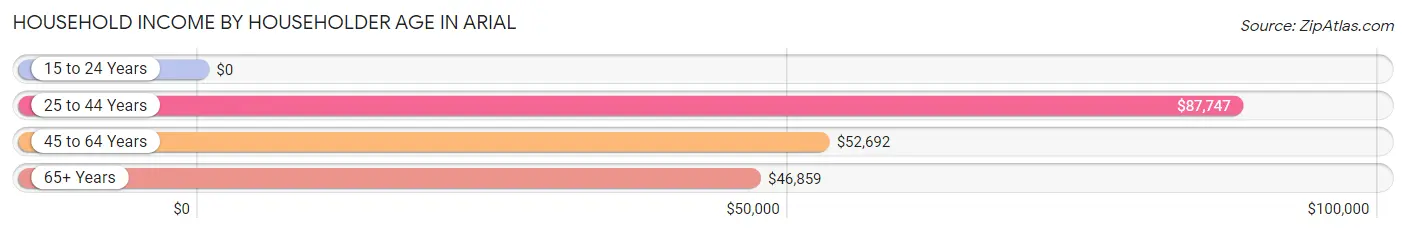
| Income Bracket | # Households | Median Income |
| 15 to 24 Years | 17 (2.0%) | $0 |
| 25 to 44 Years | 205 (24.1%) | $87,747 |
| 45 to 64 Years | 306 (36.0%) | $52,692 |
| 65+ Years | 322 (37.9%) | $46,859 |
| Total | 850 (100.0%) | $54,453 |
Poverty in Arial
Income Below Poverty by Sex and Age in Arial
With 7.4% poverty level for males and 18.5% for females among the residents of Arial, 25 to 34 year old males and under 5 year old females are the most vulnerable to poverty, with 51 males (41.8%) and 23 females (100.0%) in their respective age groups living below the poverty level.
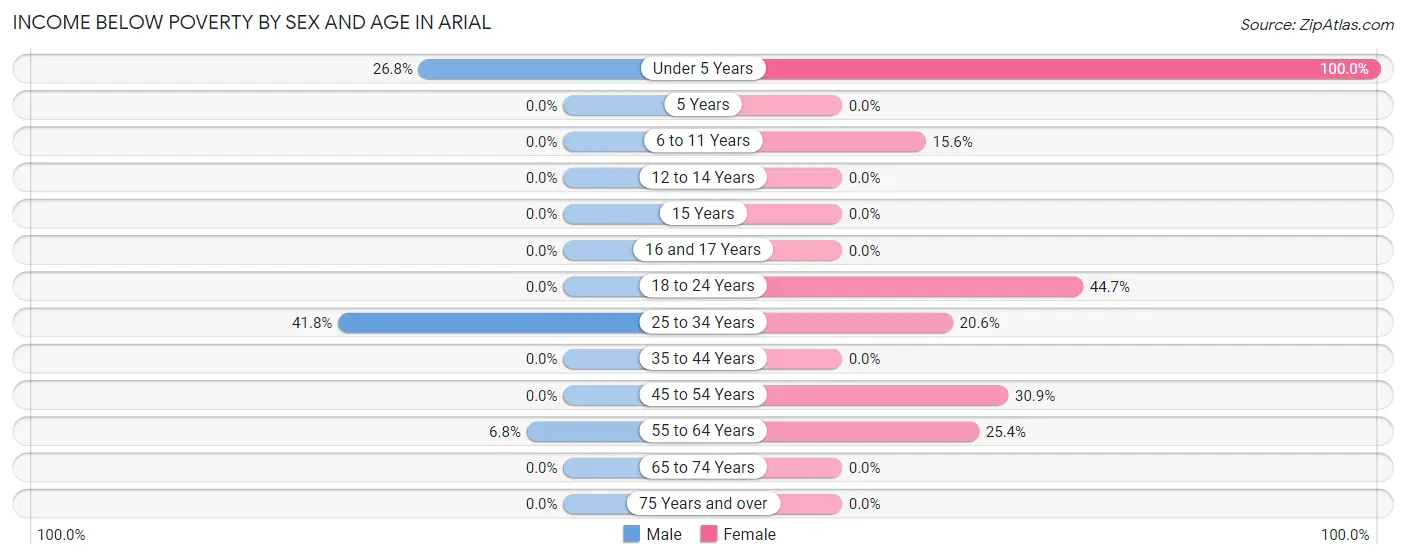
| Age Bracket | Male | Female |
| Under 5 Years | 11 (26.8%) | 23 (100.0%) |
| 5 Years | 0 (0.0%) | 0 (0.0%) |
| 6 to 11 Years | 0 (0.0%) | 7 (15.6%) |
| 12 to 14 Years | 0 (0.0%) | 0 (0.0%) |
| 15 Years | 0 (0.0%) | 0 (0.0%) |
| 16 and 17 Years | 0 (0.0%) | 0 (0.0%) |
| 18 to 24 Years | 0 (0.0%) | 17 (44.7%) |
| 25 to 34 Years | 51 (41.8%) | 29 (20.6%) |
| 35 to 44 Years | 0 (0.0%) | 0 (0.0%) |
| 45 to 54 Years | 0 (0.0%) | 25 (30.9%) |
| 55 to 64 Years | 10 (6.8%) | 43 (25.4%) |
| 65 to 74 Years | 0 (0.0%) | 0 (0.0%) |
| 75 Years and over | 0 (0.0%) | 0 (0.0%) |
| Total | 72 (7.4%) | 144 (18.5%) |
Income Above Poverty by Sex and Age in Arial
According to the poverty statistics in Arial, males aged 6 to 11 years and females aged 12 to 14 years are the age groups that are most secure financially, with 100.0% of males and 100.0% of females in these age groups living above the poverty line.
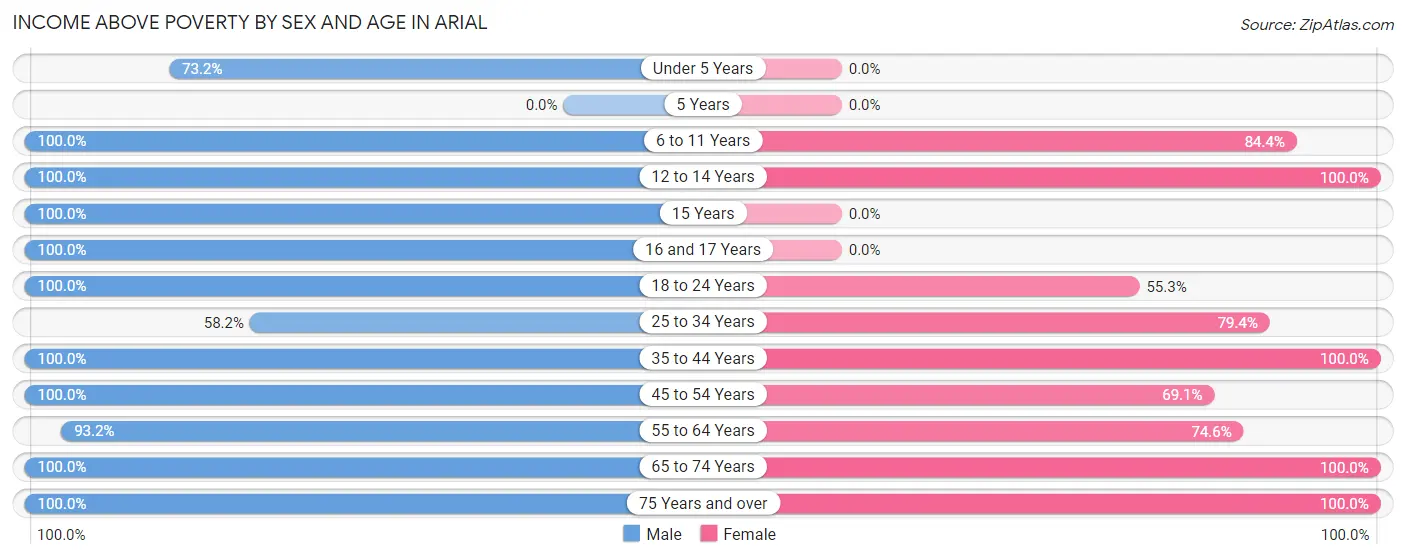
| Age Bracket | Male | Female |
| Under 5 Years | 30 (73.2%) | 0 (0.0%) |
| 5 Years | 0 (0.0%) | 0 (0.0%) |
| 6 to 11 Years | 20 (100.0%) | 38 (84.4%) |
| 12 to 14 Years | 13 (100.0%) | 9 (100.0%) |
| 15 Years | 30 (100.0%) | 0 (0.0%) |
| 16 and 17 Years | 16 (100.0%) | 0 (0.0%) |
| 18 to 24 Years | 45 (100.0%) | 21 (55.3%) |
| 25 to 34 Years | 71 (58.2%) | 112 (79.4%) |
| 35 to 44 Years | 137 (100.0%) | 27 (100.0%) |
| 45 to 54 Years | 92 (100.0%) | 56 (69.1%) |
| 55 to 64 Years | 137 (93.2%) | 126 (74.6%) |
| 65 to 74 Years | 167 (100.0%) | 162 (100.0%) |
| 75 Years and over | 142 (100.0%) | 83 (100.0%) |
| Total | 900 (92.6%) | 634 (81.5%) |
Income Below Poverty Among Married-Couple Families in Arial
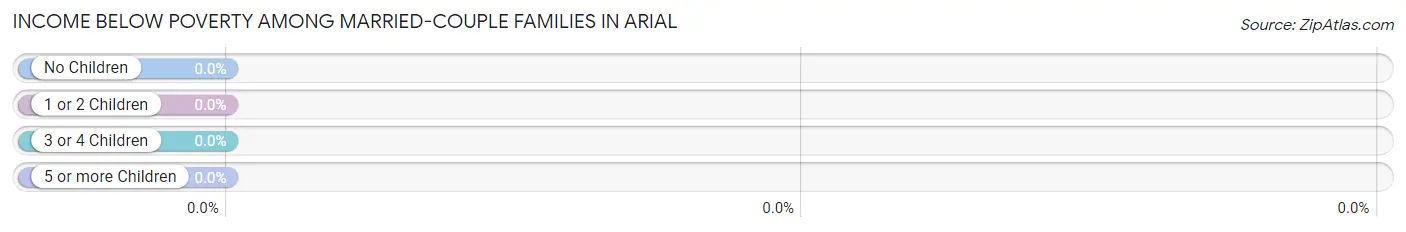
| Children | Above Poverty | Below Poverty |
| No Children | 279 (100.0%) | 0 (0.0%) |
| 1 or 2 Children | 155 (100.0%) | 0 (0.0%) |
| 3 or 4 Children | 0 (0.0%) | 0 (0.0%) |
| 5 or more Children | 7 (100.0%) | 0 (0.0%) |
| Total | 441 (100.0%) | 0 (0.0%) |
Income Below Poverty Among Single-Parent Households in Arial
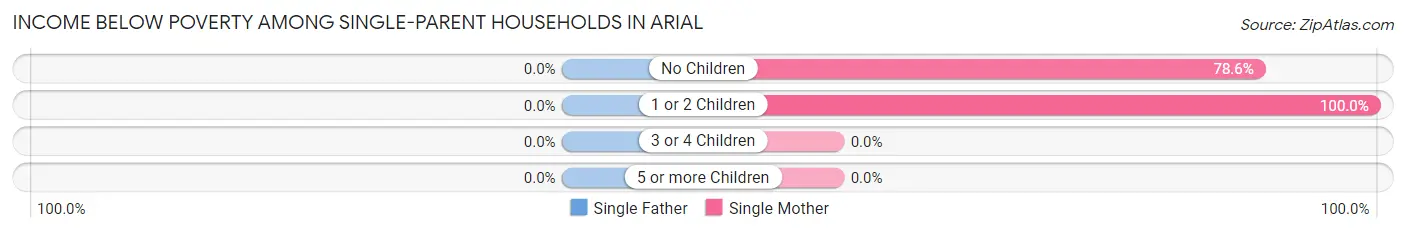
| Children | Single Father | Single Mother |
| No Children | 0 (0.0%) | 33 (78.6%) |
| 1 or 2 Children | 0 (0.0%) | 35 (100.0%) |
| 3 or 4 Children | 0 (0.0%) | 0 (0.0%) |
| 5 or more Children | 0 (0.0%) | 0 (0.0%) |
| Total | 0 (0.0%) | 68 (88.3%) |
Income Below Poverty Among Married-Couple vs Single-Parent Households in Arial
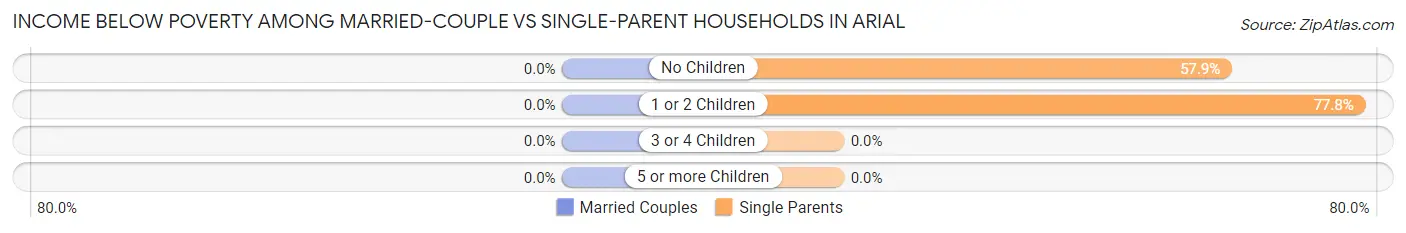
| Children | Married-Couple Families | Single-Parent Households |
| No Children | 0 (0.0%) | 33 (57.9%) |
| 1 or 2 Children | 0 (0.0%) | 35 (77.8%) |
| 3 or 4 Children | 0 (0.0%) | 0 (0.0%) |
| 5 or more Children | 0 (0.0%) | 0 (0.0%) |
| Total | 0 (0.0%) | 68 (66.7%) |
Employment Characteristics in Arial
Employment by Class of Employer in Arial
Among the 767 employed individuals in Arial, private company employees (621 | 81.0%), not-for-profit organizations (59 | 7.7%), and local government employees (30 | 3.9%) make up the most common classes of employment.
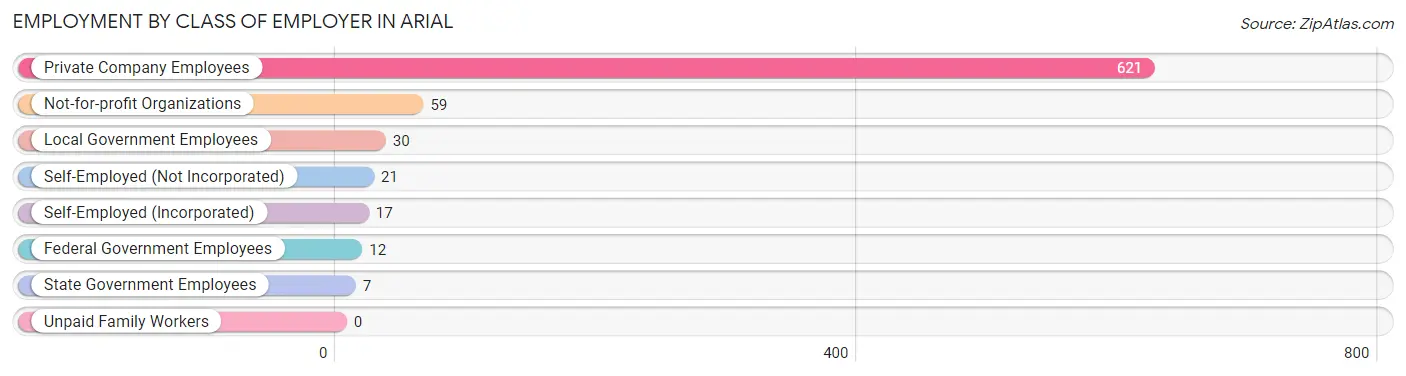
| Employer Class | # Employees | % Employees |
| Private Company Employees | 621 | 81.0% |
| Self-Employed (Incorporated) | 17 | 2.2% |
| Self-Employed (Not Incorporated) | 21 | 2.7% |
| Not-for-profit Organizations | 59 | 7.7% |
| Local Government Employees | 30 | 3.9% |
| State Government Employees | 7 | 0.9% |
| Federal Government Employees | 12 | 1.6% |
| Unpaid Family Workers | 0 | 0.0% |
| Total | 767 | 100.0% |
Employment Status by Age in Arial
According to the labor force statistics for Arial, out of the total population over 16 years of age (1,569), 50.3% or 789 individuals are in the labor force, with 1.3% or 10 of them unemployed. The age group with the highest labor force participation rate is 35 to 44 years, with 100.0% or 164 individuals in the labor force. Within the labor force, the 65 to 74 years age range has the highest percentage of unemployed individuals, with 15.4% or 10 of them being unemployed.
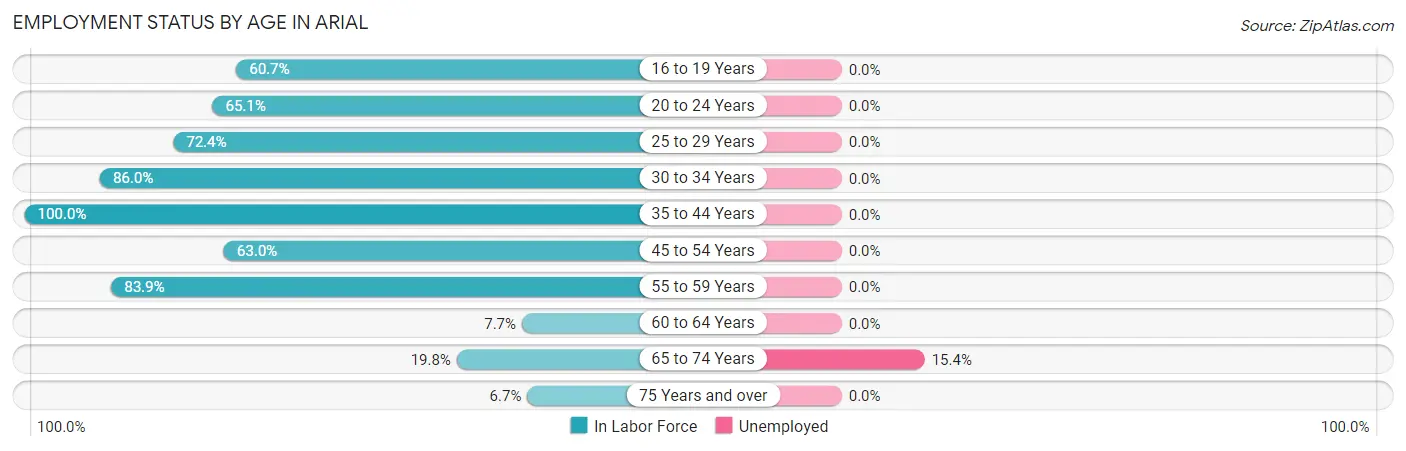
| Age Bracket | In Labor Force | Unemployed |
| 16 to 19 Years | 34 (60.7%) | 0 (0.0%) |
| 20 to 24 Years | 28 (65.1%) | 0 (0.0%) |
| 25 to 29 Years | 97 (72.4%) | 0 (0.0%) |
| 30 to 34 Years | 111 (86.0%) | 0 (0.0%) |
| 35 to 44 Years | 164 (100.0%) | 0 (0.0%) |
| 45 to 54 Years | 109 (63.0%) | 0 (0.0%) |
| 55 to 59 Years | 156 (83.9%) | 0 (0.0%) |
| 60 to 64 Years | 10 (7.7%) | 0 (0.0%) |
| 65 to 74 Years | 65 (19.8%) | 10 (15.4%) |
| 75 Years and over | 15 (6.7%) | 0 (0.0%) |
| Total | 789 (50.3%) | 10 (1.3%) |
Employment Status by Educational Attainment in Arial
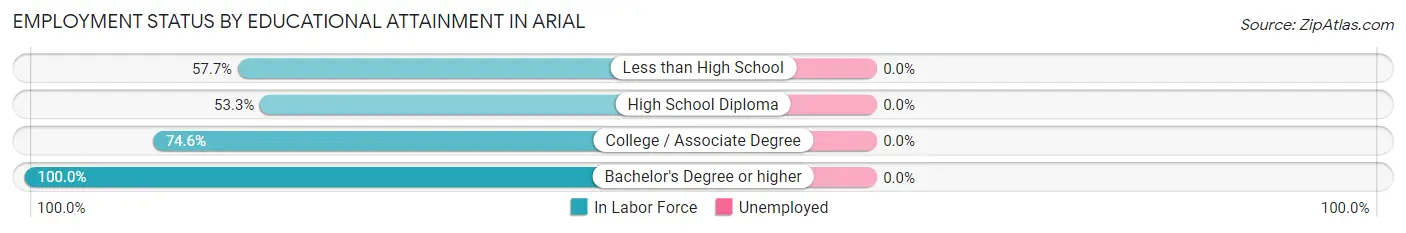
| Educational Attainment | In Labor Force | Unemployed |
| Less than High School | 41 (57.7%) | 0 (0.0%) |
| High School Diploma | 172 (53.3%) | 0 (0.0%) |
| College / Associate Degree | 258 (74.6%) | 0 (0.0%) |
| Bachelor's Degree or higher | 176 (100.0%) | 0 (0.0%) |
| Total | 647 (70.6%) | 0 (0.0%) |
Employment Occupations by Sex in Arial
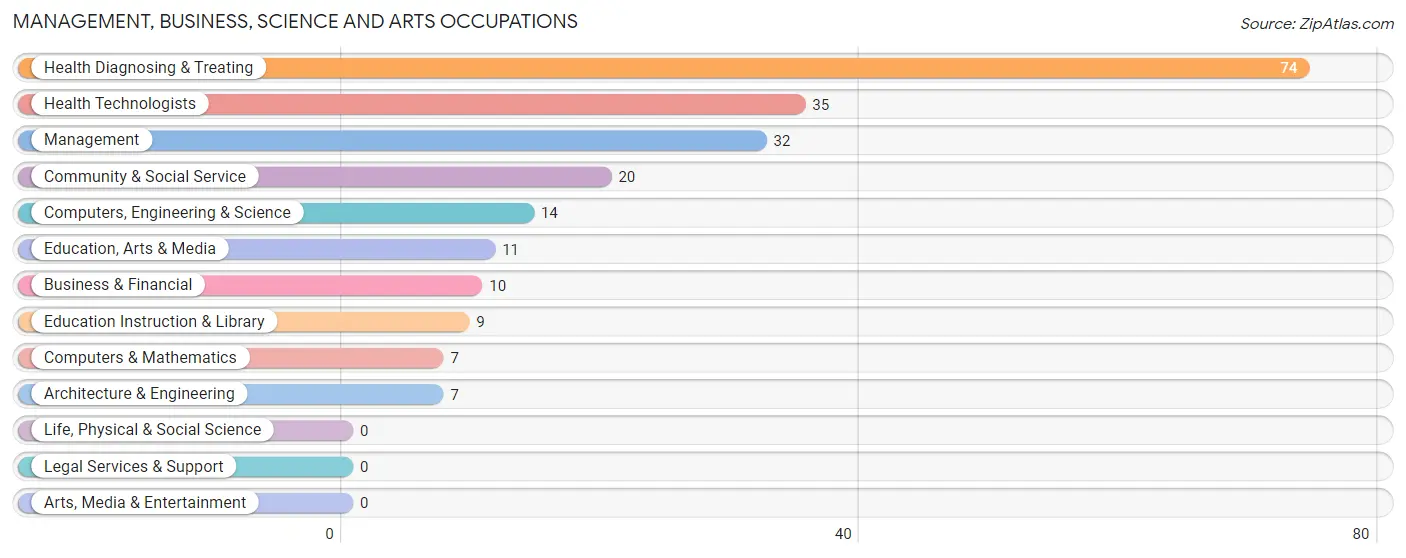
Management, Business, Science and Arts Occupations
The most common Management, Business, Science and Arts occupations in Arial are Health Diagnosing & Treating (74 | 9.5%), Health Technologists (35 | 4.5%), Management (32 | 4.1%), Community & Social Service (20 | 2.6%), and Computers, Engineering & Science (14 | 1.8%).
Management, Business, Science and Arts Occupations by Sex
Within the Management, Business, Science and Arts occupations in Arial, the most male-oriented occupations are Computers, Engineering & Science (100.0%), Computers & Mathematics (100.0%), and Architecture & Engineering (100.0%), while the most female-oriented occupations are Business & Financial (100.0%), Education Instruction & Library (100.0%), and Health Technologists (100.0%).
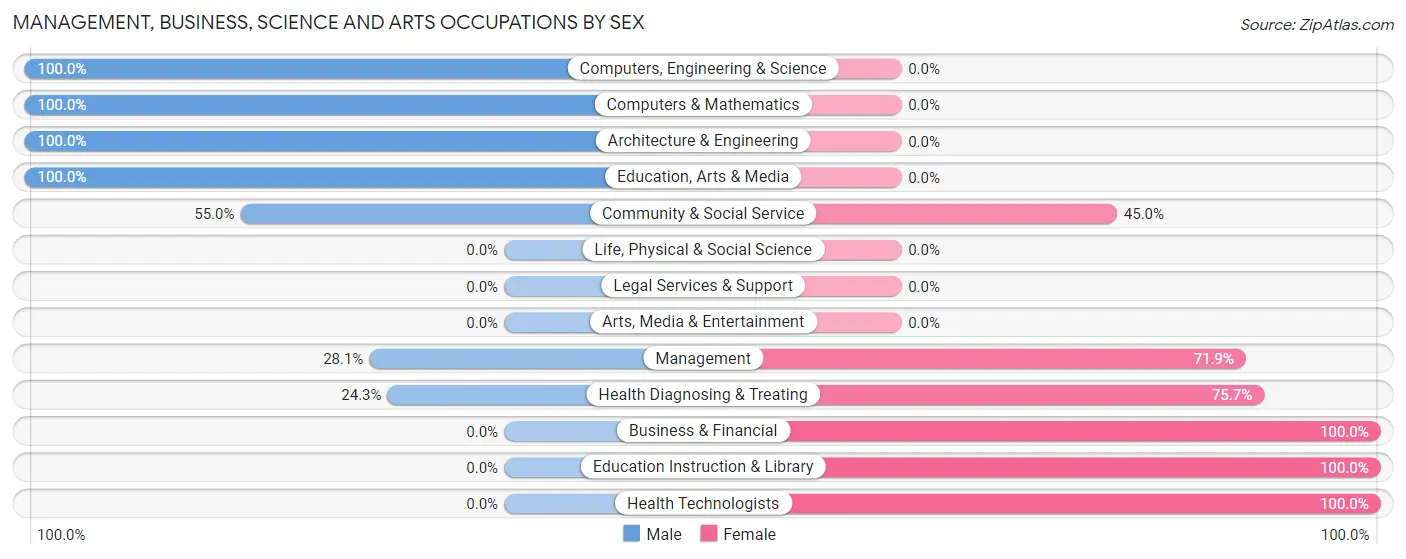
| Occupation | Male | Female |
| Management | 9 (28.1%) | 23 (71.9%) |
| Business & Financial | 0 (0.0%) | 10 (100.0%) |
| Computers, Engineering & Science | 14 (100.0%) | 0 (0.0%) |
| Computers & Mathematics | 7 (100.0%) | 0 (0.0%) |
| Architecture & Engineering | 7 (100.0%) | 0 (0.0%) |
| Life, Physical & Social Science | 0 (0.0%) | 0 (0.0%) |
| Community & Social Service | 11 (55.0%) | 9 (45.0%) |
| Education, Arts & Media | 11 (100.0%) | 0 (0.0%) |
| Legal Services & Support | 0 (0.0%) | 0 (0.0%) |
| Education Instruction & Library | 0 (0.0%) | 9 (100.0%) |
| Arts, Media & Entertainment | 0 (0.0%) | 0 (0.0%) |
| Health Diagnosing & Treating | 18 (24.3%) | 56 (75.7%) |
| Health Technologists | 0 (0.0%) | 35 (100.0%) |
| Total (Category) | 52 (34.7%) | 98 (65.3%) |
| Total (Overall) | 438 (56.2%) | 341 (43.8%) |
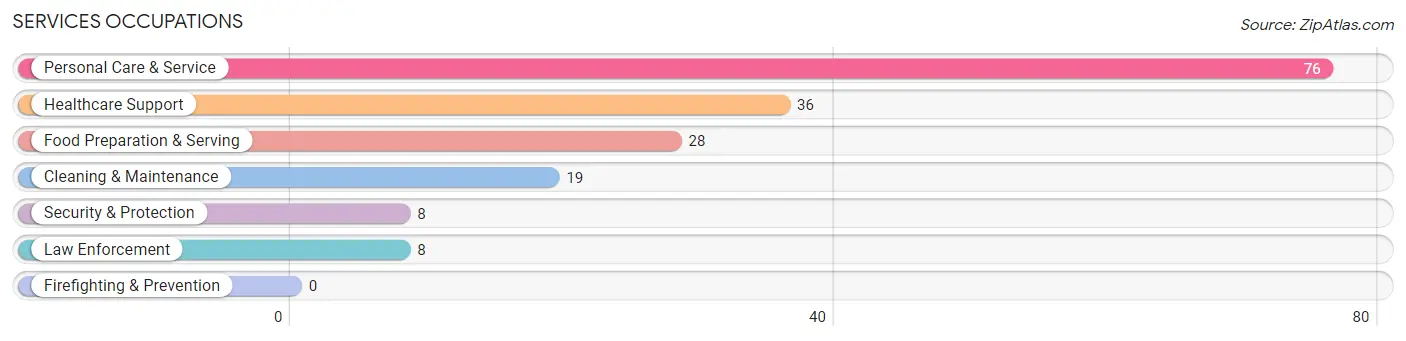
Services Occupations
The most common Services occupations in Arial are Personal Care & Service (76 | 9.8%), Healthcare Support (36 | 4.6%), Food Preparation & Serving (28 | 3.6%), Cleaning & Maintenance (19 | 2.4%), and Security & Protection (8 | 1.0%).
Services Occupations by Sex
Within the Services occupations in Arial, the most male-oriented occupations are Security & Protection (100.0%), Law Enforcement (100.0%), and Cleaning & Maintenance (100.0%), while the most female-oriented occupations are Healthcare Support (100.0%), Personal Care & Service (100.0%), and Food Preparation & Serving (35.7%).
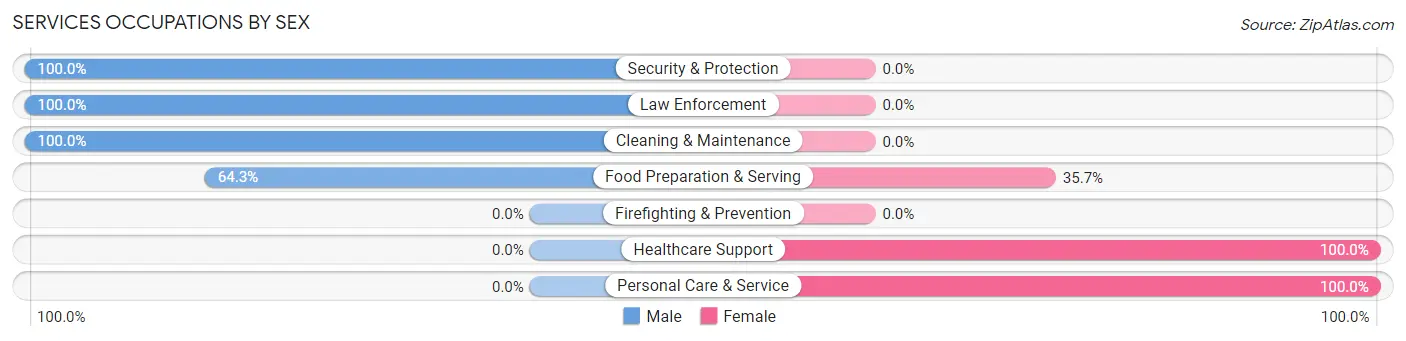
| Occupation | Male | Female |
| Healthcare Support | 0 (0.0%) | 36 (100.0%) |
| Security & Protection | 8 (100.0%) | 0 (0.0%) |
| Firefighting & Prevention | 0 (0.0%) | 0 (0.0%) |
| Law Enforcement | 8 (100.0%) | 0 (0.0%) |
| Food Preparation & Serving | 18 (64.3%) | 10 (35.7%) |
| Cleaning & Maintenance | 19 (100.0%) | 0 (0.0%) |
| Personal Care & Service | 0 (0.0%) | 76 (100.0%) |
| Total (Category) | 45 (27.0%) | 122 (73.1%) |
| Total (Overall) | 438 (56.2%) | 341 (43.8%) |
Sales and Office Occupations
The most common Sales and Office occupations in Arial are Sales & Related (192 | 24.6%), and Office & Administration (60 | 7.7%).
Sales and Office Occupations by Sex
| Occupation | Male | Female |
| Sales & Related | 132 (68.8%) | 60 (31.2%) |
| Office & Administration | 33 (55.0%) | 27 (45.0%) |
| Total (Category) | 165 (65.5%) | 87 (34.5%) |
| Total (Overall) | 438 (56.2%) | 341 (43.8%) |
Natural Resources, Construction and Maintenance Occupations
The most common Natural Resources, Construction and Maintenance occupations in Arial are Installation, Maintenance & Repair (34 | 4.4%), and Construction & Extraction (33 | 4.2%).
Natural Resources, Construction and Maintenance Occupations by Sex
| Occupation | Male | Female |
| Farming, Fishing & Forestry | 0 (0.0%) | 0 (0.0%) |
| Construction & Extraction | 33 (100.0%) | 0 (0.0%) |
| Installation, Maintenance & Repair | 34 (100.0%) | 0 (0.0%) |
| Total (Category) | 67 (100.0%) | 0 (0.0%) |
| Total (Overall) | 438 (56.2%) | 341 (43.8%) |
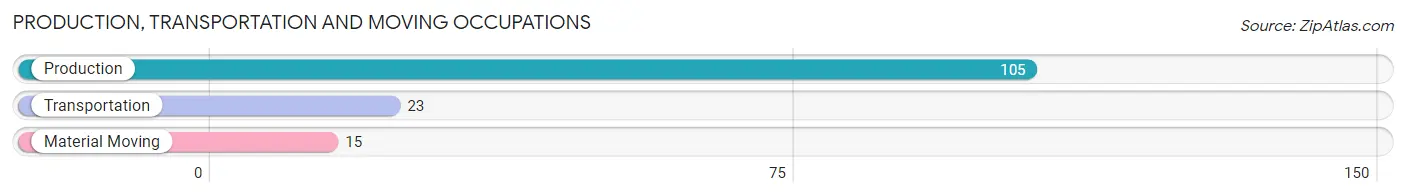
Production, Transportation and Moving Occupations
The most common Production, Transportation and Moving occupations in Arial are Production (105 | 13.5%), Transportation (23 | 2.9%), and Material Moving (15 | 1.9%).
Production, Transportation and Moving Occupations by Sex
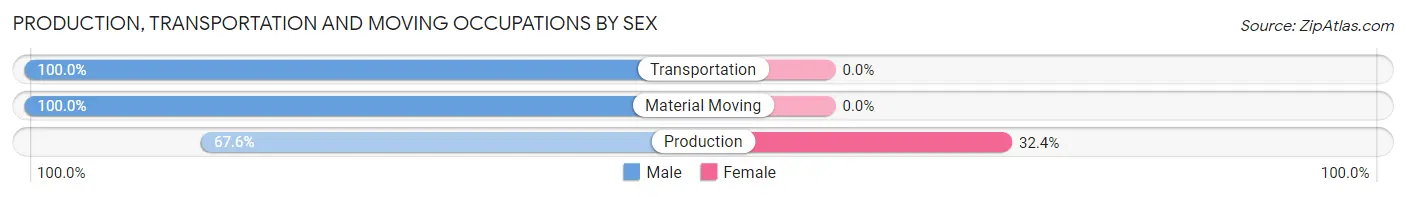
| Occupation | Male | Female |
| Production | 71 (67.6%) | 34 (32.4%) |
| Transportation | 23 (100.0%) | 0 (0.0%) |
| Material Moving | 15 (100.0%) | 0 (0.0%) |
| Total (Category) | 109 (76.2%) | 34 (23.8%) |
| Total (Overall) | 438 (56.2%) | 341 (43.8%) |
Employment Industries by Sex in Arial
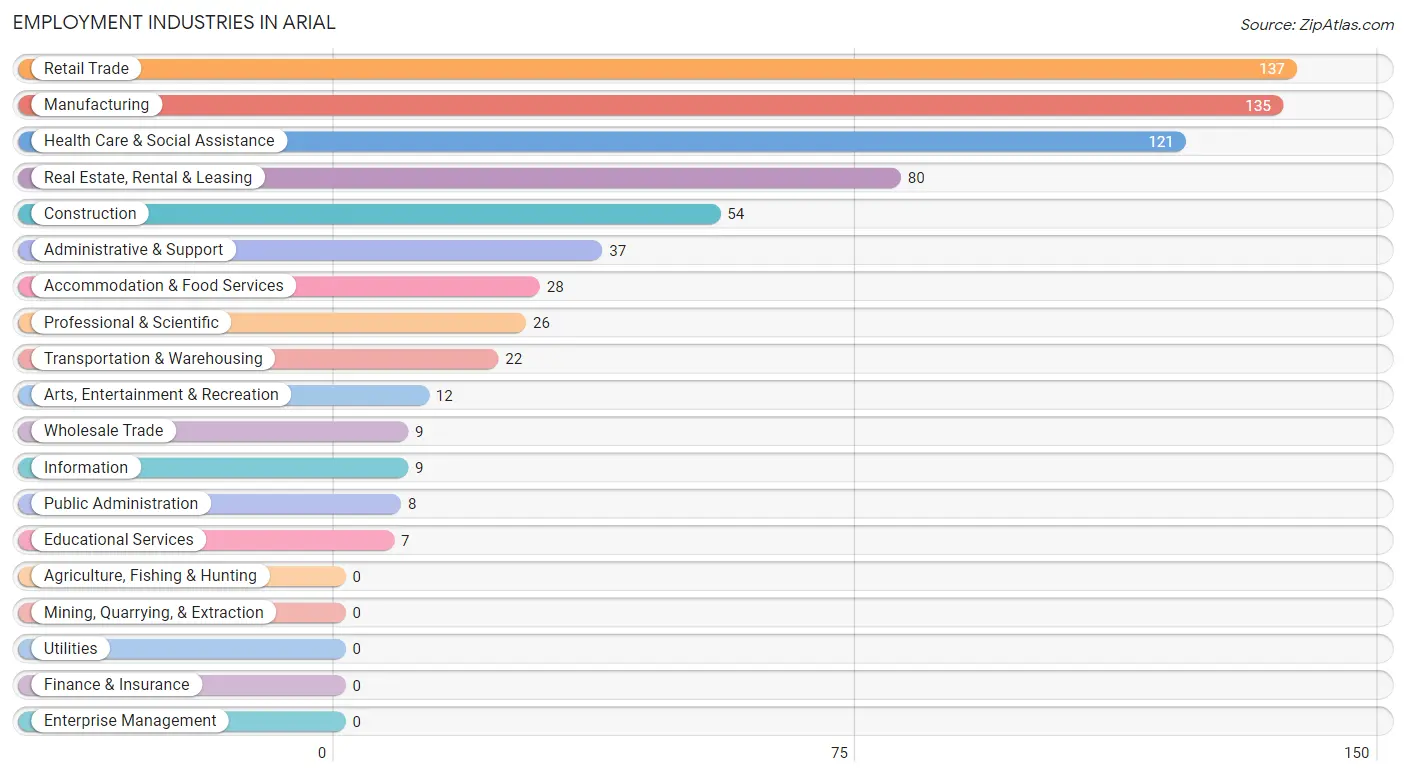
Employment Industries in Arial
The major employment industries in Arial include Retail Trade (137 | 17.6%), Manufacturing (135 | 17.3%), Health Care & Social Assistance (121 | 15.5%), Real Estate, Rental & Leasing (80 | 10.3%), and Construction (54 | 6.9%).
Employment Industries by Sex in Arial
The Arial industries that see more men than women are Wholesale Trade (100.0%), Transportation & Warehousing (100.0%), and Real Estate, Rental & Leasing (100.0%), whereas the industries that tend to have a higher number of women are Information (100.0%), Arts, Entertainment & Recreation (100.0%), and Health Care & Social Assistance (85.1%).
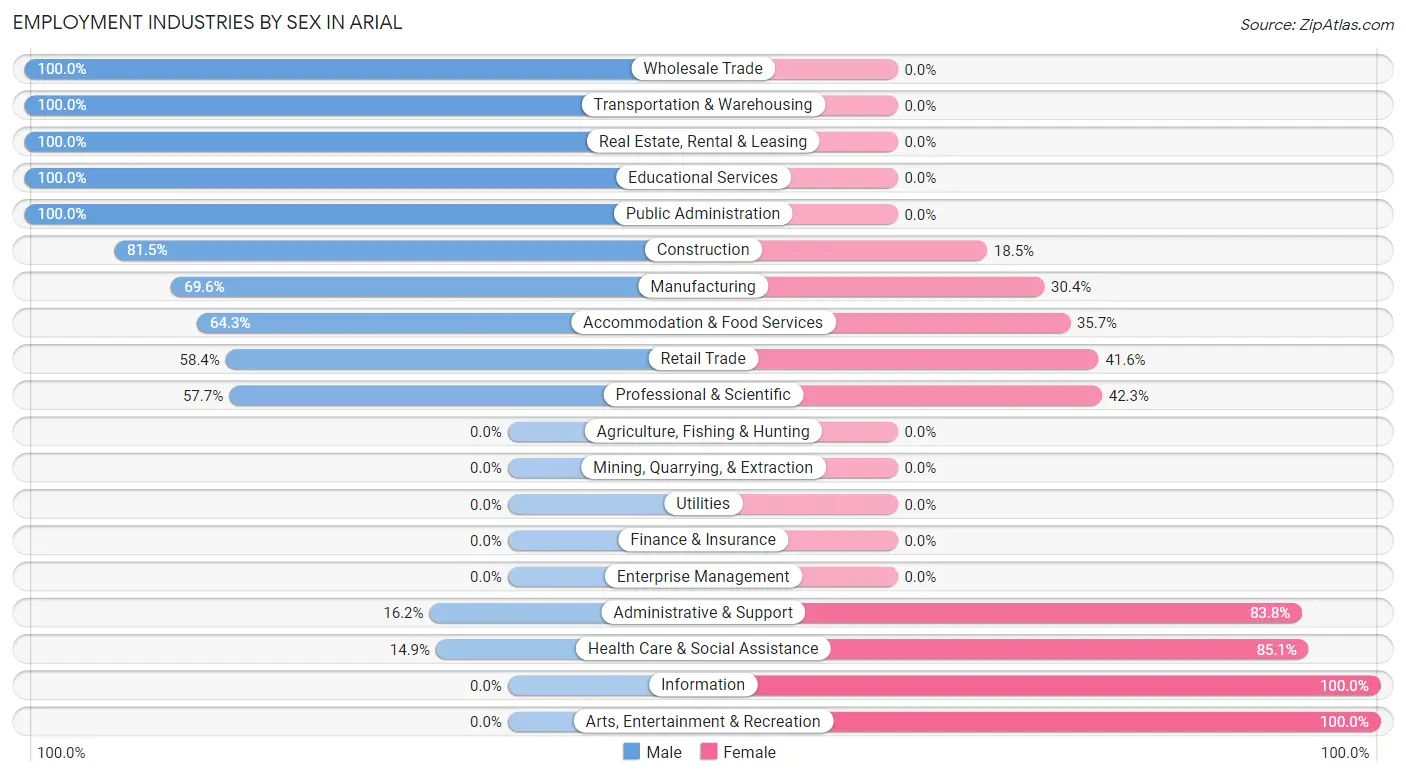
| Industry | Male | Female |
| Agriculture, Fishing & Hunting | 0 (0.0%) | 0 (0.0%) |
| Mining, Quarrying, & Extraction | 0 (0.0%) | 0 (0.0%) |
| Construction | 44 (81.5%) | 10 (18.5%) |
| Manufacturing | 94 (69.6%) | 41 (30.4%) |
| Wholesale Trade | 9 (100.0%) | 0 (0.0%) |
| Retail Trade | 80 (58.4%) | 57 (41.6%) |
| Transportation & Warehousing | 22 (100.0%) | 0 (0.0%) |
| Utilities | 0 (0.0%) | 0 (0.0%) |
| Information | 0 (0.0%) | 9 (100.0%) |
| Finance & Insurance | 0 (0.0%) | 0 (0.0%) |
| Real Estate, Rental & Leasing | 80 (100.0%) | 0 (0.0%) |
| Professional & Scientific | 15 (57.7%) | 11 (42.3%) |
| Enterprise Management | 0 (0.0%) | 0 (0.0%) |
| Administrative & Support | 6 (16.2%) | 31 (83.8%) |
| Educational Services | 7 (100.0%) | 0 (0.0%) |
| Health Care & Social Assistance | 18 (14.9%) | 103 (85.1%) |
| Arts, Entertainment & Recreation | 0 (0.0%) | 12 (100.0%) |
| Accommodation & Food Services | 18 (64.3%) | 10 (35.7%) |
| Public Administration | 8 (100.0%) | 0 (0.0%) |
| Total | 438 (56.2%) | 341 (43.8%) |
Education in Arial
School Enrollment in Arial
The most common levels of schooling among the 201 students in Arial are high school (74 | 36.8%), elementary school (65 | 32.3%), and college / undergraduate (34 | 16.9%).
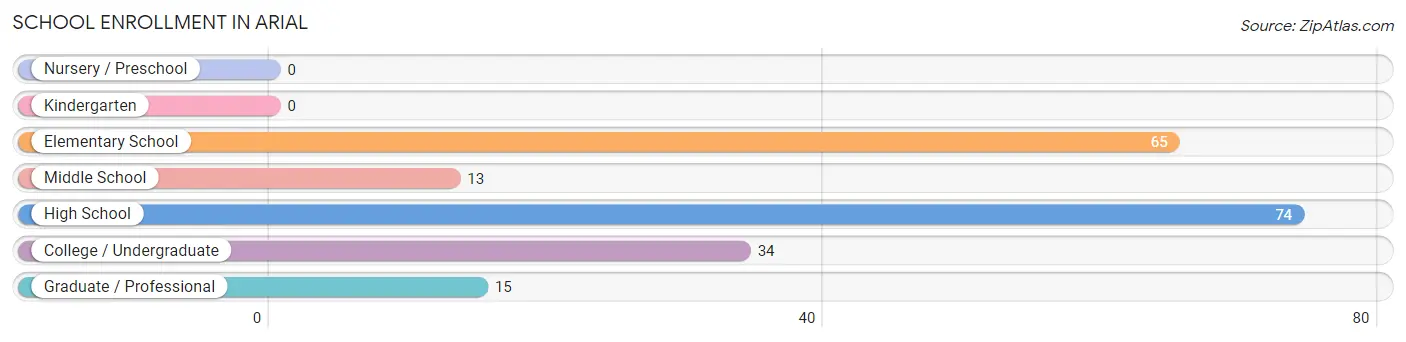
| School Level | # Students | % Students |
| Nursery / Preschool | 0 | 0.0% |
| Kindergarten | 0 | 0.0% |
| Elementary School | 65 | 32.3% |
| Middle School | 13 | 6.5% |
| High School | 74 | 36.8% |
| College / Undergraduate | 34 | 16.9% |
| Graduate / Professional | 15 | 7.5% |
| Total | 201 | 100.0% |
School Enrollment by Age by Funding Source in Arial
Out of a total of 201 students who are enrolled in schools in Arial, 37 (18.4%) attend a private institution, while the remaining 164 (81.6%) are enrolled in public schools. The age group of 25 to 34 year olds has the highest likelihood of being enrolled in private schools, with 18 (100.0% in the age bracket) enrolled. Conversely, the age group of 5 to 9 year old has the lowest likelihood of being enrolled in a private school, with 58 (100.0% in the age bracket) attending a public institution.
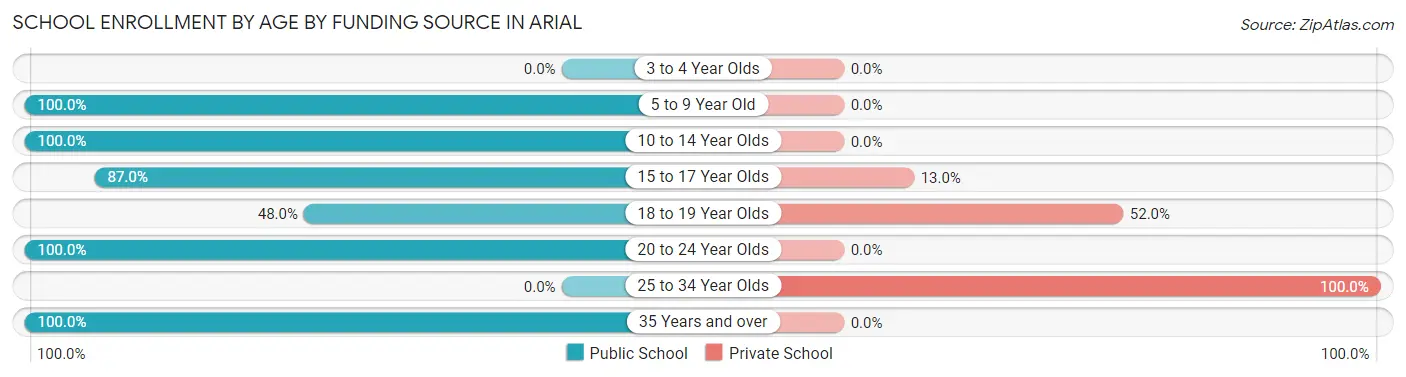
| Age Bracket | Public School | Private School |
| 3 to 4 Year Olds | 0 (0.0%) | 0 (0.0%) |
| 5 to 9 Year Old | 58 (100.0%) | 0 (0.0%) |
| 10 to 14 Year Olds | 29 (100.0%) | 0 (0.0%) |
| 15 to 17 Year Olds | 40 (87.0%) | 6 (13.0%) |
| 18 to 19 Year Olds | 12 (48.0%) | 13 (52.0%) |
| 20 to 24 Year Olds | 10 (100.0%) | 0 (0.0%) |
| 25 to 34 Year Olds | 0 (0.0%) | 18 (100.0%) |
| 35 Years and over | 15 (100.0%) | 0 (0.0%) |
| Total | 164 (81.6%) | 37 (18.4%) |
Educational Attainment by Field of Study in Arial
Business (90 | 33.6%), psychology (48 | 17.9%), science & technology (26 | 9.7%), physical & health sciences (24 | 9.0%), and liberal arts & history (20 | 7.5%) are the most common fields of study among 268 individuals in Arial who have obtained a bachelor's degree or higher.

| Field of Study | # Graduates | % Graduates |
| Computers & Mathematics | 0 | 0.0% |
| Bio, Nature & Agricultural | 0 | 0.0% |
| Physical & Health Sciences | 24 | 9.0% |
| Psychology | 48 | 17.9% |
| Social Sciences | 0 | 0.0% |
| Engineering | 17 | 6.3% |
| Multidisciplinary Studies | 0 | 0.0% |
| Science & Technology | 26 | 9.7% |
| Business | 90 | 33.6% |
| Education | 15 | 5.6% |
| Literature & Languages | 0 | 0.0% |
| Liberal Arts & History | 20 | 7.5% |
| Visual & Performing Arts | 9 | 3.4% |
| Communications | 0 | 0.0% |
| Arts & Humanities | 19 | 7.1% |
| Total | 268 | 100.0% |
Transportation & Commute in Arial
Vehicle Availability by Sex in Arial
The most prevalent vehicle ownership categories in Arial are males with 2 vehicles (171, accounting for 40.1%) and females with 2 vehicles (131, making up 50.1%).
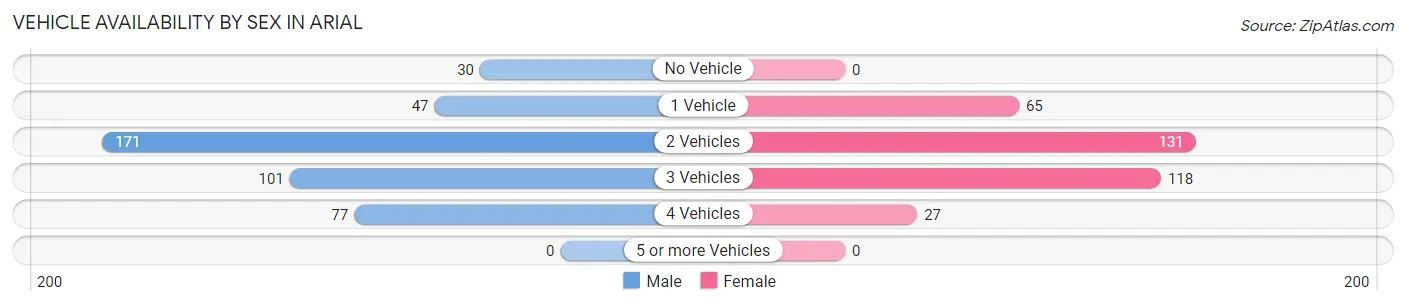
| Vehicles Available | Male | Female |
| No Vehicle | 30 (7.0%) | 0 (0.0%) |
| 1 Vehicle | 47 (11.0%) | 65 (19.1%) |
| 2 Vehicles | 171 (40.1%) | 131 (38.4%) |
| 3 Vehicles | 101 (23.7%) | 118 (34.6%) |
| 4 Vehicles | 77 (18.1%) | 27 (7.9%) |
| 5 or more Vehicles | 0 (0.0%) | 0 (0.0%) |
| Total | 426 (100.0%) | 341 (100.0%) |
Commute Time in Arial
The most frequently occuring commute durations in Arial are 30 to 34 minutes (137 commuters, 18.4%), 45 to 59 minutes (120 commuters, 16.1%), and 20 to 24 minutes (113 commuters, 15.2%).
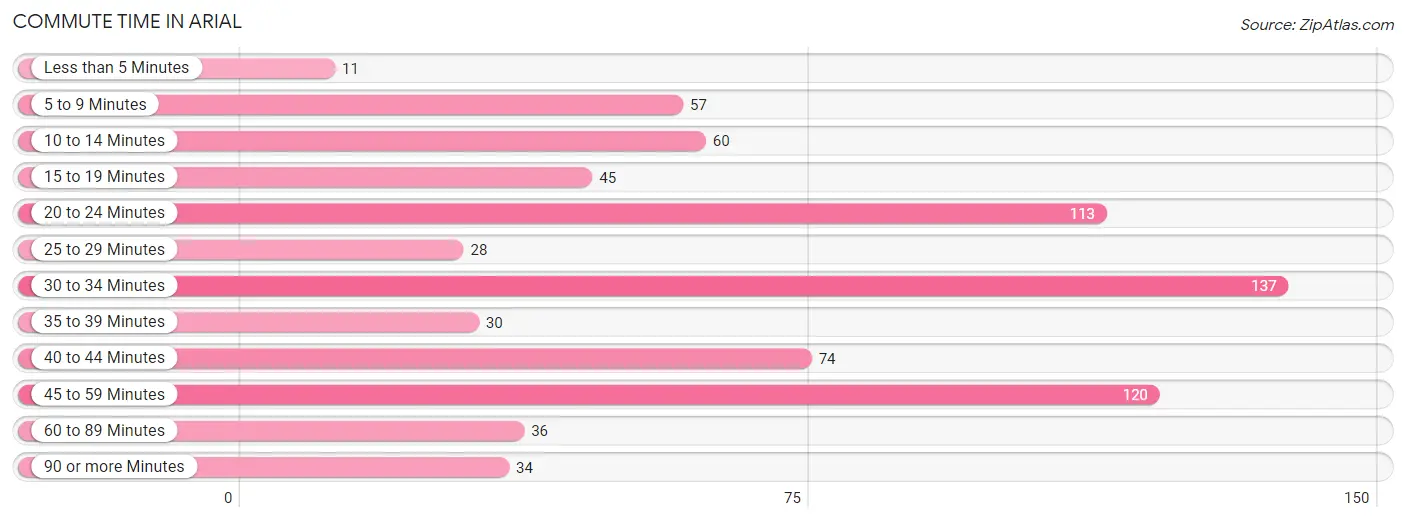
| Commute Time | # Commuters | % Commuters |
| Less than 5 Minutes | 11 | 1.5% |
| 5 to 9 Minutes | 57 | 7.6% |
| 10 to 14 Minutes | 60 | 8.1% |
| 15 to 19 Minutes | 45 | 6.0% |
| 20 to 24 Minutes | 113 | 15.2% |
| 25 to 29 Minutes | 28 | 3.8% |
| 30 to 34 Minutes | 137 | 18.4% |
| 35 to 39 Minutes | 30 | 4.0% |
| 40 to 44 Minutes | 74 | 9.9% |
| 45 to 59 Minutes | 120 | 16.1% |
| 60 to 89 Minutes | 36 | 4.8% |
| 90 or more Minutes | 34 | 4.6% |
Commute Time by Sex in Arial
The most common commute times in Arial are 45 to 59 minutes (110 commuters, 26.3%) for males and 20 to 24 minutes (85 commuters, 26.1%) for females.
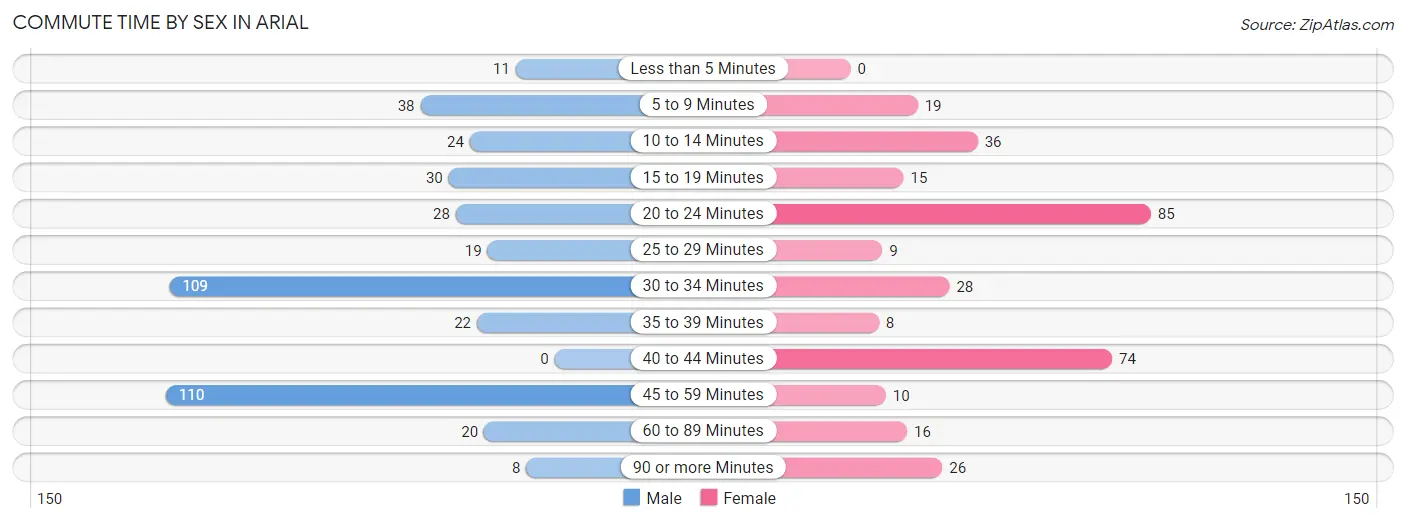
| Commute Time | Male | Female |
| Less than 5 Minutes | 11 (2.6%) | 0 (0.0%) |
| 5 to 9 Minutes | 38 (9.1%) | 19 (5.8%) |
| 10 to 14 Minutes | 24 (5.7%) | 36 (11.0%) |
| 15 to 19 Minutes | 30 (7.2%) | 15 (4.6%) |
| 20 to 24 Minutes | 28 (6.7%) | 85 (26.1%) |
| 25 to 29 Minutes | 19 (4.5%) | 9 (2.8%) |
| 30 to 34 Minutes | 109 (26.0%) | 28 (8.6%) |
| 35 to 39 Minutes | 22 (5.2%) | 8 (2.5%) |
| 40 to 44 Minutes | 0 (0.0%) | 74 (22.7%) |
| 45 to 59 Minutes | 110 (26.3%) | 10 (3.1%) |
| 60 to 89 Minutes | 20 (4.8%) | 16 (4.9%) |
| 90 or more Minutes | 8 (1.9%) | 26 (8.0%) |
Time of Departure to Work by Sex in Arial
The most frequent times of departure to work in Arial are 6:00 AM to 6:29 AM (163, 38.9%) for males and 7:00 AM to 7:29 AM (95, 29.1%) for females.
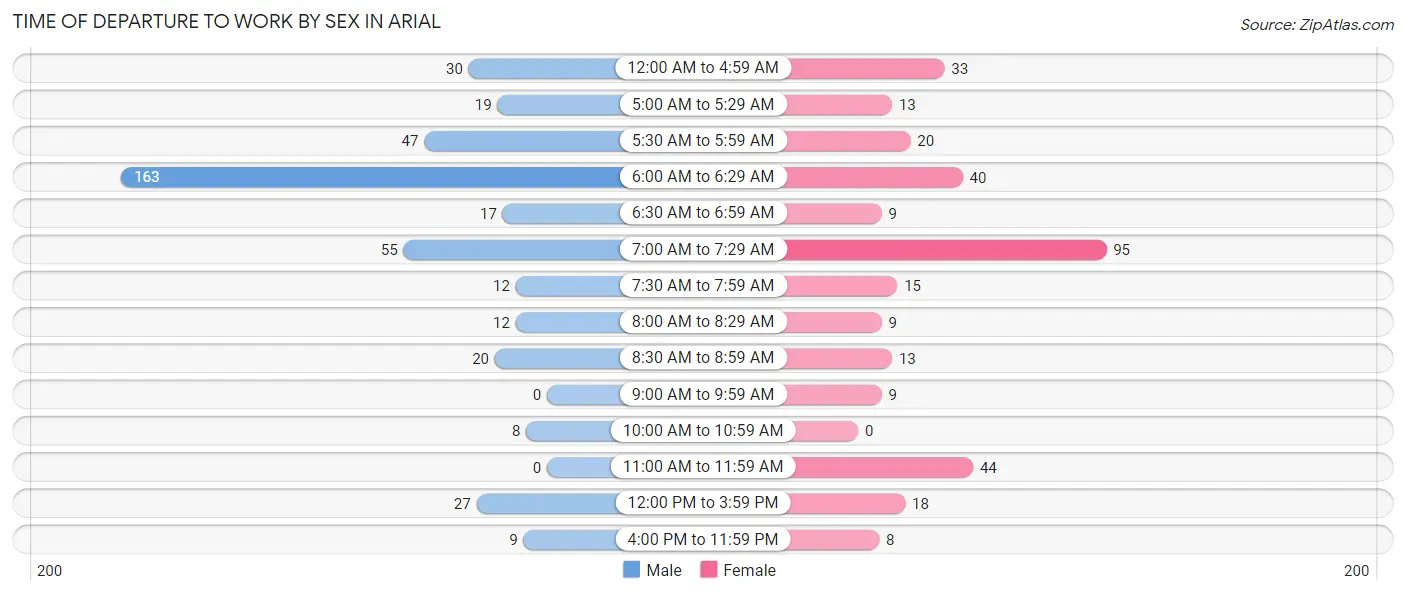
| Time of Departure | Male | Female |
| 12:00 AM to 4:59 AM | 30 (7.2%) | 33 (10.1%) |
| 5:00 AM to 5:29 AM | 19 (4.5%) | 13 (4.0%) |
| 5:30 AM to 5:59 AM | 47 (11.2%) | 20 (6.1%) |
| 6:00 AM to 6:29 AM | 163 (38.9%) | 40 (12.3%) |
| 6:30 AM to 6:59 AM | 17 (4.1%) | 9 (2.8%) |
| 7:00 AM to 7:29 AM | 55 (13.1%) | 95 (29.1%) |
| 7:30 AM to 7:59 AM | 12 (2.9%) | 15 (4.6%) |
| 8:00 AM to 8:29 AM | 12 (2.9%) | 9 (2.8%) |
| 8:30 AM to 8:59 AM | 20 (4.8%) | 13 (4.0%) |
| 9:00 AM to 9:59 AM | 0 (0.0%) | 9 (2.8%) |
| 10:00 AM to 10:59 AM | 8 (1.9%) | 0 (0.0%) |
| 11:00 AM to 11:59 AM | 0 (0.0%) | 44 (13.5%) |
| 12:00 PM to 3:59 PM | 27 (6.4%) | 18 (5.5%) |
| 4:00 PM to 11:59 PM | 9 (2.1%) | 8 (2.5%) |
| Total | 419 (100.0%) | 326 (100.0%) |
Housing Occupancy in Arial
Occupancy by Ownership in Arial
Of the total 850 dwellings in Arial, owner-occupied units account for 753 (88.6%), while renter-occupied units make up 97 (11.4%).
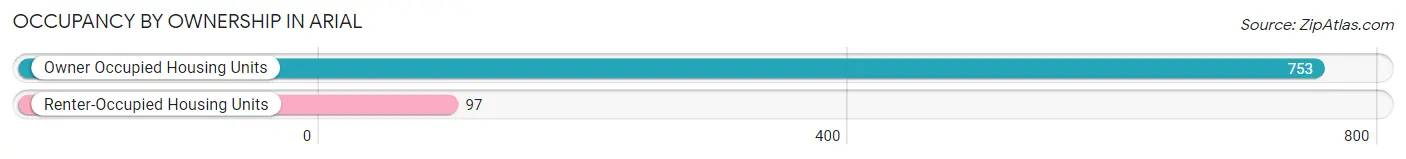
| Occupancy | # Housing Units | % Housing Units |
| Owner Occupied Housing Units | 753 | 88.6% |
| Renter-Occupied Housing Units | 97 | 11.4% |
| Total Occupied Housing Units | 850 | 100.0% |
Occupancy by Household Size in Arial

| Household Size | # Housing Units | % Housing Units |
| 1-Person Household | 266 | 31.3% |
| 2-Person Household | 221 | 26.0% |
| 3-Person Household | 321 | 37.8% |
| 4+ Person Household | 42 | 4.9% |
| Total Housing Units | 850 | 100.0% |
Occupancy by Ownership by Household Size in Arial
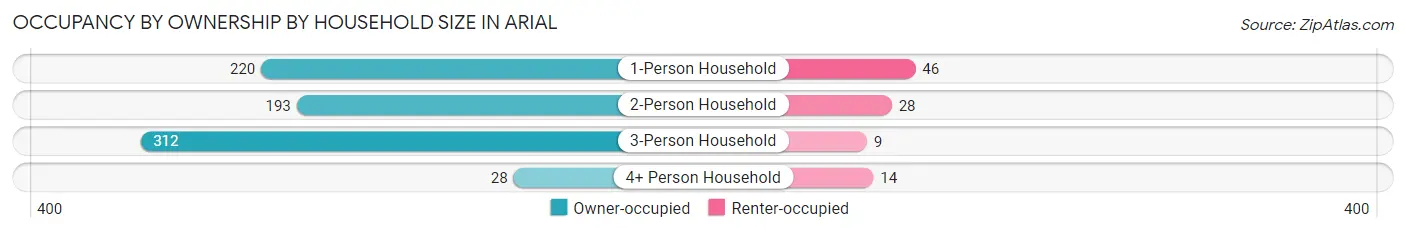
| Household Size | Owner-occupied | Renter-occupied |
| 1-Person Household | 220 (82.7%) | 46 (17.3%) |
| 2-Person Household | 193 (87.3%) | 28 (12.7%) |
| 3-Person Household | 312 (97.2%) | 9 (2.8%) |
| 4+ Person Household | 28 (66.7%) | 14 (33.3%) |
| Total Housing Units | 753 (88.6%) | 97 (11.4%) |
Occupancy by Educational Attainment in Arial
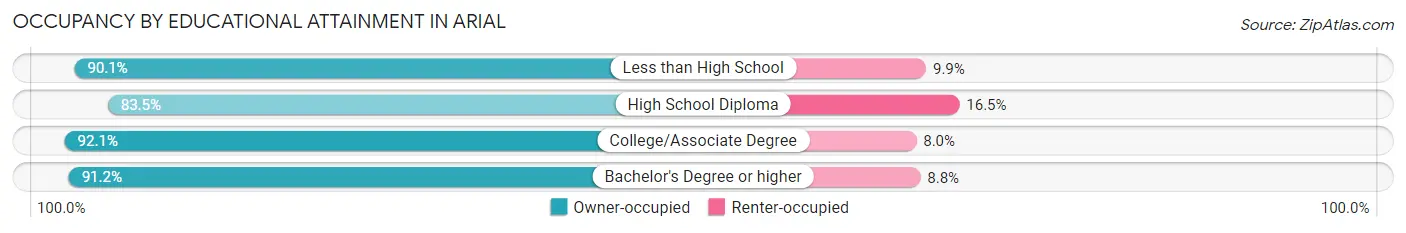
| Household Size | Owner-occupied | Renter-occupied |
| Less than High School | 82 (90.1%) | 9 (9.9%) |
| High School Diploma | 253 (83.5%) | 50 (16.5%) |
| College/Associate Degree | 220 (92.0%) | 19 (8.0%) |
| Bachelor's Degree or higher | 198 (91.2%) | 19 (8.8%) |
Occupancy by Age of Householder in Arial
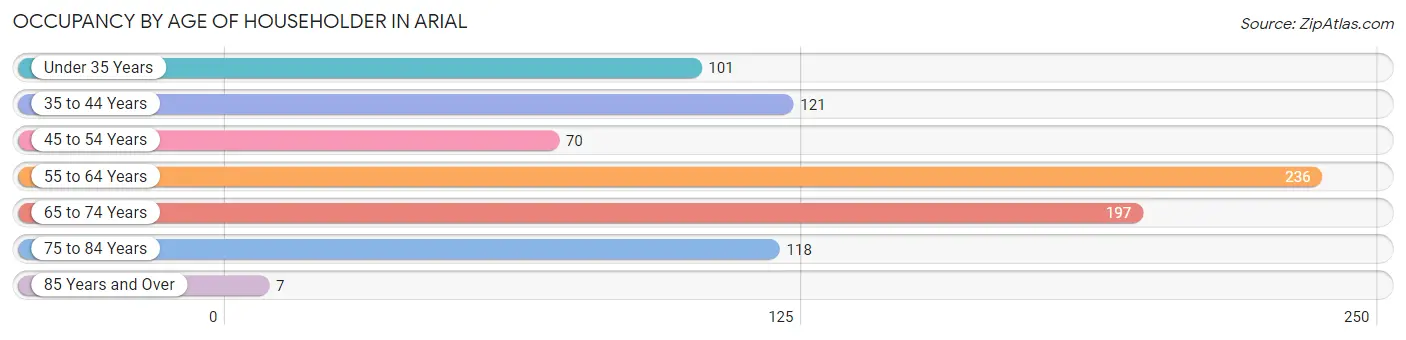
| Age Bracket | # Households | % Households |
| Under 35 Years | 101 | 11.9% |
| 35 to 44 Years | 121 | 14.2% |
| 45 to 54 Years | 70 | 8.2% |
| 55 to 64 Years | 236 | 27.8% |
| 65 to 74 Years | 197 | 23.2% |
| 75 to 84 Years | 118 | 13.9% |
| 85 Years and Over | 7 | 0.8% |
| Total | 850 | 100.0% |
Housing Finances in Arial
Median Income by Occupancy in Arial
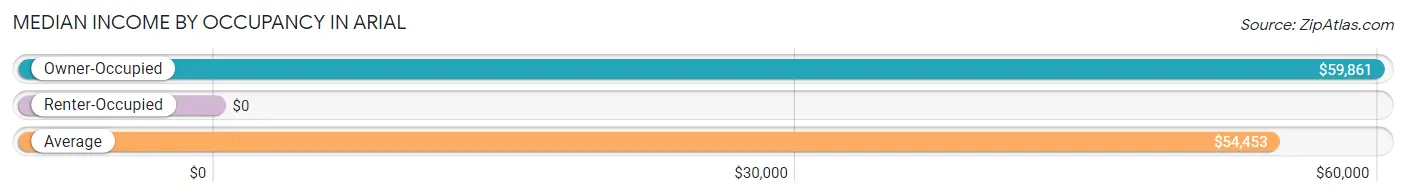
| Occupancy Type | # Households | Median Income |
| Owner-Occupied | 753 (88.6%) | $59,861 |
| Renter-Occupied | 97 (11.4%) | $0 |
| Average | 850 (100.0%) | $54,453 |
Occupancy by Householder Income Bracket in Arial
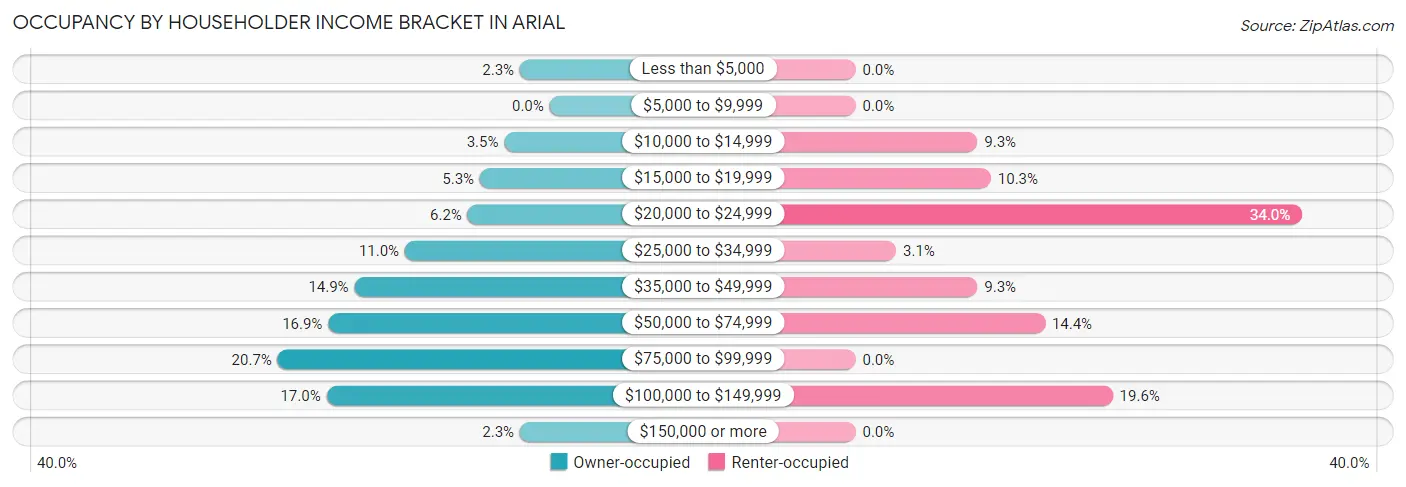
| Income Bracket | Owner-occupied | Renter-occupied |
| Less than $5,000 | 17 (2.3%) | 0 (0.0%) |
| $5,000 to $9,999 | 0 (0.0%) | 0 (0.0%) |
| $10,000 to $14,999 | 26 (3.5%) | 9 (9.3%) |
| $15,000 to $19,999 | 40 (5.3%) | 10 (10.3%) |
| $20,000 to $24,999 | 47 (6.2%) | 33 (34.0%) |
| $25,000 to $34,999 | 83 (11.0%) | 3 (3.1%) |
| $35,000 to $49,999 | 112 (14.9%) | 9 (9.3%) |
| $50,000 to $74,999 | 127 (16.9%) | 14 (14.4%) |
| $75,000 to $99,999 | 156 (20.7%) | 0 (0.0%) |
| $100,000 to $149,999 | 128 (17.0%) | 19 (19.6%) |
| $150,000 or more | 17 (2.3%) | 0 (0.0%) |
| Total | 753 (100.0%) | 97 (100.0%) |
Monthly Housing Cost Tiers in Arial
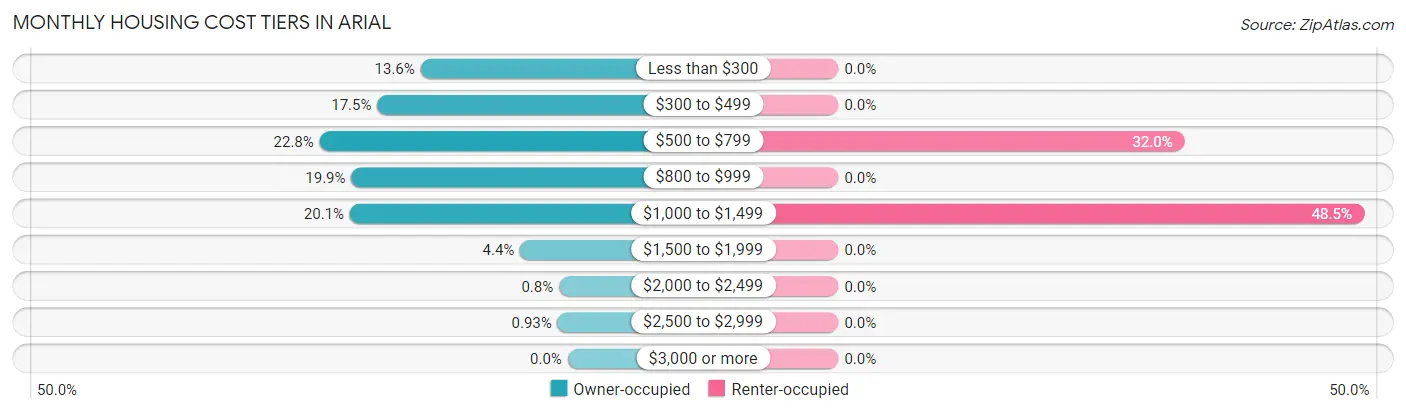
| Monthly Cost | Owner-occupied | Renter-occupied |
| Less than $300 | 102 (13.6%) | 0 (0.0%) |
| $300 to $499 | 132 (17.5%) | 0 (0.0%) |
| $500 to $799 | 172 (22.8%) | 31 (32.0%) |
| $800 to $999 | 150 (19.9%) | 0 (0.0%) |
| $1,000 to $1,499 | 151 (20.1%) | 47 (48.4%) |
| $1,500 to $1,999 | 33 (4.4%) | 0 (0.0%) |
| $2,000 to $2,499 | 6 (0.8%) | 0 (0.0%) |
| $2,500 to $2,999 | 7 (0.9%) | 0 (0.0%) |
| $3,000 or more | 0 (0.0%) | 0 (0.0%) |
| Total | 753 (100.0%) | 97 (100.0%) |
Physical Housing Characteristics in Arial
Housing Structures in Arial
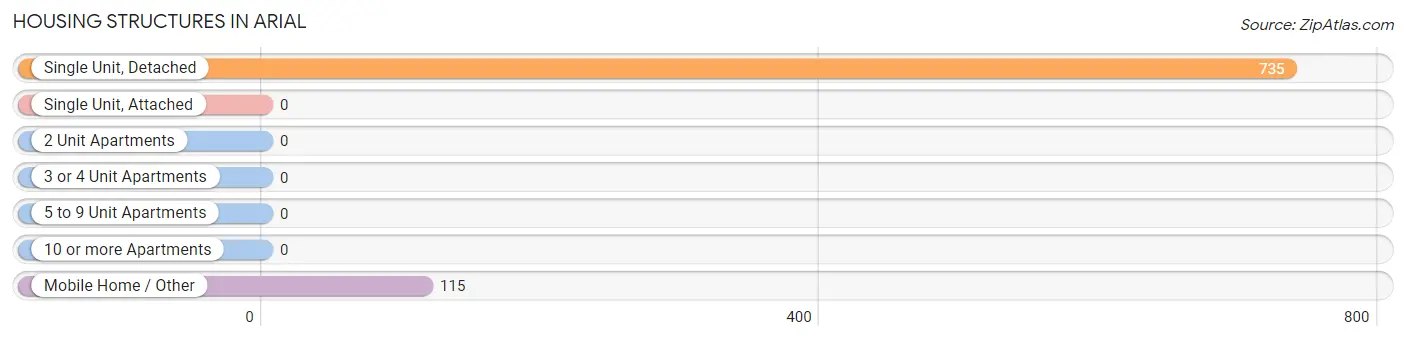
| Structure Type | # Housing Units | % Housing Units |
| Single Unit, Detached | 735 | 86.5% |
| Single Unit, Attached | 0 | 0.0% |
| 2 Unit Apartments | 0 | 0.0% |
| 3 or 4 Unit Apartments | 0 | 0.0% |
| 5 to 9 Unit Apartments | 0 | 0.0% |
| 10 or more Apartments | 0 | 0.0% |
| Mobile Home / Other | 115 | 13.5% |
| Total | 850 | 100.0% |
Housing Structures by Occupancy in Arial
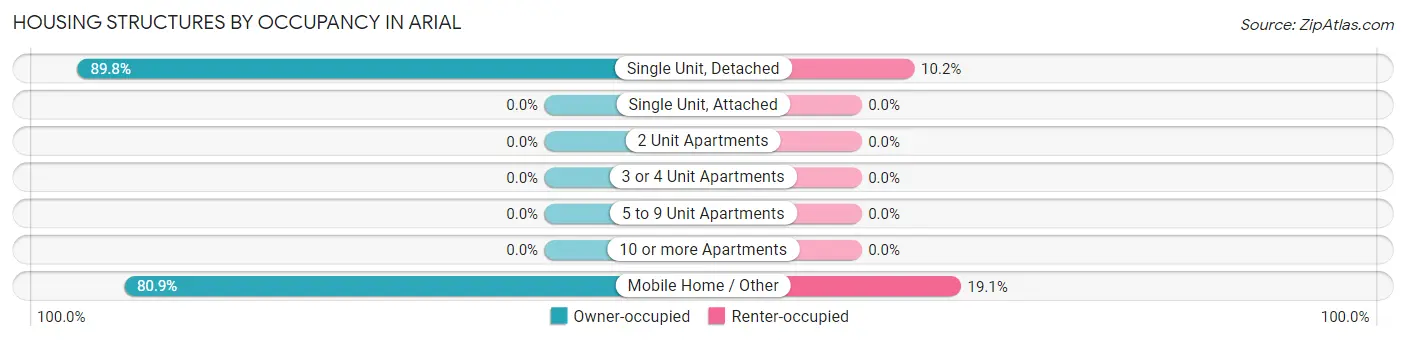
| Structure Type | Owner-occupied | Renter-occupied |
| Single Unit, Detached | 660 (89.8%) | 75 (10.2%) |
| Single Unit, Attached | 0 (0.0%) | 0 (0.0%) |
| 2 Unit Apartments | 0 (0.0%) | 0 (0.0%) |
| 3 or 4 Unit Apartments | 0 (0.0%) | 0 (0.0%) |
| 5 to 9 Unit Apartments | 0 (0.0%) | 0 (0.0%) |
| 10 or more Apartments | 0 (0.0%) | 0 (0.0%) |
| Mobile Home / Other | 93 (80.9%) | 22 (19.1%) |
| Total | 753 (88.6%) | 97 (11.4%) |
Housing Structures by Number of Rooms in Arial
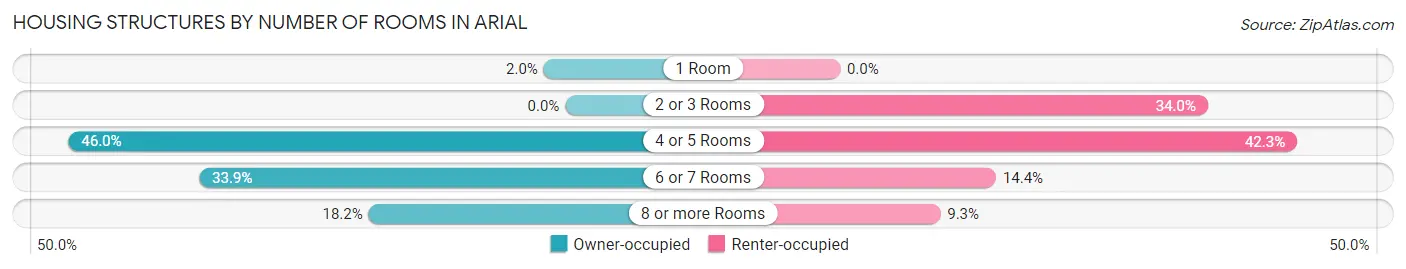
| Number of Rooms | Owner-occupied | Renter-occupied |
| 1 Room | 15 (2.0%) | 0 (0.0%) |
| 2 or 3 Rooms | 0 (0.0%) | 33 (34.0%) |
| 4 or 5 Rooms | 346 (46.0%) | 41 (42.3%) |
| 6 or 7 Rooms | 255 (33.9%) | 14 (14.4%) |
| 8 or more Rooms | 137 (18.2%) | 9 (9.3%) |
| Total | 753 (100.0%) | 97 (100.0%) |
Housing Structure by Heating Type in Arial
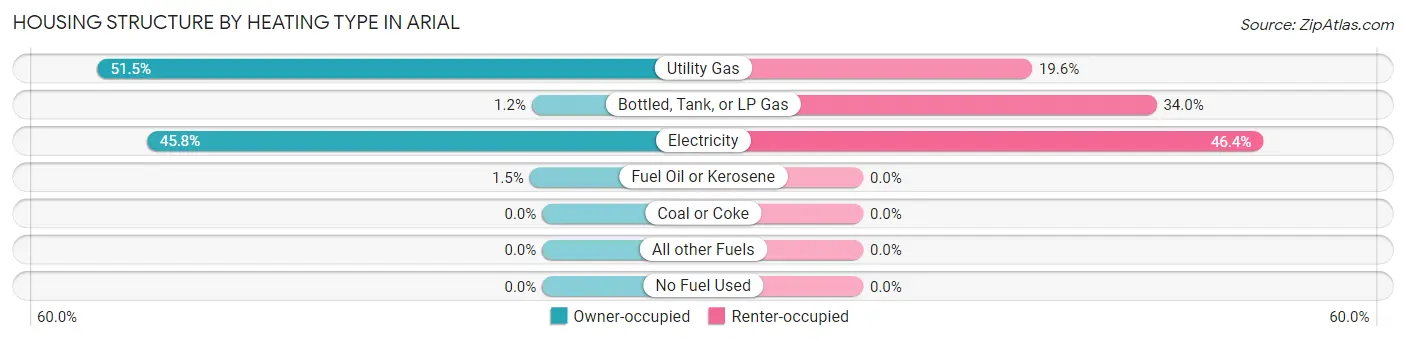
| Heating Type | Owner-occupied | Renter-occupied |
| Utility Gas | 388 (51.5%) | 19 (19.6%) |
| Bottled, Tank, or LP Gas | 9 (1.2%) | 33 (34.0%) |
| Electricity | 345 (45.8%) | 45 (46.4%) |
| Fuel Oil or Kerosene | 11 (1.5%) | 0 (0.0%) |
| Coal or Coke | 0 (0.0%) | 0 (0.0%) |
| All other Fuels | 0 (0.0%) | 0 (0.0%) |
| No Fuel Used | 0 (0.0%) | 0 (0.0%) |
| Total | 753 (100.0%) | 97 (100.0%) |
Household Vehicle Usage in Arial
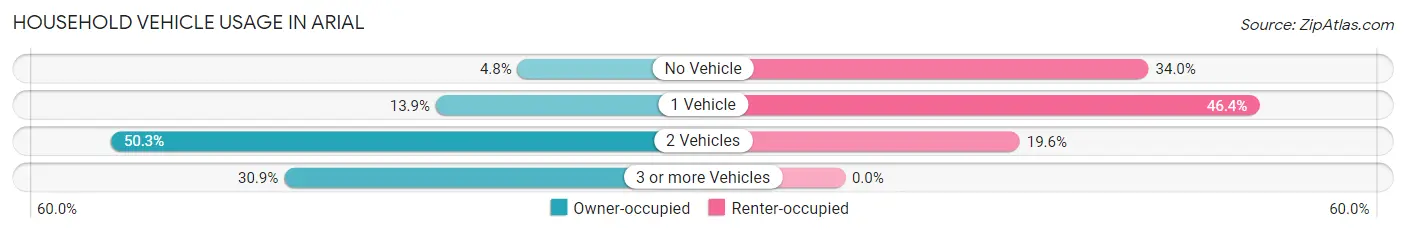
| Vehicles per Household | Owner-occupied | Renter-occupied |
| No Vehicle | 36 (4.8%) | 33 (34.0%) |
| 1 Vehicle | 105 (13.9%) | 45 (46.4%) |
| 2 Vehicles | 379 (50.3%) | 19 (19.6%) |
| 3 or more Vehicles | 233 (30.9%) | 0 (0.0%) |
| Total | 753 (100.0%) | 97 (100.0%) |
Real Estate & Mortgages in Arial
Real Estate and Mortgage Overview in Arial
| Characteristic | Without Mortgage | With Mortgage |
| Housing Units | 301 | 452 |
| Median Property Value | $161,400 | $139,100 |
| Median Household Income | $45,599 | $17 |
| Monthly Housing Costs | $370 | $0 |
| Real Estate Taxes | $601 | $11 |
Property Value by Mortgage Status in Arial
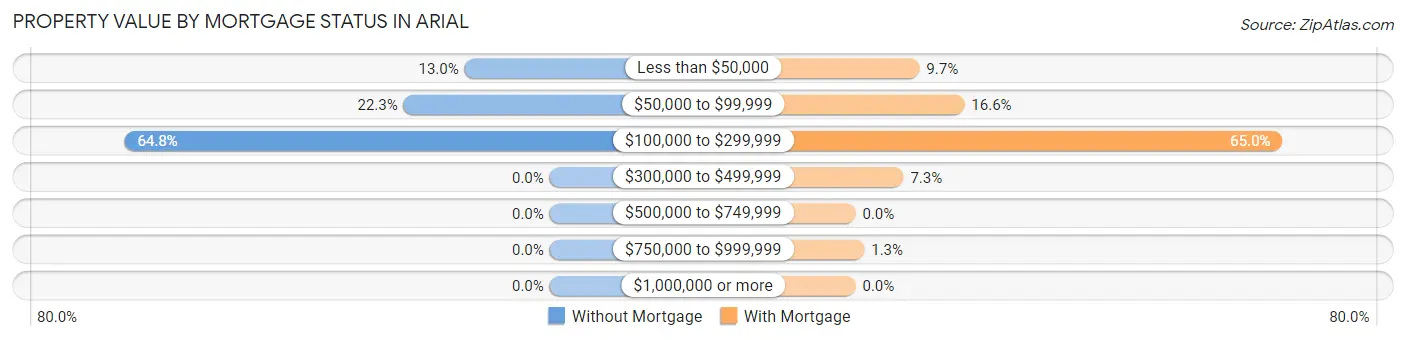
| Property Value | Without Mortgage | With Mortgage |
| Less than $50,000 | 39 (13.0%) | 44 (9.7%) |
| $50,000 to $99,999 | 67 (22.3%) | 75 (16.6%) |
| $100,000 to $299,999 | 195 (64.8%) | 294 (65.0%) |
| $300,000 to $499,999 | 0 (0.0%) | 33 (7.3%) |
| $500,000 to $749,999 | 0 (0.0%) | 0 (0.0%) |
| $750,000 to $999,999 | 0 (0.0%) | 6 (1.3%) |
| $1,000,000 or more | 0 (0.0%) | 0 (0.0%) |
| Total | 301 (100.0%) | 452 (100.0%) |
Household Income by Mortgage Status in Arial
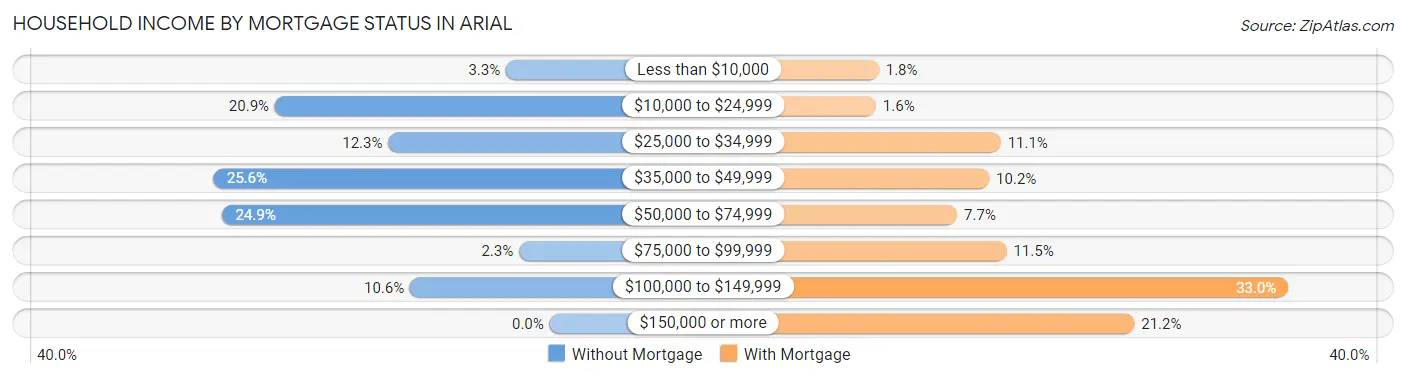
| Household Income | Without Mortgage | With Mortgage |
| Less than $10,000 | 10 (3.3%) | 8 (1.8%) |
| $10,000 to $24,999 | 63 (20.9%) | 7 (1.5%) |
| $25,000 to $34,999 | 37 (12.3%) | 50 (11.1%) |
| $35,000 to $49,999 | 77 (25.6%) | 46 (10.2%) |
| $50,000 to $74,999 | 75 (24.9%) | 35 (7.7%) |
| $75,000 to $99,999 | 7 (2.3%) | 52 (11.5%) |
| $100,000 to $149,999 | 32 (10.6%) | 149 (33.0%) |
| $150,000 or more | 0 (0.0%) | 96 (21.2%) |
| Total | 301 (100.0%) | 452 (100.0%) |
Property Value to Household Income Ratio in Arial
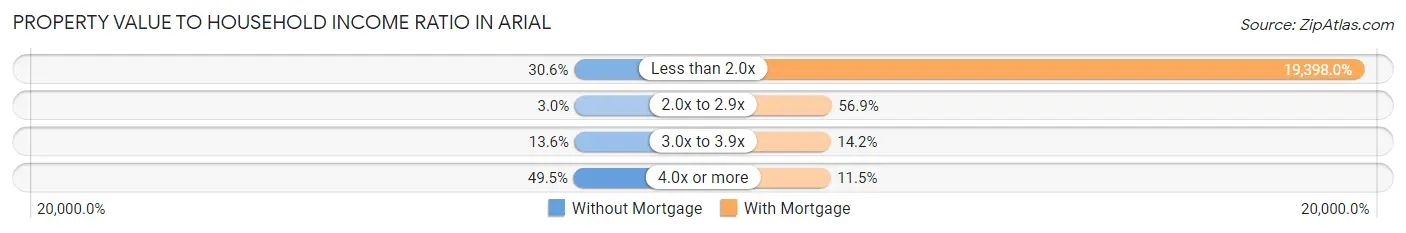
| Value-to-Income Ratio | Without Mortgage | With Mortgage |
| Less than 2.0x | 92 (30.6%) | 87,679 (19,398.0%) |
| 2.0x to 2.9x | 9 (3.0%) | 257 (56.9%) |
| 3.0x to 3.9x | 41 (13.6%) | 64 (14.2%) |
| 4.0x or more | 149 (49.5%) | 52 (11.5%) |
| Total | 301 (100.0%) | 452 (100.0%) |
Real Estate Taxes by Mortgage Status in Arial
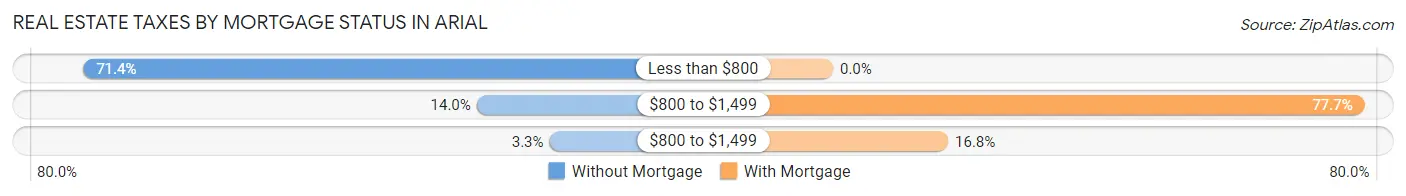
| Property Taxes | Without Mortgage | With Mortgage |
| Less than $800 | 215 (71.4%) | 0 (0.0%) |
| $800 to $1,499 | 42 (14.0%) | 351 (77.6%) |
| $800 to $1,499 | 10 (3.3%) | 76 (16.8%) |
| Total | 301 (100.0%) | 452 (100.0%) |
Health & Disability in Arial
Health Insurance Coverage by Age in Arial
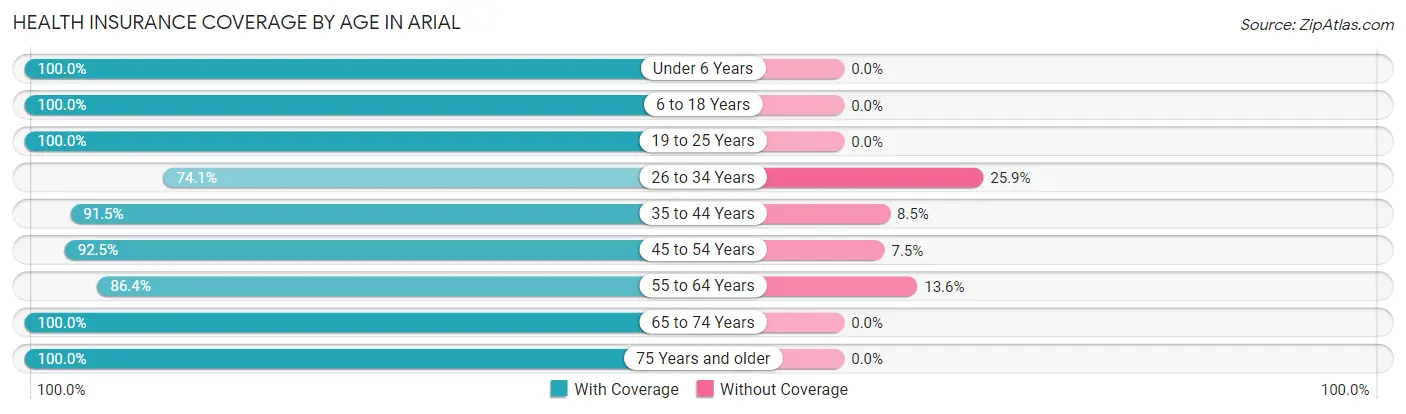
| Age Bracket | With Coverage | Without Coverage |
| Under 6 Years | 64 (100.0%) | 0 (0.0%) |
| 6 to 18 Years | 160 (100.0%) | 0 (0.0%) |
| 19 to 25 Years | 76 (100.0%) | 0 (0.0%) |
| 26 to 34 Years | 180 (74.1%) | 63 (25.9%) |
| 35 to 44 Years | 150 (91.5%) | 14 (8.5%) |
| 45 to 54 Years | 160 (92.5%) | 13 (7.5%) |
| 55 to 64 Years | 273 (86.4%) | 43 (13.6%) |
| 65 to 74 Years | 329 (100.0%) | 0 (0.0%) |
| 75 Years and older | 225 (100.0%) | 0 (0.0%) |
| Total | 1,617 (92.4%) | 133 (7.6%) |
Health Insurance Coverage by Citizenship Status in Arial
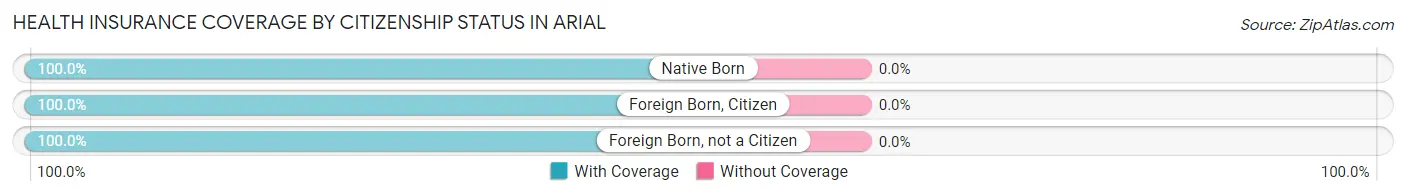
| Citizenship Status | With Coverage | Without Coverage |
| Native Born | 64 (100.0%) | 0 (0.0%) |
| Foreign Born, Citizen | 160 (100.0%) | 0 (0.0%) |
| Foreign Born, not a Citizen | 76 (100.0%) | 0 (0.0%) |
Health Insurance Coverage by Household Income in Arial
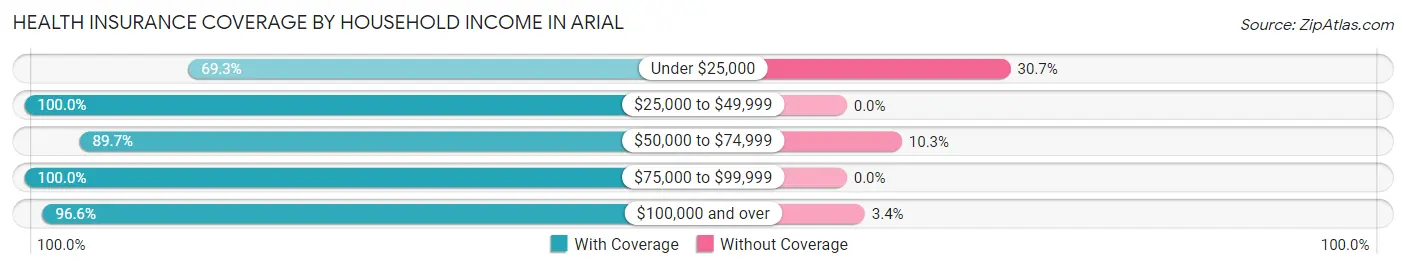
| Household Income | With Coverage | Without Coverage |
| Under $25,000 | 192 (69.3%) | 85 (30.7%) |
| $25,000 to $49,999 | 424 (100.0%) | 0 (0.0%) |
| $50,000 to $74,999 | 304 (89.7%) | 35 (10.3%) |
| $75,000 to $99,999 | 325 (100.0%) | 0 (0.0%) |
| $100,000 and over | 372 (96.6%) | 13 (3.4%) |
Public vs Private Health Insurance Coverage by Age in Arial
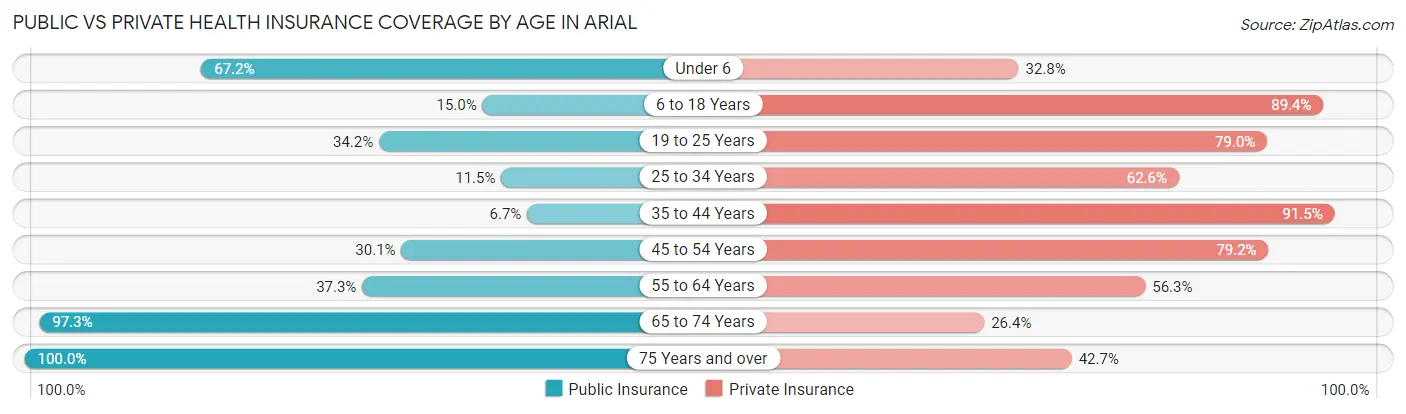
| Age Bracket | Public Insurance | Private Insurance |
| Under 6 | 43 (67.2%) | 21 (32.8%) |
| 6 to 18 Years | 24 (15.0%) | 143 (89.4%) |
| 19 to 25 Years | 26 (34.2%) | 60 (78.9%) |
| 25 to 34 Years | 28 (11.5%) | 152 (62.5%) |
| 35 to 44 Years | 11 (6.7%) | 150 (91.5%) |
| 45 to 54 Years | 52 (30.1%) | 137 (79.2%) |
| 55 to 64 Years | 118 (37.3%) | 178 (56.3%) |
| 65 to 74 Years | 320 (97.3%) | 87 (26.4%) |
| 75 Years and over | 225 (100.0%) | 96 (42.7%) |
| Total | 847 (48.4%) | 1,024 (58.5%) |
Disability Status by Sex by Age in Arial

| Age Bracket | Male | Female |
| Under 5 Years | 0 (0.0%) | 0 (0.0%) |
| 5 to 17 Years | 10 (12.7%) | 0 (0.0%) |
| 18 to 34 Years | 41 (24.5%) | 37 (20.7%) |
| 35 to 64 Years | 112 (29.8%) | 66 (23.8%) |
| 65 to 74 Years | 26 (15.6%) | 81 (50.0%) |
| 75 Years and over | 105 (73.9%) | 43 (51.8%) |
Disability Class by Sex by Age in Arial
Disability Class: Hearing Difficulty
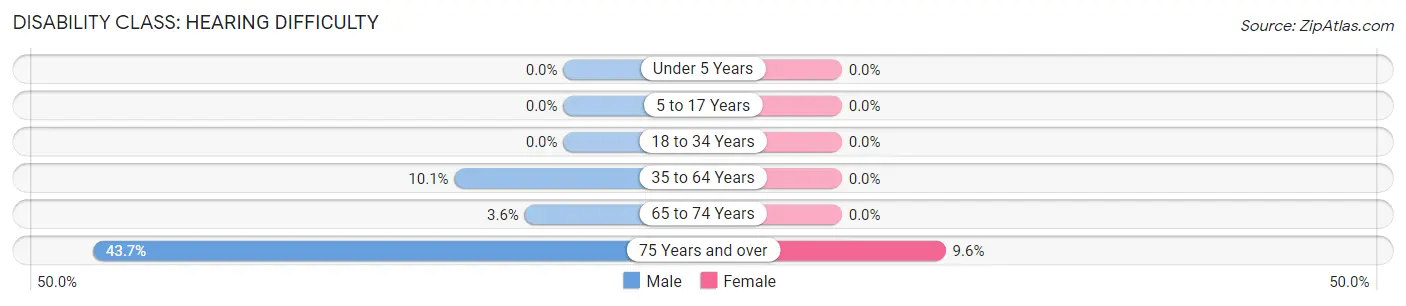
| Age Bracket | Male | Female |
| Under 5 Years | 0 (0.0%) | 0 (0.0%) |
| 5 to 17 Years | 0 (0.0%) | 0 (0.0%) |
| 18 to 34 Years | 0 (0.0%) | 0 (0.0%) |
| 35 to 64 Years | 38 (10.1%) | 0 (0.0%) |
| 65 to 74 Years | 6 (3.6%) | 0 (0.0%) |
| 75 Years and over | 62 (43.7%) | 8 (9.6%) |
Disability Class: Vision Difficulty
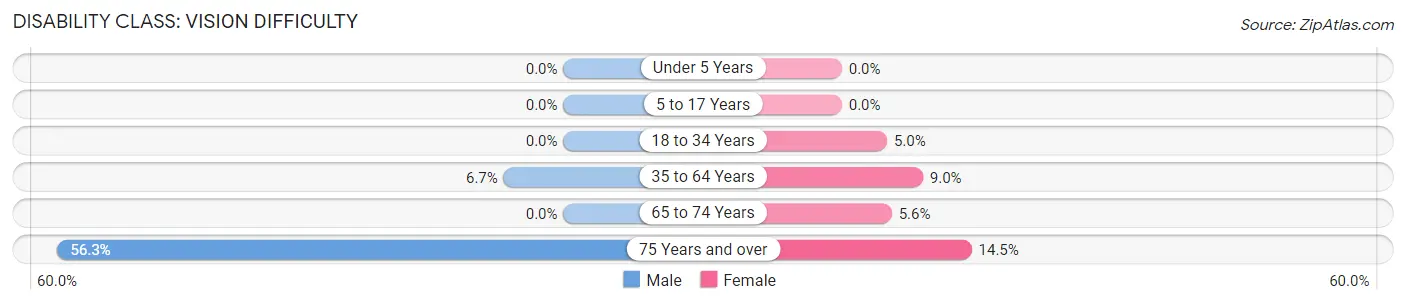
| Age Bracket | Male | Female |
| Under 5 Years | 0 (0.0%) | 0 (0.0%) |
| 5 to 17 Years | 0 (0.0%) | 0 (0.0%) |
| 18 to 34 Years | 0 (0.0%) | 9 (5.0%) |
| 35 to 64 Years | 25 (6.7%) | 25 (9.0%) |
| 65 to 74 Years | 0 (0.0%) | 9 (5.6%) |
| 75 Years and over | 80 (56.3%) | 12 (14.5%) |
Disability Class: Cognitive Difficulty
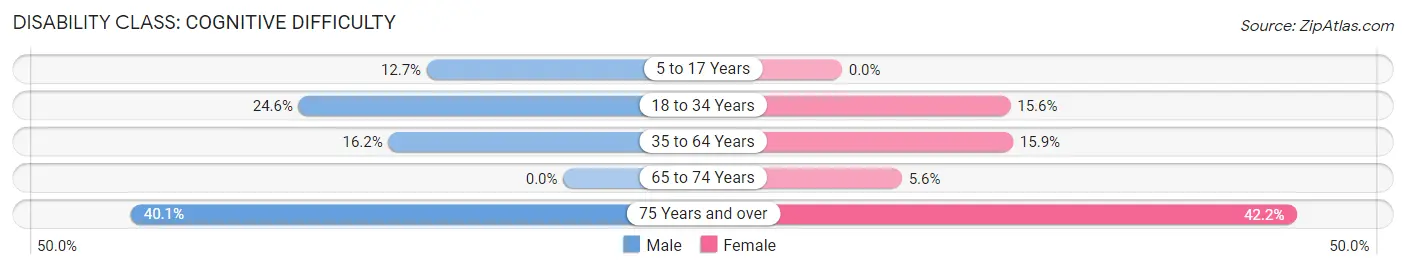
| Age Bracket | Male | Female |
| 5 to 17 Years | 10 (12.7%) | 0 (0.0%) |
| 18 to 34 Years | 41 (24.5%) | 28 (15.6%) |
| 35 to 64 Years | 61 (16.2%) | 44 (15.9%) |
| 65 to 74 Years | 0 (0.0%) | 9 (5.6%) |
| 75 Years and over | 57 (40.1%) | 35 (42.2%) |
Disability Class: Ambulatory Difficulty
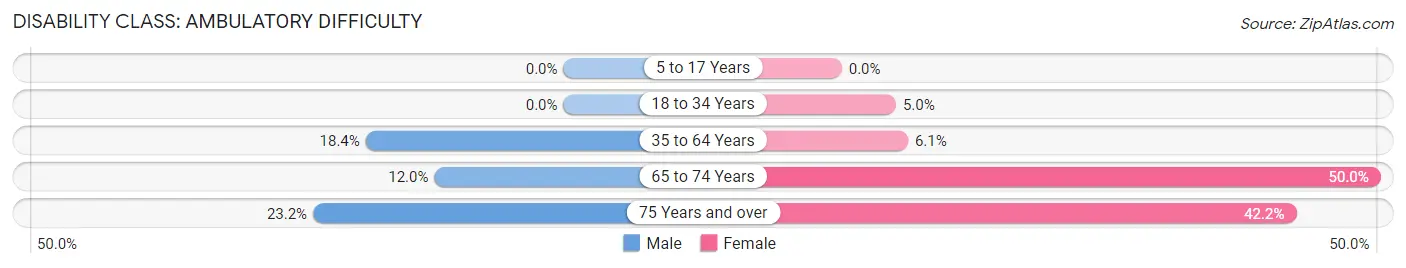
| Age Bracket | Male | Female |
| 5 to 17 Years | 0 (0.0%) | 0 (0.0%) |
| 18 to 34 Years | 0 (0.0%) | 9 (5.0%) |
| 35 to 64 Years | 69 (18.3%) | 17 (6.1%) |
| 65 to 74 Years | 20 (12.0%) | 81 (50.0%) |
| 75 Years and over | 33 (23.2%) | 35 (42.2%) |
Disability Class: Self-Care Difficulty
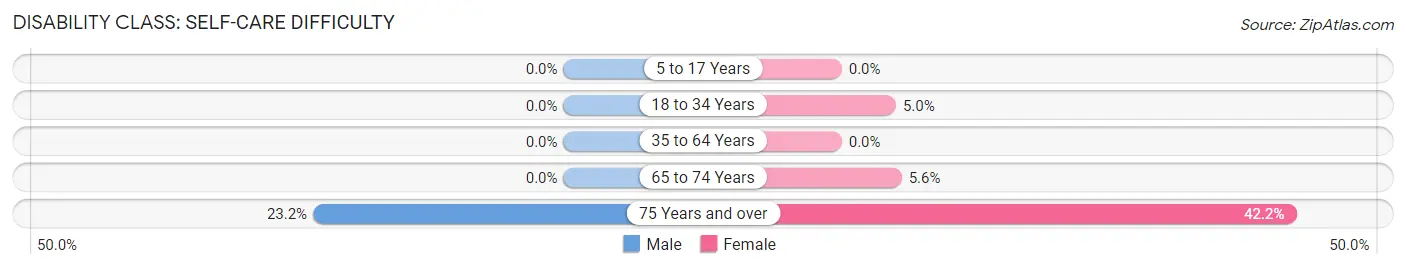
| Age Bracket | Male | Female |
| 5 to 17 Years | 0 (0.0%) | 0 (0.0%) |
| 18 to 34 Years | 0 (0.0%) | 9 (5.0%) |
| 35 to 64 Years | 0 (0.0%) | 0 (0.0%) |
| 65 to 74 Years | 0 (0.0%) | 9 (5.6%) |
| 75 Years and over | 33 (23.2%) | 35 (42.2%) |
Technology Access in Arial
Computing Device Access in Arial
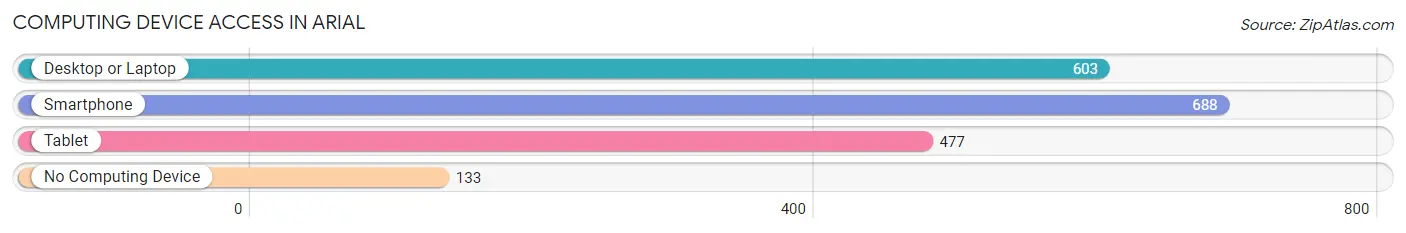
| Device Type | # Households | % Households |
| Desktop or Laptop | 603 | 70.9% |
| Smartphone | 688 | 80.9% |
| Tablet | 477 | 56.1% |
| No Computing Device | 133 | 15.7% |
| Total | 850 | 100.0% |
Internet Access in Arial

| Internet Type | # Households | % Households |
| Dial-Up Internet | 0 | 0.0% |
| Broadband Home | 619 | 72.8% |
| Cellular Data Only | 81 | 9.5% |
| Satellite Internet | 129 | 15.2% |
| No Internet | 133 | 15.7% |
| Total | 850 | 100.0% |
Arial Summary
Arial is a city located in the state of South Carolina in the United States of America. It is the county seat of Anderson County and is situated in the foothills of the Blue Ridge Mountains. The city has a population of approximately 27,000 people and is the principal city of the Anderson Metropolitan Statistical Area.
History
The area that is now Arial was first settled in the late 1700s by a group of Scots-Irish immigrants. The town was originally known as Anderson Courthouse, named after the county in which it was located. In 1833, the town was renamed Arial after the nearby Arial Creek. The town was officially incorporated in 1868.
During the Civil War, Arial was the site of several battles, including the Battle of Arial in 1865. The town was also the site of the first Confederate Memorial Day celebration in the United States.
In the late 19th century, Arial experienced a period of growth and prosperity. The town was home to several cotton mills and other industries, and the population grew to over 5,000 people.
Geography
Arial is located in the foothills of the Blue Ridge Mountains in the northwestern corner of South Carolina. The city is situated on the banks of the Saluda River, which flows through the city. The city is located approximately 25 miles from Greenville and 85 miles from Charlotte, North Carolina.
The city has a total area of 8.3 square miles, of which 8.2 square miles is land and 0.1 square miles is water. The city has a humid subtropical climate, with hot, humid summers and mild winters.
Economy
Arial’s economy is largely based on manufacturing and agriculture. The city is home to several manufacturing plants, including a paper mill, a textile mill, and a plastics plant. The city is also home to several agricultural operations, including dairy farms, poultry farms, and vegetable farms.
The city is also home to several retail stores, restaurants, and other businesses. The city is served by several major highways, including Interstate 85 and US Highway 76.
Demographics
As of the 2010 census, Arial had a population of 27,058 people. The racial makeup of the city was 79.2% White, 15.7% African American, 0.3% Native American, 1.2% Asian, 0.1% Pacific Islander, 1.7% from other races, and 1.8% from two or more races. Hispanic or Latino of any race were 4.2% of the population.
The median income for a household in the city was $35,945, and the median income for a family was $44,945. The per capita income for the city was $20,845. About 16.2% of families and 19.7% of the population were below the poverty line, including 28.2% of those under age 18 and 11.2% of those age 65 or over.
Common Questions
What is the Total Population of Arial?
Total Population of Arial is 1,750.
What is the Total Male Population of Arial?
Total Male Population of Arial is 972.
What is the Total Female Population of Arial?
Total Female Population of Arial is 778.
What is the Ratio of Males per 100 Females in Arial?
There are 124.94 Males per 100 Females in Arial.
What is the Ratio of Females per 100 Males in Arial?
There are 80.04 Females per 100 Males in Arial.
What is the Median Population Age in Arial?
Median Population Age in Arial is 54.8 Years.
What is the Average Family Size in Arial
Average Family Size in Arial is 2.5 People.
What is the Average Household Size in Arial
Average Household Size in Arial is 2.1 People.
What is Per Capita Income in Arial?
Per Capita income in Arial is $30,491.
What is the Median Family Income in Arial?
Median Family Income in Arial is $72,250.
What is the Median Household income in Arial?
Median Household Income in Arial is $54,453.
What is Income or Wage Gap in Arial?
Income or Wage Gap in Arial is 33.5%.
Women in Arial earn 66.5 cents for every dollar earned by a man.
What is Family Income Deficit in Arial?
Family Income Deficit in Arial is $9,266.
Families that are below poverty line in Arial earn $9,266 less on average than the poverty threshold level.
What is Inequality or Gini Index in Arial?
Inequality or Gini Index in Arial is 0.36.
How Large is the Labor Force in Arial?
There are 789 People in the Labor Forcein in Arial.
What is the Percentage of People in the Labor Force in Arial?
50.3% of People are in the Labor Force in Arial.
What is the Unemployment Rate in Arial?
Unemployment Rate in Arial is 1.3%.