Cities with the Highest Percentage of Population Employed in Educational Services in South Carolina
RELATED REPORTS & OPTIONS
Educational Services
South Carolina
Compare Cities
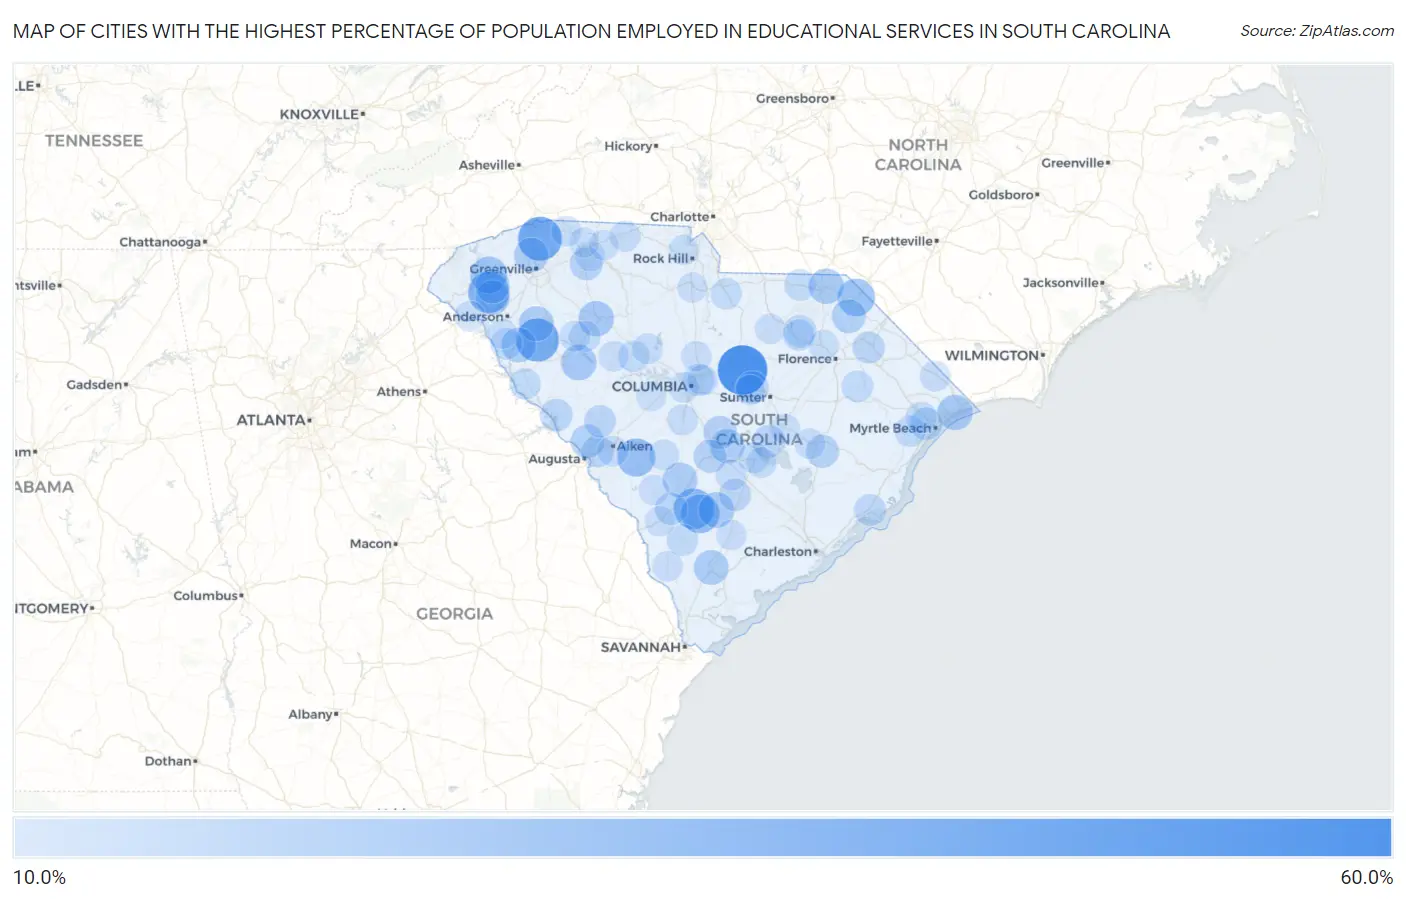
Map of Cities with the Highest Percentage of Population Employed in Educational Services in South Carolina
0.0%
60.0%
Cities with the Highest Percentage of Population Employed in Educational Services in South Carolina
| City | % Employed | vs State | vs National | |
| 1. | Boykin | 55.9% | 9.0%(+46.8)#1 | 9.3%(+46.6)#146 |
| 2. | Zion | 48.3% | 9.0%(+39.2)#2 | 9.3%(+39.0)#229 |
| 3. | Clemson University | 46.9% | 9.0%(+37.9)#3 | 9.3%(+37.6)#250 |
| 4. | Tigerville | 43.0% | 9.0%(+33.9)#4 | 9.3%(+33.7)#322 |
| 5. | Due West | 41.4% | 9.0%(+32.3)#5 | 9.3%(+32.1)#363 |
| 6. | Clemson | 36.6% | 9.0%(+27.6)#6 | 9.3%(+27.3)#496 |
| 7. | Ehrhardt | 34.9% | 9.0%(+25.9)#7 | 9.3%(+25.6)#571 |
| 8. | Seabrook | 31.7% | 9.0%(+22.7)#8 | 9.3%(+22.4)#722 |
| 9. | Lodge | 31.4% | 9.0%(+22.4)#9 | 9.3%(+22.1)#733 |
| 10. | Dunbar | 31.3% | 9.0%(+22.2)#10 | 9.3%(+22.0)#746 |
| 11. | Adams Run | 31.2% | 9.0%(+22.2)#11 | 9.3%(+21.9)#748 |
| 12. | Windsor | 29.8% | 9.0%(+20.8)#12 | 9.3%(+20.5)#836 |
| 13. | Tatum | 28.6% | 9.0%(+19.5)#13 | 9.3%(+19.3)#924 |
| 14. | Six Mile | 27.2% | 9.0%(+18.1)#14 | 9.3%(+17.9)#1,048 |
| 15. | South Union | 24.8% | 9.0%(+15.8)#15 | 9.3%(+15.5)#1,272 |
| 16. | Ninety Six | 24.4% | 9.0%(+15.3)#16 | 9.3%(+15.0)#1,323 |
| 17. | Smoaks | 24.1% | 9.0%(+15.0)#17 | 9.3%(+14.8)#1,358 |
| 18. | Clinton | 24.0% | 9.0%(+15.0)#18 | 9.3%(+14.7)#1,363 |
| 19. | Atlantic Beach | 23.8% | 9.0%(+14.8)#19 | 9.3%(+14.5)#1,390 |
| 20. | Olympia | 23.8% | 9.0%(+14.7)#20 | 9.3%(+14.5)#1,404 |
| 21. | Wallace | 23.7% | 9.0%(+14.6)#21 | 9.3%(+14.4)#1,422 |
| 22. | Daviston | 23.7% | 9.0%(+14.6)#22 | 9.3%(+14.3)#1,428 |
| 23. | Honea Path | 23.0% | 9.0%(+14.0)#23 | 9.3%(+13.7)#1,530 |
| 24. | Denmark | 22.7% | 9.0%(+13.7)#24 | 9.3%(+13.4)#1,560 |
| 25. | Yemassee | 22.4% | 9.0%(+13.4)#25 | 9.3%(+13.1)#1,625 |
| 26. | Antreville | 22.4% | 9.0%(+13.3)#26 | 9.3%(+13.1)#1,636 |
| 27. | Pendleton | 22.0% | 9.0%(+13.0)#27 | 9.3%(+12.7)#1,685 |
| 28. | Cameron | 21.8% | 9.0%(+12.8)#28 | 9.3%(+12.5)#1,726 |
| 29. | Travelers Rest | 21.8% | 9.0%(+12.7)#29 | 9.3%(+12.5)#1,729 |
| 30. | Central | 21.7% | 9.0%(+12.7)#30 | 9.3%(+12.4)#1,740 |
| 31. | Blenheim | 20.7% | 9.0%(+11.6)#31 | 9.3%(+11.4)#1,964 |
| 32. | Murphys Estates | 20.3% | 9.0%(+11.2)#32 | 9.3%(+11.0)#2,054 |
| 33. | St Matthews | 19.6% | 9.0%(+10.6)#33 | 9.3%(+10.3)#2,226 |
| 34. | Lane | 18.9% | 9.0%(+9.89)#34 | 9.3%(+9.62)#2,403 |
| 35. | Chickasaw Point | 18.9% | 9.0%(+9.87)#35 | 9.3%(+9.60)#2,405 |
| 36. | Roebuck | 18.9% | 9.0%(+9.84)#36 | 9.3%(+9.58)#2,418 |
| 37. | Orangeburg | 18.8% | 9.0%(+9.79)#37 | 9.3%(+9.52)#2,435 |
| 38. | North Santee | 18.4% | 9.0%(+9.32)#38 | 9.3%(+9.05)#2,614 |
| 39. | Summerton | 18.3% | 9.0%(+9.29)#39 | 9.3%(+9.03)#2,625 |
| 40. | Buford | 18.2% | 9.0%(+9.17)#40 | 9.3%(+8.90)#2,673 |
| 41. | Parksville | 17.9% | 9.0%(+8.90)#41 | 9.3%(+8.63)#2,769 |
| 42. | North Hartsville | 17.9% | 9.0%(+8.86)#42 | 9.3%(+8.59)#2,788 |
| 43. | Oakland | 17.9% | 9.0%(+8.86)#43 | 9.3%(+8.59)#2,789 |
| 44. | Forestbrook | 17.7% | 9.0%(+8.62)#44 | 9.3%(+8.36)#2,869 |
| 45. | Ulmer | 17.5% | 9.0%(+8.50)#45 | 9.3%(+8.23)#2,930 |
| 46. | Reevesville | 17.2% | 9.0%(+8.19)#46 | 9.3%(+7.93)#3,061 |
| 47. | Manville | 17.1% | 9.0%(+8.09)#47 | 9.3%(+7.83)#3,100 |
| 48. | Burnettown | 16.9% | 9.0%(+7.88)#48 | 9.3%(+7.61)#3,208 |
| 49. | Trenton | 16.7% | 9.0%(+7.62)#49 | 9.3%(+7.35)#3,334 |
| 50. | Sellers | 16.7% | 9.0%(+7.62)#50 | 9.3%(+7.35)#3,350 |
| 51. | East Camden | 16.6% | 9.0%(+7.59)#51 | 9.3%(+7.33)#3,378 |
| 52. | Forest Acres | 16.5% | 9.0%(+7.46)#52 | 9.3%(+7.19)#3,457 |
| 53. | Mcclellanville | 16.4% | 9.0%(+7.33)#53 | 9.3%(+7.06)#3,501 |
| 54. | Chesterfield | 15.8% | 9.0%(+6.79)#54 | 9.3%(+6.52)#3,803 |
| 55. | Hampton | 15.8% | 9.0%(+6.78)#55 | 9.3%(+6.51)#3,810 |
| 56. | Pamplico | 15.8% | 9.0%(+6.76)#56 | 9.3%(+6.50)#3,817 |
| 57. | Unity | 15.8% | 9.0%(+6.74)#57 | 9.3%(+6.47)#3,831 |
| 58. | Iva | 15.7% | 9.0%(+6.68)#58 | 9.3%(+6.41)#3,867 |
| 59. | Hartsville | 15.4% | 9.0%(+6.31)#59 | 9.3%(+6.04)#4,098 |
| 60. | Bucksport | 15.3% | 9.0%(+6.28)#60 | 9.3%(+6.01)#4,126 |
| 61. | Elgin | 15.1% | 9.0%(+6.07)#61 | 9.3%(+5.80)#4,222 |
| 62. | Mount Carmel | 15.1% | 9.0%(+6.05)#62 | 9.3%(+5.78)#4,237 |
| 63. | Prosperity | 15.0% | 9.0%(+5.97)#63 | 9.3%(+5.70)#4,285 |
| 64. | Red Hill | 14.9% | 9.0%(+5.89)#64 | 9.3%(+5.62)#4,347 |
| 65. | Santee | 14.5% | 9.0%(+5.41)#65 | 9.3%(+5.14)#4,709 |
| 66. | Mountville | 14.4% | 9.0%(+5.38)#66 | 9.3%(+5.12)#4,731 |
| 67. | Swansea | 14.3% | 9.0%(+5.28)#67 | 9.3%(+5.01)#4,812 |
| 68. | East Gaffney | 14.3% | 9.0%(+5.26)#68 | 9.3%(+5.00)#4,819 |
| 69. | Bowman | 14.3% | 9.0%(+5.24)#69 | 9.3%(+4.97)#4,842 |
| 70. | La France | 14.1% | 9.0%(+5.06)#70 | 9.3%(+4.79)#5,002 |
| 71. | Springfield | 14.1% | 9.0%(+5.03)#71 | 9.3%(+4.76)#5,032 |
| 72. | Aiken | 14.0% | 9.0%(+4.93)#72 | 9.3%(+4.67)#5,137 |
| 73. | Pomaria | 14.0% | 9.0%(+4.91)#73 | 9.3%(+4.64)#5,156 |
| 74. | Greeleyville | 13.8% | 9.0%(+4.75)#74 | 9.3%(+4.48)#5,280 |
| 75. | Waterloo | 13.8% | 9.0%(+4.70)#75 | 9.3%(+4.43)#5,321 |
| 76. | Fair Play | 13.7% | 9.0%(+4.68)#76 | 9.3%(+4.42)#5,335 |
| 77. | Loris | 13.7% | 9.0%(+4.68)#77 | 9.3%(+4.41)#5,339 |
| 78. | Vance | 13.7% | 9.0%(+4.68)#78 | 9.3%(+4.41)#5,343 |
| 79. | West Columbia | 13.7% | 9.0%(+4.67)#79 | 9.3%(+4.41)#5,349 |
| 80. | Scotia | 13.6% | 9.0%(+4.59)#80 | 9.3%(+4.32)#5,415 |
| 81. | Columbia | 13.6% | 9.0%(+4.59)#81 | 9.3%(+4.32)#5,420 |
| 82. | Silverstreet | 13.6% | 9.0%(+4.51)#82 | 9.3%(+4.24)#5,483 |
| 83. | Blythewood | 13.6% | 9.0%(+4.50)#83 | 9.3%(+4.24)#5,488 |
| 84. | Bethune | 13.5% | 9.0%(+4.47)#84 | 9.3%(+4.20)#5,517 |
| 85. | Barnwell | 13.5% | 9.0%(+4.46)#85 | 9.3%(+4.20)#5,524 |
| 86. | Walterboro | 13.4% | 9.0%(+4.32)#86 | 9.3%(+4.05)#5,636 |
| 87. | Camp Croft | 13.3% | 9.0%(+4.27)#87 | 9.3%(+4.01)#5,694 |
| 88. | Allendale | 13.2% | 9.0%(+4.12)#88 | 9.3%(+3.85)#5,842 |
| 89. | Richburg | 13.1% | 9.0%(+4.09)#89 | 9.3%(+3.82)#5,875 |
| 90. | Darlington | 13.1% | 9.0%(+4.06)#90 | 9.3%(+3.79)#5,901 |
| 91. | Campobello | 13.1% | 9.0%(+4.06)#91 | 9.3%(+3.79)#5,902 |
| 92. | Newport | 13.1% | 9.0%(+4.01)#92 | 9.3%(+3.74)#5,948 |
| 93. | Manning | 12.9% | 9.0%(+3.88)#93 | 9.3%(+3.61)#6,103 |
| 94. | Gilbert | 12.9% | 9.0%(+3.86)#94 | 9.3%(+3.59)#6,127 |
| 95. | Spartanburg | 12.9% | 9.0%(+3.83)#95 | 9.3%(+3.56)#6,168 |
| 96. | Danwood | 12.9% | 9.0%(+3.82)#96 | 9.3%(+3.55)#6,178 |
| 97. | Stateburg | 12.8% | 9.0%(+3.78)#97 | 9.3%(+3.51)#6,206 |
| 98. | Boiling Springs | 12.8% | 9.0%(+3.70)#98 | 9.3%(+3.44)#6,272 |
| 99. | Starr | 12.7% | 9.0%(+3.63)#99 | 9.3%(+3.36)#6,358 |
| 100. | Cowpens | 12.6% | 9.0%(+3.58)#100 | 9.3%(+3.31)#6,405 |
Common Questions
What are the Top 10 Cities with the Highest Percentage of Population Employed in Educational Services in South Carolina?
Top 10 Cities with the Highest Percentage of Population Employed in Educational Services in South Carolina are:
#1
55.9%
#2
43.0%
#3
41.4%
#4
36.6%
#5
34.9%
#6
31.4%
#7
29.8%
#8
28.6%
#9
27.2%
#10
24.4%
What city has the Highest Percentage of Population Employed in Educational Services in South Carolina?
Boykin has the Highest Percentage of Population Employed in Educational Services in South Carolina with 55.9%.
What is the Percentage of Population Employed in Educational Services in the State of South Carolina?
Percentage of Population Employed in Educational Services in South Carolina is 9.0%.
What is the Percentage of Population Employed in Educational Services in the United States?
Percentage of Population Employed in Educational Services in the United States is 9.3%.