Lake Wylie, SC
Lake Wylie Map
Lake Wylie Overview
14,382
TOTAL POPULATION
7,146
MALE POPULATION
7,236
FEMALE POPULATION
98.76
MALES / 100 FEMALES
101.26
FEMALES / 100 MALES
37.7
MEDIAN AGE
3.0
AVG FAMILY SIZE
2.7
AVG HOUSEHOLD SIZE
$50,736
PER CAPITA INCOME
$125,750
AVG FAMILY INCOME
$111,424
AVG HOUSEHOLD INCOME
40.2%
WAGE / INCOME GAP [ % ]
59.8¢/ $1
WAGE / INCOME GAP [ $ ]
0.42
INEQUALITY / GINI INDEX
7,521
LABOR FORCE [ PEOPLE ]
70.2%
PERCENT IN LABOR FORCE
5.5%
UNEMPLOYMENT RATE
Lake Wylie Area Codes
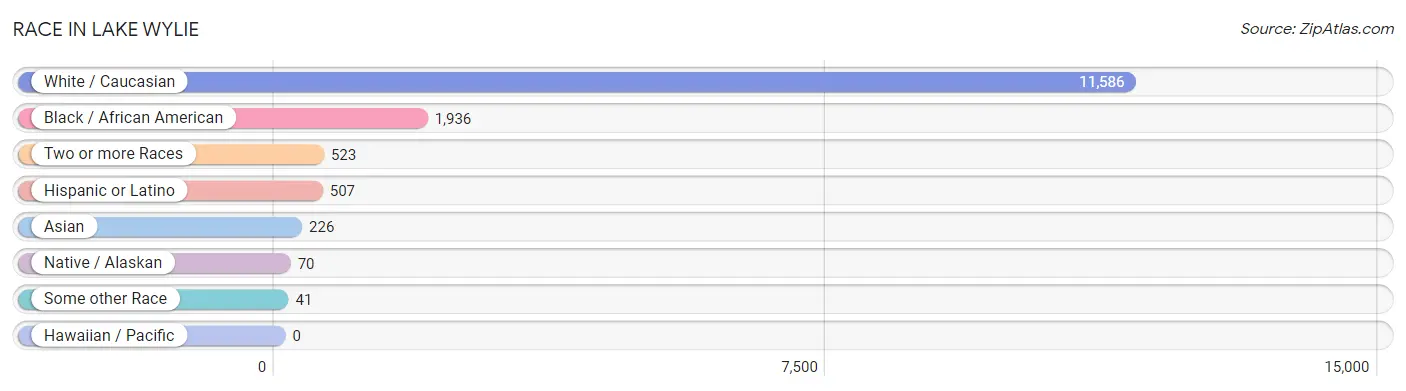
Race in Lake Wylie
The most populous races in Lake Wylie are White / Caucasian (11,586 | 80.6%), Black / African American (1,936 | 13.5%), and Two or more Races (523 | 3.6%).
| Race | # Population | % Population |
| Asian | 226 | 1.6% |
| Black / African American | 1,936 | 13.5% |
| Hawaiian / Pacific | 0 | 0.0% |
| Hispanic or Latino | 507 | 3.5% |
| Native / Alaskan | 70 | 0.5% |
| White / Caucasian | 11,586 | 80.6% |
| Two or more Races | 523 | 3.6% |
| Some other Race | 41 | 0.3% |
| Total | 14,382 | 100.0% |
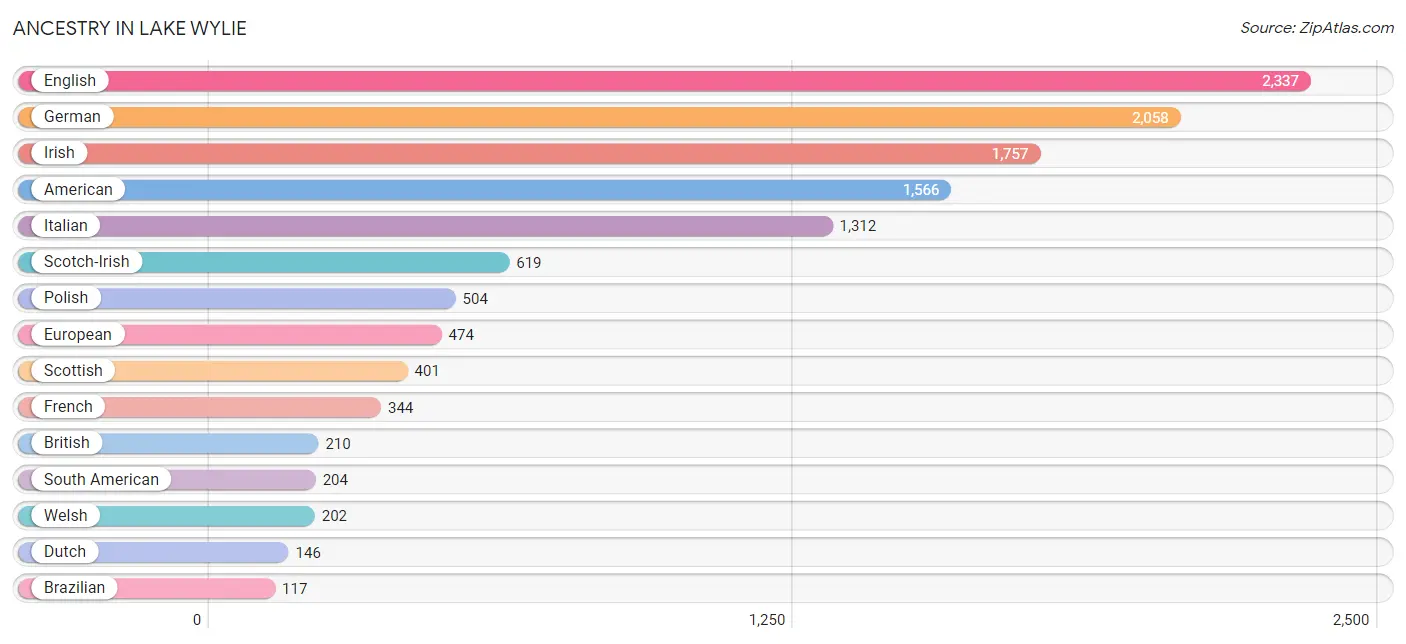
Ancestry in Lake Wylie
The most populous ancestries reported in Lake Wylie are English (2,337 | 16.3%), German (2,058 | 14.3%), Irish (1,757 | 12.2%), American (1,566 | 10.9%), and Italian (1,312 | 9.1%), together accounting for 62.8% of all Lake Wylie residents.
| Ancestry | # Population | % Population |
| African | 3 | 0.0% |
| American | 1,566 | 10.9% |
| Austrian | 23 | 0.2% |
| Brazilian | 117 | 0.8% |
| British | 210 | 1.5% |
| Bulgarian | 13 | 0.1% |
| Cajun | 9 | 0.1% |
| Canadian | 109 | 0.8% |
| Central American | 51 | 0.4% |
| Cherokee | 2 | 0.0% |
| Colombian | 53 | 0.4% |
| Costa Rican | 16 | 0.1% |
| Croatian | 70 | 0.5% |
| Cuban | 79 | 0.5% |
| Czech | 77 | 0.5% |
| Czechoslovakian | 7 | 0.1% |
| Dutch | 146 | 1.0% |
| Eastern European | 67 | 0.5% |
| Ecuadorian | 26 | 0.2% |
| English | 2,337 | 16.3% |
| European | 474 | 3.3% |
| French | 344 | 2.4% |
| German | 2,058 | 14.3% |
| German Russian | 13 | 0.1% |
| Greek | 86 | 0.6% |
| Honduran | 35 | 0.2% |
| Hungarian | 18 | 0.1% |
| Indian (Asian) | 87 | 0.6% |
| Irish | 1,757 | 12.2% |
| Italian | 1,312 | 9.1% |
| Korean | 13 | 0.1% |
| Lithuanian | 53 | 0.4% |
| Mexican | 29 | 0.2% |
| Northern European | 26 | 0.2% |
| Norwegian | 64 | 0.4% |
| Paiute | 22 | 0.2% |
| Pennsylvania German | 13 | 0.1% |
| Peruvian | 63 | 0.4% |
| Polish | 504 | 3.5% |
| Portuguese | 88 | 0.6% |
| Puerto Rican | 108 | 0.7% |
| Romanian | 78 | 0.5% |
| Russian | 93 | 0.6% |
| Scandinavian | 11 | 0.1% |
| Scotch-Irish | 619 | 4.3% |
| Scottish | 401 | 2.8% |
| Slovak | 103 | 0.7% |
| South American | 204 | 1.4% |
| South American Indian | 69 | 0.5% |
| Spaniard | 18 | 0.1% |
| Spanish | 18 | 0.1% |
| Sri Lankan | 35 | 0.2% |
| Subsaharan African | 61 | 0.4% |
| Sudanese | 58 | 0.4% |
| Swedish | 73 | 0.5% |
| Swiss | 15 | 0.1% |
| Thai | 91 | 0.6% |
| Turkish | 70 | 0.5% |
| Ukrainian | 52 | 0.4% |
| Venezuelan | 62 | 0.4% |
| Welsh | 202 | 1.4% | View All 61 Rows |
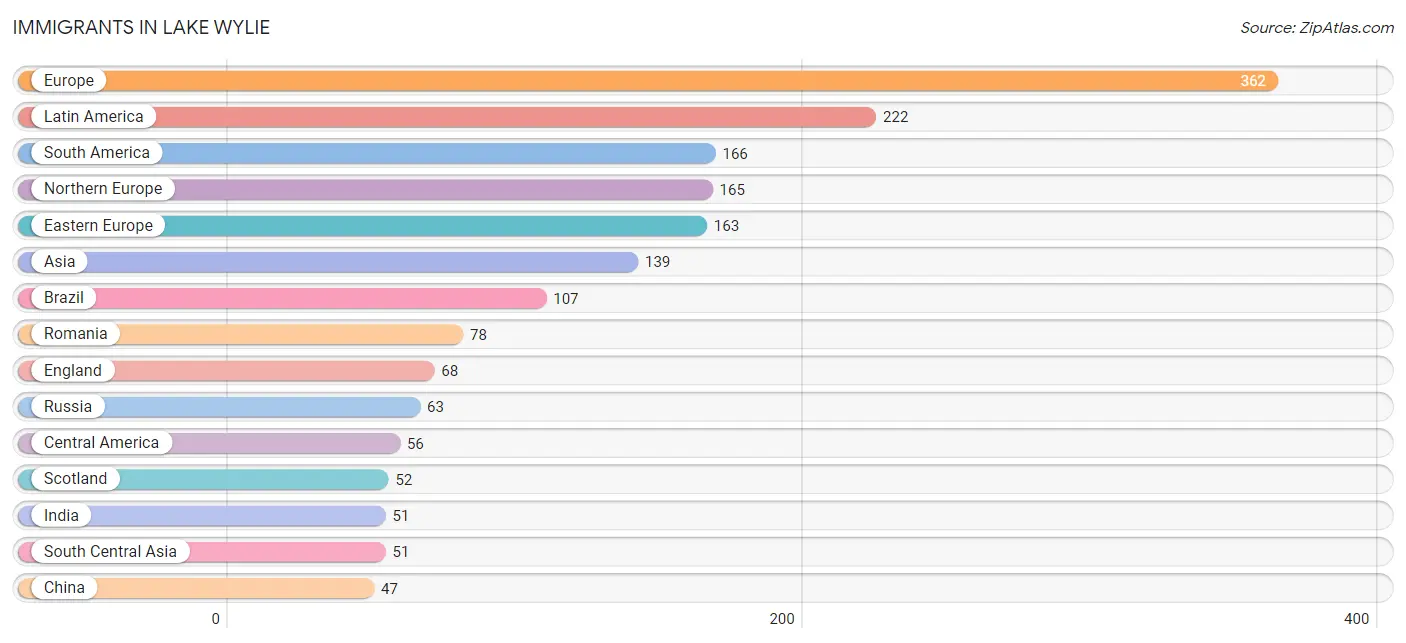
Immigrants in Lake Wylie
The most numerous immigrant groups reported in Lake Wylie came from Europe (362 | 2.5%), Latin America (222 | 1.5%), South America (166 | 1.1%), Northern Europe (165 | 1.1%), and Eastern Europe (163 | 1.1%), together accounting for 7.5% of all Lake Wylie residents.
| Immigration Origin | # Population | % Population |
| Africa | 25 | 0.2% |
| Asia | 139 | 1.0% |
| Brazil | 107 | 0.7% |
| Bulgaria | 13 | 0.1% |
| Canada | 45 | 0.3% |
| Central America | 56 | 0.4% |
| China | 47 | 0.3% |
| Colombia | 18 | 0.1% |
| Costa Rica | 16 | 0.1% |
| Czechoslovakia | 9 | 0.1% |
| Eastern Asia | 47 | 0.3% |
| Eastern Europe | 163 | 1.1% |
| Ecuador | 26 | 0.2% |
| El Salvador | 18 | 0.1% |
| England | 68 | 0.5% |
| Europe | 362 | 2.5% |
| Germany | 16 | 0.1% |
| Greece | 6 | 0.0% |
| Honduras | 16 | 0.1% |
| India | 51 | 0.4% |
| Latin America | 222 | 1.5% |
| Mexico | 6 | 0.0% |
| Netherlands | 12 | 0.1% |
| Nigeria | 25 | 0.2% |
| Northern Europe | 165 | 1.1% |
| Peru | 15 | 0.1% |
| Philippines | 13 | 0.1% |
| Romania | 78 | 0.5% |
| Russia | 63 | 0.4% |
| Scotland | 52 | 0.4% |
| South America | 166 | 1.1% |
| South Central Asia | 51 | 0.4% |
| South Eastern Asia | 41 | 0.3% |
| Southern Europe | 6 | 0.0% |
| Vietnam | 28 | 0.2% |
| Western Africa | 25 | 0.2% |
| Western Europe | 28 | 0.2% | View All 37 Rows |
Sex and Age in Lake Wylie
Sex and Age in Lake Wylie
The most populous age groups in Lake Wylie are 10 to 14 Years (655 | 9.2%) for men and 5 to 9 Years (598 | 8.3%) for women.
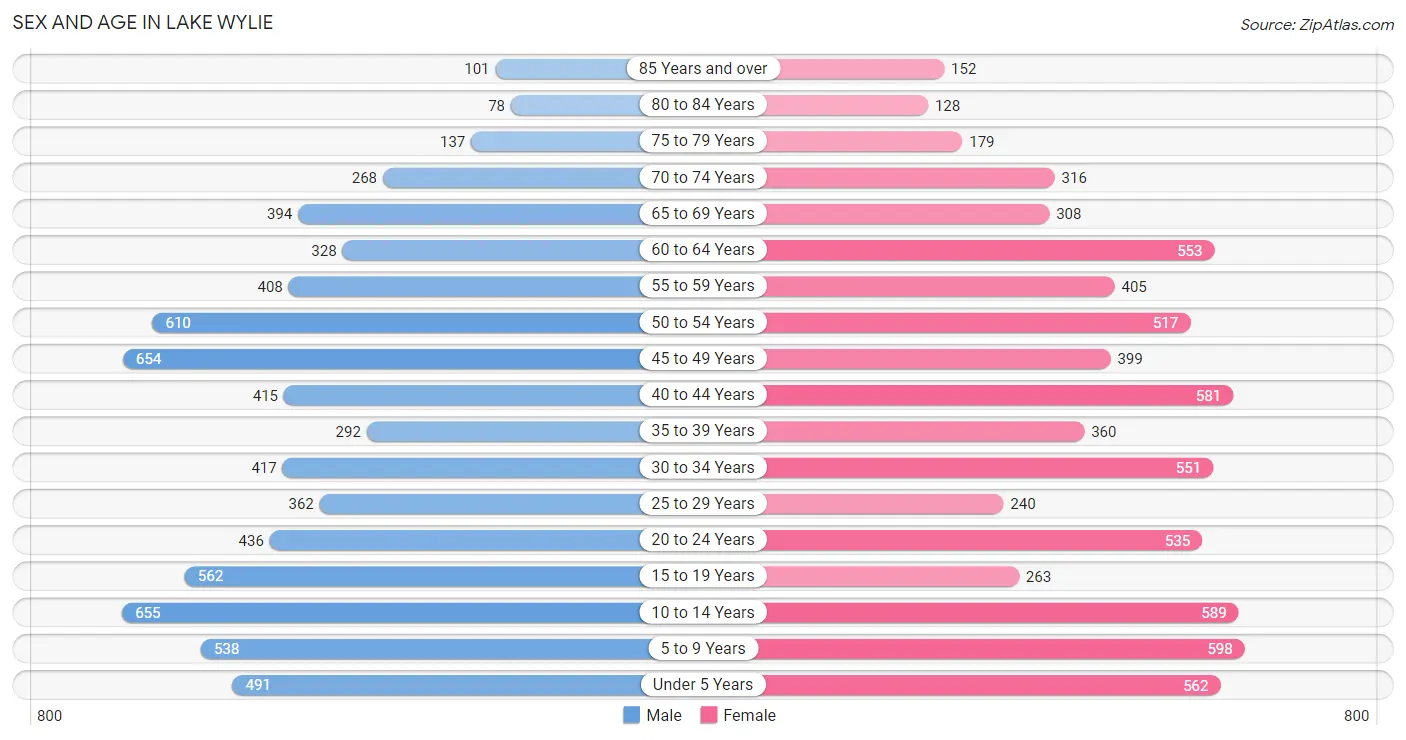
| Age Bracket | Male | Female |
| Under 5 Years | 491 (6.9%) | 562 (7.8%) |
| 5 to 9 Years | 538 (7.5%) | 598 (8.3%) |
| 10 to 14 Years | 655 (9.2%) | 589 (8.1%) |
| 15 to 19 Years | 562 (7.9%) | 263 (3.6%) |
| 20 to 24 Years | 436 (6.1%) | 535 (7.4%) |
| 25 to 29 Years | 362 (5.1%) | 240 (3.3%) |
| 30 to 34 Years | 417 (5.8%) | 551 (7.6%) |
| 35 to 39 Years | 292 (4.1%) | 360 (5.0%) |
| 40 to 44 Years | 415 (5.8%) | 581 (8.0%) |
| 45 to 49 Years | 654 (9.1%) | 399 (5.5%) |
| 50 to 54 Years | 610 (8.5%) | 517 (7.1%) |
| 55 to 59 Years | 408 (5.7%) | 405 (5.6%) |
| 60 to 64 Years | 328 (4.6%) | 553 (7.6%) |
| 65 to 69 Years | 394 (5.5%) | 308 (4.3%) |
| 70 to 74 Years | 268 (3.7%) | 316 (4.4%) |
| 75 to 79 Years | 137 (1.9%) | 179 (2.5%) |
| 80 to 84 Years | 78 (1.1%) | 128 (1.8%) |
| 85 Years and over | 101 (1.4%) | 152 (2.1%) |
| Total | 7,146 (100.0%) | 7,236 (100.0%) |
Families and Households in Lake Wylie
Median Family Size in Lake Wylie
The median family size in Lake Wylie is 3.04 persons per family, with married-couple families (3,087 | 73.0%) accounting for the largest median family size of 3.2 persons per family. On the other hand, single male/father families (460 | 10.9%) represent the smallest median family size with 2.18 persons per family.
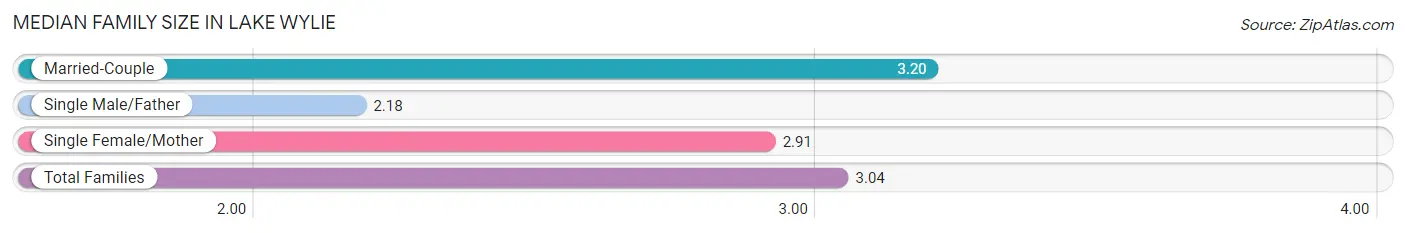
| Family Type | # Families | Family Size |
| Married-Couple | 3,087 (73.0%) | 3.20 |
| Single Male/Father | 460 (10.9%) | 2.18 |
| Single Female/Mother | 682 (16.1%) | 2.91 |
| Total Families | 4,229 (100.0%) | 3.04 |
Median Household Size in Lake Wylie
The median household size in Lake Wylie is 2.72 persons per household, with married-couple households (3,087 | 58.5%) accounting for the largest median household size of 3.2 persons per household. non-family households (1,051 | 19.9%) represent the smallest median household size with 1.22 persons per household.
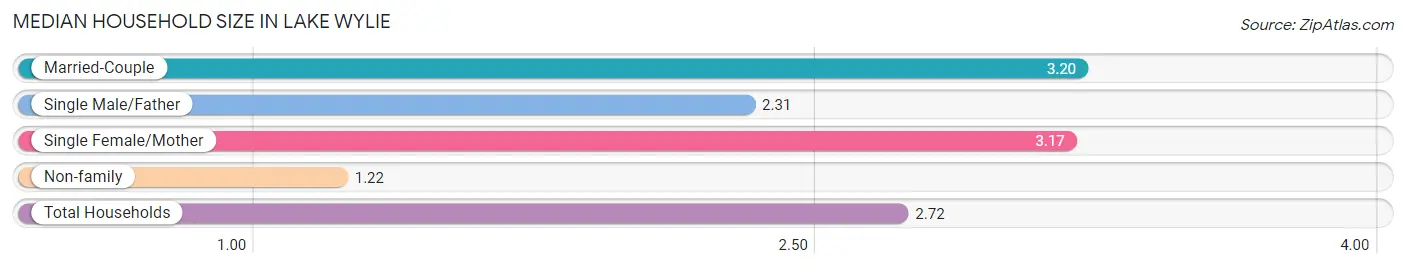
| Household Type | # Households | Household Size |
| Married-Couple | 3,087 (58.5%) | 3.20 |
| Single Male/Father | 460 (8.7%) | 2.31 |
| Single Female/Mother | 682 (12.9%) | 3.17 |
| Non-family | 1,051 (19.9%) | 1.22 |
| Total Households | 5,280 (100.0%) | 2.72 |
Household Size by Marriage Status in Lake Wylie
Out of a total of 5,280 households in Lake Wylie, 4,229 (80.1%) are family households, while 1,051 (19.9%) are nonfamily households. The most numerous type of family households are 2-person households, comprising 1,810, and the most common type of nonfamily households are 1-person households, comprising 870.
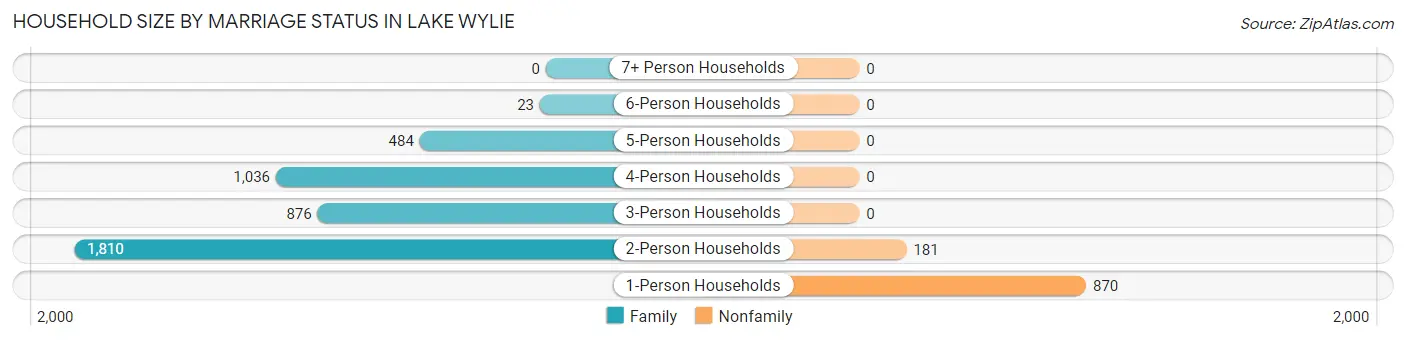
| Household Size | Family Households | Nonfamily Households |
| 1-Person Households | - | 870 (16.5%) |
| 2-Person Households | 1,810 (34.3%) | 181 (3.4%) |
| 3-Person Households | 876 (16.6%) | 0 (0.0%) |
| 4-Person Households | 1,036 (19.6%) | 0 (0.0%) |
| 5-Person Households | 484 (9.2%) | 0 (0.0%) |
| 6-Person Households | 23 (0.4%) | 0 (0.0%) |
| 7+ Person Households | 0 (0.0%) | 0 (0.0%) |
| Total | 4,229 (80.1%) | 1,051 (19.9%) |
Female Fertility in Lake Wylie
Fertility by Age in Lake Wylie
Average fertility rate in Lake Wylie is 54.0 births per 1,000 women. Women in the age bracket of 20 to 34 years have the highest fertility rate with 64.0 births per 1,000 women. Women in the age bracket of 20 to 34 years acount for 51.5% of all women with births.
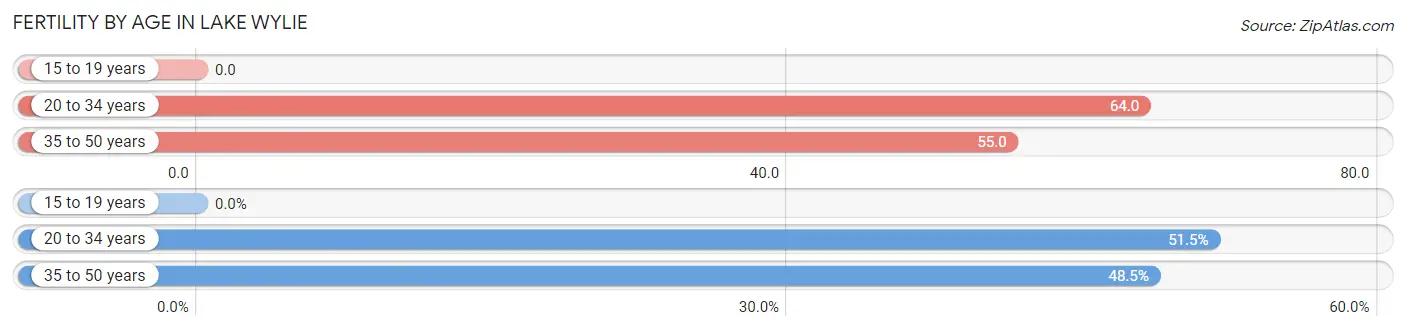
| Age Bracket | Women with Births | Births / 1,000 Women |
| 15 to 19 years | 0 (0.0%) | 0.0 |
| 20 to 34 years | 85 (51.5%) | 64.0 |
| 35 to 50 years | 80 (48.5%) | 55.0 |
| Total | 165 (100.0%) | 54.0 |
Fertility by Age by Marriage Status in Lake Wylie
87.9% of women with births (165) in Lake Wylie are married. The highest percentage of unmarried women with births falls into 20 to 34 years age bracket with 23.5% of them unmarried at the time of birth, while the lowest percentage of unmarried women with births belong to 35 to 50 years age bracket with 0.0% of them unmarried.
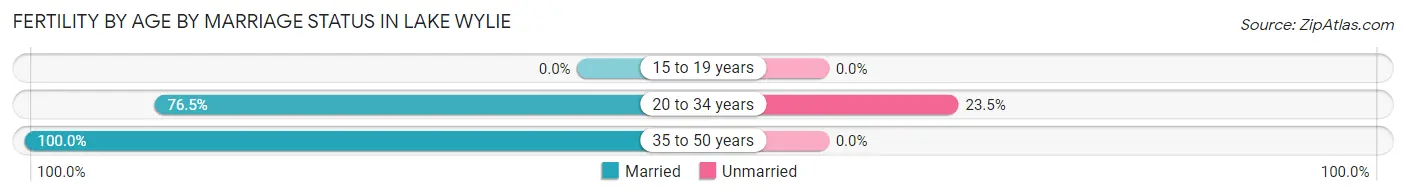
| Age Bracket | Married | Unmarried |
| 15 to 19 years | 0 (0.0%) | 0 (0.0%) |
| 20 to 34 years | 65 (76.5%) | 20 (23.5%) |
| 35 to 50 years | 80 (100.0%) | 0 (0.0%) |
| Total | 145 (87.9%) | 20 (12.1%) |
Fertility by Education in Lake Wylie
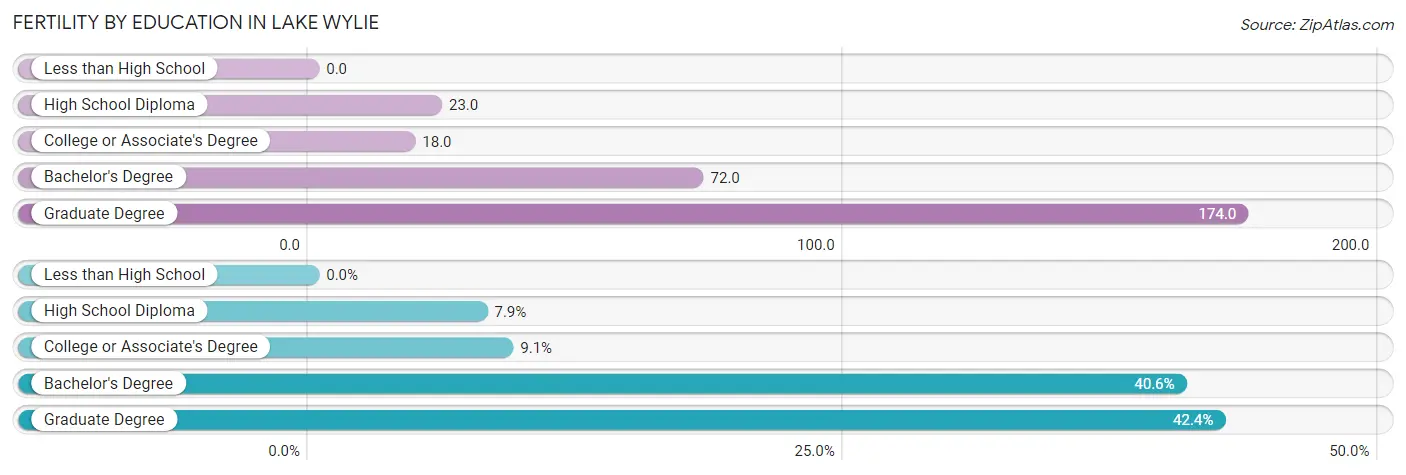
| Educational Attainment | Women with Births | Births / 1,000 Women |
| Less than High School | 0 (0.0%) | 0.0 |
| High School Diploma | 13 (7.9%) | 23.0 |
| College or Associate's Degree | 15 (9.1%) | 18.0 |
| Bachelor's Degree | 67 (40.6%) | 72.0 |
| Graduate Degree | 70 (42.4%) | 174.0 |
| Total | 165 (100.0%) | 54.0 |
Fertility by Education by Marriage Status in Lake Wylie
12.1% of women with births in Lake Wylie are unmarried. Women with the educational attainment of high school diploma are most likely to be married with 100.0% of them married at childbirth, while women with the educational attainment of graduate degree are least likely to be married with 28.6% of them unmarried at childbirth.
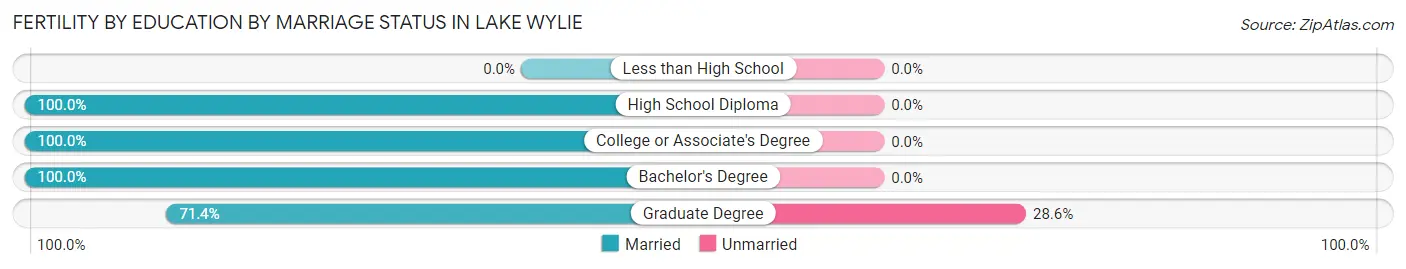
| Educational Attainment | Married | Unmarried |
| Less than High School | 0 (0.0%) | 0 (0.0%) |
| High School Diploma | 13 (100.0%) | 0 (0.0%) |
| College or Associate's Degree | 15 (100.0%) | 0 (0.0%) |
| Bachelor's Degree | 67 (100.0%) | 0 (0.0%) |
| Graduate Degree | 50 (71.4%) | 20 (28.6%) |
| Total | 145 (87.9%) | 20 (12.1%) |
Income in Lake Wylie
Income Overview in Lake Wylie
Per Capita Income in Lake Wylie is $50,736, while median incomes of families and households are $125,750 and $111,424 respectively.
| Characteristic | Number | Measure |
| Per Capita Income | 14,382 | $50,736 |
| Median Family Income | 4,229 | $125,750 |
| Mean Family Income | 4,229 | $152,551 |
| Median Household Income | 5,280 | $111,424 |
| Mean Household Income | 5,280 | $137,165 |
| Income Deficit | 4,229 | $0 |
| Wage / Income Gap (%) | 14,382 | 40.18% |
| Wage / Income Gap ($) | 14,382 | 59.82¢ per $1 |
| Gini / Inequality Index | 14,382 | 0.42 |
Earnings by Sex in Lake Wylie
Average Earnings in Lake Wylie are $51,123, $64,504 for men and $38,587 for women, a difference of 40.2%.
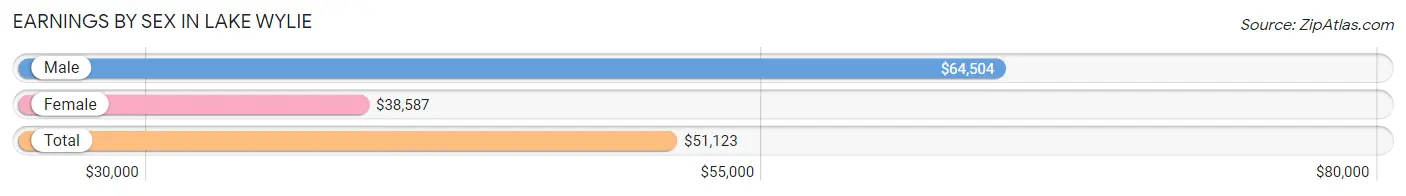
| Sex | Number | Average Earnings |
| Male | 4,297 (54.6%) | $64,504 |
| Female | 3,571 (45.4%) | $38,587 |
| Total | 7,868 (100.0%) | $51,123 |
Earnings by Sex by Income Bracket in Lake Wylie
The most common earnings brackets in Lake Wylie are $100,000+ for men (1,408 | 32.8%) and $100,000+ for women (467 | 13.1%).
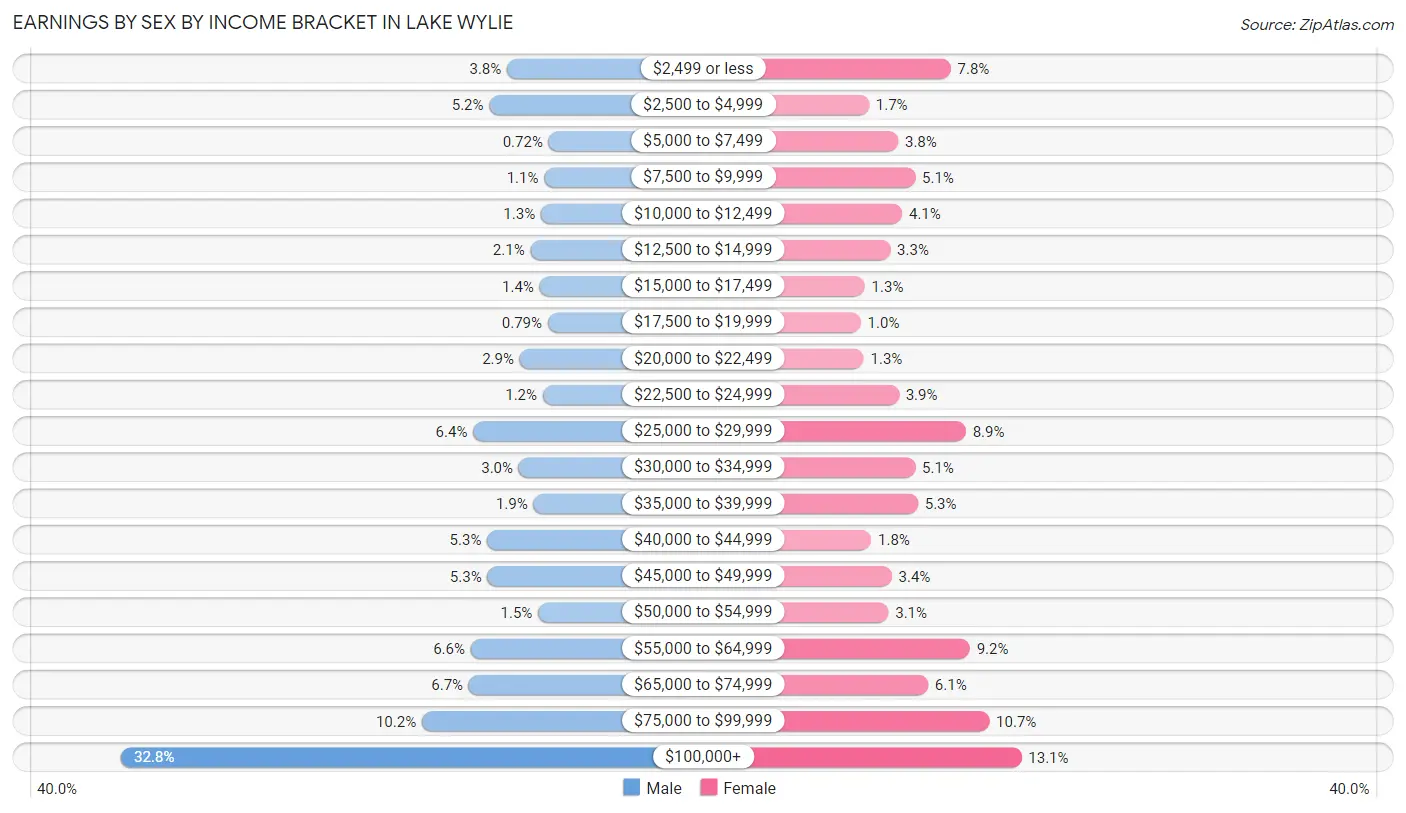
| Income | Male | Female |
| $2,499 or less | 165 (3.8%) | 278 (7.8%) |
| $2,500 to $4,999 | 222 (5.2%) | 59 (1.7%) |
| $5,000 to $7,499 | 31 (0.7%) | 137 (3.8%) |
| $7,500 to $9,999 | 45 (1.1%) | 183 (5.1%) |
| $10,000 to $12,499 | 56 (1.3%) | 148 (4.1%) |
| $12,500 to $14,999 | 90 (2.1%) | 116 (3.3%) |
| $15,000 to $17,499 | 60 (1.4%) | 48 (1.3%) |
| $17,500 to $19,999 | 34 (0.8%) | 37 (1.0%) |
| $20,000 to $22,499 | 124 (2.9%) | 45 (1.3%) |
| $22,500 to $24,999 | 50 (1.2%) | 139 (3.9%) |
| $25,000 to $29,999 | 274 (6.4%) | 318 (8.9%) |
| $30,000 to $34,999 | 127 (3.0%) | 183 (5.1%) |
| $35,000 to $39,999 | 80 (1.9%) | 190 (5.3%) |
| $40,000 to $44,999 | 229 (5.3%) | 65 (1.8%) |
| $45,000 to $49,999 | 228 (5.3%) | 120 (3.4%) |
| $50,000 to $54,999 | 65 (1.5%) | 111 (3.1%) |
| $55,000 to $64,999 | 282 (6.6%) | 329 (9.2%) |
| $65,000 to $74,999 | 288 (6.7%) | 217 (6.1%) |
| $75,000 to $99,999 | 439 (10.2%) | 381 (10.7%) |
| $100,000+ | 1,408 (32.8%) | 467 (13.1%) |
| Total | 4,297 (100.0%) | 3,571 (100.0%) |
Earnings by Sex by Educational Attainment in Lake Wylie
Average earnings in Lake Wylie are $74,665 for men and $46,809 for women, a difference of 37.3%. Men with an educational attainment of graduate degree enjoy the highest average annual earnings of $126,989, while those with high school diploma education earn the least with $35,625. Women with an educational attainment of bachelor's degree earn the most with the average annual earnings of $63,617, while those with college or associate's degree education have the smallest earnings of $29,142.
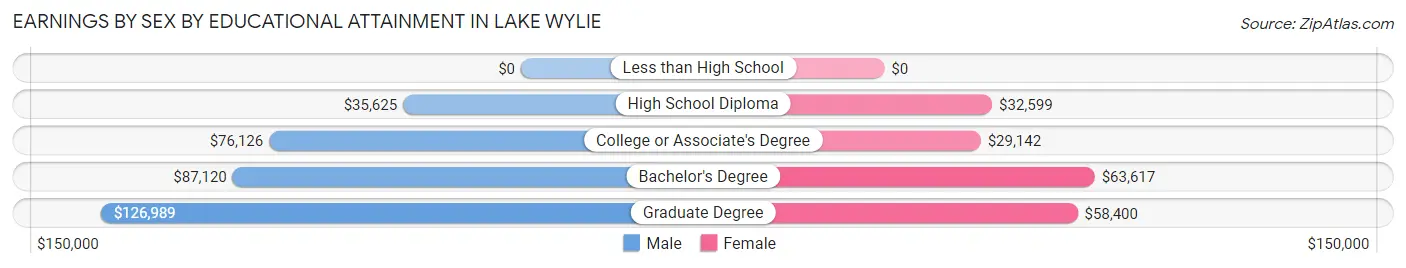
| Educational Attainment | Male Income | Female Income |
| Less than High School | - | - |
| High School Diploma | $35,625 | $32,599 |
| College or Associate's Degree | $76,126 | $29,142 |
| Bachelor's Degree | $87,120 | $63,617 |
| Graduate Degree | $126,989 | $58,400 |
| Total | $74,665 | $46,809 |
Family Income in Lake Wylie
Family Income Brackets in Lake Wylie
According to the Lake Wylie family income data, there are 1,028 families falling into the $200,000+ income range, which is the most common income bracket and makes up 24.3% of all families. Conversely, the $15,000 to $24,999 income bracket is the least frequent group with only 21 families (0.5%) belonging to this category.
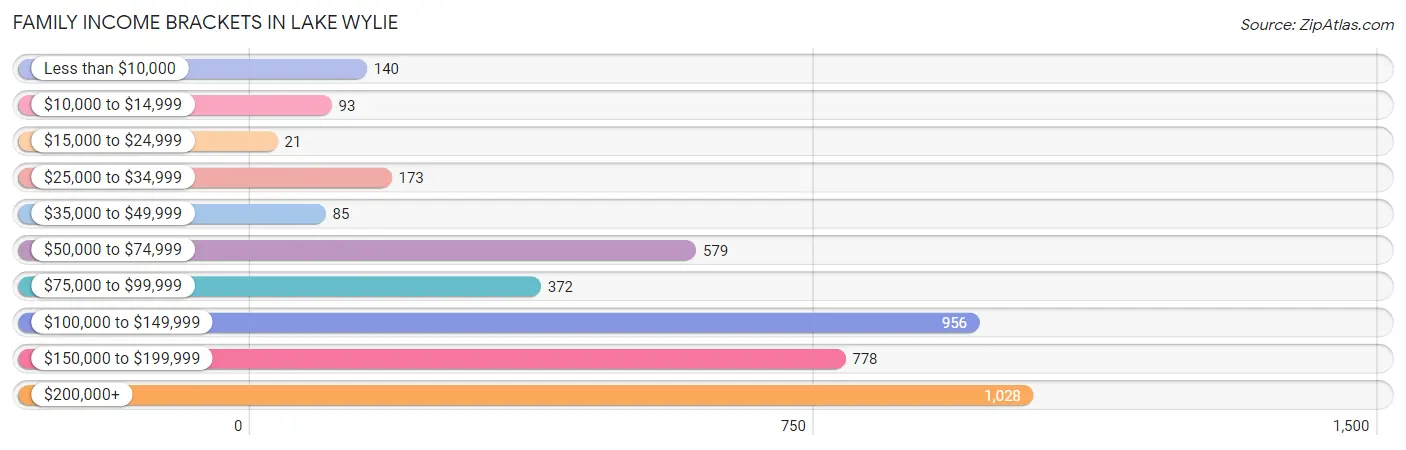
| Income Bracket | # Families | % Families |
| Less than $10,000 | 140 | 3.3% |
| $10,000 to $14,999 | 93 | 2.2% |
| $15,000 to $24,999 | 21 | 0.5% |
| $25,000 to $34,999 | 173 | 4.1% |
| $35,000 to $49,999 | 85 | 2.0% |
| $50,000 to $74,999 | 579 | 13.7% |
| $75,000 to $99,999 | 372 | 8.8% |
| $100,000 to $149,999 | 956 | 22.6% |
| $150,000 to $199,999 | 778 | 18.4% |
| $200,000+ | 1,028 | 24.3% |
Family Income by Famaliy Size in Lake Wylie
5-person families (462 | 10.9%) account for the highest median family income in Lake Wylie with $189,868 per family, while 2-person families (1,862 | 44.0%) have the highest median income of $55,252 per family member.
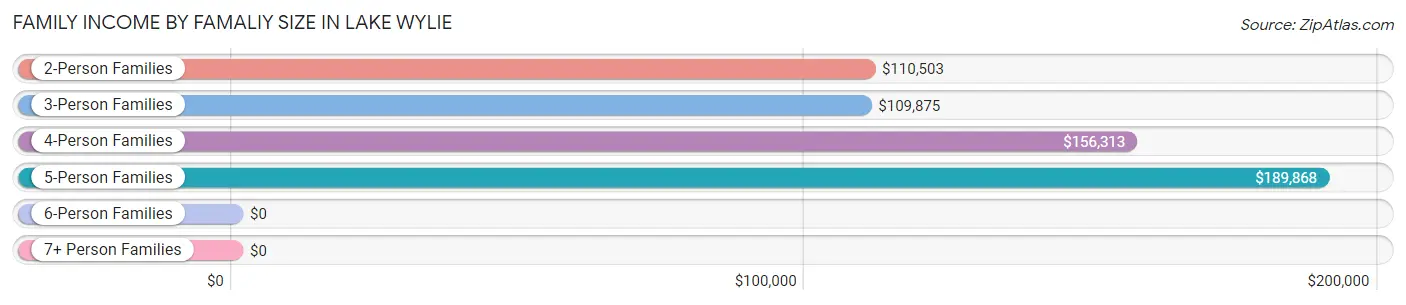
| Income Bracket | # Families | Median Income |
| 2-Person Families | 1,862 (44.0%) | $110,503 |
| 3-Person Families | 990 (23.4%) | $109,875 |
| 4-Person Families | 892 (21.1%) | $156,313 |
| 5-Person Families | 462 (10.9%) | $189,868 |
| 6-Person Families | 23 (0.5%) | $0 |
| 7+ Person Families | 0 (0.0%) | $0 |
| Total | 4,229 (100.0%) | $125,750 |
Family Income by Number of Earners in Lake Wylie
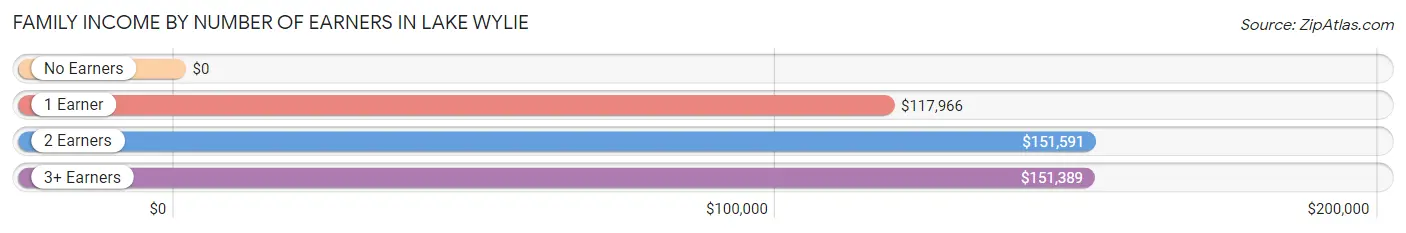
| Number of Earners | # Families | Median Income |
| No Earners | 588 (13.9%) | $0 |
| 1 Earner | 1,375 (32.5%) | $117,966 |
| 2 Earners | 1,794 (42.4%) | $151,591 |
| 3+ Earners | 472 (11.2%) | $151,389 |
| Total | 4,229 (100.0%) | $125,750 |
Household Income in Lake Wylie
Household Income Brackets in Lake Wylie
With 1,140 households falling in the category, the $100,000 to $149,999 income range is the most frequent in Lake Wylie, accounting for 21.6% of all households. In contrast, only 90 households (1.7%) fall into the $15,000 to $24,999 income bracket, making it the least populous group.
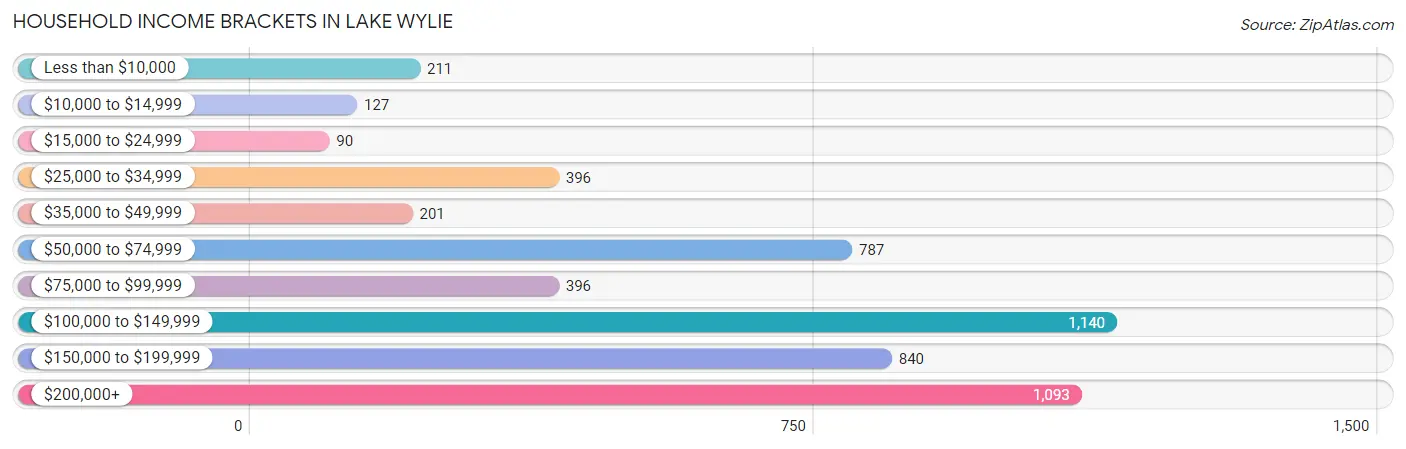
| Income Bracket | # Households | % Households |
| Less than $10,000 | 211 | 4.0% |
| $10,000 to $14,999 | 127 | 2.4% |
| $15,000 to $24,999 | 90 | 1.7% |
| $25,000 to $34,999 | 396 | 7.5% |
| $35,000 to $49,999 | 201 | 3.8% |
| $50,000 to $74,999 | 787 | 14.9% |
| $75,000 to $99,999 | 396 | 7.5% |
| $100,000 to $149,999 | 1,140 | 21.6% |
| $150,000 to $199,999 | 840 | 15.9% |
| $200,000+ | 1,093 | 20.7% |
Household Income by Householder Age in Lake Wylie
The median household income in Lake Wylie is $111,424, with the highest median household income of $139,444 found in the 45 to 64 years age bracket for the primary householder. A total of 2,266 households (42.9%) fall into this category. Meanwhile, the 15 to 24 years age bracket for the primary householder has the lowest median household income of $0, with 271 households (5.1%) in this group.
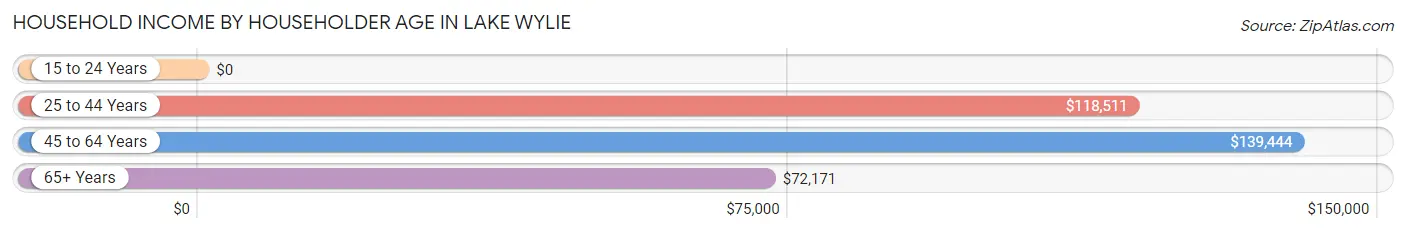
| Income Bracket | # Households | Median Income |
| 15 to 24 Years | 271 (5.1%) | $0 |
| 25 to 44 Years | 1,526 (28.9%) | $118,511 |
| 45 to 64 Years | 2,266 (42.9%) | $139,444 |
| 65+ Years | 1,217 (23.1%) | $72,171 |
| Total | 5,280 (100.0%) | $111,424 |
Poverty in Lake Wylie
Income Below Poverty by Sex and Age in Lake Wylie
With 5.8% poverty level for males and 10.4% for females among the residents of Lake Wylie, under 5 year old males and under 5 year old females are the most vulnerable to poverty, with 103 males (21.0%) and 207 females (36.8%) in their respective age groups living below the poverty level.
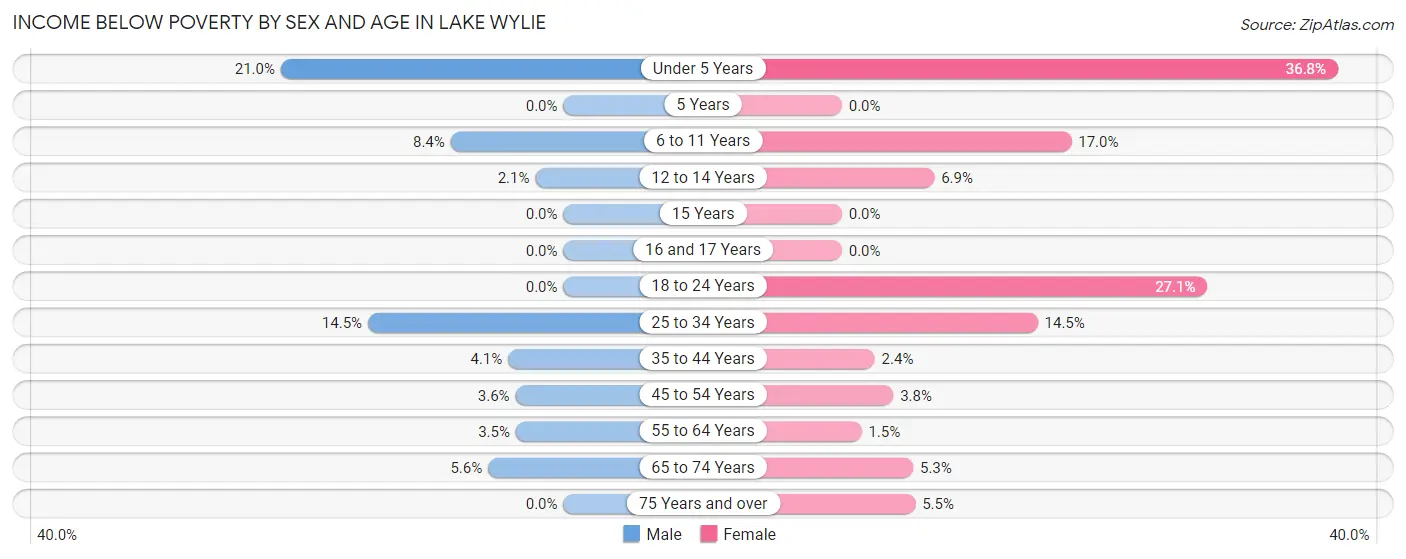
| Age Bracket | Male | Female |
| Under 5 Years | 103 (21.0%) | 207 (36.8%) |
| 5 Years | 0 (0.0%) | 0 (0.0%) |
| 6 to 11 Years | 51 (8.4%) | 114 (17.0%) |
| 12 to 14 Years | 10 (2.1%) | 29 (6.9%) |
| 15 Years | 0 (0.0%) | 0 (0.0%) |
| 16 and 17 Years | 0 (0.0%) | 0 (0.0%) |
| 18 to 24 Years | 0 (0.0%) | 159 (27.1%) |
| 25 to 34 Years | 113 (14.5%) | 115 (14.5%) |
| 35 to 44 Years | 29 (4.1%) | 23 (2.4%) |
| 45 to 54 Years | 45 (3.6%) | 35 (3.8%) |
| 55 to 64 Years | 26 (3.5%) | 14 (1.5%) |
| 65 to 74 Years | 37 (5.6%) | 33 (5.3%) |
| 75 Years and over | 0 (0.0%) | 25 (5.4%) |
| Total | 414 (5.8%) | 754 (10.4%) |
Income Above Poverty by Sex and Age in Lake Wylie
According to the poverty statistics in Lake Wylie, males aged 5 years and females aged 5 years are the age groups that are most secure financially, with 100.0% of males and 100.0% of females in these age groups living above the poverty line.
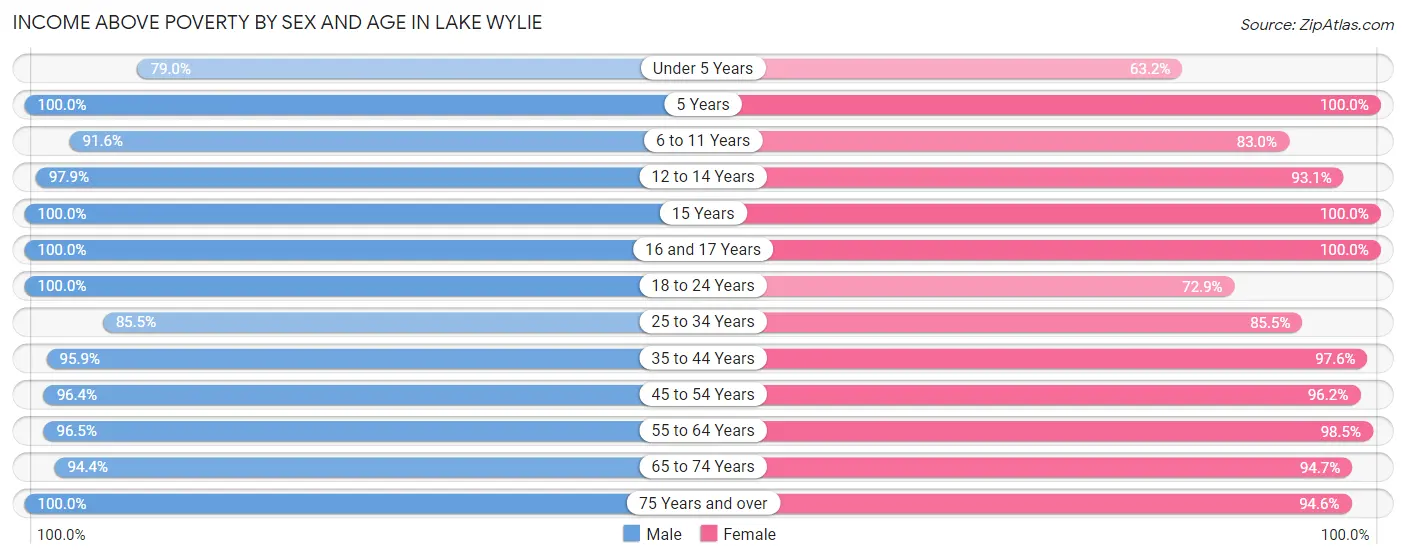
| Age Bracket | Male | Female |
| Under 5 Years | 388 (79.0%) | 355 (63.2%) |
| 5 Years | 103 (100.0%) | 95 (100.0%) |
| 6 to 11 Years | 558 (91.6%) | 555 (83.0%) |
| 12 to 14 Years | 471 (97.9%) | 394 (93.1%) |
| 15 Years | 93 (100.0%) | 143 (100.0%) |
| 16 and 17 Years | 231 (100.0%) | 69 (100.0%) |
| 18 to 24 Years | 674 (100.0%) | 427 (72.9%) |
| 25 to 34 Years | 666 (85.5%) | 676 (85.5%) |
| 35 to 44 Years | 678 (95.9%) | 918 (97.6%) |
| 45 to 54 Years | 1,219 (96.4%) | 881 (96.2%) |
| 55 to 64 Years | 710 (96.5%) | 944 (98.5%) |
| 65 to 74 Years | 625 (94.4%) | 591 (94.7%) |
| 75 Years and over | 316 (100.0%) | 434 (94.6%) |
| Total | 6,732 (94.2%) | 6,482 (89.6%) |
Income Below Poverty Among Married-Couple Families in Lake Wylie
The poverty statistics for married-couple families in Lake Wylie show that 0.6% or 20 of the total 3,087 families live below the poverty line. Families with 1 or 2 children have the highest poverty rate of 0.9%, comprising of 11 families. On the other hand, families with 3 or 4 children have the lowest poverty rate of 0.0%, which includes 0 families.
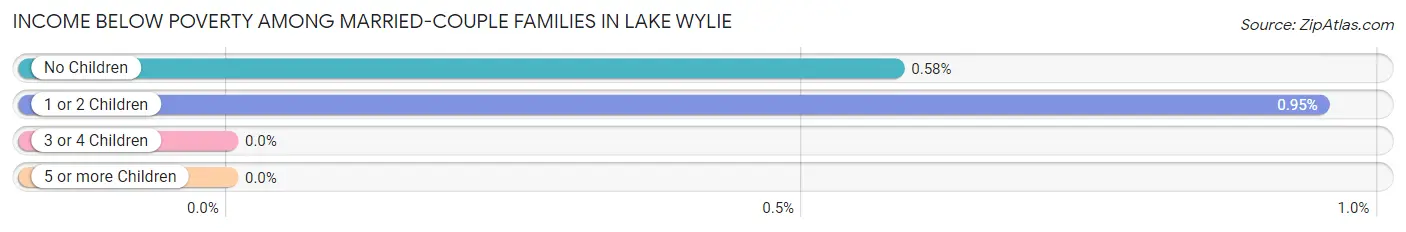
| Children | Above Poverty | Below Poverty |
| No Children | 1,553 (99.4%) | 9 (0.6%) |
| 1 or 2 Children | 1,149 (99.1%) | 11 (0.9%) |
| 3 or 4 Children | 365 (100.0%) | 0 (0.0%) |
| 5 or more Children | 0 (0.0%) | 0 (0.0%) |
| Total | 3,067 (99.4%) | 20 (0.6%) |
Income Below Poverty Among Single-Parent Households in Lake Wylie
According to the poverty data in Lake Wylie, 5.4% or 25 single-father households and 32.0% or 218 single-mother households are living below the poverty line. Among single-father households, those with 1 or 2 children have the highest poverty rate, with 25 households (50.0%) experiencing poverty. Likewise, among single-mother households, those with 1 or 2 children have the highest poverty rate, with 218 households (44.3%) falling below the poverty line.
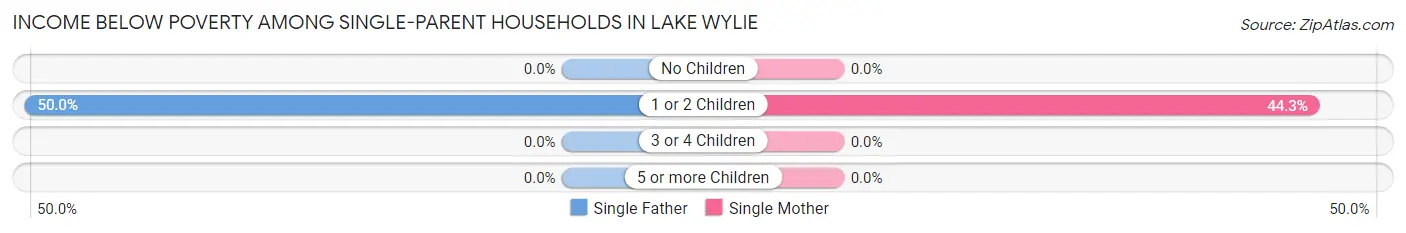
| Children | Single Father | Single Mother |
| No Children | 0 (0.0%) | 0 (0.0%) |
| 1 or 2 Children | 25 (50.0%) | 218 (44.3%) |
| 3 or 4 Children | 0 (0.0%) | 0 (0.0%) |
| 5 or more Children | 0 (0.0%) | 0 (0.0%) |
| Total | 25 (5.4%) | 218 (32.0%) |
Income Below Poverty Among Married-Couple vs Single-Parent Households in Lake Wylie
The poverty data for Lake Wylie shows that 20 of the married-couple family households (0.6%) and 243 of the single-parent households (21.3%) are living below the poverty level. Within the married-couple family households, those with 1 or 2 children have the highest poverty rate, with 11 households (0.9%) falling below the poverty line. Among the single-parent households, those with 1 or 2 children have the highest poverty rate, with 243 household (44.8%) living below poverty.
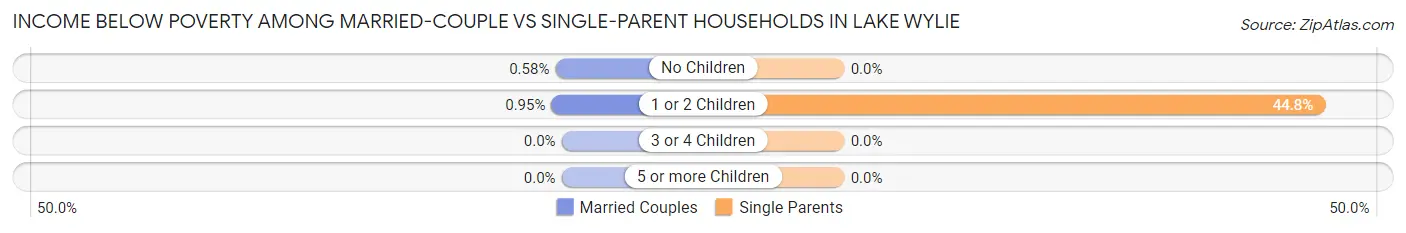
| Children | Married-Couple Families | Single-Parent Households |
| No Children | 9 (0.6%) | 0 (0.0%) |
| 1 or 2 Children | 11 (0.9%) | 243 (44.8%) |
| 3 or 4 Children | 0 (0.0%) | 0 (0.0%) |
| 5 or more Children | 0 (0.0%) | 0 (0.0%) |
| Total | 20 (0.6%) | 243 (21.3%) |
Employment Characteristics in Lake Wylie
Employment by Class of Employer in Lake Wylie
Among the 7,017 employed individuals in Lake Wylie, private company employees (5,173 | 73.7%), self-employed (not incorporated) (424 | 6.0%), and not-for-profit organizations (415 | 5.9%) make up the most common classes of employment.
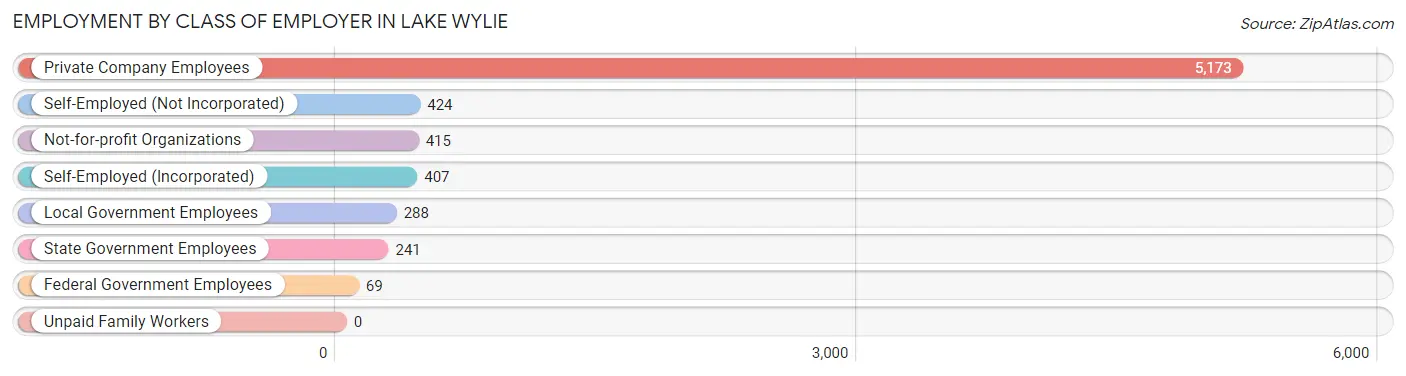
| Employer Class | # Employees | % Employees |
| Private Company Employees | 5,173 | 73.7% |
| Self-Employed (Incorporated) | 407 | 5.8% |
| Self-Employed (Not Incorporated) | 424 | 6.0% |
| Not-for-profit Organizations | 415 | 5.9% |
| Local Government Employees | 288 | 4.1% |
| State Government Employees | 241 | 3.4% |
| Federal Government Employees | 69 | 1.0% |
| Unpaid Family Workers | 0 | 0.0% |
| Total | 7,017 | 100.0% |
Employment Status by Age in Lake Wylie
According to the labor force statistics for Lake Wylie, out of the total population over 16 years of age (10,713), 70.2% or 7,521 individuals are in the labor force, with 5.5% or 414 of them unemployed. The age group with the highest labor force participation rate is 20 to 24 years, with 91.8% or 891 individuals in the labor force. Within the labor force, the 20 to 24 years age range has the highest percentage of unemployed individuals, with 21.5% or 192 of them being unemployed.
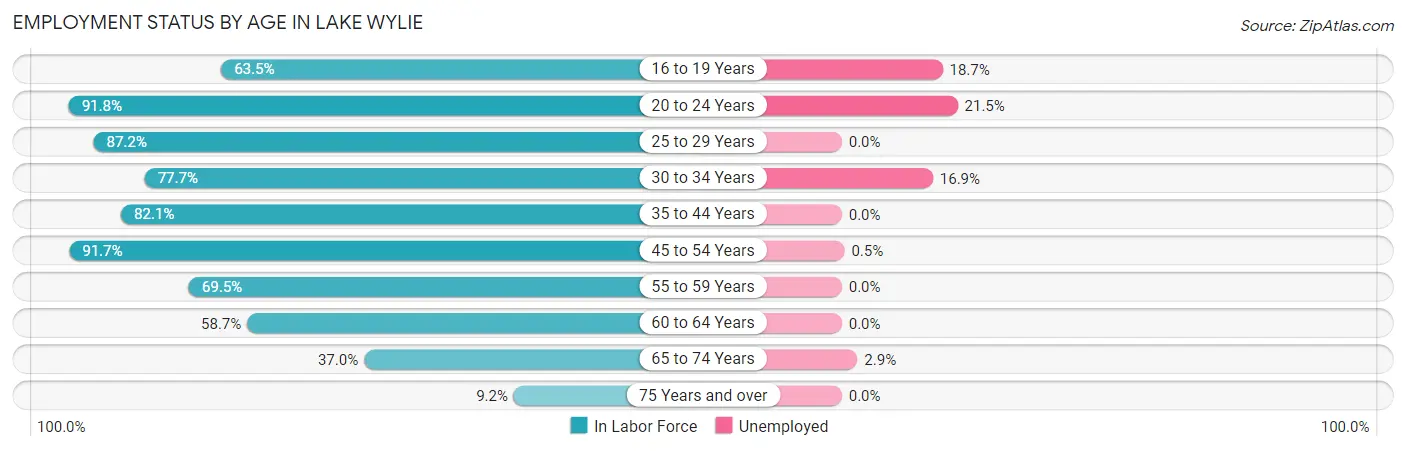
| Age Bracket | In Labor Force | Unemployed |
| 16 to 19 Years | 374 (63.5%) | 70 (18.7%) |
| 20 to 24 Years | 891 (91.8%) | 192 (21.5%) |
| 25 to 29 Years | 525 (87.2%) | 0 (0.0%) |
| 30 to 34 Years | 752 (77.7%) | 127 (16.9%) |
| 35 to 44 Years | 1,353 (82.1%) | 0 (0.0%) |
| 45 to 54 Years | 1,999 (91.7%) | 10 (0.5%) |
| 55 to 59 Years | 565 (69.5%) | 0 (0.0%) |
| 60 to 64 Years | 517 (58.7%) | 0 (0.0%) |
| 65 to 74 Years | 476 (37.0%) | 14 (2.9%) |
| 75 Years and over | 71 (9.2%) | 0 (0.0%) |
| Total | 7,521 (70.2%) | 414 (5.5%) |
Employment Status by Educational Attainment in Lake Wylie
According to labor force statistics for Lake Wylie, 80.5% of individuals (5,709) out of the total population between 25 and 64 years of age (7,092) are in the labor force, with 2.4% or 137 of them being unemployed. The group with the highest labor force participation rate are those with the educational attainment of less than high school, with 90.1% or 91 individuals in the labor force. Within the labor force, individuals with high school diploma education have the highest percentage of unemployment, with 15.6% or 100 of them being unemployed.
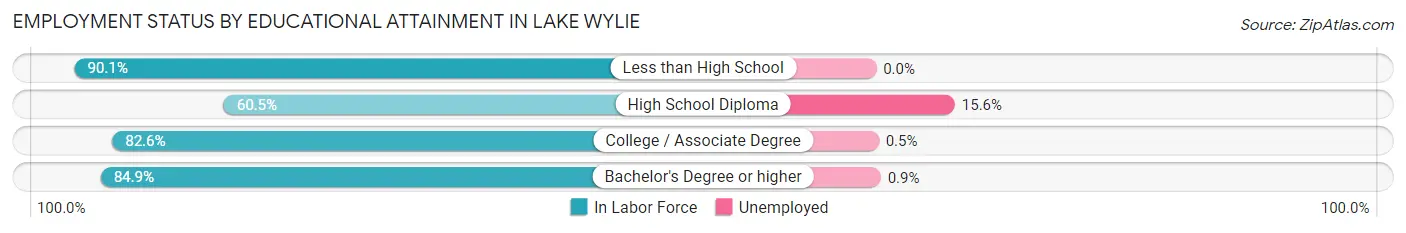
| Educational Attainment | In Labor Force | Unemployed |
| Less than High School | 91 (90.1%) | 0 (0.0%) |
| High School Diploma | 641 (60.5%) | 165 (15.6%) |
| College / Associate Degree | 2,104 (82.6%) | 13 (0.5%) |
| Bachelor's Degree or higher | 2,874 (84.9%) | 30 (0.9%) |
| Total | 5,709 (80.5%) | 170 (2.4%) |
Employment Occupations by Sex in Lake Wylie
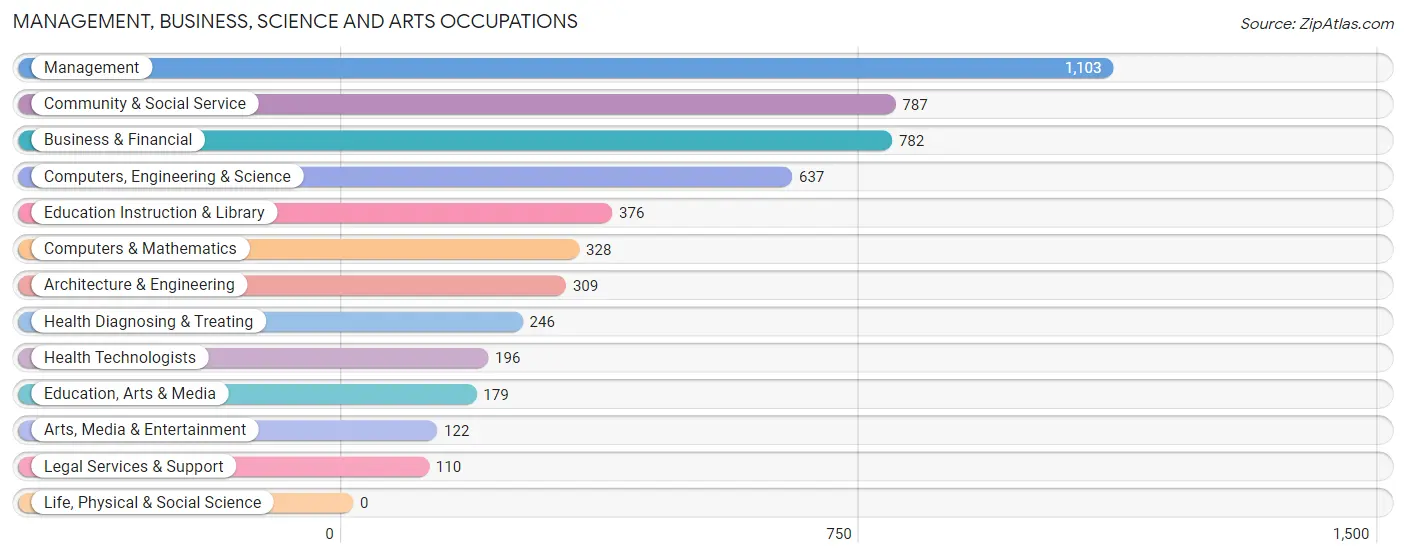
Management, Business, Science and Arts Occupations
The most common Management, Business, Science and Arts occupations in Lake Wylie are Management (1,103 | 15.5%), Community & Social Service (787 | 11.1%), Business & Financial (782 | 11.0%), Computers, Engineering & Science (637 | 9.0%), and Education Instruction & Library (376 | 5.3%).
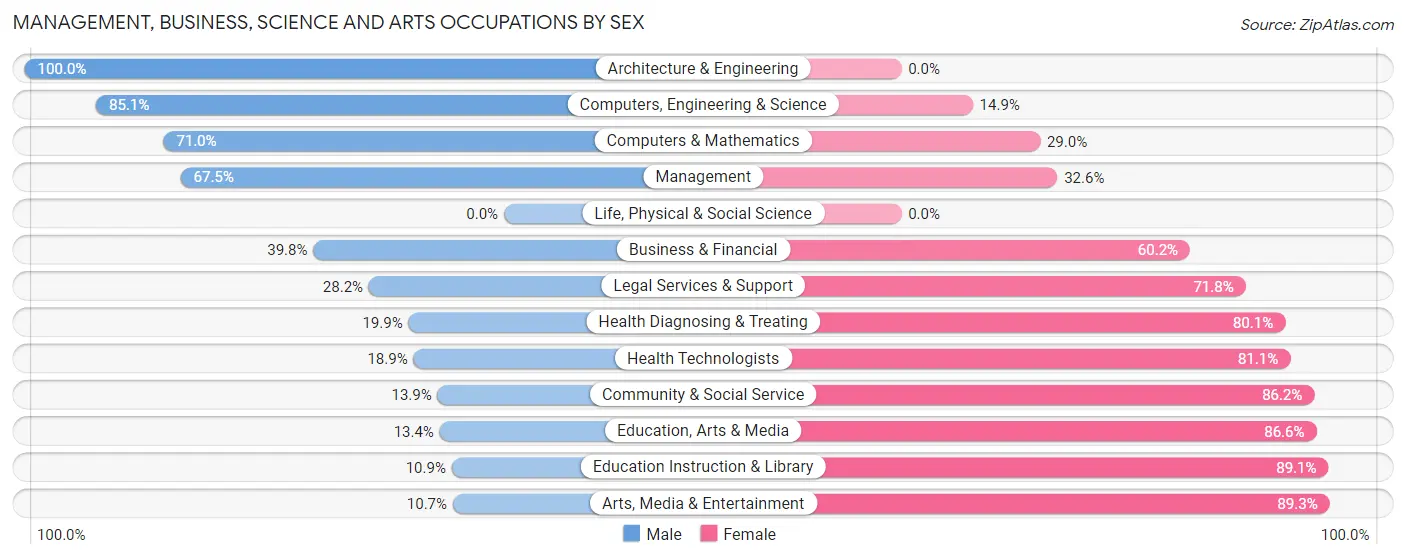
Management, Business, Science and Arts Occupations by Sex
Within the Management, Business, Science and Arts occupations in Lake Wylie, the most male-oriented occupations are Architecture & Engineering (100.0%), Computers, Engineering & Science (85.1%), and Computers & Mathematics (71.0%), while the most female-oriented occupations are Arts, Media & Entertainment (89.3%), Education Instruction & Library (89.1%), and Education, Arts & Media (86.6%).
| Occupation | Male | Female |
| Management | 744 (67.4%) | 359 (32.6%) |
| Business & Financial | 311 (39.8%) | 471 (60.2%) |
| Computers, Engineering & Science | 542 (85.1%) | 95 (14.9%) |
| Computers & Mathematics | 233 (71.0%) | 95 (29.0%) |
| Architecture & Engineering | 309 (100.0%) | 0 (0.0%) |
| Life, Physical & Social Science | 0 (0.0%) | 0 (0.0%) |
| Community & Social Service | 109 (13.9%) | 678 (86.2%) |
| Education, Arts & Media | 24 (13.4%) | 155 (86.6%) |
| Legal Services & Support | 31 (28.2%) | 79 (71.8%) |
| Education Instruction & Library | 41 (10.9%) | 335 (89.1%) |
| Arts, Media & Entertainment | 13 (10.7%) | 109 (89.3%) |
| Health Diagnosing & Treating | 49 (19.9%) | 197 (80.1%) |
| Health Technologists | 37 (18.9%) | 159 (81.1%) |
| Total (Category) | 1,755 (49.4%) | 1,800 (50.6%) |
| Total (Overall) | 4,014 (56.5%) | 3,095 (43.5%) |
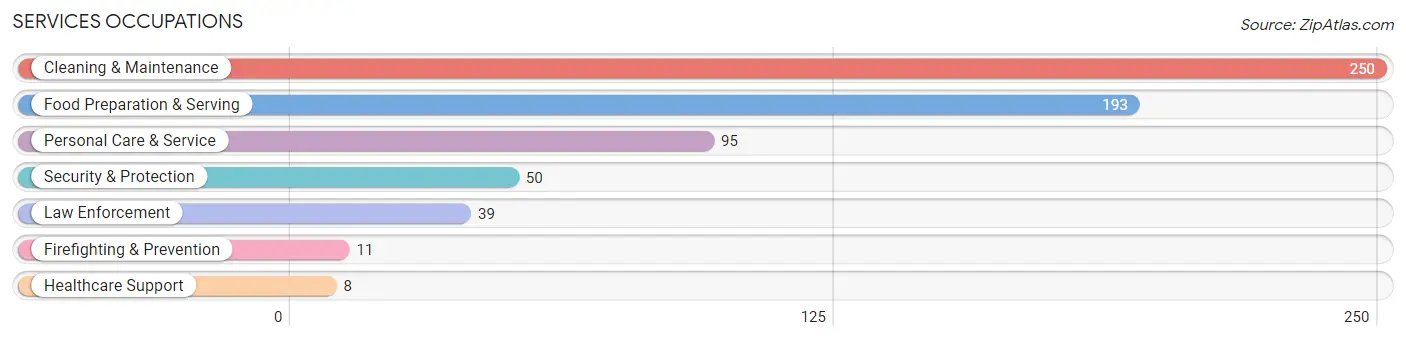
Services Occupations
The most common Services occupations in Lake Wylie are Cleaning & Maintenance (250 | 3.5%), Food Preparation & Serving (193 | 2.7%), Personal Care & Service (95 | 1.3%), Security & Protection (50 | 0.7%), and Law Enforcement (39 | 0.5%).
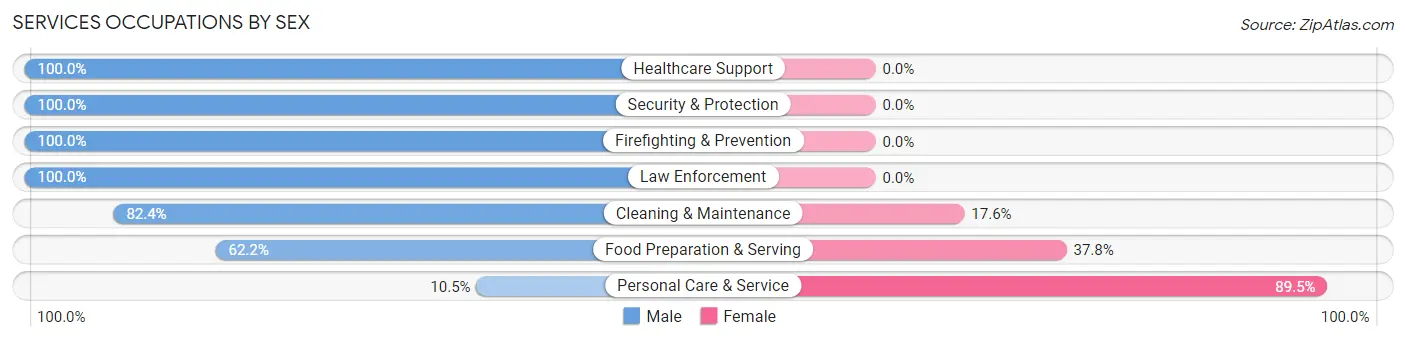
Services Occupations by Sex
Within the Services occupations in Lake Wylie, the most male-oriented occupations are Healthcare Support (100.0%), Security & Protection (100.0%), and Firefighting & Prevention (100.0%), while the most female-oriented occupations are Personal Care & Service (89.5%), Food Preparation & Serving (37.8%), and Cleaning & Maintenance (17.6%).
| Occupation | Male | Female |
| Healthcare Support | 8 (100.0%) | 0 (0.0%) |
| Security & Protection | 50 (100.0%) | 0 (0.0%) |
| Firefighting & Prevention | 11 (100.0%) | 0 (0.0%) |
| Law Enforcement | 39 (100.0%) | 0 (0.0%) |
| Food Preparation & Serving | 120 (62.2%) | 73 (37.8%) |
| Cleaning & Maintenance | 206 (82.4%) | 44 (17.6%) |
| Personal Care & Service | 10 (10.5%) | 85 (89.5%) |
| Total (Category) | 394 (66.1%) | 202 (33.9%) |
| Total (Overall) | 4,014 (56.5%) | 3,095 (43.5%) |
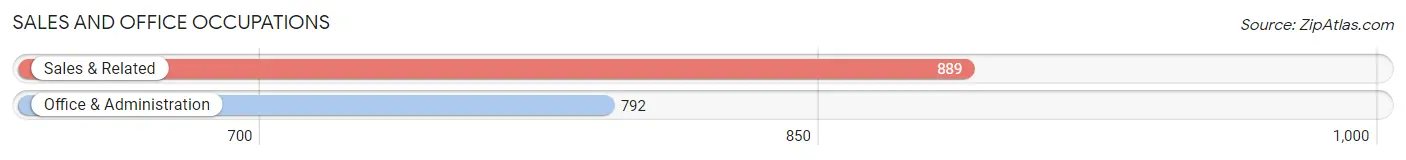
Sales and Office Occupations
The most common Sales and Office occupations in Lake Wylie are Sales & Related (889 | 12.5%), and Office & Administration (792 | 11.1%).
Sales and Office Occupations by Sex
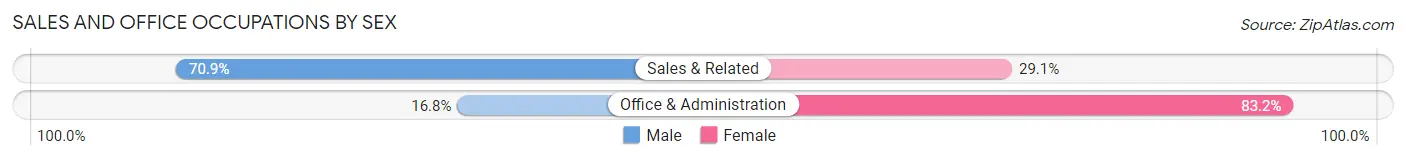
| Occupation | Male | Female |
| Sales & Related | 630 (70.9%) | 259 (29.1%) |
| Office & Administration | 133 (16.8%) | 659 (83.2%) |
| Total (Category) | 763 (45.4%) | 918 (54.6%) |
| Total (Overall) | 4,014 (56.5%) | 3,095 (43.5%) |
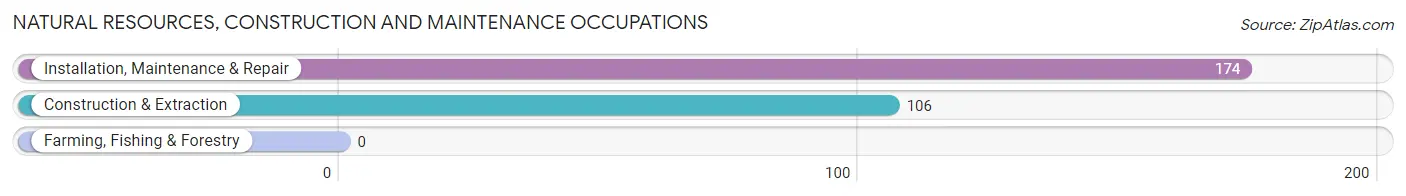
Natural Resources, Construction and Maintenance Occupations
The most common Natural Resources, Construction and Maintenance occupations in Lake Wylie are Installation, Maintenance & Repair (174 | 2.5%), and Construction & Extraction (106 | 1.5%).
Natural Resources, Construction and Maintenance Occupations by Sex
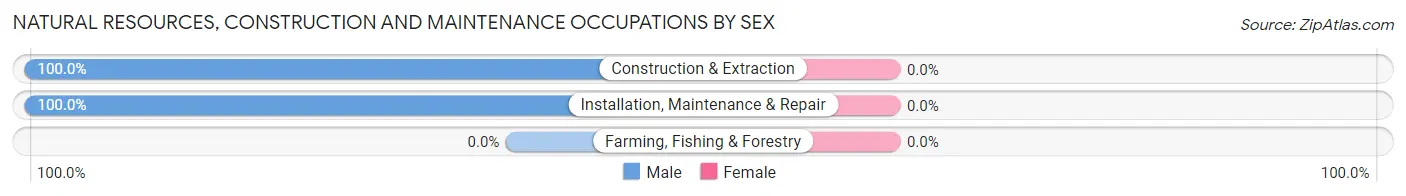
| Occupation | Male | Female |
| Farming, Fishing & Forestry | 0 (0.0%) | 0 (0.0%) |
| Construction & Extraction | 106 (100.0%) | 0 (0.0%) |
| Installation, Maintenance & Repair | 174 (100.0%) | 0 (0.0%) |
| Total (Category) | 280 (100.0%) | 0 (0.0%) |
| Total (Overall) | 4,014 (56.5%) | 3,095 (43.5%) |
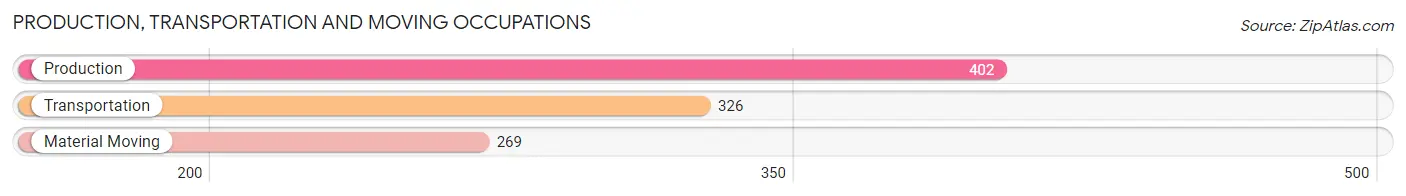
Production, Transportation and Moving Occupations
The most common Production, Transportation and Moving occupations in Lake Wylie are Production (402 | 5.7%), Transportation (326 | 4.6%), and Material Moving (269 | 3.8%).
Production, Transportation and Moving Occupations by Sex
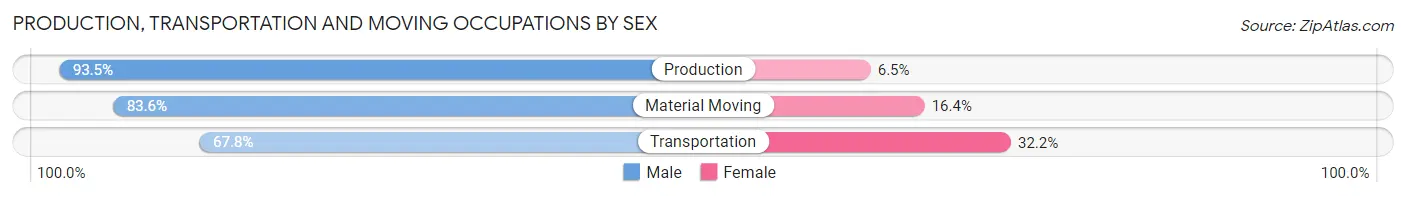
| Occupation | Male | Female |
| Production | 376 (93.5%) | 26 (6.5%) |
| Transportation | 221 (67.8%) | 105 (32.2%) |
| Material Moving | 225 (83.6%) | 44 (16.4%) |
| Total (Category) | 822 (82.5%) | 175 (17.5%) |
| Total (Overall) | 4,014 (56.5%) | 3,095 (43.5%) |
Employment Industries by Sex in Lake Wylie
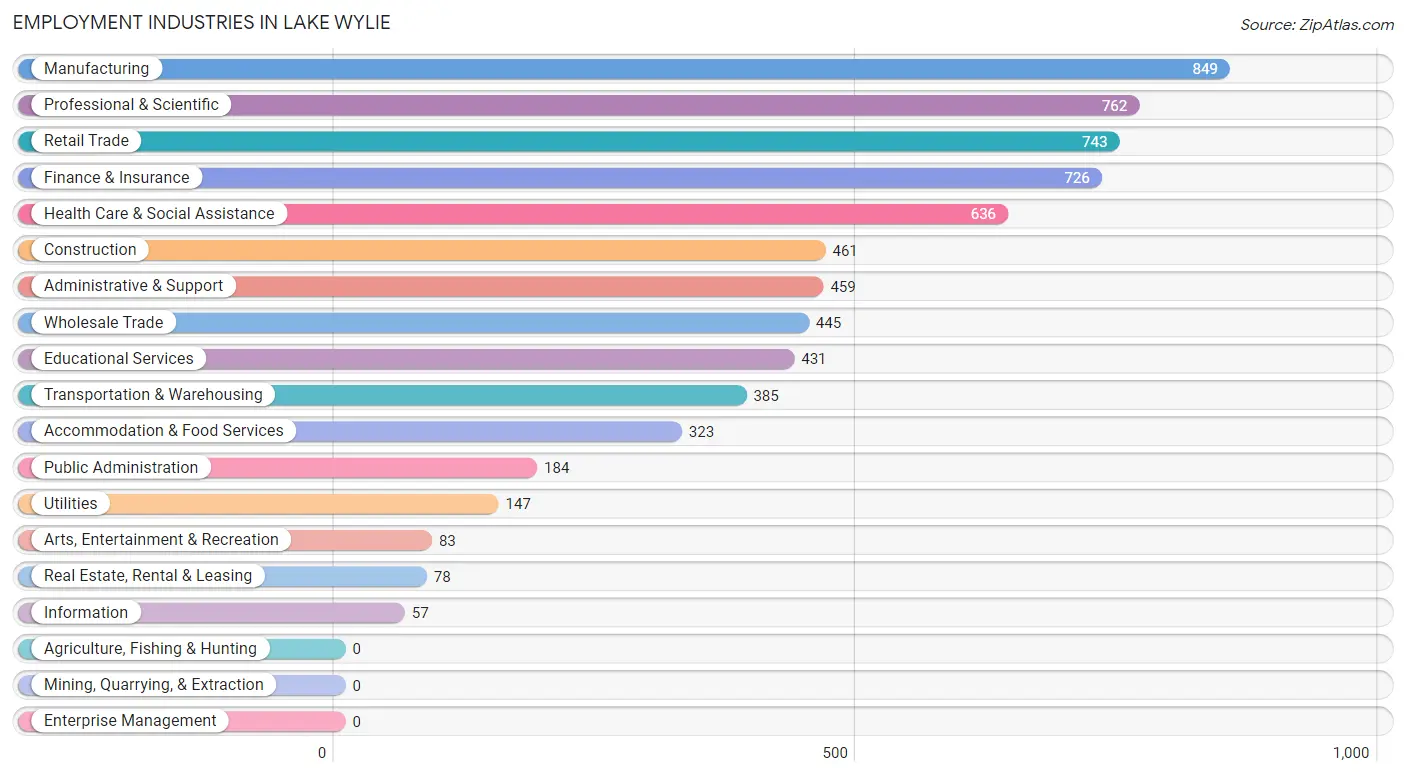
Employment Industries in Lake Wylie
The major employment industries in Lake Wylie include Manufacturing (849 | 11.9%), Professional & Scientific (762 | 10.7%), Retail Trade (743 | 10.4%), Finance & Insurance (726 | 10.2%), and Health Care & Social Assistance (636 | 8.9%).
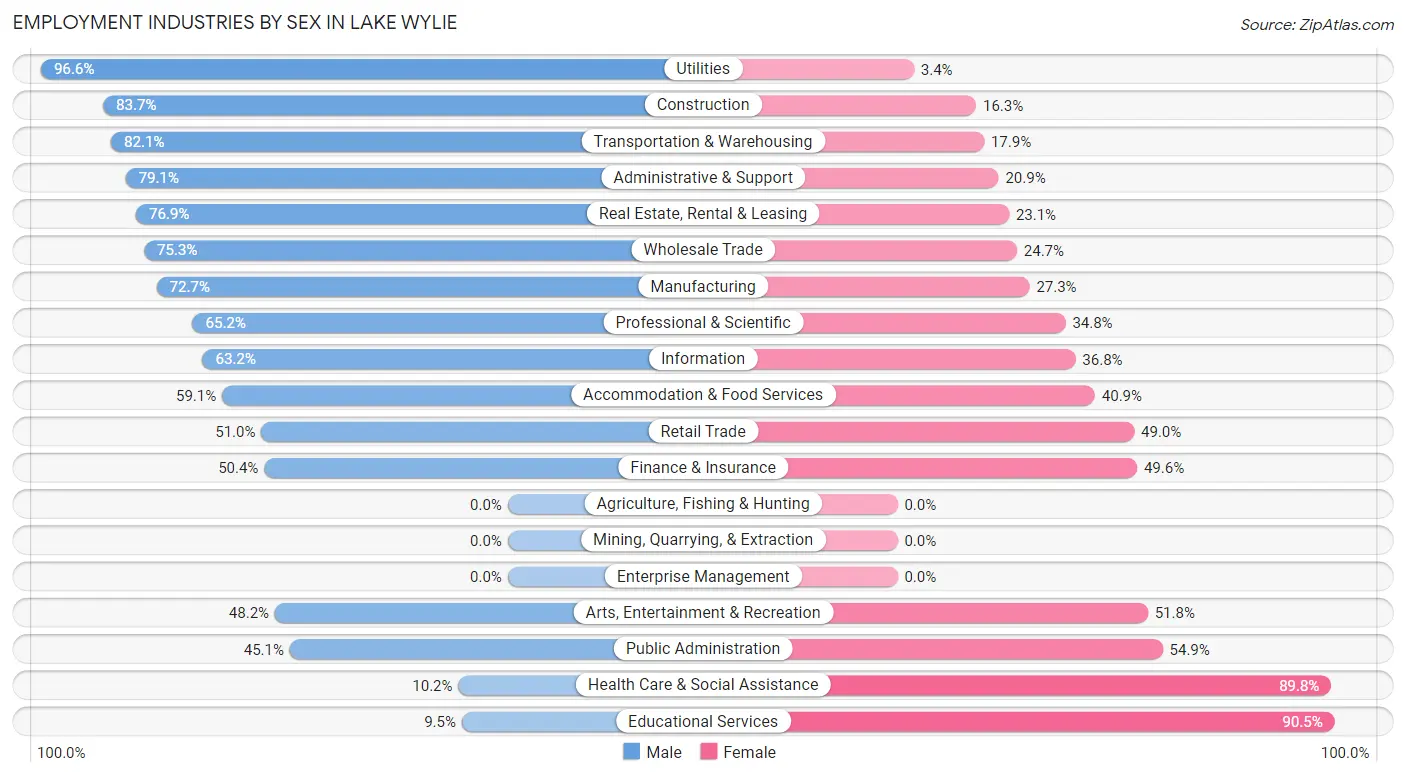
Employment Industries by Sex in Lake Wylie
The Lake Wylie industries that see more men than women are Utilities (96.6%), Construction (83.7%), and Transportation & Warehousing (82.1%), whereas the industries that tend to have a higher number of women are Educational Services (90.5%), Health Care & Social Assistance (89.8%), and Public Administration (54.9%).
| Industry | Male | Female |
| Agriculture, Fishing & Hunting | 0 (0.0%) | 0 (0.0%) |
| Mining, Quarrying, & Extraction | 0 (0.0%) | 0 (0.0%) |
| Construction | 386 (83.7%) | 75 (16.3%) |
| Manufacturing | 617 (72.7%) | 232 (27.3%) |
| Wholesale Trade | 335 (75.3%) | 110 (24.7%) |
| Retail Trade | 379 (51.0%) | 364 (49.0%) |
| Transportation & Warehousing | 316 (82.1%) | 69 (17.9%) |
| Utilities | 142 (96.6%) | 5 (3.4%) |
| Information | 36 (63.2%) | 21 (36.8%) |
| Finance & Insurance | 366 (50.4%) | 360 (49.6%) |
| Real Estate, Rental & Leasing | 60 (76.9%) | 18 (23.1%) |
| Professional & Scientific | 497 (65.2%) | 265 (34.8%) |
| Enterprise Management | 0 (0.0%) | 0 (0.0%) |
| Administrative & Support | 363 (79.1%) | 96 (20.9%) |
| Educational Services | 41 (9.5%) | 390 (90.5%) |
| Health Care & Social Assistance | 65 (10.2%) | 571 (89.8%) |
| Arts, Entertainment & Recreation | 40 (48.2%) | 43 (51.8%) |
| Accommodation & Food Services | 191 (59.1%) | 132 (40.9%) |
| Public Administration | 83 (45.1%) | 101 (54.9%) |
| Total | 4,014 (56.5%) | 3,095 (43.5%) |
Education in Lake Wylie
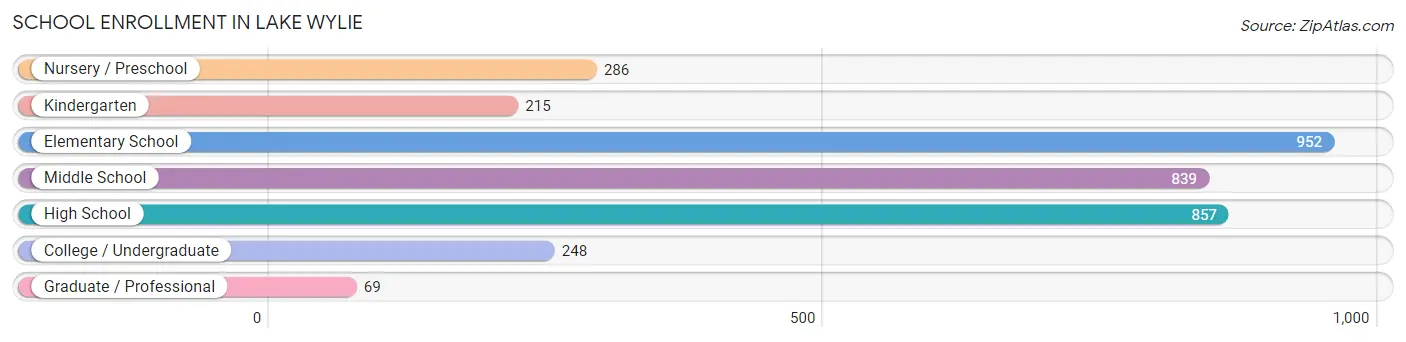
School Enrollment in Lake Wylie
The most common levels of schooling among the 3,466 students in Lake Wylie are elementary school (952 | 27.5%), high school (857 | 24.7%), and middle school (839 | 24.2%).
| School Level | # Students | % Students |
| Nursery / Preschool | 286 | 8.3% |
| Kindergarten | 215 | 6.2% |
| Elementary School | 952 | 27.5% |
| Middle School | 839 | 24.2% |
| High School | 857 | 24.7% |
| College / Undergraduate | 248 | 7.2% |
| Graduate / Professional | 69 | 2.0% |
| Total | 3,466 | 100.0% |
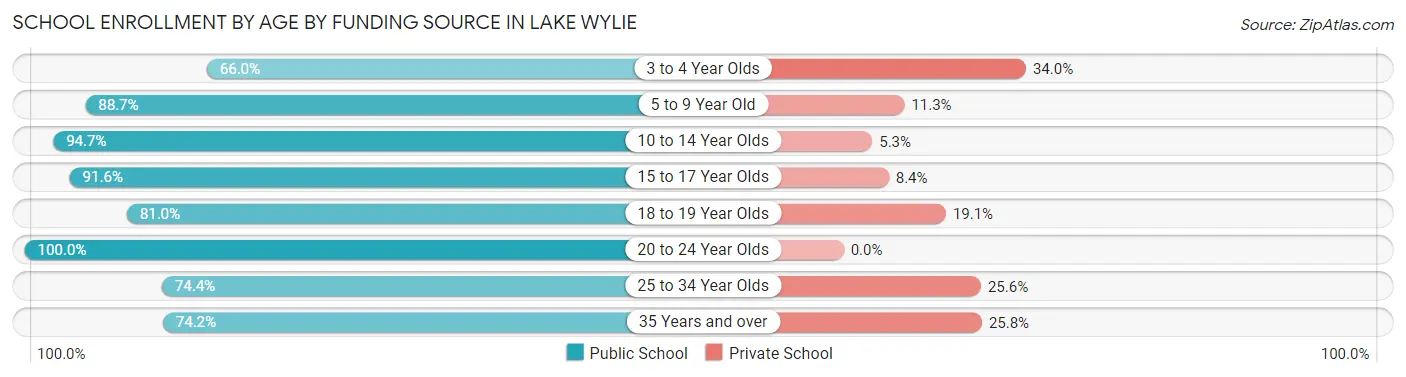
School Enrollment by Age by Funding Source in Lake Wylie
Out of a total of 3,466 students who are enrolled in schools in Lake Wylie, 412 (11.9%) attend a private institution, while the remaining 3,054 (88.1%) are enrolled in public schools. The age group of 3 to 4 year olds has the highest likelihood of being enrolled in private schools, with 90 (34.0% in the age bracket) enrolled. Conversely, the age group of 20 to 24 year olds has the lowest likelihood of being enrolled in a private school, with 27 (100.0% in the age bracket) attending a public institution.
| Age Bracket | Public School | Private School |
| 3 to 4 Year Olds | 175 (66.0%) | 90 (34.0%) |
| 5 to 9 Year Old | 964 (88.7%) | 123 (11.3%) |
| 10 to 14 Year Olds | 1,083 (94.7%) | 61 (5.3%) |
| 15 to 17 Year Olds | 491 (91.6%) | 45 (8.4%) |
| 18 to 19 Year Olds | 153 (80.9%) | 36 (19.1%) |
| 20 to 24 Year Olds | 27 (100.0%) | 0 (0.0%) |
| 25 to 34 Year Olds | 64 (74.4%) | 22 (25.6%) |
| 35 Years and over | 98 (74.2%) | 34 (25.8%) |
| Total | 3,054 (88.1%) | 412 (11.9%) |
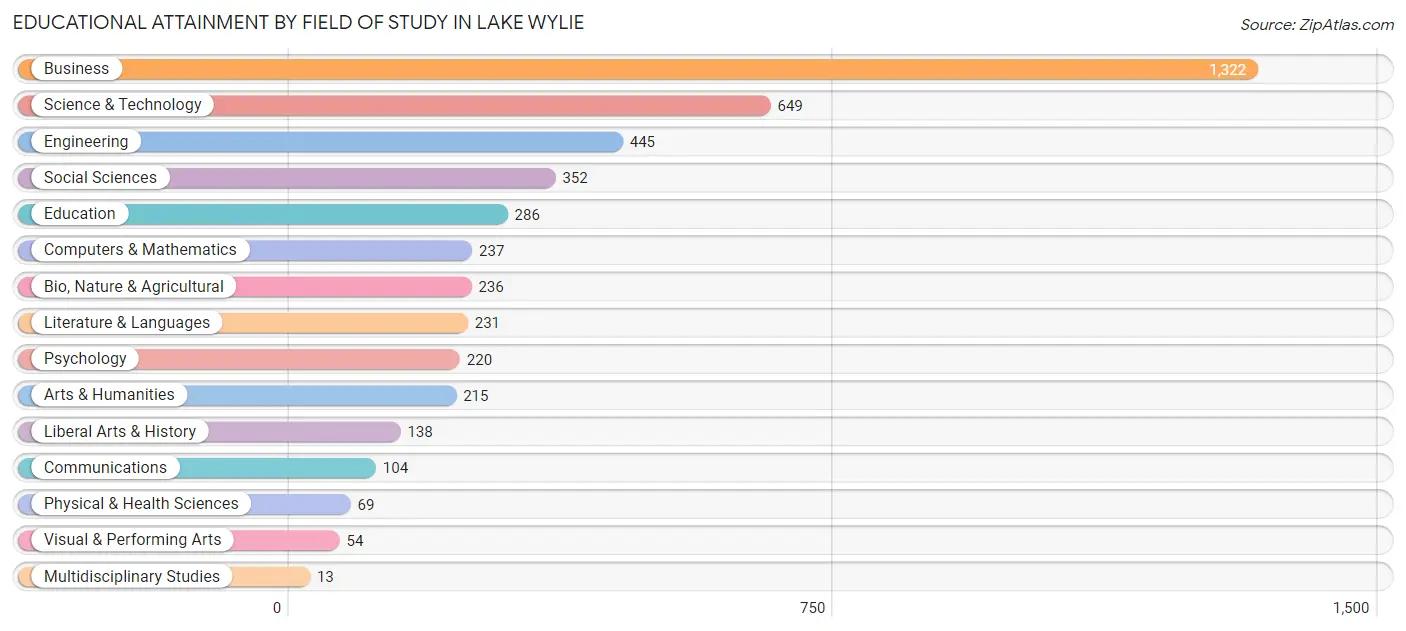
Educational Attainment by Field of Study in Lake Wylie
Business (1,322 | 28.9%), science & technology (649 | 14.2%), engineering (445 | 9.7%), social sciences (352 | 7.7%), and education (286 | 6.3%) are the most common fields of study among 4,571 individuals in Lake Wylie who have obtained a bachelor's degree or higher.
| Field of Study | # Graduates | % Graduates |
| Computers & Mathematics | 237 | 5.2% |
| Bio, Nature & Agricultural | 236 | 5.2% |
| Physical & Health Sciences | 69 | 1.5% |
| Psychology | 220 | 4.8% |
| Social Sciences | 352 | 7.7% |
| Engineering | 445 | 9.7% |
| Multidisciplinary Studies | 13 | 0.3% |
| Science & Technology | 649 | 14.2% |
| Business | 1,322 | 28.9% |
| Education | 286 | 6.3% |
| Literature & Languages | 231 | 5.1% |
| Liberal Arts & History | 138 | 3.0% |
| Visual & Performing Arts | 54 | 1.2% |
| Communications | 104 | 2.3% |
| Arts & Humanities | 215 | 4.7% |
| Total | 4,571 | 100.0% |
Transportation & Commute in Lake Wylie
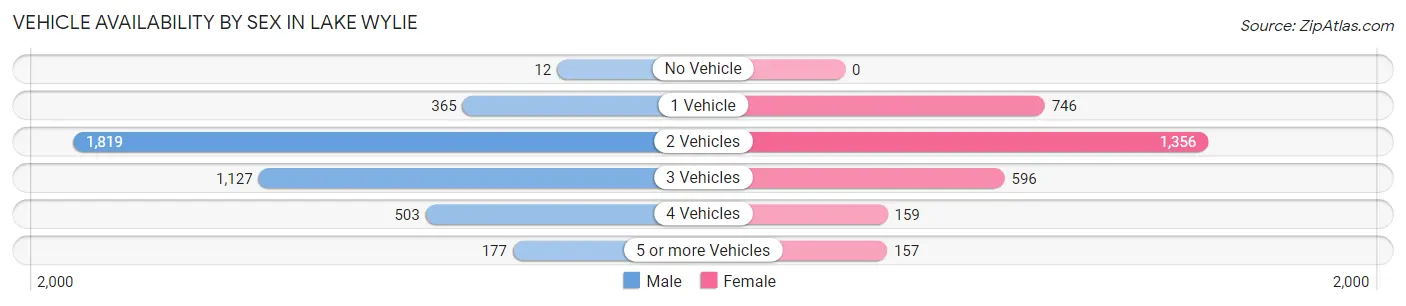
Vehicle Availability by Sex in Lake Wylie
The most prevalent vehicle ownership categories in Lake Wylie are males with 2 vehicles (1,819, accounting for 45.4%) and females with 2 vehicles (1,356, making up 60.4%).
| Vehicles Available | Male | Female |
| No Vehicle | 12 (0.3%) | 0 (0.0%) |
| 1 Vehicle | 365 (9.1%) | 746 (24.7%) |
| 2 Vehicles | 1,819 (45.4%) | 1,356 (45.0%) |
| 3 Vehicles | 1,127 (28.1%) | 596 (19.8%) |
| 4 Vehicles | 503 (12.6%) | 159 (5.3%) |
| 5 or more Vehicles | 177 (4.4%) | 157 (5.2%) |
| Total | 4,003 (100.0%) | 3,014 (100.0%) |
Commute Time in Lake Wylie
The most frequently occuring commute durations in Lake Wylie are 20 to 24 minutes (952 commuters, 16.7%), 45 to 59 minutes (927 commuters, 16.2%), and 30 to 34 minutes (804 commuters, 14.1%).
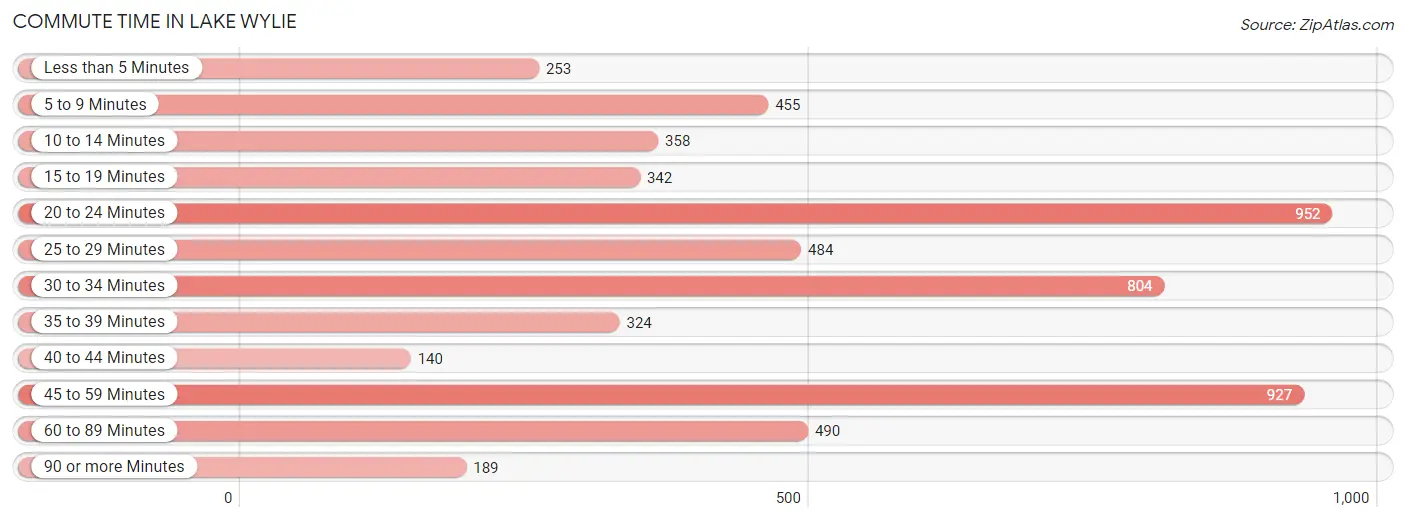
| Commute Time | # Commuters | % Commuters |
| Less than 5 Minutes | 253 | 4.4% |
| 5 to 9 Minutes | 455 | 8.0% |
| 10 to 14 Minutes | 358 | 6.3% |
| 15 to 19 Minutes | 342 | 6.0% |
| 20 to 24 Minutes | 952 | 16.7% |
| 25 to 29 Minutes | 484 | 8.5% |
| 30 to 34 Minutes | 804 | 14.1% |
| 35 to 39 Minutes | 324 | 5.7% |
| 40 to 44 Minutes | 140 | 2.5% |
| 45 to 59 Minutes | 927 | 16.2% |
| 60 to 89 Minutes | 490 | 8.6% |
| 90 or more Minutes | 189 | 3.3% |
Commute Time by Sex in Lake Wylie
The most common commute times in Lake Wylie are 20 to 24 minutes (617 commuters, 19.1%) for males and 45 to 59 minutes (562 commuters, 22.6%) for females.
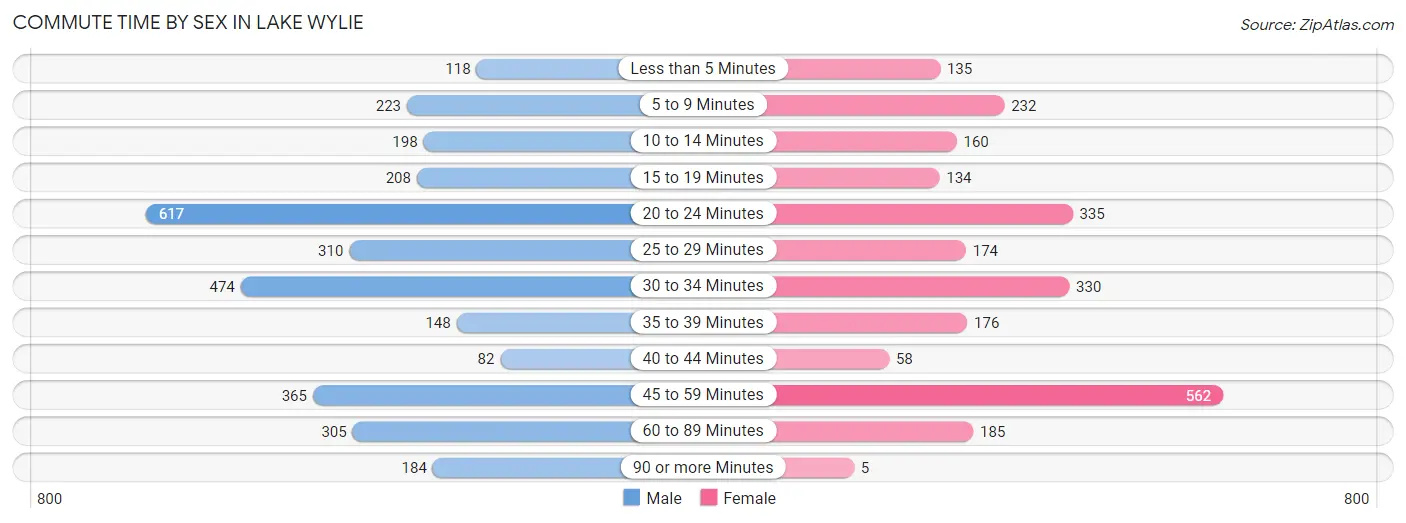
| Commute Time | Male | Female |
| Less than 5 Minutes | 118 (3.6%) | 135 (5.4%) |
| 5 to 9 Minutes | 223 (6.9%) | 232 (9.3%) |
| 10 to 14 Minutes | 198 (6.1%) | 160 (6.4%) |
| 15 to 19 Minutes | 208 (6.4%) | 134 (5.4%) |
| 20 to 24 Minutes | 617 (19.1%) | 335 (13.5%) |
| 25 to 29 Minutes | 310 (9.6%) | 174 (7.0%) |
| 30 to 34 Minutes | 474 (14.7%) | 330 (13.3%) |
| 35 to 39 Minutes | 148 (4.6%) | 176 (7.1%) |
| 40 to 44 Minutes | 82 (2.5%) | 58 (2.3%) |
| 45 to 59 Minutes | 365 (11.3%) | 562 (22.6%) |
| 60 to 89 Minutes | 305 (9.4%) | 185 (7.4%) |
| 90 or more Minutes | 184 (5.7%) | 5 (0.2%) |
Time of Departure to Work by Sex in Lake Wylie
The most frequent times of departure to work in Lake Wylie are 7:00 AM to 7:29 AM (524, 16.2%) for males and 7:00 AM to 7:29 AM (448, 18.0%) for females.
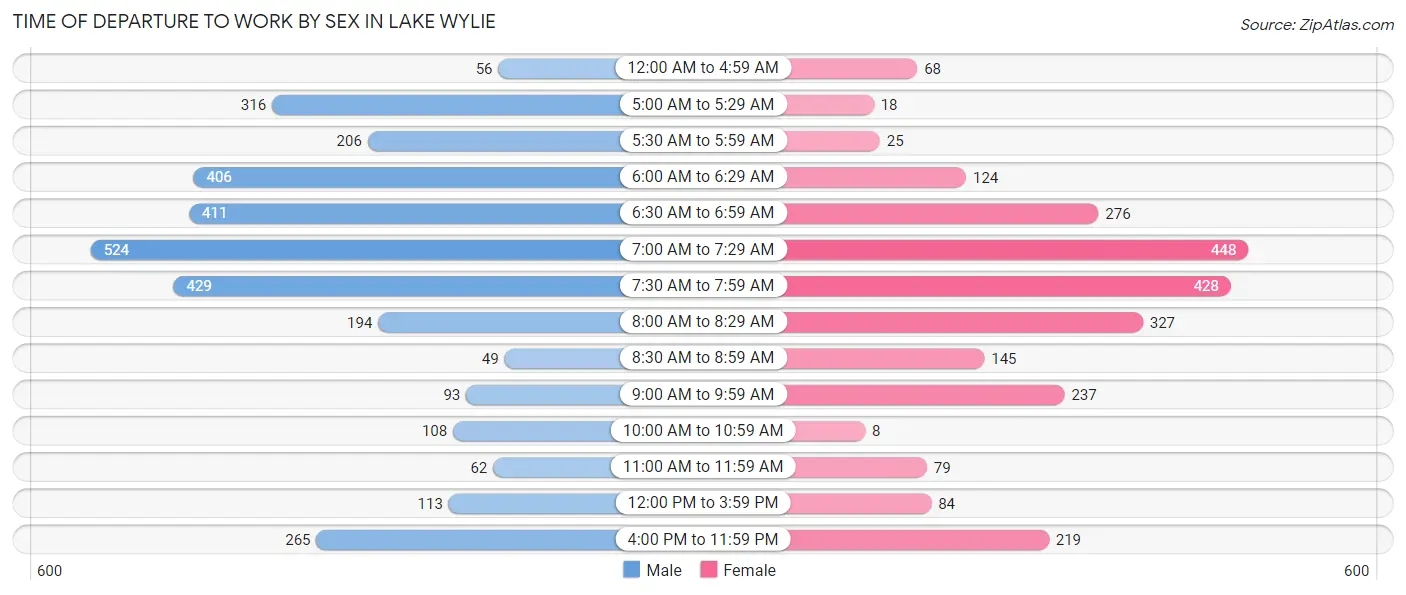
| Time of Departure | Male | Female |
| 12:00 AM to 4:59 AM | 56 (1.7%) | 68 (2.7%) |
| 5:00 AM to 5:29 AM | 316 (9.8%) | 18 (0.7%) |
| 5:30 AM to 5:59 AM | 206 (6.4%) | 25 (1.0%) |
| 6:00 AM to 6:29 AM | 406 (12.6%) | 124 (5.0%) |
| 6:30 AM to 6:59 AM | 411 (12.7%) | 276 (11.1%) |
| 7:00 AM to 7:29 AM | 524 (16.2%) | 448 (18.0%) |
| 7:30 AM to 7:59 AM | 429 (13.3%) | 428 (17.2%) |
| 8:00 AM to 8:29 AM | 194 (6.0%) | 327 (13.2%) |
| 8:30 AM to 8:59 AM | 49 (1.5%) | 145 (5.8%) |
| 9:00 AM to 9:59 AM | 93 (2.9%) | 237 (9.5%) |
| 10:00 AM to 10:59 AM | 108 (3.3%) | 8 (0.3%) |
| 11:00 AM to 11:59 AM | 62 (1.9%) | 79 (3.2%) |
| 12:00 PM to 3:59 PM | 113 (3.5%) | 84 (3.4%) |
| 4:00 PM to 11:59 PM | 265 (8.2%) | 219 (8.8%) |
| Total | 3,232 (100.0%) | 2,486 (100.0%) |
Housing Occupancy in Lake Wylie
Occupancy by Ownership in Lake Wylie
Of the total 5,280 dwellings in Lake Wylie, owner-occupied units account for 4,095 (77.6%), while renter-occupied units make up 1,185 (22.4%).
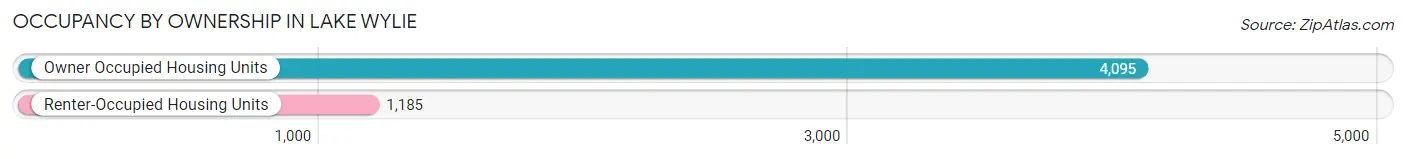
| Occupancy | # Housing Units | % Housing Units |
| Owner Occupied Housing Units | 4,095 | 77.6% |
| Renter-Occupied Housing Units | 1,185 | 22.4% |
| Total Occupied Housing Units | 5,280 | 100.0% |
Occupancy by Household Size in Lake Wylie
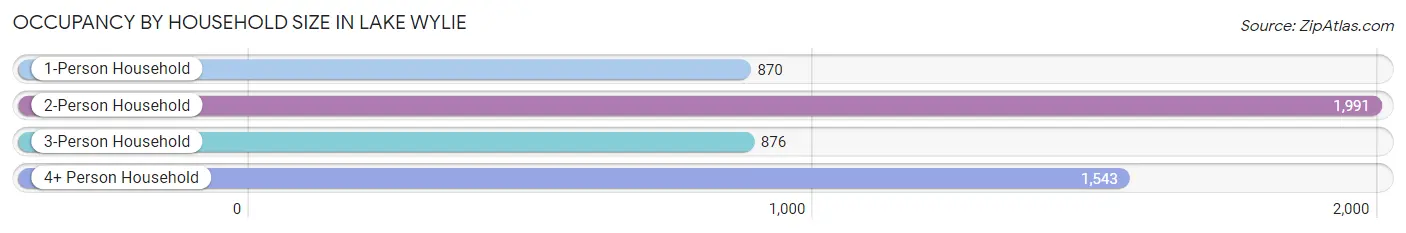
| Household Size | # Housing Units | % Housing Units |
| 1-Person Household | 870 | 16.5% |
| 2-Person Household | 1,991 | 37.7% |
| 3-Person Household | 876 | 16.6% |
| 4+ Person Household | 1,543 | 29.2% |
| Total Housing Units | 5,280 | 100.0% |
Occupancy by Ownership by Household Size in Lake Wylie
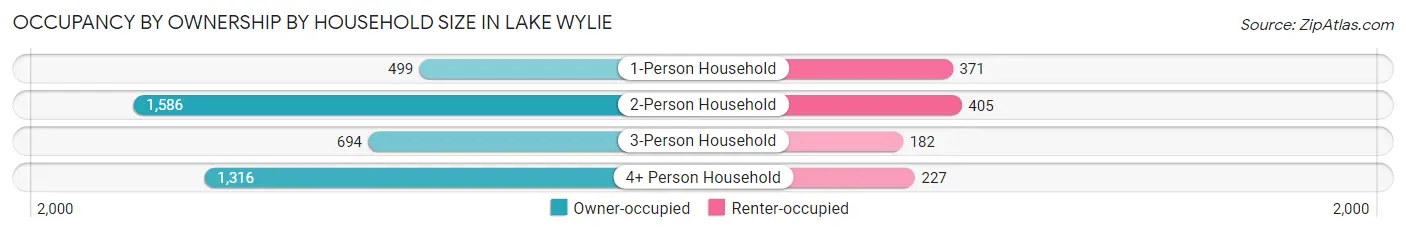
| Household Size | Owner-occupied | Renter-occupied |
| 1-Person Household | 499 (57.4%) | 371 (42.6%) |
| 2-Person Household | 1,586 (79.7%) | 405 (20.3%) |
| 3-Person Household | 694 (79.2%) | 182 (20.8%) |
| 4+ Person Household | 1,316 (85.3%) | 227 (14.7%) |
| Total Housing Units | 4,095 (77.6%) | 1,185 (22.4%) |
Occupancy by Educational Attainment in Lake Wylie
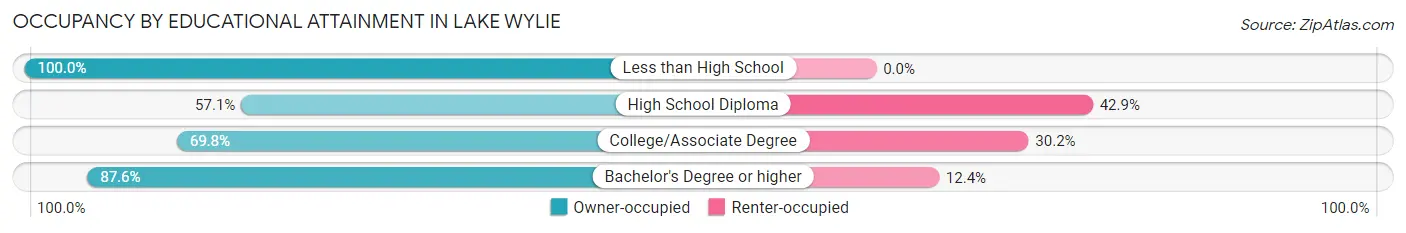
| Household Size | Owner-occupied | Renter-occupied |
| Less than High School | 95 (100.0%) | 0 (0.0%) |
| High School Diploma | 291 (57.1%) | 219 (42.9%) |
| College/Associate Degree | 1,513 (69.8%) | 654 (30.2%) |
| Bachelor's Degree or higher | 2,196 (87.6%) | 312 (12.4%) |
Occupancy by Age of Householder in Lake Wylie
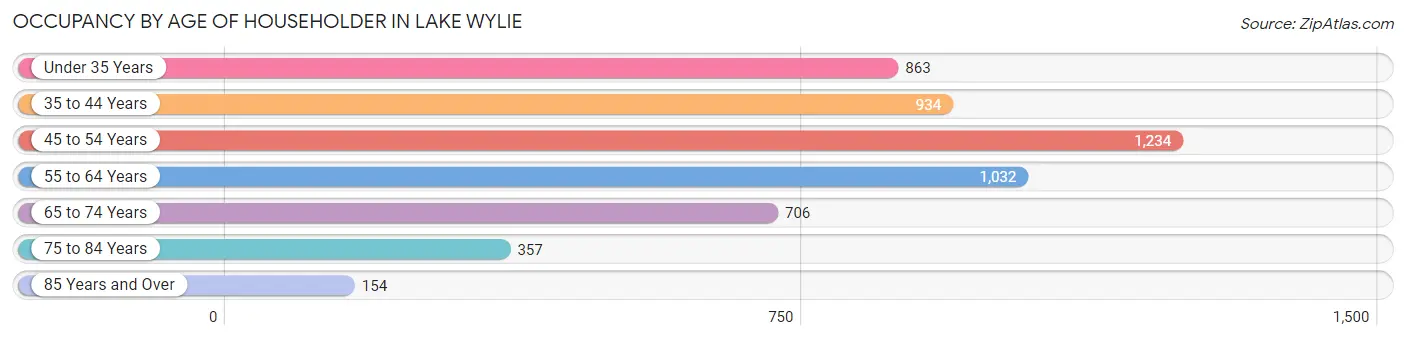
| Age Bracket | # Households | % Households |
| Under 35 Years | 863 | 16.3% |
| 35 to 44 Years | 934 | 17.7% |
| 45 to 54 Years | 1,234 | 23.4% |
| 55 to 64 Years | 1,032 | 19.6% |
| 65 to 74 Years | 706 | 13.4% |
| 75 to 84 Years | 357 | 6.8% |
| 85 Years and Over | 154 | 2.9% |
| Total | 5,280 | 100.0% |
Housing Finances in Lake Wylie
Median Income by Occupancy in Lake Wylie
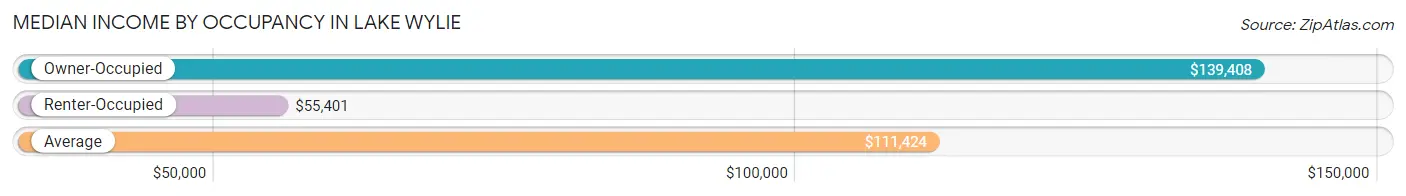
| Occupancy Type | # Households | Median Income |
| Owner-Occupied | 4,095 (77.6%) | $139,408 |
| Renter-Occupied | 1,185 (22.4%) | $55,401 |
| Average | 5,280 (100.0%) | $111,424 |
Occupancy by Householder Income Bracket in Lake Wylie
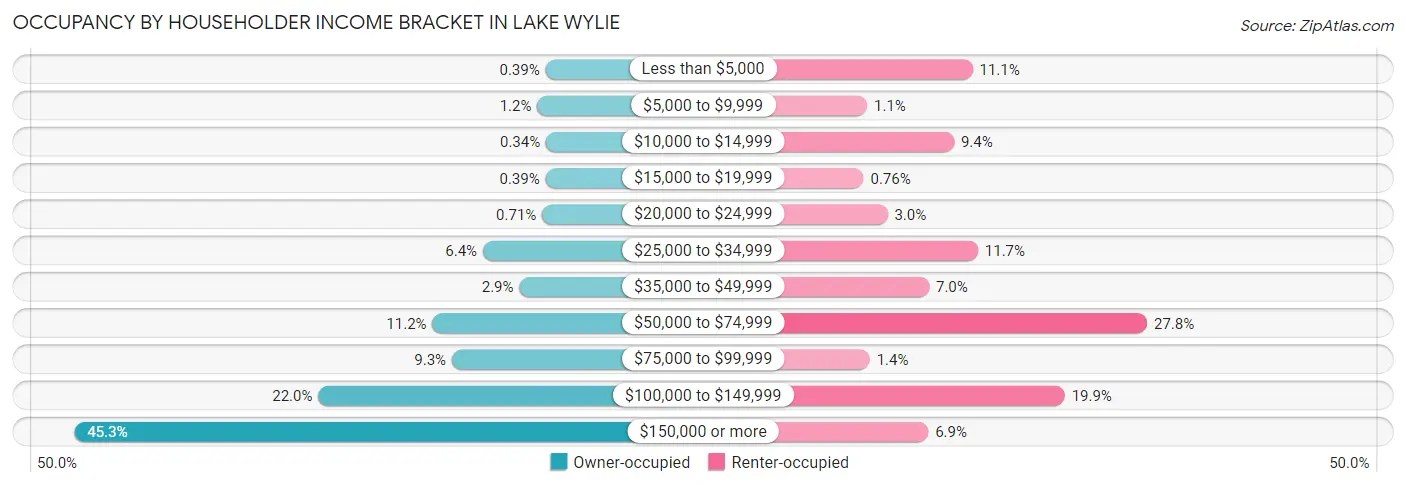
| Income Bracket | Owner-occupied | Renter-occupied |
| Less than $5,000 | 16 (0.4%) | 132 (11.1%) |
| $5,000 to $9,999 | 48 (1.2%) | 13 (1.1%) |
| $10,000 to $14,999 | 14 (0.3%) | 111 (9.4%) |
| $15,000 to $19,999 | 16 (0.4%) | 9 (0.8%) |
| $20,000 to $24,999 | 29 (0.7%) | 36 (3.0%) |
| $25,000 to $34,999 | 260 (6.4%) | 138 (11.7%) |
| $35,000 to $49,999 | 118 (2.9%) | 83 (7.0%) |
| $50,000 to $74,999 | 457 (11.2%) | 329 (27.8%) |
| $75,000 to $99,999 | 381 (9.3%) | 16 (1.3%) |
| $100,000 to $149,999 | 902 (22.0%) | 236 (19.9%) |
| $150,000 or more | 1,854 (45.3%) | 82 (6.9%) |
| Total | 4,095 (100.0%) | 1,185 (100.0%) |
Monthly Housing Cost Tiers in Lake Wylie
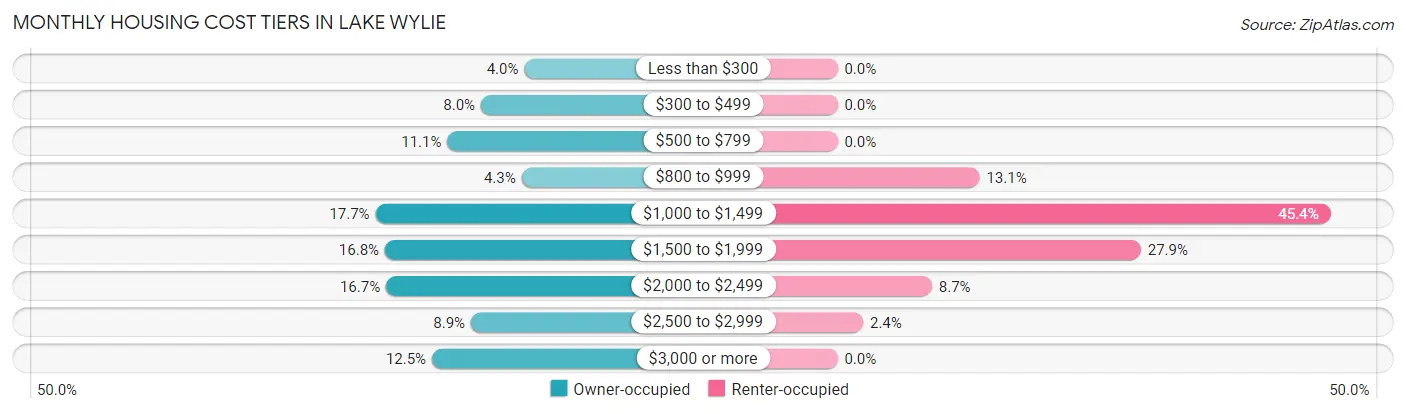
| Monthly Cost | Owner-occupied | Renter-occupied |
| Less than $300 | 164 (4.0%) | 0 (0.0%) |
| $300 to $499 | 327 (8.0%) | 0 (0.0%) |
| $500 to $799 | 454 (11.1%) | 0 (0.0%) |
| $800 to $999 | 174 (4.3%) | 155 (13.1%) |
| $1,000 to $1,499 | 725 (17.7%) | 538 (45.4%) |
| $1,500 to $1,999 | 689 (16.8%) | 331 (27.9%) |
| $2,000 to $2,499 | 685 (16.7%) | 103 (8.7%) |
| $2,500 to $2,999 | 365 (8.9%) | 28 (2.4%) |
| $3,000 or more | 512 (12.5%) | 0 (0.0%) |
| Total | 4,095 (100.0%) | 1,185 (100.0%) |
Physical Housing Characteristics in Lake Wylie
Housing Structures in Lake Wylie
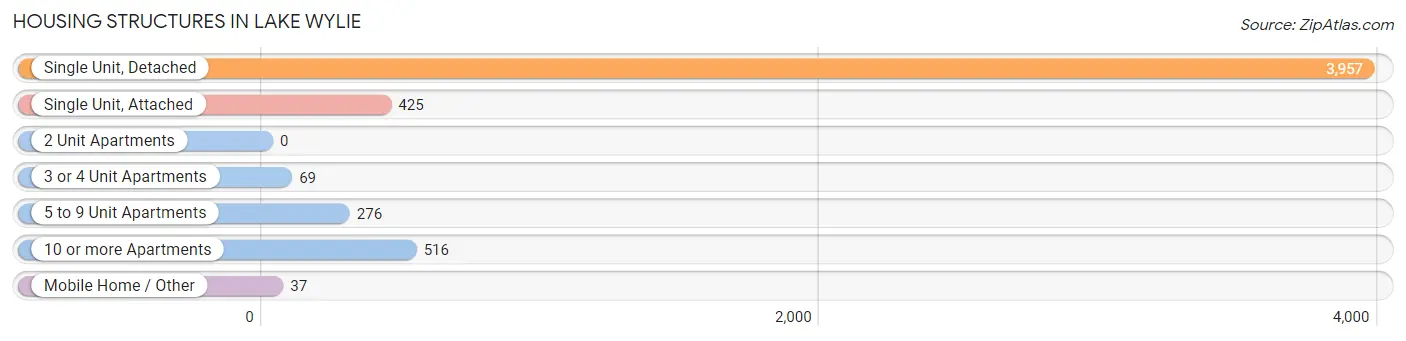
| Structure Type | # Housing Units | % Housing Units |
| Single Unit, Detached | 3,957 | 74.9% |
| Single Unit, Attached | 425 | 8.1% |
| 2 Unit Apartments | 0 | 0.0% |
| 3 or 4 Unit Apartments | 69 | 1.3% |
| 5 to 9 Unit Apartments | 276 | 5.2% |
| 10 or more Apartments | 516 | 9.8% |
| Mobile Home / Other | 37 | 0.7% |
| Total | 5,280 | 100.0% |
Housing Structures by Occupancy in Lake Wylie
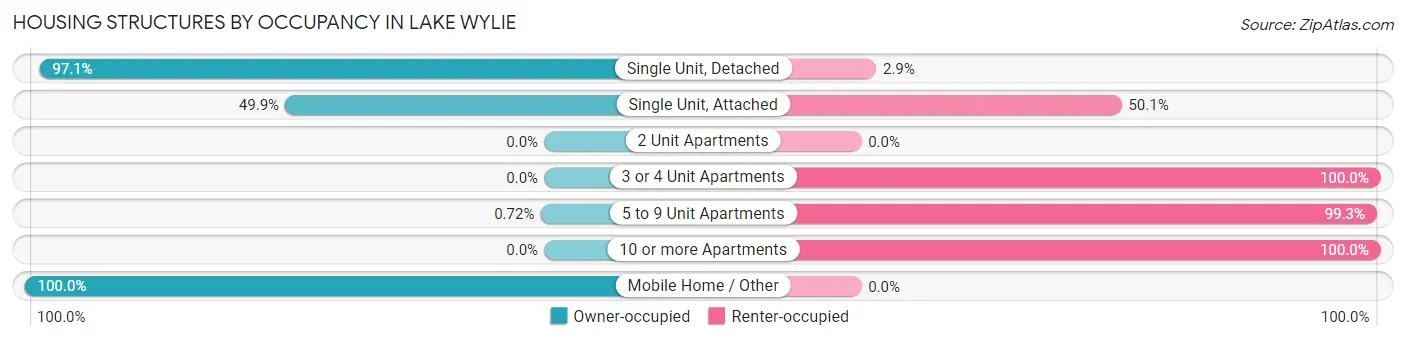
| Structure Type | Owner-occupied | Renter-occupied |
| Single Unit, Detached | 3,844 (97.1%) | 113 (2.9%) |
| Single Unit, Attached | 212 (49.9%) | 213 (50.1%) |
| 2 Unit Apartments | 0 (0.0%) | 0 (0.0%) |
| 3 or 4 Unit Apartments | 0 (0.0%) | 69 (100.0%) |
| 5 to 9 Unit Apartments | 2 (0.7%) | 274 (99.3%) |
| 10 or more Apartments | 0 (0.0%) | 516 (100.0%) |
| Mobile Home / Other | 37 (100.0%) | 0 (0.0%) |
| Total | 4,095 (77.6%) | 1,185 (22.4%) |
Housing Structures by Number of Rooms in Lake Wylie
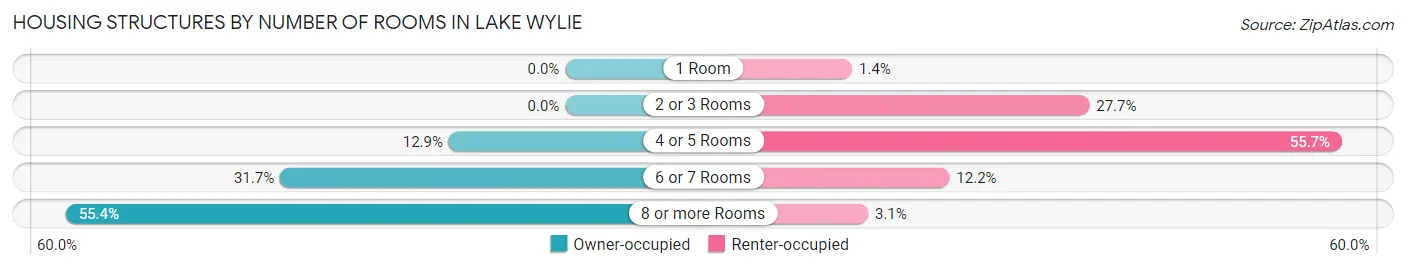
| Number of Rooms | Owner-occupied | Renter-occupied |
| 1 Room | 0 (0.0%) | 16 (1.3%) |
| 2 or 3 Rooms | 0 (0.0%) | 328 (27.7%) |
| 4 or 5 Rooms | 529 (12.9%) | 660 (55.7%) |
| 6 or 7 Rooms | 1,296 (31.7%) | 144 (12.1%) |
| 8 or more Rooms | 2,270 (55.4%) | 37 (3.1%) |
| Total | 4,095 (100.0%) | 1,185 (100.0%) |
Housing Structure by Heating Type in Lake Wylie
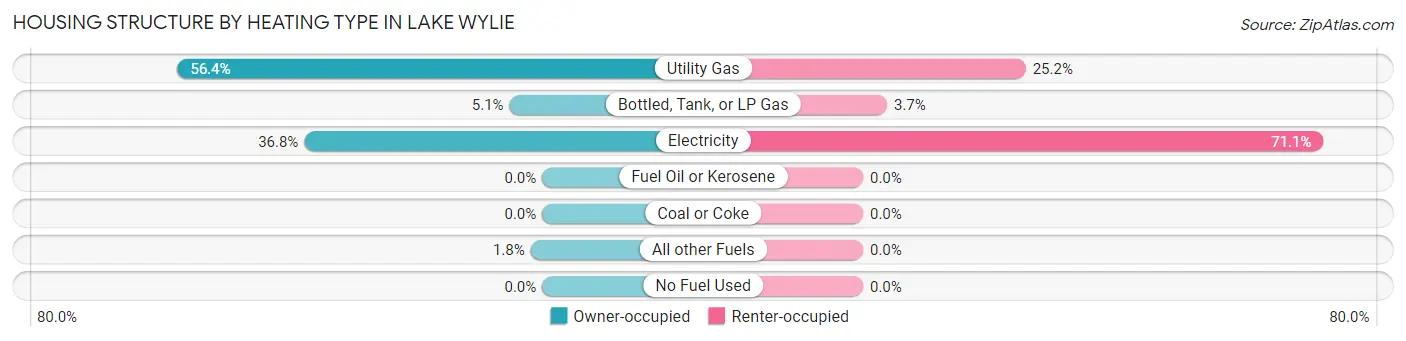
| Heating Type | Owner-occupied | Renter-occupied |
| Utility Gas | 2,309 (56.4%) | 298 (25.2%) |
| Bottled, Tank, or LP Gas | 207 (5.1%) | 44 (3.7%) |
| Electricity | 1,506 (36.8%) | 843 (71.1%) |
| Fuel Oil or Kerosene | 0 (0.0%) | 0 (0.0%) |
| Coal or Coke | 0 (0.0%) | 0 (0.0%) |
| All other Fuels | 73 (1.8%) | 0 (0.0%) |
| No Fuel Used | 0 (0.0%) | 0 (0.0%) |
| Total | 4,095 (100.0%) | 1,185 (100.0%) |
Household Vehicle Usage in Lake Wylie
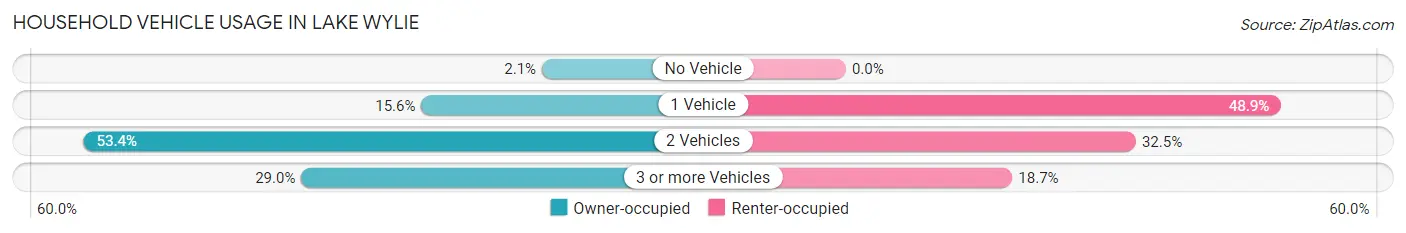
| Vehicles per Household | Owner-occupied | Renter-occupied |
| No Vehicle | 84 (2.1%) | 0 (0.0%) |
| 1 Vehicle | 637 (15.6%) | 579 (48.9%) |
| 2 Vehicles | 2,186 (53.4%) | 385 (32.5%) |
| 3 or more Vehicles | 1,188 (29.0%) | 221 (18.6%) |
| Total | 4,095 (100.0%) | 1,185 (100.0%) |
Real Estate & Mortgages in Lake Wylie
Real Estate and Mortgage Overview in Lake Wylie
| Characteristic | Without Mortgage | With Mortgage |
| Housing Units | 951 | 3,144 |
| Median Property Value | $371,800 | $440,000 |
| Median Household Income | $103,352 | $1,518 |
| Monthly Housing Costs | $493 | $512 |
| Real Estate Taxes | $1,466 | $72 |
Property Value by Mortgage Status in Lake Wylie
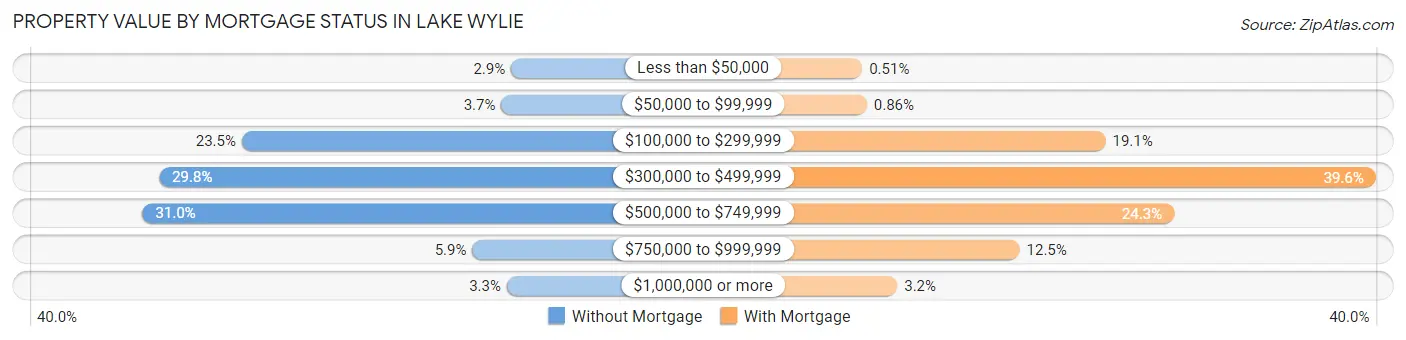
| Property Value | Without Mortgage | With Mortgage |
| Less than $50,000 | 28 (2.9%) | 16 (0.5%) |
| $50,000 to $99,999 | 35 (3.7%) | 27 (0.9%) |
| $100,000 to $299,999 | 223 (23.4%) | 599 (19.1%) |
| $300,000 to $499,999 | 283 (29.8%) | 1,246 (39.6%) |
| $500,000 to $749,999 | 295 (31.0%) | 763 (24.3%) |
| $750,000 to $999,999 | 56 (5.9%) | 393 (12.5%) |
| $1,000,000 or more | 31 (3.3%) | 100 (3.2%) |
| Total | 951 (100.0%) | 3,144 (100.0%) |
Household Income by Mortgage Status in Lake Wylie
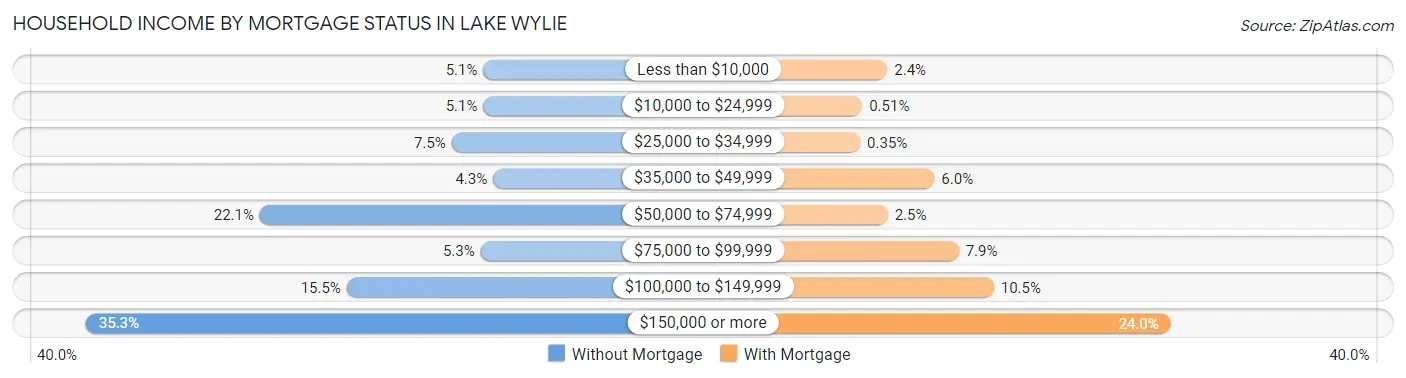
| Household Income | Without Mortgage | With Mortgage |
| Less than $10,000 | 48 (5.1%) | 76 (2.4%) |
| $10,000 to $24,999 | 48 (5.1%) | 16 (0.5%) |
| $25,000 to $34,999 | 71 (7.5%) | 11 (0.4%) |
| $35,000 to $49,999 | 41 (4.3%) | 189 (6.0%) |
| $50,000 to $74,999 | 210 (22.1%) | 77 (2.5%) |
| $75,000 to $99,999 | 50 (5.3%) | 247 (7.9%) |
| $100,000 to $149,999 | 147 (15.5%) | 331 (10.5%) |
| $150,000 or more | 336 (35.3%) | 755 (24.0%) |
| Total | 951 (100.0%) | 3,144 (100.0%) |
Property Value to Household Income Ratio in Lake Wylie
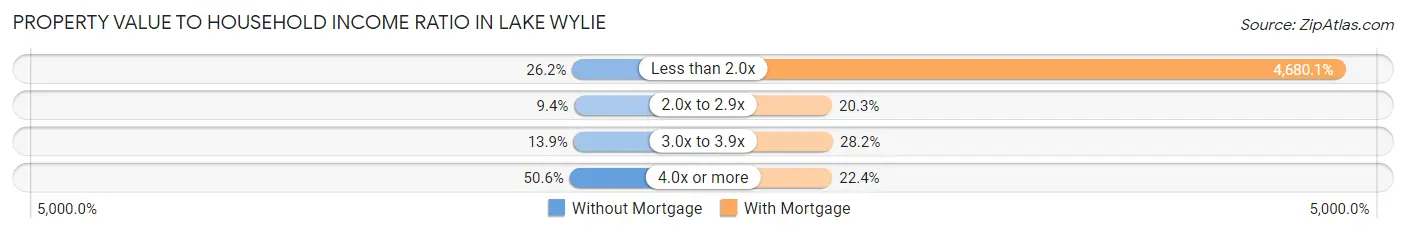
| Value-to-Income Ratio | Without Mortgage | With Mortgage |
| Less than 2.0x | 249 (26.2%) | 147,143 (4,680.1%) |
| 2.0x to 2.9x | 89 (9.4%) | 637 (20.3%) |
| 3.0x to 3.9x | 132 (13.9%) | 885 (28.1%) |
| 4.0x or more | 481 (50.6%) | 703 (22.4%) |
| Total | 951 (100.0%) | 3,144 (100.0%) |
Real Estate Taxes by Mortgage Status in Lake Wylie
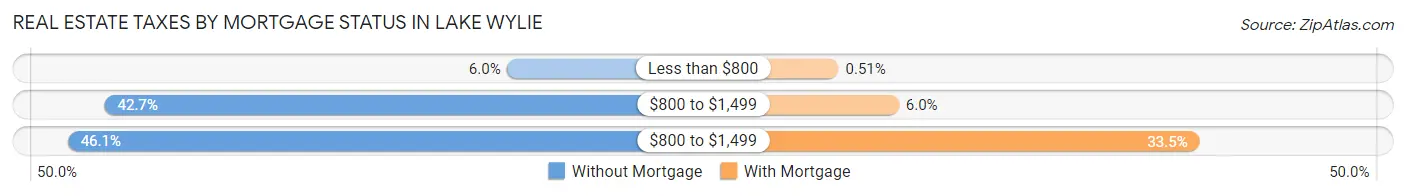
| Property Taxes | Without Mortgage | With Mortgage |
| Less than $800 | 57 (6.0%) | 16 (0.5%) |
| $800 to $1,499 | 406 (42.7%) | 189 (6.0%) |
| $800 to $1,499 | 438 (46.1%) | 1,052 (33.5%) |
| Total | 951 (100.0%) | 3,144 (100.0%) |
Health & Disability in Lake Wylie
Health Insurance Coverage by Age in Lake Wylie
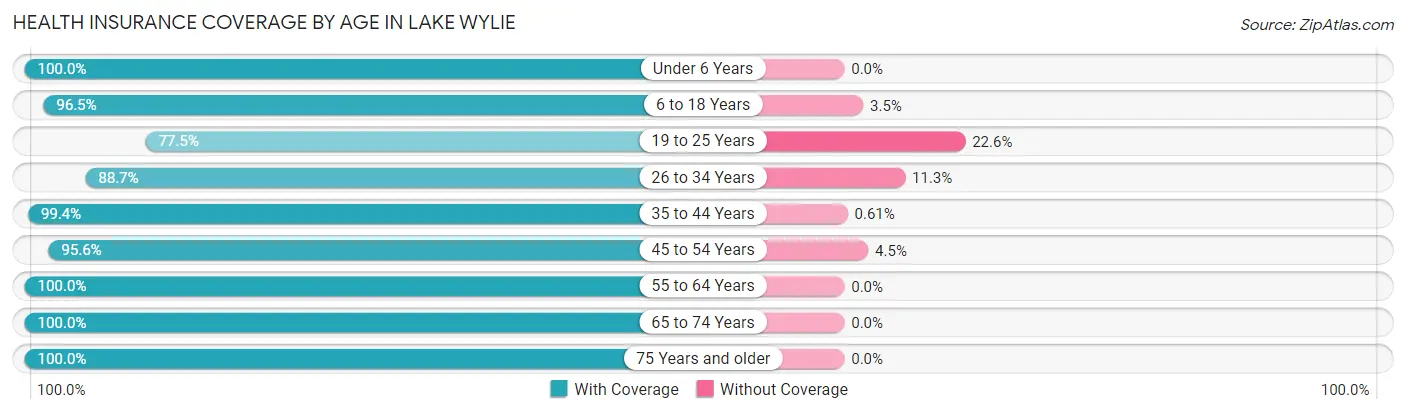
| Age Bracket | With Coverage | Without Coverage |
| Under 6 Years | 1,251 (100.0%) | 0 (0.0%) |
| 6 to 18 Years | 2,747 (96.5%) | 100 (3.5%) |
| 19 to 25 Years | 910 (77.4%) | 265 (22.6%) |
| 26 to 34 Years | 1,353 (88.7%) | 173 (11.3%) |
| 35 to 44 Years | 1,638 (99.4%) | 10 (0.6%) |
| 45 to 54 Years | 2,083 (95.6%) | 97 (4.4%) |
| 55 to 64 Years | 1,694 (100.0%) | 0 (0.0%) |
| 65 to 74 Years | 1,286 (100.0%) | 0 (0.0%) |
| 75 Years and older | 775 (100.0%) | 0 (0.0%) |
| Total | 13,737 (95.5%) | 645 (4.5%) |
Health Insurance Coverage by Citizenship Status in Lake Wylie
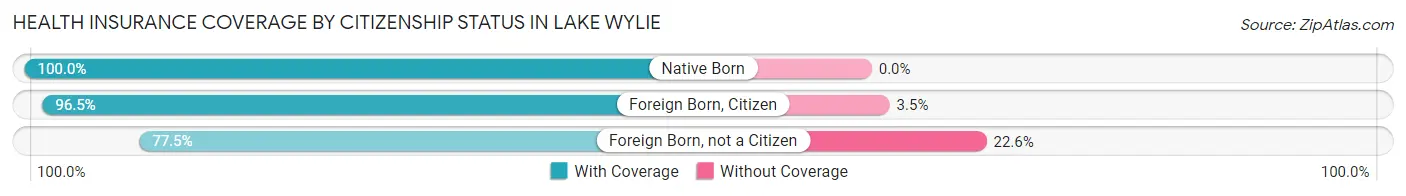
| Citizenship Status | With Coverage | Without Coverage |
| Native Born | 1,251 (100.0%) | 0 (0.0%) |
| Foreign Born, Citizen | 2,747 (96.5%) | 100 (3.5%) |
| Foreign Born, not a Citizen | 910 (77.4%) | 265 (22.6%) |
Health Insurance Coverage by Household Income in Lake Wylie
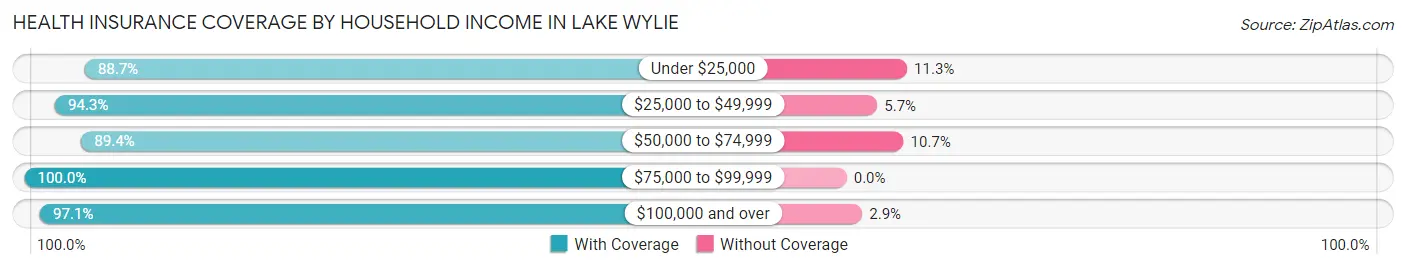
| Household Income | With Coverage | Without Coverage |
| Under $25,000 | 949 (88.7%) | 121 (11.3%) |
| $25,000 to $49,999 | 956 (94.3%) | 58 (5.7%) |
| $50,000 to $74,999 | 1,585 (89.3%) | 189 (10.6%) |
| $75,000 to $99,999 | 1,044 (100.0%) | 0 (0.0%) |
| $100,000 and over | 9,203 (97.1%) | 277 (2.9%) |
Public vs Private Health Insurance Coverage by Age in Lake Wylie
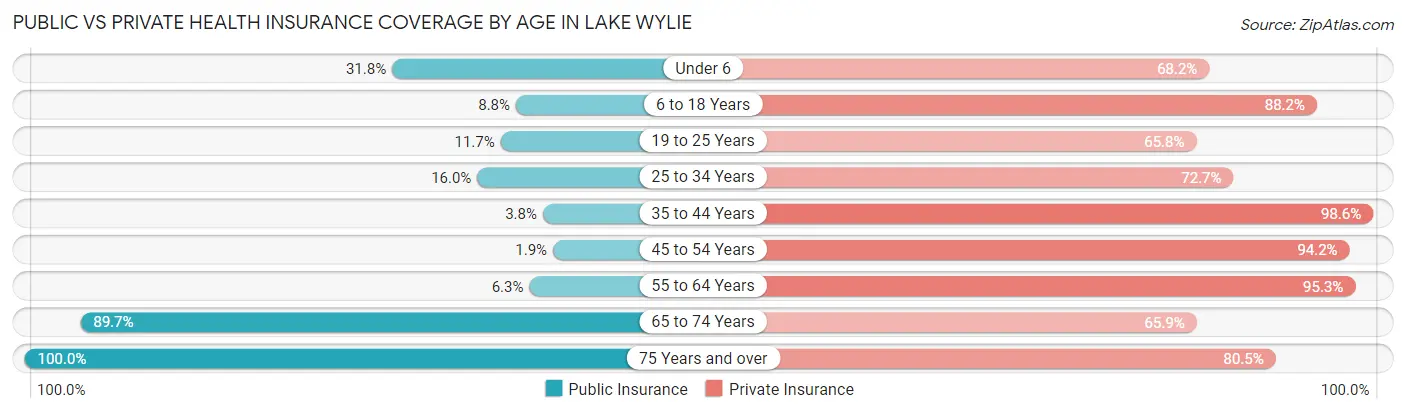
| Age Bracket | Public Insurance | Private Insurance |
| Under 6 | 398 (31.8%) | 853 (68.2%) |
| 6 to 18 Years | 251 (8.8%) | 2,510 (88.2%) |
| 19 to 25 Years | 137 (11.7%) | 773 (65.8%) |
| 25 to 34 Years | 244 (16.0%) | 1,109 (72.7%) |
| 35 to 44 Years | 63 (3.8%) | 1,625 (98.6%) |
| 45 to 54 Years | 42 (1.9%) | 2,054 (94.2%) |
| 55 to 64 Years | 107 (6.3%) | 1,614 (95.3%) |
| 65 to 74 Years | 1,153 (89.7%) | 847 (65.9%) |
| 75 Years and over | 775 (100.0%) | 624 (80.5%) |
| Total | 3,170 (22.0%) | 12,009 (83.5%) |
Disability Status by Sex by Age in Lake Wylie
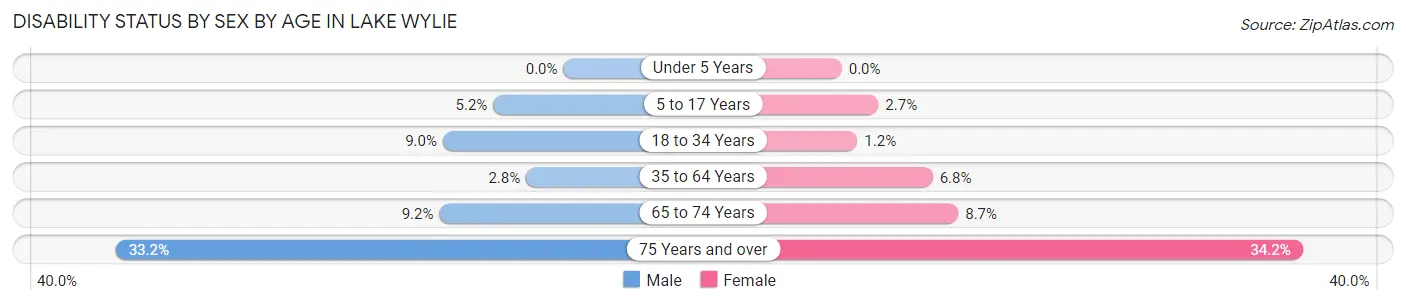
| Age Bracket | Male | Female |
| Under 5 Years | 0 (0.0%) | 0 (0.0%) |
| 5 to 17 Years | 79 (5.2%) | 38 (2.7%) |
| 18 to 34 Years | 130 (8.9%) | 16 (1.2%) |
| 35 to 64 Years | 75 (2.8%) | 190 (6.8%) |
| 65 to 74 Years | 61 (9.2%) | 54 (8.6%) |
| 75 Years and over | 105 (33.2%) | 157 (34.2%) |
Disability Class by Sex by Age in Lake Wylie
Disability Class: Hearing Difficulty
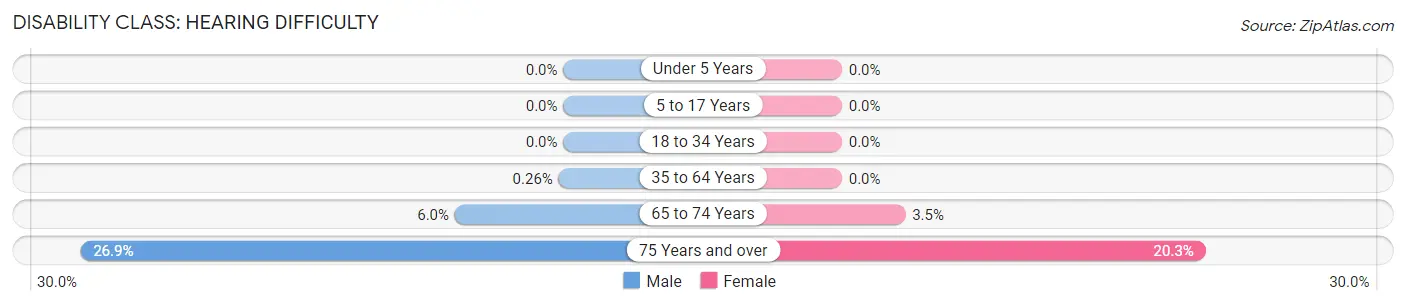
| Age Bracket | Male | Female |
| Under 5 Years | 0 (0.0%) | 0 (0.0%) |
| 5 to 17 Years | 0 (0.0%) | 0 (0.0%) |
| 18 to 34 Years | 0 (0.0%) | 0 (0.0%) |
| 35 to 64 Years | 7 (0.3%) | 0 (0.0%) |
| 65 to 74 Years | 40 (6.0%) | 22 (3.5%) |
| 75 Years and over | 85 (26.9%) | 93 (20.3%) |
Disability Class: Vision Difficulty
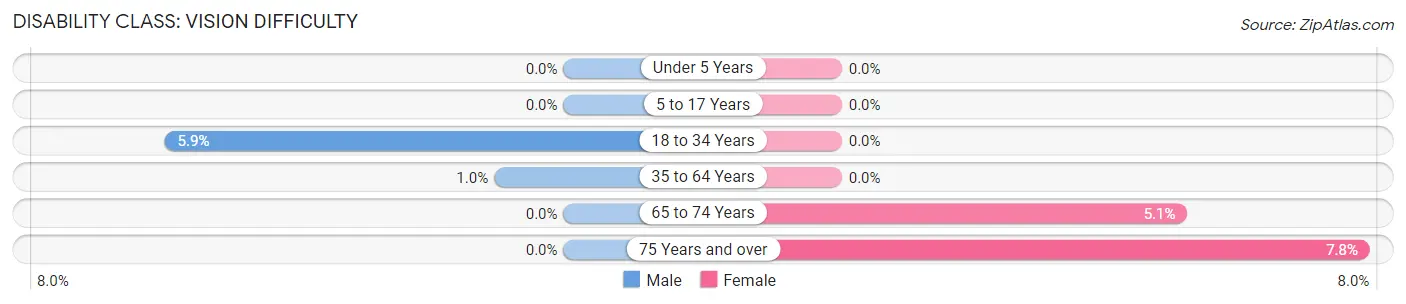
| Age Bracket | Male | Female |
| Under 5 Years | 0 (0.0%) | 0 (0.0%) |
| 5 to 17 Years | 0 (0.0%) | 0 (0.0%) |
| 18 to 34 Years | 86 (5.9%) | 0 (0.0%) |
| 35 to 64 Years | 28 (1.0%) | 0 (0.0%) |
| 65 to 74 Years | 0 (0.0%) | 32 (5.1%) |
| 75 Years and over | 0 (0.0%) | 36 (7.8%) |
Disability Class: Cognitive Difficulty
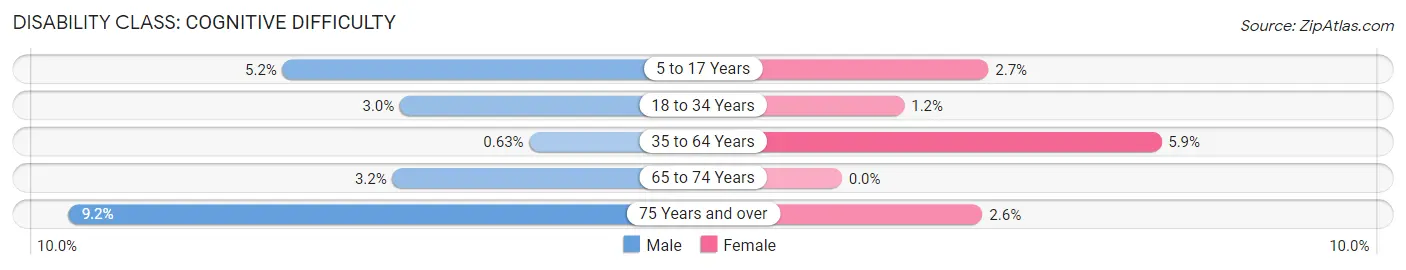
| Age Bracket | Male | Female |
| 5 to 17 Years | 79 (5.2%) | 38 (2.7%) |
| 18 to 34 Years | 44 (3.0%) | 16 (1.2%) |
| 35 to 64 Years | 17 (0.6%) | 167 (5.9%) |
| 65 to 74 Years | 21 (3.2%) | 0 (0.0%) |
| 75 Years and over | 29 (9.2%) | 12 (2.6%) |
Disability Class: Ambulatory Difficulty
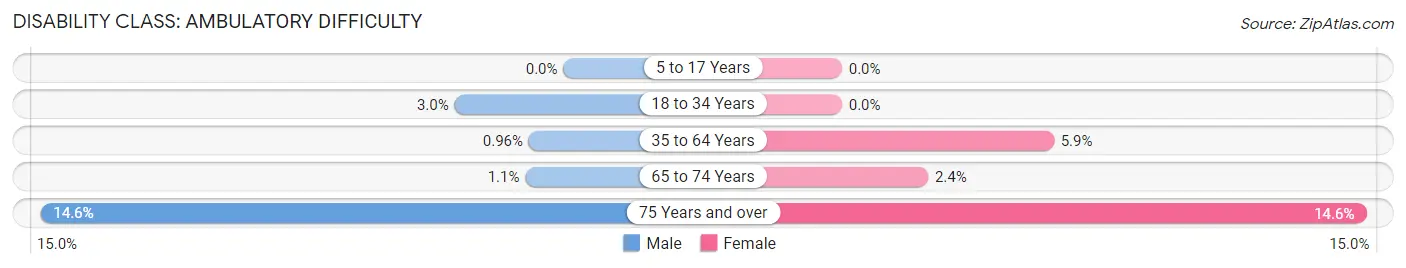
| Age Bracket | Male | Female |
| 5 to 17 Years | 0 (0.0%) | 0 (0.0%) |
| 18 to 34 Years | 44 (3.0%) | 0 (0.0%) |
| 35 to 64 Years | 26 (1.0%) | 166 (5.9%) |
| 65 to 74 Years | 7 (1.1%) | 15 (2.4%) |
| 75 Years and over | 46 (14.6%) | 67 (14.6%) |
Disability Class: Self-Care Difficulty
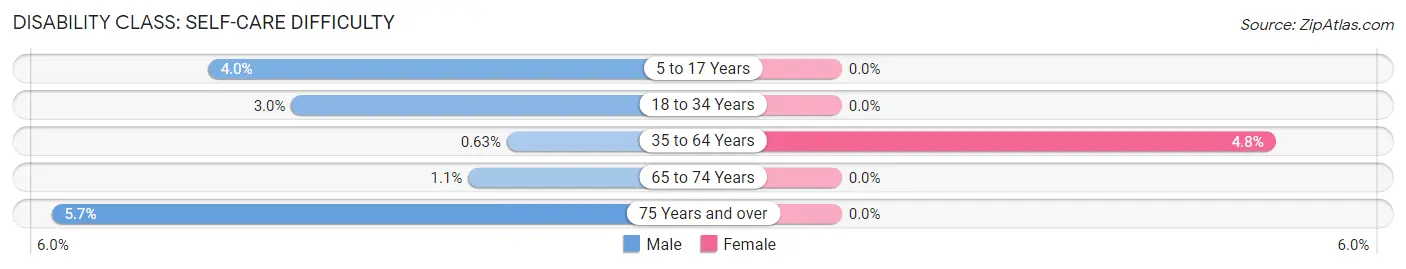
| Age Bracket | Male | Female |
| 5 to 17 Years | 60 (4.0%) | 0 (0.0%) |
| 18 to 34 Years | 44 (3.0%) | 0 (0.0%) |
| 35 to 64 Years | 17 (0.6%) | 136 (4.8%) |
| 65 to 74 Years | 7 (1.1%) | 0 (0.0%) |
| 75 Years and over | 18 (5.7%) | 0 (0.0%) |
Technology Access in Lake Wylie
Computing Device Access in Lake Wylie
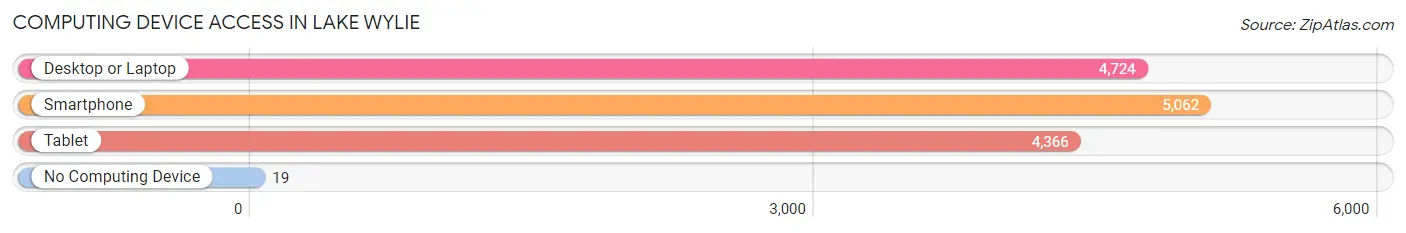
| Device Type | # Households | % Households |
| Desktop or Laptop | 4,724 | 89.5% |
| Smartphone | 5,062 | 95.9% |
| Tablet | 4,366 | 82.7% |
| No Computing Device | 19 | 0.4% |
| Total | 5,280 | 100.0% |
Internet Access in Lake Wylie
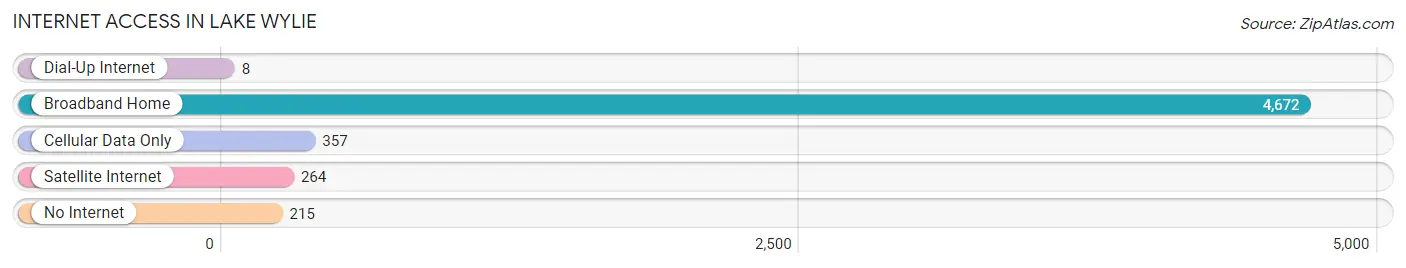
| Internet Type | # Households | % Households |
| Dial-Up Internet | 8 | 0.2% |
| Broadband Home | 4,672 | 88.5% |
| Cellular Data Only | 357 | 6.8% |
| Satellite Internet | 264 | 5.0% |
| No Internet | 215 | 4.1% |
| Total | 5,280 | 100.0% |
Lake Wylie Summary
Lake Wylie is a small town located in York County, South Carolina, United States. It is situated on the banks of Lake Wylie, a 12,455-acre lake that is part of the Catawba River chain of lakes. The town is located approximately 20 miles southwest of Charlotte, North Carolina, and is part of the Charlotte metropolitan area.
History
The area around Lake Wylie has been inhabited for thousands of years. The Catawba Indians were the first known inhabitants of the area, and they lived in the area until the early 19th century. The first European settlers arrived in the area in the late 1700s, and the town of Lake Wylie was officially established in 1891.
The town was named after Dr. Wylie, a local doctor who owned a large tract of land in the area. The town grew slowly over the years, and by the mid-20th century, it had become a popular summer destination for vacationers from nearby Charlotte.
Geography
Lake Wylie is located in York County, South Carolina, approximately 20 miles southwest of Charlotte, North Carolina. The town is situated on the banks of Lake Wylie, a 12,455-acre lake that is part of the Catawba River chain of lakes. The lake is fed by the Catawba River and is bordered by the states of North Carolina and South Carolina.
The town of Lake Wylie is located in a rural area, and the surrounding landscape is mostly wooded. The town is located at an elevation of approximately 600 feet above sea level.
Economy
The economy of Lake Wylie is largely based on tourism and recreation. The town is a popular destination for vacationers from nearby Charlotte, and the lake is a popular spot for fishing, boating, and other water activities.
The town is also home to several businesses, including restaurants, retail stores, and marinas. The town is also home to a number of manufacturing companies, including a paper mill and a plastics factory.
Demographics
As of the 2010 census, the population of Lake Wylie was 5,092. The racial makeup of the town was 94.3% White, 2.2% African American, 0.3% Native American, 0.7% Asian, 0.1% Pacific Islander, and 2.4% from other races. The median household income was $50,945, and the median family income was $60,945.
Conclusion
Lake Wylie is a small town located in York County, South Carolina, United States. It is situated on the banks of Lake Wylie, a 12,455-acre lake that is part of the Catawba River chain of lakes. The town is located approximately 20 miles southwest of Charlotte, North Carolina, and is part of the Charlotte metropolitan area. The town has a long history, and its economy is largely based on tourism and recreation. The population of Lake Wylie was 5,092 as of the 2010 census, and the median household income was $50,945.
Common Questions
What is the Total Population of Lake Wylie?
Total Population of Lake Wylie is 14,382.
What is the Total Male Population of Lake Wylie?
Total Male Population of Lake Wylie is 7,146.
What is the Total Female Population of Lake Wylie?
Total Female Population of Lake Wylie is 7,236.
What is the Ratio of Males per 100 Females in Lake Wylie?
There are 98.76 Males per 100 Females in Lake Wylie.
What is the Ratio of Females per 100 Males in Lake Wylie?
There are 101.26 Females per 100 Males in Lake Wylie.
What is the Median Population Age in Lake Wylie?
Median Population Age in Lake Wylie is 37.7 Years.
What is the Average Family Size in Lake Wylie
Average Family Size in Lake Wylie is 3.0 People.
What is the Average Household Size in Lake Wylie
Average Household Size in Lake Wylie is 2.7 People.
What is Per Capita Income in Lake Wylie?
Per Capita income in Lake Wylie is $50,736.
What is the Median Family Income in Lake Wylie?
Median Family Income in Lake Wylie is $125,750.
What is the Median Household income in Lake Wylie?
Median Household Income in Lake Wylie is $111,424.
What is Income or Wage Gap in Lake Wylie?
Income or Wage Gap in Lake Wylie is 40.2%.
Women in Lake Wylie earn 59.8 cents for every dollar earned by a man.
What is Inequality or Gini Index in Lake Wylie?
Inequality or Gini Index in Lake Wylie is 0.42.
How Large is the Labor Force in Lake Wylie?
There are 7,521 People in the Labor Forcein in Lake Wylie.
What is the Percentage of People in the Labor Force in Lake Wylie?
70.2% of People are in the Labor Force in Lake Wylie.
What is the Unemployment Rate in Lake Wylie?
Unemployment Rate in Lake Wylie is 5.5%.