Pine Ridge, SC
Pine Ridge Map
Pine Ridge Overview
2,687
TOTAL POPULATION
1,300
MALE POPULATION
1,387
FEMALE POPULATION
93.73
MALES / 100 FEMALES
106.69
FEMALES / 100 MALES
37.1
MEDIAN AGE
2.9
AVG FAMILY SIZE
2.5
AVG HOUSEHOLD SIZE
$34,372
PER CAPITA INCOME
$87,963
AVG FAMILY INCOME
$74,565
AVG HOUSEHOLD INCOME
11.2%
WAGE / INCOME GAP [ % ]
88.8¢/ $1
WAGE / INCOME GAP [ $ ]
0.36
INEQUALITY / GINI INDEX
1,277
LABOR FORCE [ PEOPLE ]
59.6%
PERCENT IN LABOR FORCE
6.9%
UNEMPLOYMENT RATE
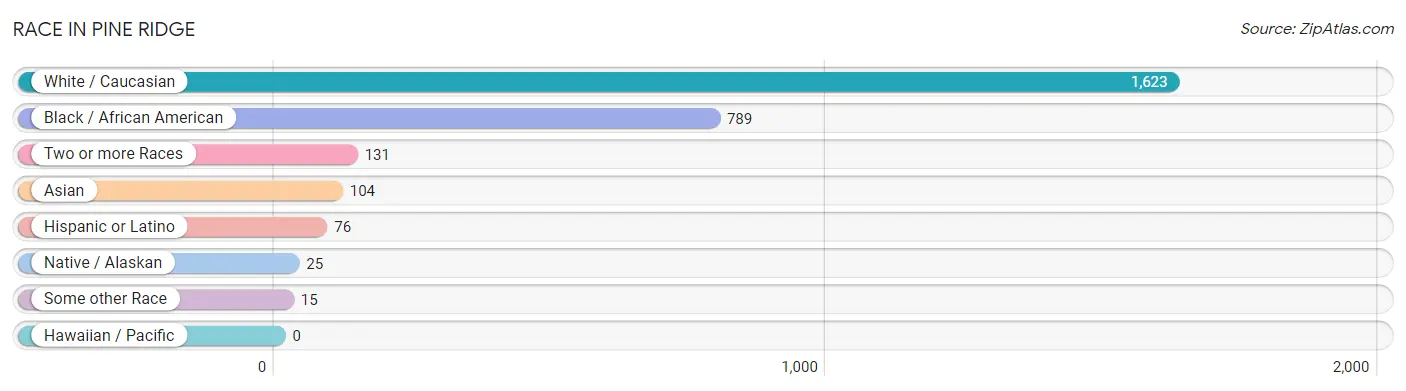
Race in Pine Ridge
The most populous races in Pine Ridge are White / Caucasian (1,623 | 60.4%), Black / African American (789 | 29.4%), and Two or more Races (131 | 4.9%).
| Race | # Population | % Population |
| Asian | 104 | 3.9% |
| Black / African American | 789 | 29.4% |
| Hawaiian / Pacific | 0 | 0.0% |
| Hispanic or Latino | 76 | 2.8% |
| Native / Alaskan | 25 | 0.9% |
| White / Caucasian | 1,623 | 60.4% |
| Two or more Races | 131 | 4.9% |
| Some other Race | 15 | 0.6% |
| Total | 2,687 | 100.0% |
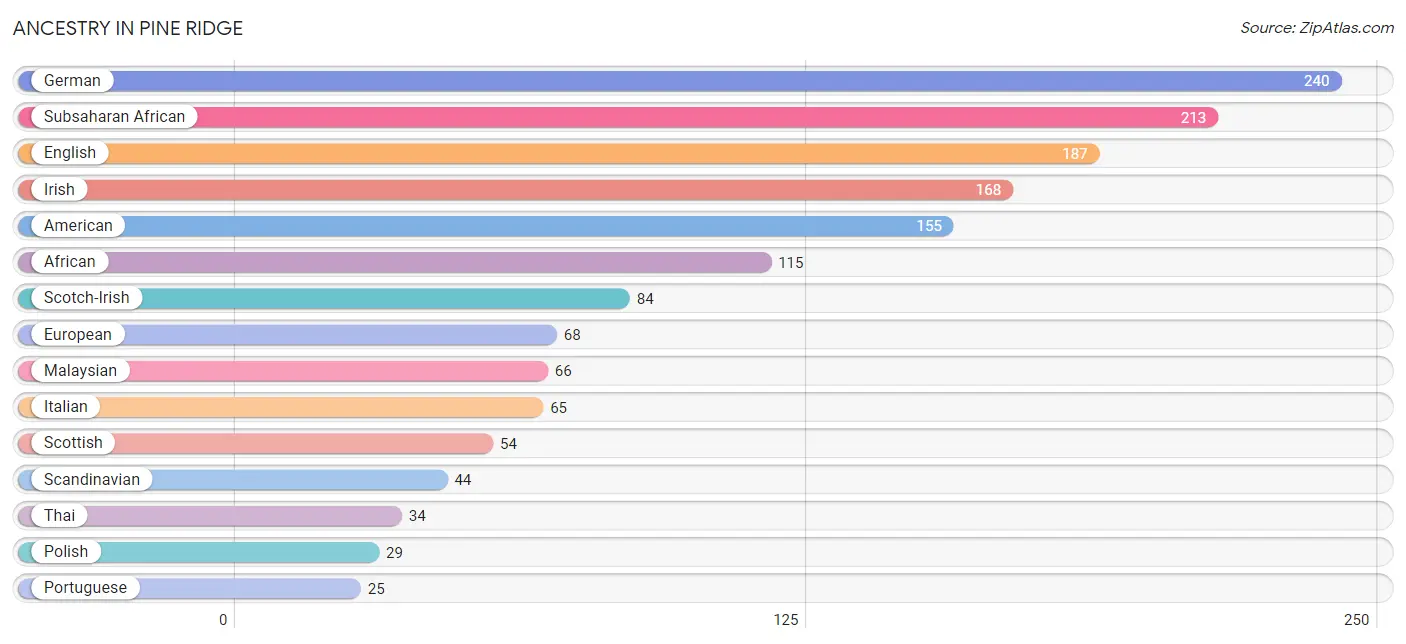
Ancestry in Pine Ridge
The most populous ancestries reported in Pine Ridge are German (240 | 8.9%), Subsaharan African (213 | 7.9%), English (187 | 7.0%), Irish (168 | 6.2%), and American (155 | 5.8%), together accounting for 35.8% of all Pine Ridge residents.
| Ancestry | # Population | % Population |
| African | 115 | 4.3% |
| American | 155 | 5.8% |
| British | 21 | 0.8% |
| Central American | 14 | 0.5% |
| Costa Rican | 5 | 0.2% |
| Danish | 10 | 0.4% |
| Dutch | 4 | 0.2% |
| English | 187 | 7.0% |
| European | 68 | 2.5% |
| French | 20 | 0.7% |
| German | 240 | 8.9% |
| Irish | 168 | 6.2% |
| Italian | 65 | 2.4% |
| Jamaican | 8 | 0.3% |
| Korean | 4 | 0.2% |
| Lumbee | 4 | 0.2% |
| Malaysian | 66 | 2.5% |
| Mexican | 22 | 0.8% |
| Nicaraguan | 9 | 0.3% |
| Nigerian | 11 | 0.4% |
| Norwegian | 5 | 0.2% |
| Polish | 29 | 1.1% |
| Portuguese | 25 | 0.9% |
| Puerto Rican | 17 | 0.6% |
| Scandinavian | 44 | 1.6% |
| Scotch-Irish | 84 | 3.1% |
| Scottish | 54 | 2.0% |
| Spanish | 23 | 0.9% |
| Subsaharan African | 213 | 7.9% |
| Thai | 34 | 1.3% |
| Ukrainian | 5 | 0.2% | View All 31 Rows |
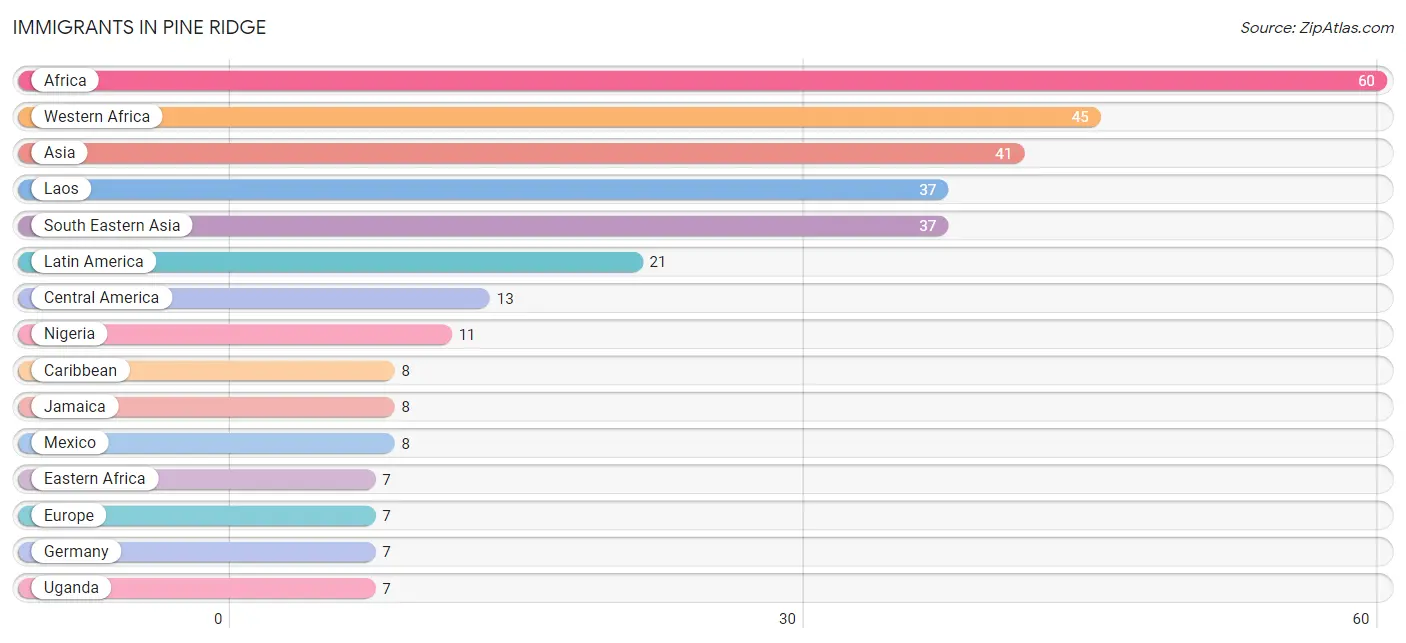
Immigrants in Pine Ridge
The most numerous immigrant groups reported in Pine Ridge came from Africa (60 | 2.2%), Western Africa (45 | 1.7%), Asia (41 | 1.5%), Laos (37 | 1.4%), and South Eastern Asia (37 | 1.4%), together accounting for 8.2% of all Pine Ridge residents.
| Immigration Origin | # Population | % Population |
| Africa | 60 | 2.2% |
| Asia | 41 | 1.5% |
| Caribbean | 8 | 0.3% |
| Central America | 13 | 0.5% |
| China | 4 | 0.2% |
| Eastern Africa | 7 | 0.3% |
| Eastern Asia | 4 | 0.2% |
| Europe | 7 | 0.3% |
| Germany | 7 | 0.3% |
| Jamaica | 8 | 0.3% |
| Laos | 37 | 1.4% |
| Latin America | 21 | 0.8% |
| Mexico | 8 | 0.3% |
| Nicaragua | 5 | 0.2% |
| Nigeria | 11 | 0.4% |
| South Eastern Asia | 37 | 1.4% |
| Uganda | 7 | 0.3% |
| Western Africa | 45 | 1.7% |
| Western Europe | 7 | 0.3% | View All 19 Rows |
Sex and Age in Pine Ridge
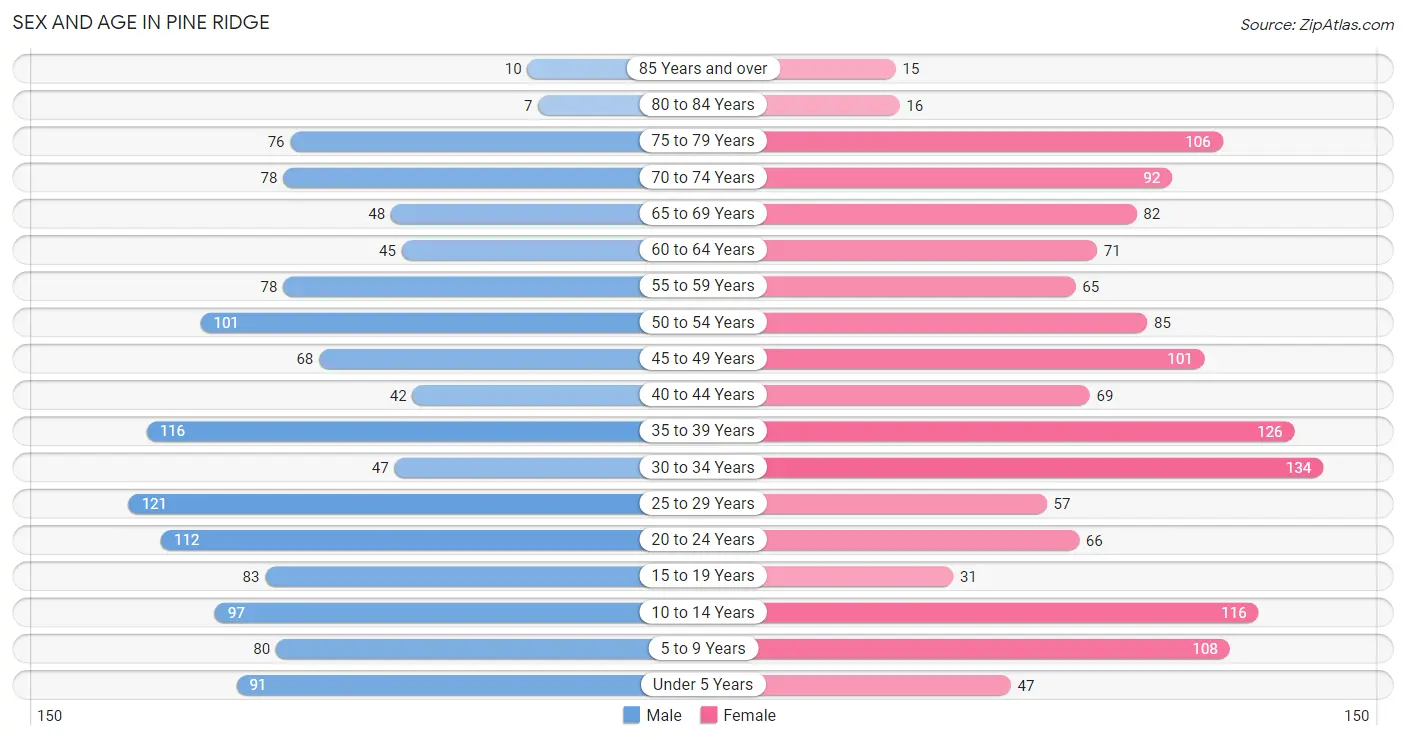
Sex and Age in Pine Ridge
The most populous age groups in Pine Ridge are 25 to 29 Years (121 | 9.3%) for men and 30 to 34 Years (134 | 9.7%) for women.
| Age Bracket | Male | Female |
| Under 5 Years | 91 (7.0%) | 47 (3.4%) |
| 5 to 9 Years | 80 (6.1%) | 108 (7.8%) |
| 10 to 14 Years | 97 (7.5%) | 116 (8.4%) |
| 15 to 19 Years | 83 (6.4%) | 31 (2.2%) |
| 20 to 24 Years | 112 (8.6%) | 66 (4.8%) |
| 25 to 29 Years | 121 (9.3%) | 57 (4.1%) |
| 30 to 34 Years | 47 (3.6%) | 134 (9.7%) |
| 35 to 39 Years | 116 (8.9%) | 126 (9.1%) |
| 40 to 44 Years | 42 (3.2%) | 69 (5.0%) |
| 45 to 49 Years | 68 (5.2%) | 101 (7.3%) |
| 50 to 54 Years | 101 (7.8%) | 85 (6.1%) |
| 55 to 59 Years | 78 (6.0%) | 65 (4.7%) |
| 60 to 64 Years | 45 (3.5%) | 71 (5.1%) |
| 65 to 69 Years | 48 (3.7%) | 82 (5.9%) |
| 70 to 74 Years | 78 (6.0%) | 92 (6.6%) |
| 75 to 79 Years | 76 (5.9%) | 106 (7.6%) |
| 80 to 84 Years | 7 (0.5%) | 16 (1.1%) |
| 85 Years and over | 10 (0.8%) | 15 (1.1%) |
| Total | 1,300 (100.0%) | 1,387 (100.0%) |
Families and Households in Pine Ridge
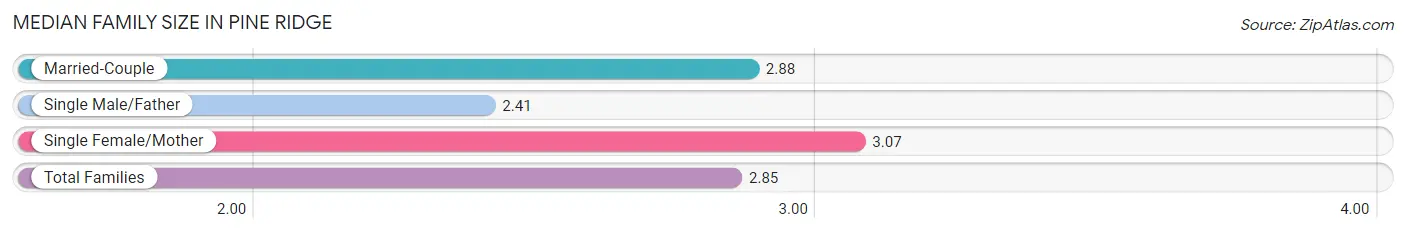
Median Family Size in Pine Ridge
The median family size in Pine Ridge is 2.85 persons per family, with single female/mother families (123 | 15.0%) accounting for the largest median family size of 3.07 persons per family. On the other hand, single male/father families (102 | 12.5%) represent the smallest median family size with 2.41 persons per family.
| Family Type | # Families | Family Size |
| Married-Couple | 593 (72.5%) | 2.88 |
| Single Male/Father | 102 (12.5%) | 2.41 |
| Single Female/Mother | 123 (15.0%) | 3.07 |
| Total Families | 818 (100.0%) | 2.85 |
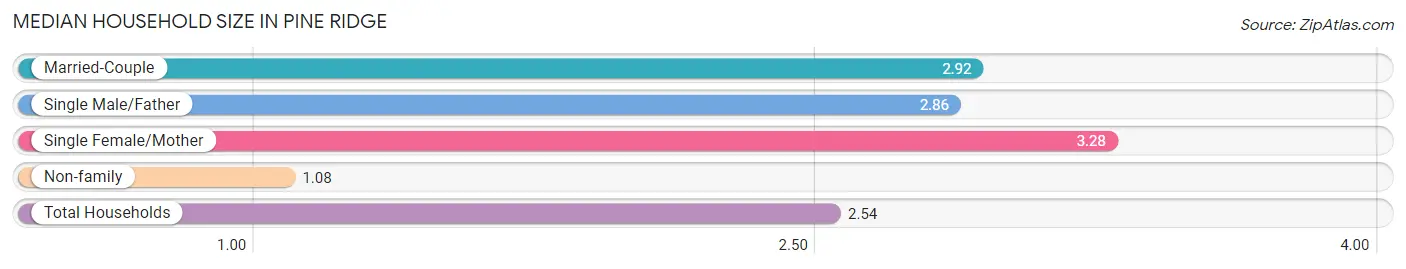
Median Household Size in Pine Ridge
The median household size in Pine Ridge is 2.54 persons per household, with single female/mother households (123 | 11.7%) accounting for the largest median household size of 3.28 persons per household. non-family households (238 | 22.5%) represent the smallest median household size with 1.08 persons per household.
| Household Type | # Households | Household Size |
| Married-Couple | 593 (56.2%) | 2.92 |
| Single Male/Father | 102 (9.7%) | 2.86 |
| Single Female/Mother | 123 (11.7%) | 3.28 |
| Non-family | 238 (22.5%) | 1.08 |
| Total Households | 1,056 (100.0%) | 2.54 |
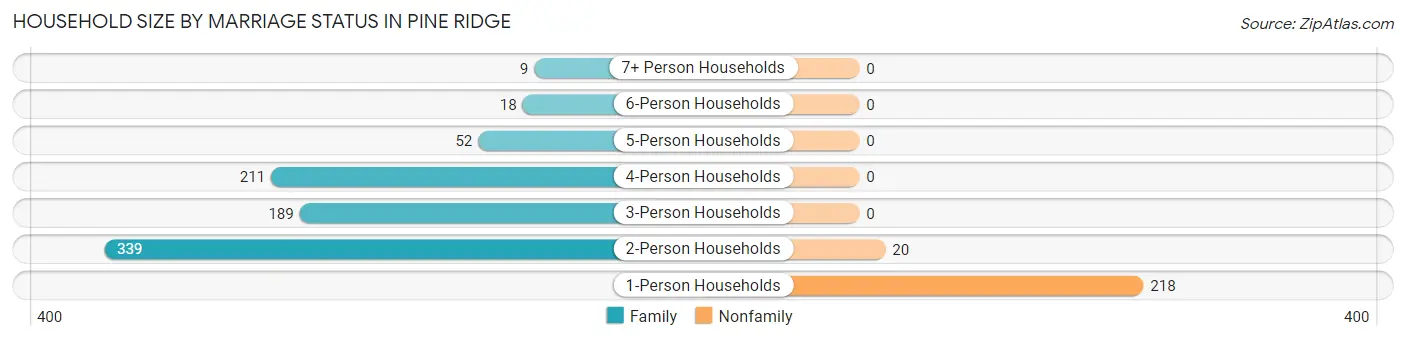
Household Size by Marriage Status in Pine Ridge
Out of a total of 1,056 households in Pine Ridge, 818 (77.5%) are family households, while 238 (22.5%) are nonfamily households. The most numerous type of family households are 2-person households, comprising 339, and the most common type of nonfamily households are 1-person households, comprising 218.
| Household Size | Family Households | Nonfamily Households |
| 1-Person Households | - | 218 (20.6%) |
| 2-Person Households | 339 (32.1%) | 20 (1.9%) |
| 3-Person Households | 189 (17.9%) | 0 (0.0%) |
| 4-Person Households | 211 (20.0%) | 0 (0.0%) |
| 5-Person Households | 52 (4.9%) | 0 (0.0%) |
| 6-Person Households | 18 (1.7%) | 0 (0.0%) |
| 7+ Person Households | 9 (0.9%) | 0 (0.0%) |
| Total | 818 (77.5%) | 238 (22.5%) |
Female Fertility in Pine Ridge
Fertility by Age in Pine Ridge
Average fertility rate in Pine Ridge is 78.0 births per 1,000 women. Women in the age bracket of 20 to 34 years have the highest fertility rate with 183.0 births per 1,000 women. Women in the age bracket of 20 to 34 years acount for 100.0% of all women with births.
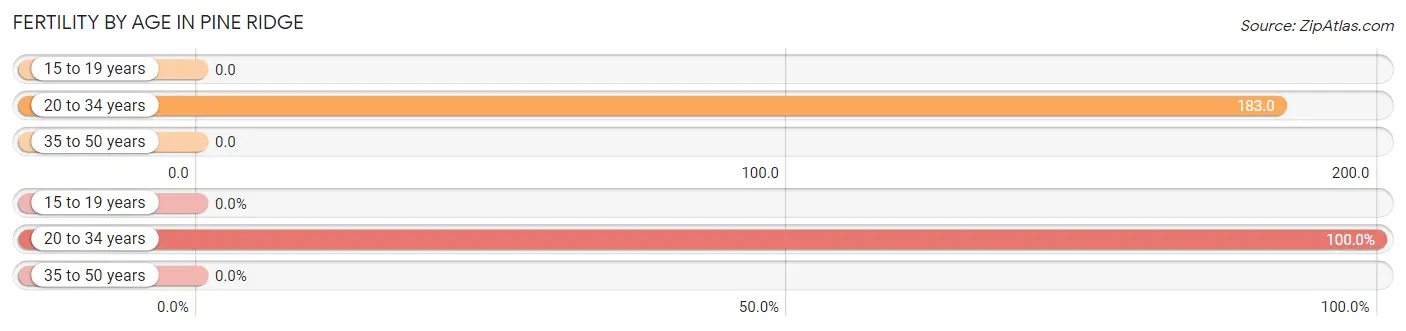
| Age Bracket | Women with Births | Births / 1,000 Women |
| 15 to 19 years | 0 (0.0%) | 0.0 |
| 20 to 34 years | 47 (100.0%) | 183.0 |
| 35 to 50 years | 0 (0.0%) | 0.0 |
| Total | 47 (100.0%) | 78.0 |
Fertility by Age by Marriage Status in Pine Ridge
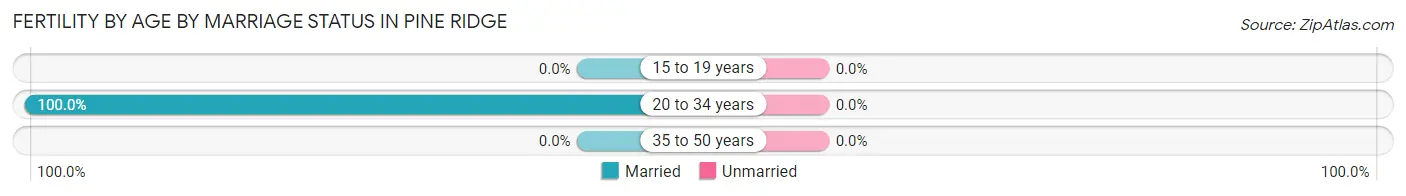
| Age Bracket | Married | Unmarried |
| 15 to 19 years | 0 (0.0%) | 0 (0.0%) |
| 20 to 34 years | 47 (100.0%) | 0 (0.0%) |
| 35 to 50 years | 0 (0.0%) | 0 (0.0%) |
| Total | 47 (100.0%) | 0 (0.0%) |
Fertility by Education in Pine Ridge
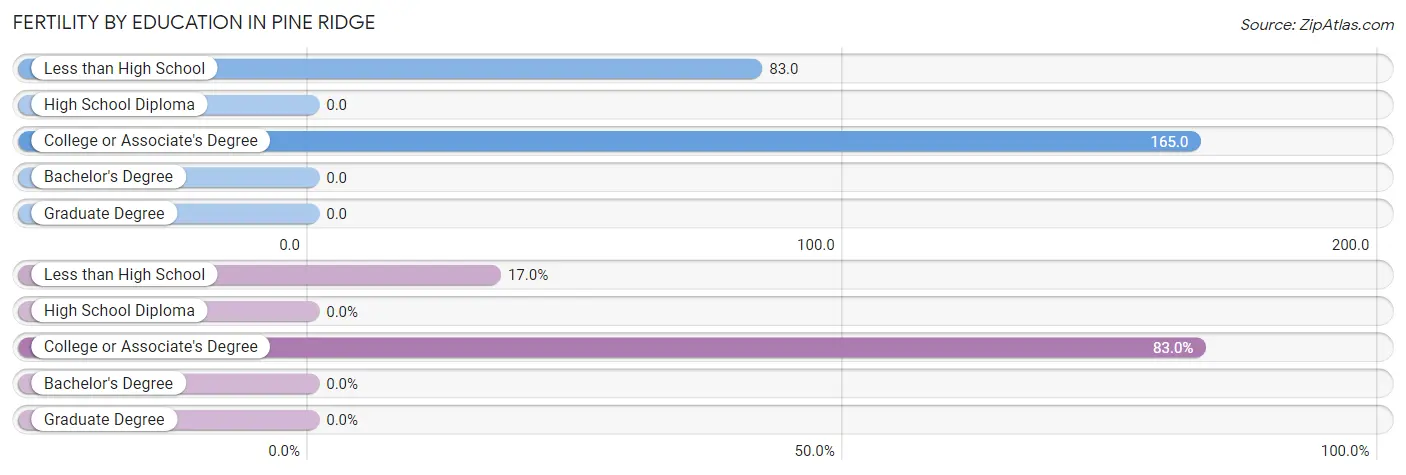
| Educational Attainment | Women with Births | Births / 1,000 Women |
| Less than High School | 8 (17.0%) | 83.0 |
| High School Diploma | 0 (0.0%) | 0.0 |
| College or Associate's Degree | 39 (83.0%) | 165.0 |
| Bachelor's Degree | 0 (0.0%) | 0.0 |
| Graduate Degree | 0 (0.0%) | 0.0 |
| Total | 47 (100.0%) | 78.0 |
Fertility by Education by Marriage Status in Pine Ridge
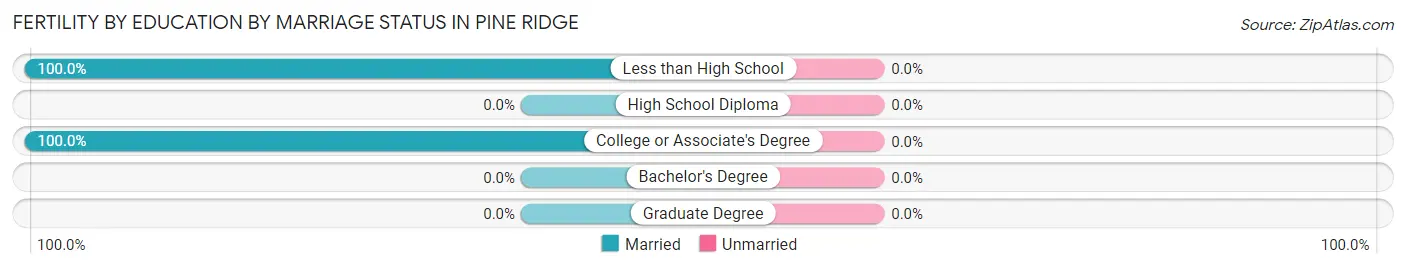
| Educational Attainment | Married | Unmarried |
| Less than High School | 8 (100.0%) | 0 (0.0%) |
| High School Diploma | 0 (0.0%) | 0 (0.0%) |
| College or Associate's Degree | 39 (100.0%) | 0 (0.0%) |
| Bachelor's Degree | 0 (0.0%) | 0 (0.0%) |
| Graduate Degree | 0 (0.0%) | 0 (0.0%) |
| Total | 47 (100.0%) | 0 (0.0%) |
Income in Pine Ridge
Income Overview in Pine Ridge
Per Capita Income in Pine Ridge is $34,372, while median incomes of families and households are $87,963 and $74,565 respectively.
| Characteristic | Number | Measure |
| Per Capita Income | 2,687 | $34,372 |
| Median Family Income | 818 | $87,963 |
| Mean Family Income | 818 | $97,674 |
| Median Household Income | 1,056 | $74,565 |
| Mean Household Income | 1,056 | $87,986 |
| Income Deficit | 818 | $0 |
| Wage / Income Gap (%) | 2,687 | 11.25% |
| Wage / Income Gap ($) | 2,687 | 88.75¢ per $1 |
| Gini / Inequality Index | 2,687 | 0.36 |
Earnings by Sex in Pine Ridge
Average Earnings in Pine Ridge are $36,623, $39,500 for men and $35,057 for women, a difference of 11.3%.
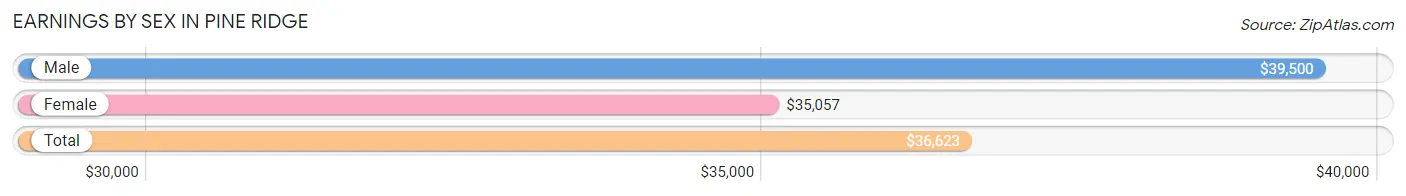
| Sex | Number | Average Earnings |
| Male | 760 (55.0%) | $39,500 |
| Female | 622 (45.0%) | $35,057 |
| Total | 1,382 (100.0%) | $36,623 |
Earnings by Sex by Income Bracket in Pine Ridge
The most common earnings brackets in Pine Ridge are $75,000 to $99,999 for men (118 | 15.5%) and $35,000 to $39,999 for women (90 | 14.5%).
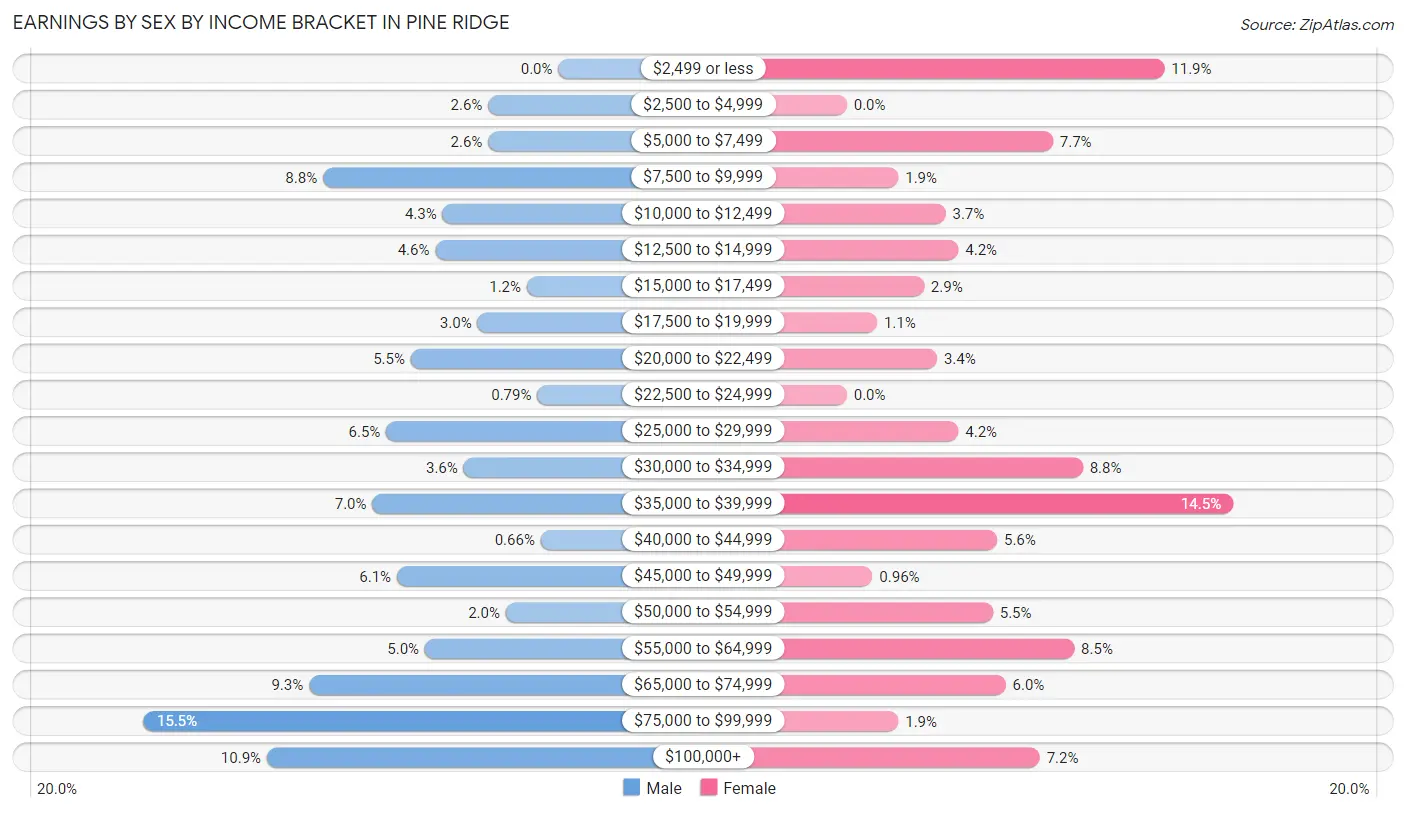
| Income | Male | Female |
| $2,499 or less | 0 (0.0%) | 74 (11.9%) |
| $2,500 to $4,999 | 20 (2.6%) | 0 (0.0%) |
| $5,000 to $7,499 | 20 (2.6%) | 48 (7.7%) |
| $7,500 to $9,999 | 67 (8.8%) | 12 (1.9%) |
| $10,000 to $12,499 | 33 (4.3%) | 23 (3.7%) |
| $12,500 to $14,999 | 35 (4.6%) | 26 (4.2%) |
| $15,000 to $17,499 | 9 (1.2%) | 18 (2.9%) |
| $17,500 to $19,999 | 23 (3.0%) | 7 (1.1%) |
| $20,000 to $22,499 | 42 (5.5%) | 21 (3.4%) |
| $22,500 to $24,999 | 6 (0.8%) | 0 (0.0%) |
| $25,000 to $29,999 | 49 (6.5%) | 26 (4.2%) |
| $30,000 to $34,999 | 27 (3.5%) | 55 (8.8%) |
| $35,000 to $39,999 | 53 (7.0%) | 90 (14.5%) |
| $40,000 to $44,999 | 5 (0.7%) | 35 (5.6%) |
| $45,000 to $49,999 | 46 (6.0%) | 6 (1.0%) |
| $50,000 to $54,999 | 15 (2.0%) | 34 (5.5%) |
| $55,000 to $64,999 | 38 (5.0%) | 53 (8.5%) |
| $65,000 to $74,999 | 71 (9.3%) | 37 (5.9%) |
| $75,000 to $99,999 | 118 (15.5%) | 12 (1.9%) |
| $100,000+ | 83 (10.9%) | 45 (7.2%) |
| Total | 760 (100.0%) | 622 (100.0%) |
Earnings by Sex by Educational Attainment in Pine Ridge
Average earnings in Pine Ridge are $54,333 for men and $35,568 for women, a difference of 34.5%. Men with an educational attainment of bachelor's degree enjoy the highest average annual earnings of $97,250, while those with less than high school education earn the least with $21,250. Women with an educational attainment of bachelor's degree earn the most with the average annual earnings of $52,750, while those with college or associate's degree education have the smallest earnings of $38,036.
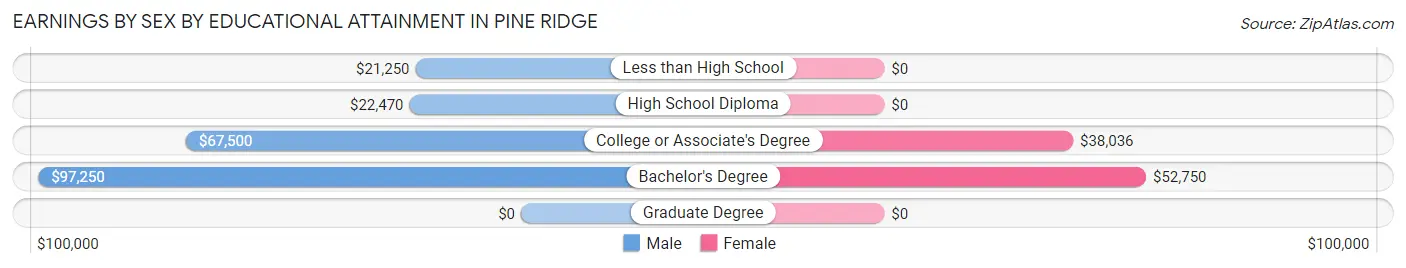
| Educational Attainment | Male Income | Female Income |
| Less than High School | $21,250 | $0 |
| High School Diploma | $22,470 | $0 |
| College or Associate's Degree | $67,500 | $38,036 |
| Bachelor's Degree | $97,250 | $52,750 |
| Graduate Degree | - | - |
| Total | $54,333 | $35,568 |
Family Income in Pine Ridge
Family Income Brackets in Pine Ridge
According to the Pine Ridge family income data, there are 249 families falling into the $100,000 to $149,999 income range, which is the most common income bracket and makes up 30.4% of all families.
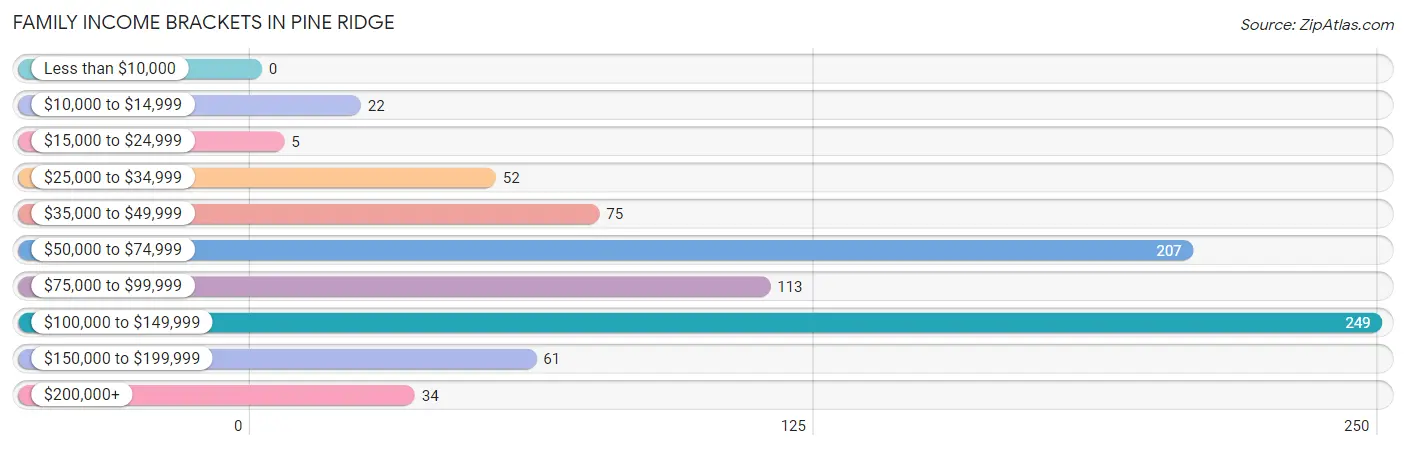
| Income Bracket | # Families | % Families |
| Less than $10,000 | 0 | 0.0% |
| $10,000 to $14,999 | 22 | 2.7% |
| $15,000 to $24,999 | 5 | 0.6% |
| $25,000 to $34,999 | 52 | 6.4% |
| $35,000 to $49,999 | 75 | 9.2% |
| $50,000 to $74,999 | 207 | 25.3% |
| $75,000 to $99,999 | 113 | 13.8% |
| $100,000 to $149,999 | 249 | 30.4% |
| $150,000 to $199,999 | 61 | 7.5% |
| $200,000+ | 34 | 4.2% |
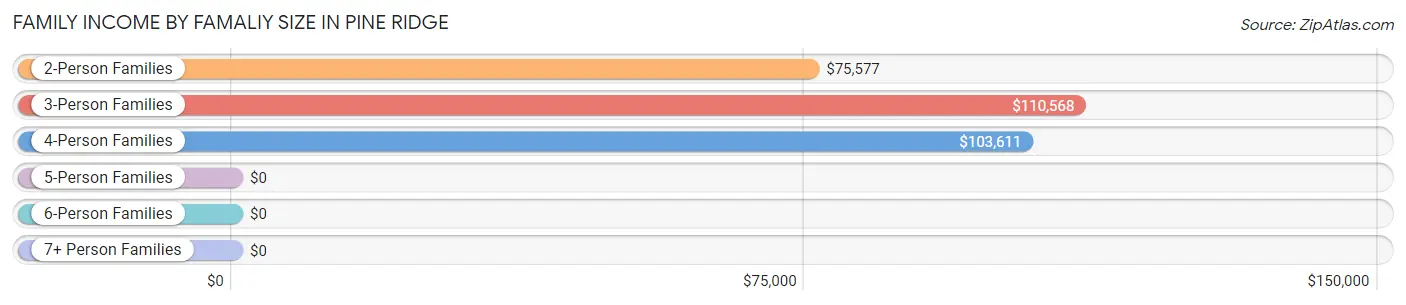
Family Income by Famaliy Size in Pine Ridge
3-person families (175 | 21.4%) account for the highest median family income in Pine Ridge with $110,568 per family, while 2-person families (384 | 46.9%) have the highest median income of $37,788 per family member.
| Income Bracket | # Families | Median Income |
| 2-Person Families | 384 (46.9%) | $75,577 |
| 3-Person Families | 175 (21.4%) | $110,568 |
| 4-Person Families | 180 (22.0%) | $103,611 |
| 5-Person Families | 70 (8.6%) | $0 |
| 6-Person Families | 9 (1.1%) | $0 |
| 7+ Person Families | 0 (0.0%) | $0 |
| Total | 818 (100.0%) | $87,963 |
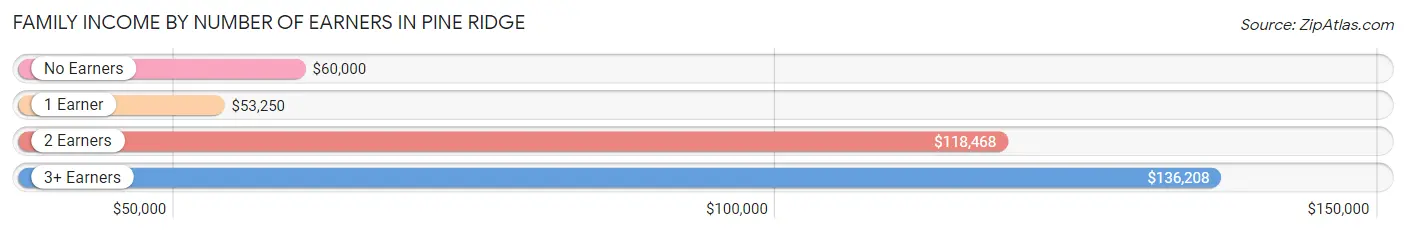
Family Income by Number of Earners in Pine Ridge
The median family income in Pine Ridge is $87,963, with families comprising 3+ earners (99) having the highest median family income of $136,208, while families with 1 earner (247) have the lowest median family income of $53,250, accounting for 12.1% and 30.2% of families, respectively.
| Number of Earners | # Families | Median Income |
| No Earners | 148 (18.1%) | $60,000 |
| 1 Earner | 247 (30.2%) | $53,250 |
| 2 Earners | 324 (39.6%) | $118,468 |
| 3+ Earners | 99 (12.1%) | $136,208 |
| Total | 818 (100.0%) | $87,963 |
Household Income in Pine Ridge
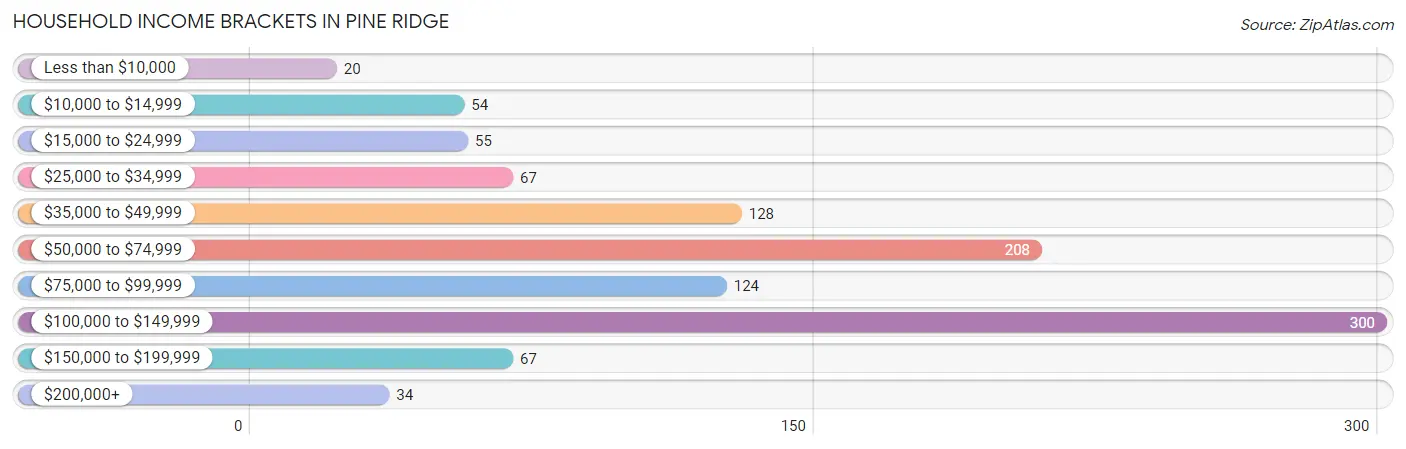
Household Income Brackets in Pine Ridge
With 300 households falling in the category, the $100,000 to $149,999 income range is the most frequent in Pine Ridge, accounting for 28.4% of all households. In contrast, only 20 households (1.9%) fall into the less than $10,000 income bracket, making it the least populous group.
| Income Bracket | # Households | % Households |
| Less than $10,000 | 20 | 1.9% |
| $10,000 to $14,999 | 54 | 5.1% |
| $15,000 to $24,999 | 55 | 5.2% |
| $25,000 to $34,999 | 67 | 6.3% |
| $35,000 to $49,999 | 128 | 12.1% |
| $50,000 to $74,999 | 208 | 19.7% |
| $75,000 to $99,999 | 124 | 11.7% |
| $100,000 to $149,999 | 300 | 28.4% |
| $150,000 to $199,999 | 67 | 6.3% |
| $200,000+ | 34 | 3.2% |
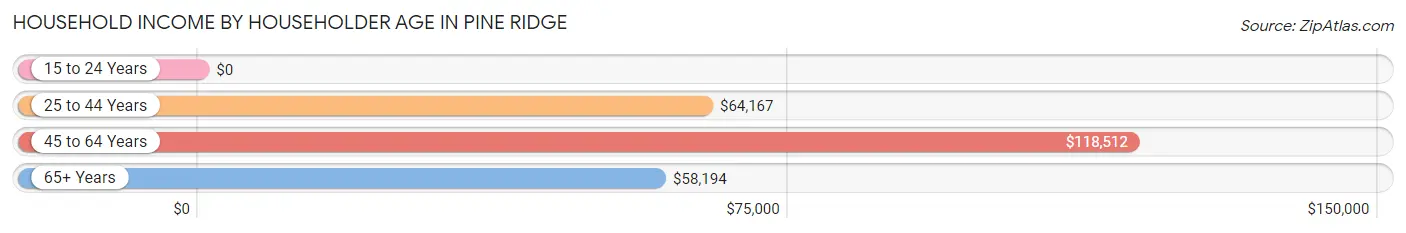
Household Income by Householder Age in Pine Ridge
The median household income in Pine Ridge is $74,565, with the highest median household income of $118,512 found in the 45 to 64 years age bracket for the primary householder. A total of 350 households (33.1%) fall into this category. Meanwhile, the 15 to 24 years age bracket for the primary householder has the lowest median household income of $0, with 29 households (2.8%) in this group.
| Income Bracket | # Households | Median Income |
| 15 to 24 Years | 29 (2.8%) | $0 |
| 25 to 44 Years | 334 (31.6%) | $64,167 |
| 45 to 64 Years | 350 (33.1%) | $118,512 |
| 65+ Years | 343 (32.5%) | $58,194 |
| Total | 1,056 (100.0%) | $74,565 |
Poverty in Pine Ridge
Income Below Poverty by Sex and Age in Pine Ridge
With 12.7% poverty level for males and 14.3% for females among the residents of Pine Ridge, 12 to 14 year old males and 12 to 14 year old females are the most vulnerable to poverty, with 31 males (79.5%) and 87 females (80.6%) in their respective age groups living below the poverty level.
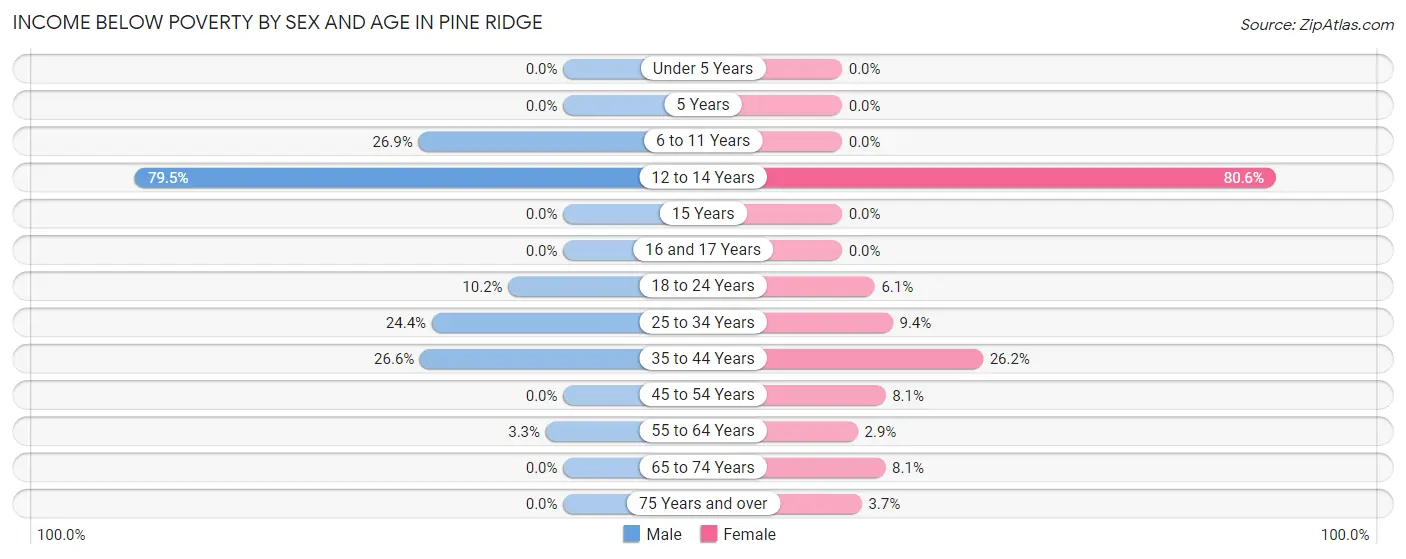
| Age Bracket | Male | Female |
| Under 5 Years | 0 (0.0%) | 0 (0.0%) |
| 5 Years | 0 (0.0%) | 0 (0.0%) |
| 6 to 11 Years | 32 (26.9%) | 0 (0.0%) |
| 12 to 14 Years | 31 (79.5%) | 87 (80.6%) |
| 15 Years | 0 (0.0%) | 0 (0.0%) |
| 16 and 17 Years | 0 (0.0%) | 0 (0.0%) |
| 18 to 24 Years | 15 (10.2%) | 4 (6.1%) |
| 25 to 34 Years | 41 (24.4%) | 18 (9.4%) |
| 35 to 44 Years | 42 (26.6%) | 51 (26.2%) |
| 45 to 54 Years | 0 (0.0%) | 15 (8.1%) |
| 55 to 64 Years | 4 (3.3%) | 4 (2.9%) |
| 65 to 74 Years | 0 (0.0%) | 14 (8.1%) |
| 75 Years and over | 0 (0.0%) | 5 (3.6%) |
| Total | 165 (12.7%) | 198 (14.3%) |
Income Above Poverty by Sex and Age in Pine Ridge
According to the poverty statistics in Pine Ridge, males aged under 5 years and females aged under 5 years are the age groups that are most secure financially, with 100.0% of males and 100.0% of females in these age groups living above the poverty line.
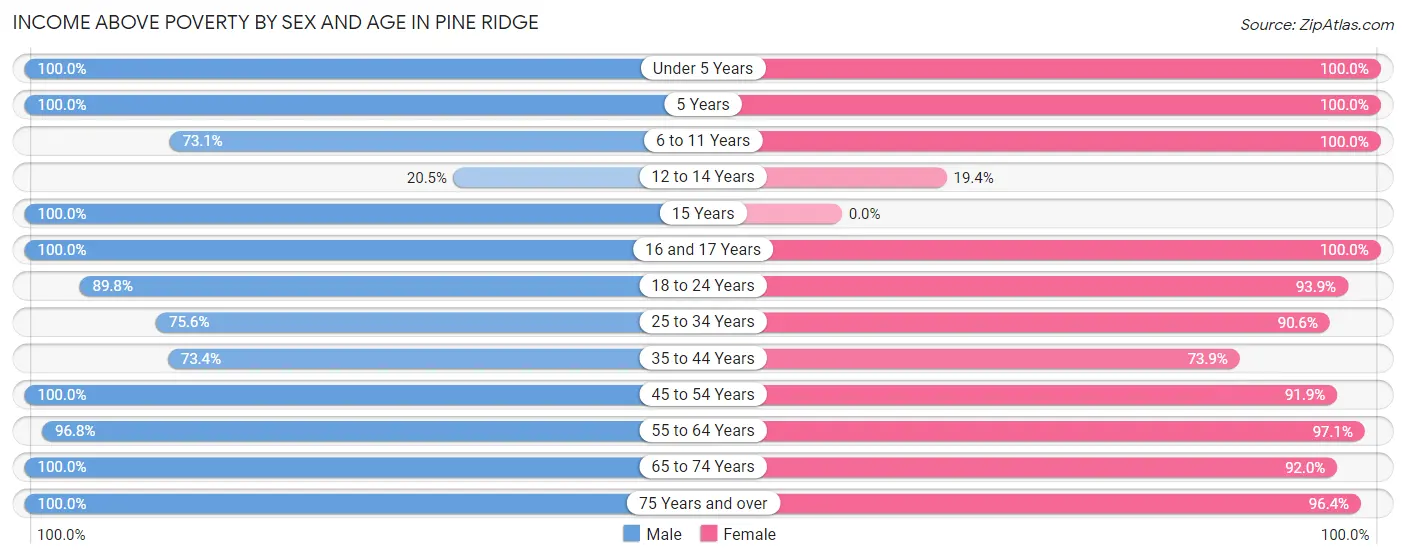
| Age Bracket | Male | Female |
| Under 5 Years | 91 (100.0%) | 47 (100.0%) |
| 5 Years | 19 (100.0%) | 12 (100.0%) |
| 6 to 11 Years | 87 (73.1%) | 104 (100.0%) |
| 12 to 14 Years | 8 (20.5%) | 21 (19.4%) |
| 15 Years | 6 (100.0%) | 0 (0.0%) |
| 16 and 17 Years | 42 (100.0%) | 31 (100.0%) |
| 18 to 24 Years | 132 (89.8%) | 62 (93.9%) |
| 25 to 34 Years | 127 (75.6%) | 173 (90.6%) |
| 35 to 44 Years | 116 (73.4%) | 144 (73.9%) |
| 45 to 54 Years | 169 (100.0%) | 171 (91.9%) |
| 55 to 64 Years | 119 (96.8%) | 132 (97.1%) |
| 65 to 74 Years | 126 (100.0%) | 160 (91.9%) |
| 75 Years and over | 93 (100.0%) | 132 (96.4%) |
| Total | 1,135 (87.3%) | 1,189 (85.7%) |
Income Below Poverty Among Married-Couple Families in Pine Ridge
The poverty statistics for married-couple families in Pine Ridge show that 5.9% or 35 of the total 593 families live below the poverty line. Families with 3 or 4 children have the highest poverty rate of 59.6%, comprising of 31 families. On the other hand, families with 1 or 2 children have the lowest poverty rate of 0.0%, which includes 0 families.
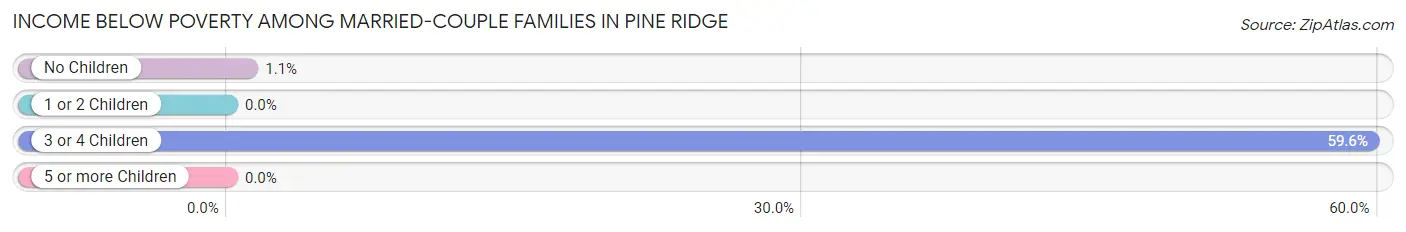
| Children | Above Poverty | Below Poverty |
| No Children | 372 (98.9%) | 4 (1.1%) |
| 1 or 2 Children | 165 (100.0%) | 0 (0.0%) |
| 3 or 4 Children | 21 (40.4%) | 31 (59.6%) |
| 5 or more Children | 0 (0.0%) | 0 (0.0%) |
| Total | 558 (94.1%) | 35 (5.9%) |
Income Below Poverty Among Single-Parent Households in Pine Ridge
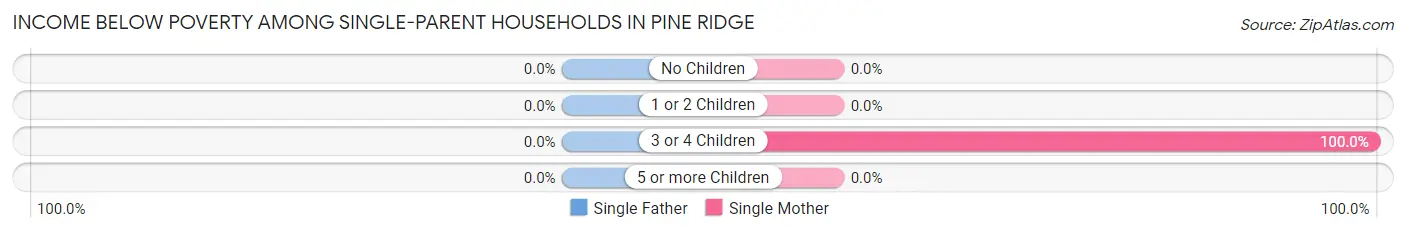
| Children | Single Father | Single Mother |
| No Children | 0 (0.0%) | 0 (0.0%) |
| 1 or 2 Children | 0 (0.0%) | 0 (0.0%) |
| 3 or 4 Children | 0 (0.0%) | 18 (100.0%) |
| 5 or more Children | 0 (0.0%) | 0 (0.0%) |
| Total | 0 (0.0%) | 18 (14.6%) |
Income Below Poverty Among Married-Couple vs Single-Parent Households in Pine Ridge
The poverty data for Pine Ridge shows that 35 of the married-couple family households (5.9%) and 18 of the single-parent households (8.0%) are living below the poverty level. Within the married-couple family households, those with 3 or 4 children have the highest poverty rate, with 31 households (59.6%) falling below the poverty line. Among the single-parent households, those with 3 or 4 children have the highest poverty rate, with 18 household (100.0%) living below poverty.
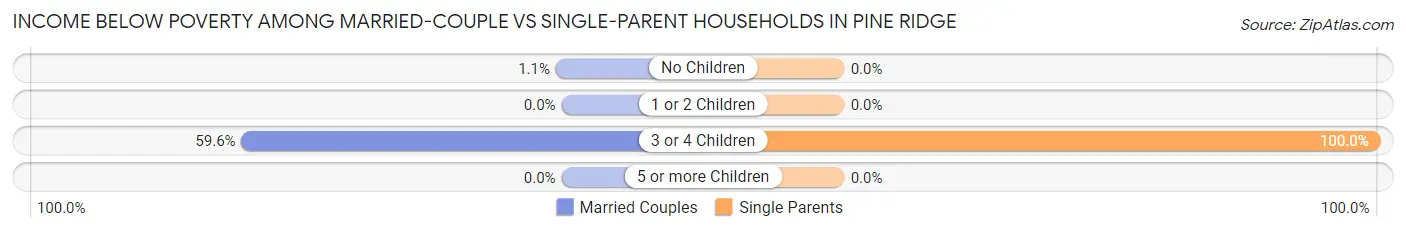
| Children | Married-Couple Families | Single-Parent Households |
| No Children | 4 (1.1%) | 0 (0.0%) |
| 1 or 2 Children | 0 (0.0%) | 0 (0.0%) |
| 3 or 4 Children | 31 (59.6%) | 18 (100.0%) |
| 5 or more Children | 0 (0.0%) | 0 (0.0%) |
| Total | 35 (5.9%) | 18 (8.0%) |
Employment Characteristics in Pine Ridge
Employment by Class of Employer in Pine Ridge
Among the 1,146 employed individuals in Pine Ridge, private company employees (833 | 72.7%), local government employees (94 | 8.2%), and state government employees (94 | 8.2%) make up the most common classes of employment.
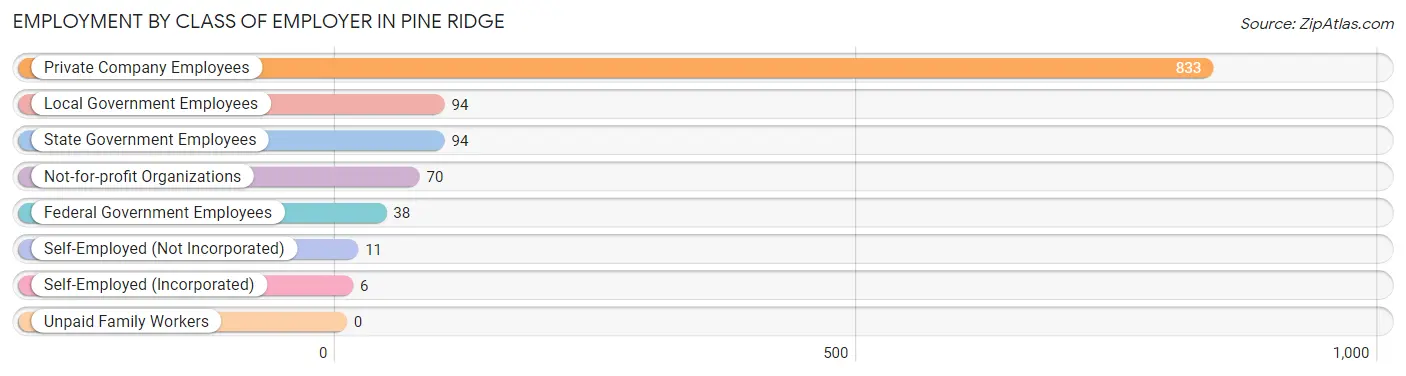
| Employer Class | # Employees | % Employees |
| Private Company Employees | 833 | 72.7% |
| Self-Employed (Incorporated) | 6 | 0.5% |
| Self-Employed (Not Incorporated) | 11 | 1.0% |
| Not-for-profit Organizations | 70 | 6.1% |
| Local Government Employees | 94 | 8.2% |
| State Government Employees | 94 | 8.2% |
| Federal Government Employees | 38 | 3.3% |
| Unpaid Family Workers | 0 | 0.0% |
| Total | 1,146 | 100.0% |
Employment Status by Age in Pine Ridge
According to the labor force statistics for Pine Ridge, out of the total population over 16 years of age (2,142), 59.6% or 1,277 individuals are in the labor force, with 6.9% or 88 of them unemployed. The age group with the highest labor force participation rate is 25 to 29 years, with 88.8% or 158 individuals in the labor force. Within the labor force, the 60 to 64 years age range has the highest percentage of unemployed individuals, with 34.4% or 31 of them being unemployed.
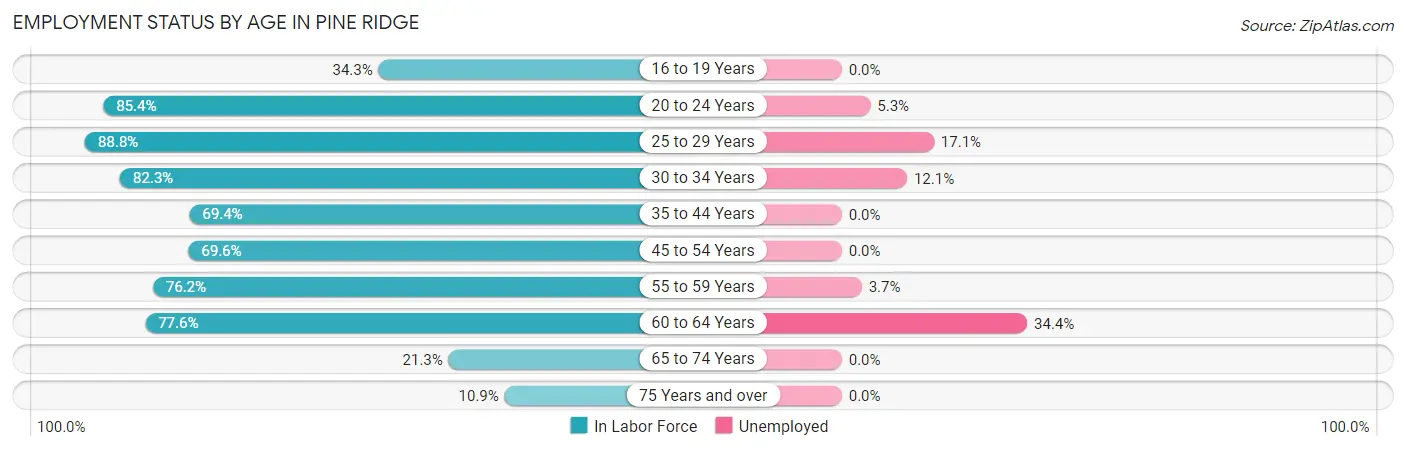
| Age Bracket | In Labor Force | Unemployed |
| 16 to 19 Years | 37 (34.3%) | 0 (0.0%) |
| 20 to 24 Years | 152 (85.4%) | 8 (5.3%) |
| 25 to 29 Years | 158 (88.8%) | 27 (17.1%) |
| 30 to 34 Years | 149 (82.3%) | 18 (12.1%) |
| 35 to 44 Years | 245 (69.4%) | 0 (0.0%) |
| 45 to 54 Years | 247 (69.6%) | 0 (0.0%) |
| 55 to 59 Years | 109 (76.2%) | 4 (3.7%) |
| 60 to 64 Years | 90 (77.6%) | 31 (34.4%) |
| 65 to 74 Years | 64 (21.3%) | 0 (0.0%) |
| 75 Years and over | 25 (10.9%) | 0 (0.0%) |
| Total | 1,277 (59.6%) | 88 (6.9%) |
Employment Status by Educational Attainment in Pine Ridge
According to labor force statistics for Pine Ridge, 75.3% of individuals (998) out of the total population between 25 and 64 years of age (1,326) are in the labor force, with 8.0% or 80 of them being unemployed. The group with the highest labor force participation rate are those with the educational attainment of high school diploma, with 81.5% or 234 individuals in the labor force. Within the labor force, individuals with high school diploma education have the highest percentage of unemployment, with 26.5% or 62 of them being unemployed.
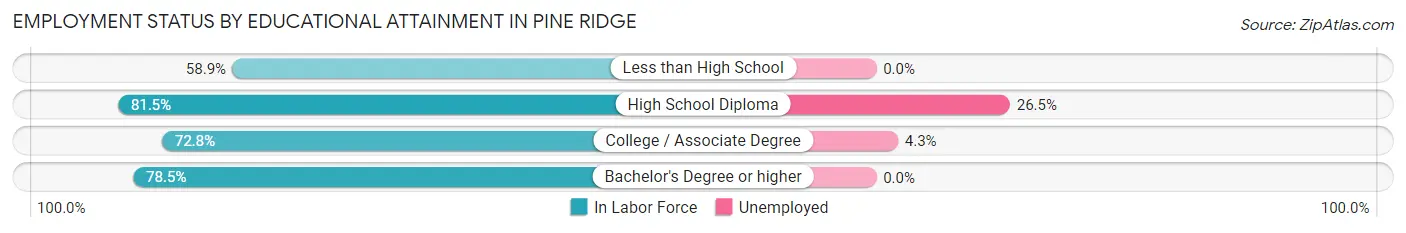
| Educational Attainment | In Labor Force | Unemployed |
| Less than High School | 56 (58.9%) | 0 (0.0%) |
| High School Diploma | 234 (81.5%) | 76 (26.5%) |
| College / Associate Degree | 420 (72.8%) | 25 (4.3%) |
| Bachelor's Degree or higher | 288 (78.5%) | 0 (0.0%) |
| Total | 998 (75.3%) | 106 (8.0%) |
Employment Occupations by Sex in Pine Ridge
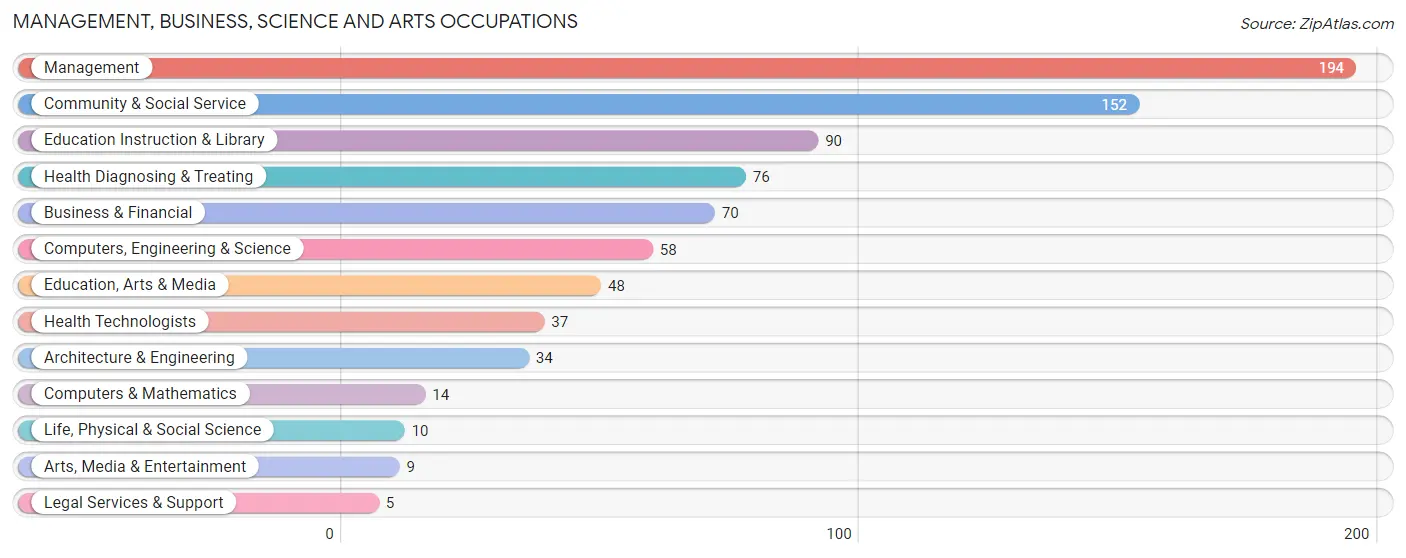
Management, Business, Science and Arts Occupations
The most common Management, Business, Science and Arts occupations in Pine Ridge are Management (194 | 16.3%), Community & Social Service (152 | 12.8%), Education Instruction & Library (90 | 7.6%), Health Diagnosing & Treating (76 | 6.4%), and Business & Financial (70 | 5.9%).
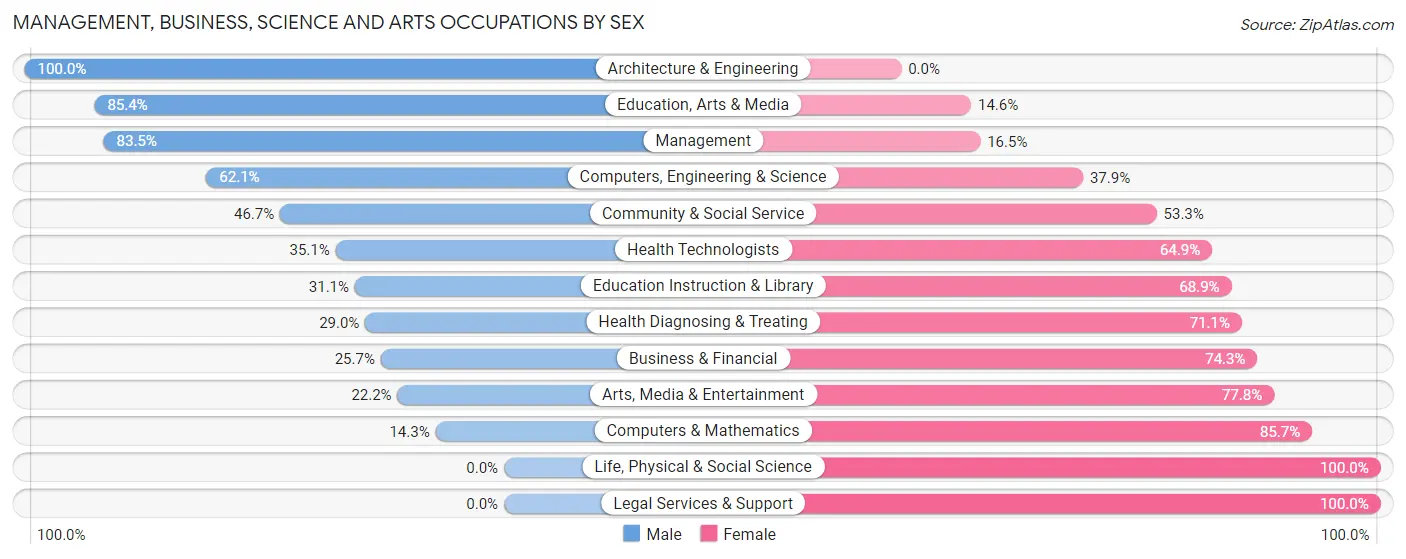
Management, Business, Science and Arts Occupations by Sex
Within the Management, Business, Science and Arts occupations in Pine Ridge, the most male-oriented occupations are Architecture & Engineering (100.0%), Education, Arts & Media (85.4%), and Management (83.5%), while the most female-oriented occupations are Life, Physical & Social Science (100.0%), Legal Services & Support (100.0%), and Computers & Mathematics (85.7%).
| Occupation | Male | Female |
| Management | 162 (83.5%) | 32 (16.5%) |
| Business & Financial | 18 (25.7%) | 52 (74.3%) |
| Computers, Engineering & Science | 36 (62.1%) | 22 (37.9%) |
| Computers & Mathematics | 2 (14.3%) | 12 (85.7%) |
| Architecture & Engineering | 34 (100.0%) | 0 (0.0%) |
| Life, Physical & Social Science | 0 (0.0%) | 10 (100.0%) |
| Community & Social Service | 71 (46.7%) | 81 (53.3%) |
| Education, Arts & Media | 41 (85.4%) | 7 (14.6%) |
| Legal Services & Support | 0 (0.0%) | 5 (100.0%) |
| Education Instruction & Library | 28 (31.1%) | 62 (68.9%) |
| Arts, Media & Entertainment | 2 (22.2%) | 7 (77.8%) |
| Health Diagnosing & Treating | 22 (28.9%) | 54 (71.1%) |
| Health Technologists | 13 (35.1%) | 24 (64.9%) |
| Total (Category) | 309 (56.2%) | 241 (43.8%) |
| Total (Overall) | 703 (59.2%) | 485 (40.8%) |
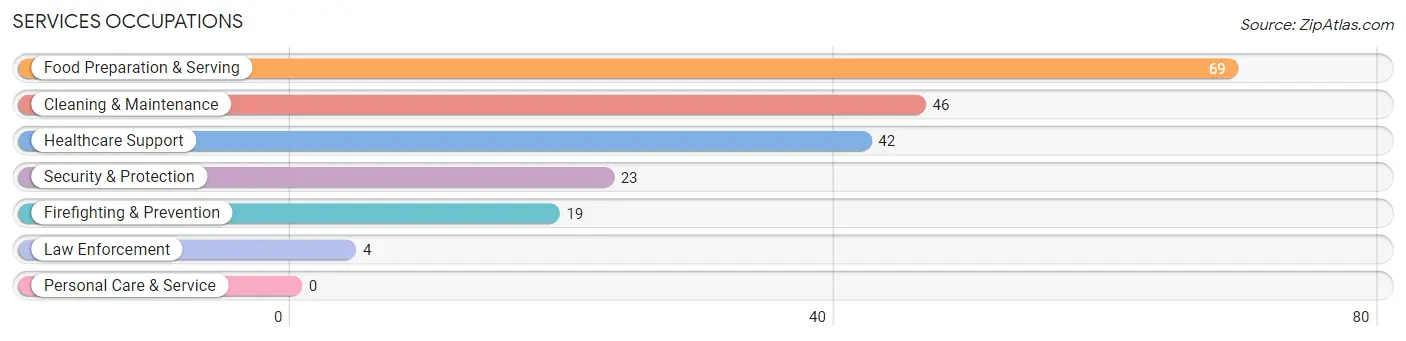
Services Occupations
The most common Services occupations in Pine Ridge are Food Preparation & Serving (69 | 5.8%), Cleaning & Maintenance (46 | 3.9%), Healthcare Support (42 | 3.5%), Security & Protection (23 | 1.9%), and Firefighting & Prevention (19 | 1.6%).
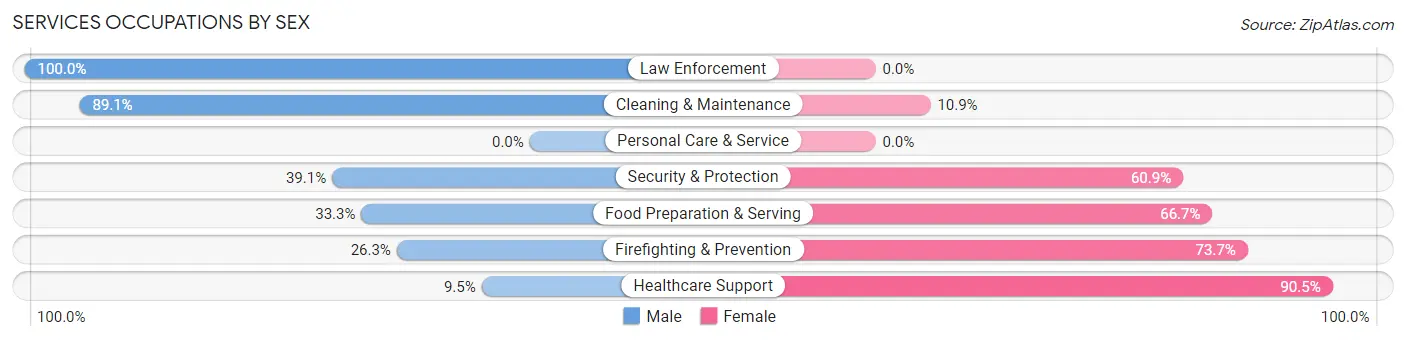
Services Occupations by Sex
Within the Services occupations in Pine Ridge, the most male-oriented occupations are Law Enforcement (100.0%), Cleaning & Maintenance (89.1%), and Security & Protection (39.1%), while the most female-oriented occupations are Healthcare Support (90.5%), Firefighting & Prevention (73.7%), and Food Preparation & Serving (66.7%).
| Occupation | Male | Female |
| Healthcare Support | 4 (9.5%) | 38 (90.5%) |
| Security & Protection | 9 (39.1%) | 14 (60.9%) |
| Firefighting & Prevention | 5 (26.3%) | 14 (73.7%) |
| Law Enforcement | 4 (100.0%) | 0 (0.0%) |
| Food Preparation & Serving | 23 (33.3%) | 46 (66.7%) |
| Cleaning & Maintenance | 41 (89.1%) | 5 (10.9%) |
| Personal Care & Service | 0 (0.0%) | 0 (0.0%) |
| Total (Category) | 77 (42.8%) | 103 (57.2%) |
| Total (Overall) | 703 (59.2%) | 485 (40.8%) |
Sales and Office Occupations
The most common Sales and Office occupations in Pine Ridge are Office & Administration (182 | 15.3%), and Sales & Related (26 | 2.2%).
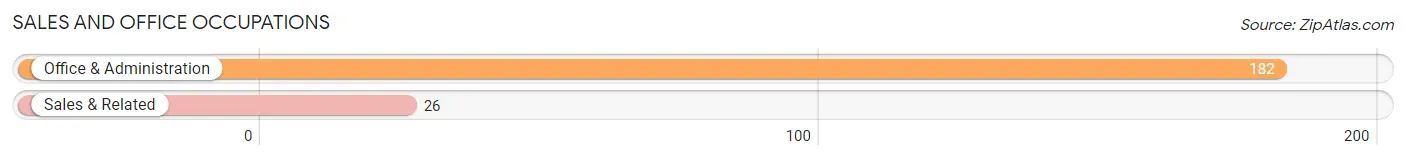
Sales and Office Occupations by Sex

| Occupation | Male | Female |
| Sales & Related | 12 (46.2%) | 14 (53.8%) |
| Office & Administration | 70 (38.5%) | 112 (61.5%) |
| Total (Category) | 82 (39.4%) | 126 (60.6%) |
| Total (Overall) | 703 (59.2%) | 485 (40.8%) |
Natural Resources, Construction and Maintenance Occupations
The most common Natural Resources, Construction and Maintenance occupations in Pine Ridge are Installation, Maintenance & Repair (33 | 2.8%), and Construction & Extraction (24 | 2.0%).

Natural Resources, Construction and Maintenance Occupations by Sex

| Occupation | Male | Female |
| Farming, Fishing & Forestry | 0 (0.0%) | 0 (0.0%) |
| Construction & Extraction | 24 (100.0%) | 0 (0.0%) |
| Installation, Maintenance & Repair | 33 (100.0%) | 0 (0.0%) |
| Total (Category) | 57 (100.0%) | 0 (0.0%) |
| Total (Overall) | 703 (59.2%) | 485 (40.8%) |
Production, Transportation and Moving Occupations
The most common Production, Transportation and Moving occupations in Pine Ridge are Production (104 | 8.7%), Material Moving (61 | 5.1%), and Transportation (28 | 2.4%).
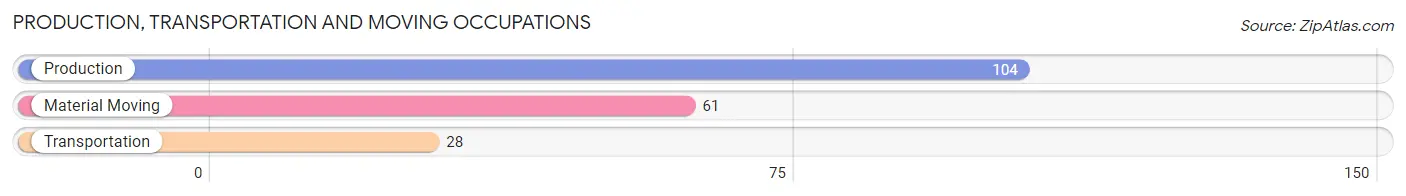
Production, Transportation and Moving Occupations by Sex
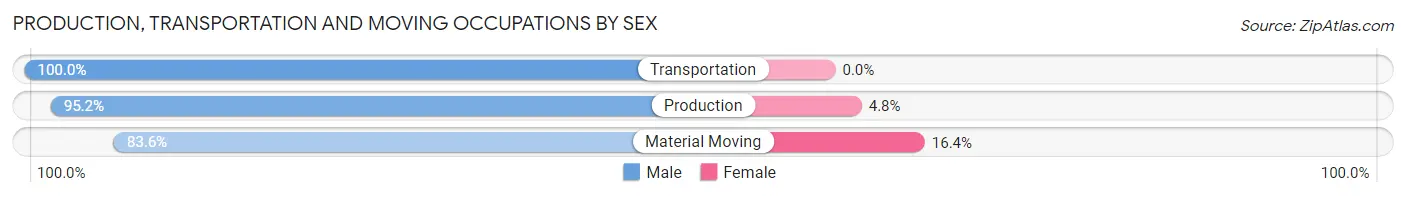
| Occupation | Male | Female |
| Production | 99 (95.2%) | 5 (4.8%) |
| Transportation | 28 (100.0%) | 0 (0.0%) |
| Material Moving | 51 (83.6%) | 10 (16.4%) |
| Total (Category) | 178 (92.2%) | 15 (7.8%) |
| Total (Overall) | 703 (59.2%) | 485 (40.8%) |
Employment Industries by Sex in Pine Ridge
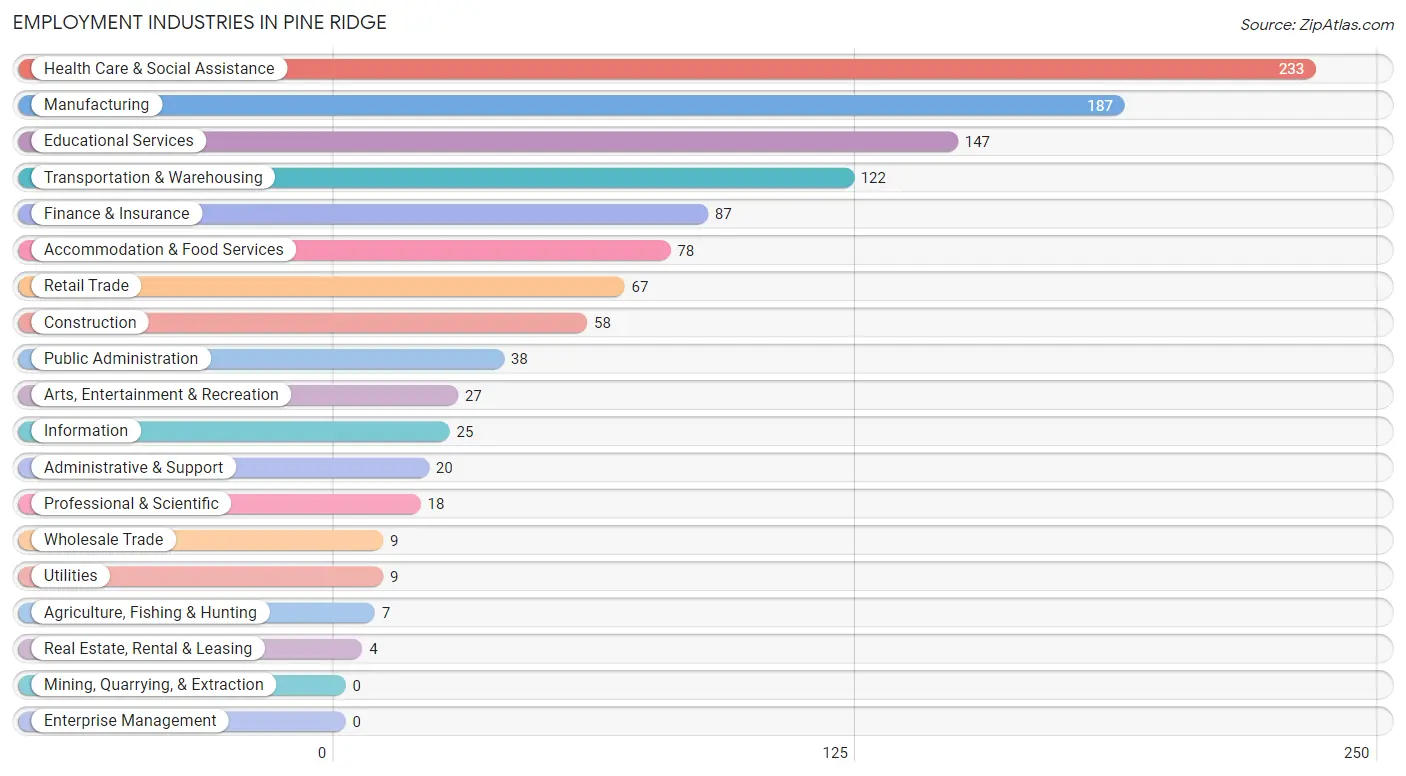
Employment Industries in Pine Ridge
The major employment industries in Pine Ridge include Health Care & Social Assistance (233 | 19.6%), Manufacturing (187 | 15.7%), Educational Services (147 | 12.4%), Transportation & Warehousing (122 | 10.3%), and Finance & Insurance (87 | 7.3%).
Employment Industries by Sex in Pine Ridge
The Pine Ridge industries that see more men than women are Construction (100.0%), Administrative & Support (100.0%), and Transportation & Warehousing (86.9%), whereas the industries that tend to have a higher number of women are Agriculture, Fishing & Hunting (100.0%), Utilities (100.0%), and Real Estate, Rental & Leasing (100.0%).
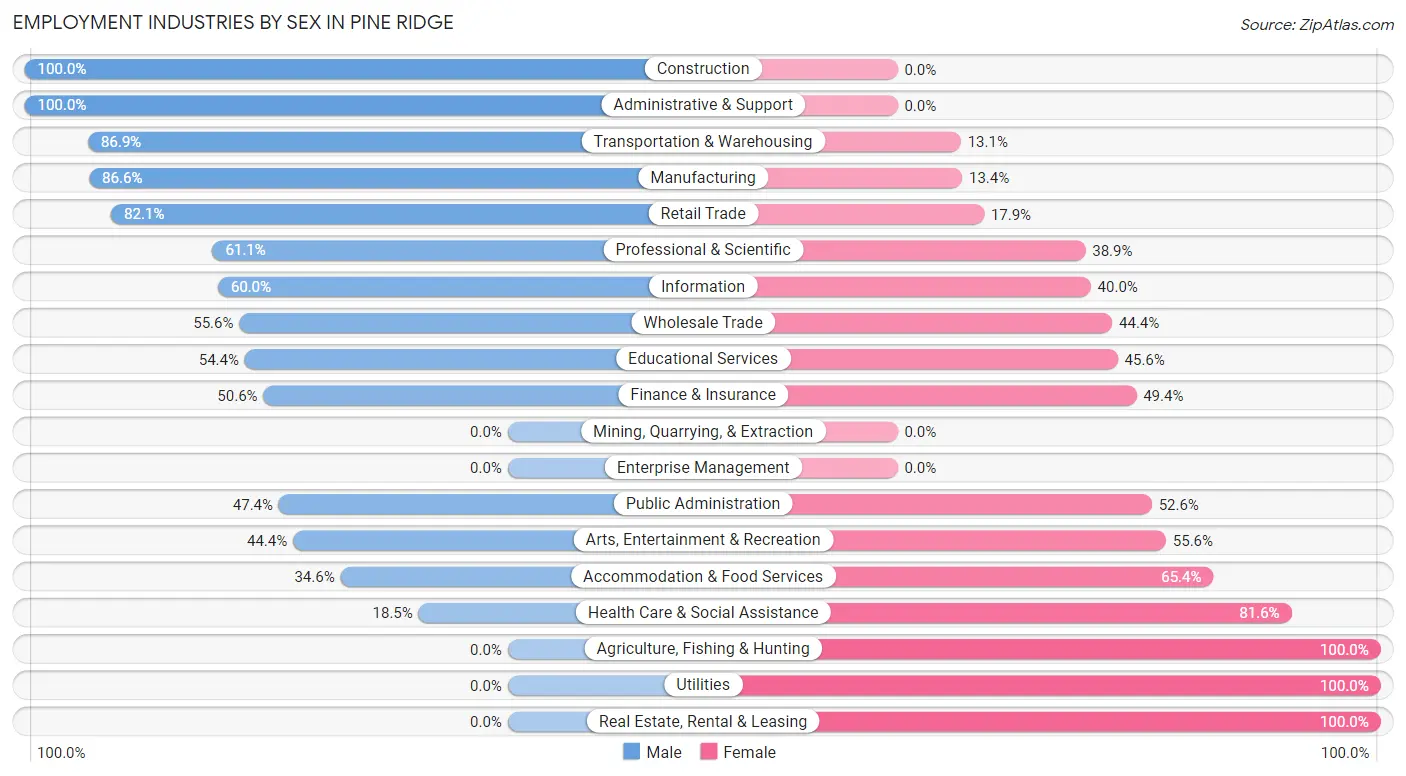
| Industry | Male | Female |
| Agriculture, Fishing & Hunting | 0 (0.0%) | 7 (100.0%) |
| Mining, Quarrying, & Extraction | 0 (0.0%) | 0 (0.0%) |
| Construction | 58 (100.0%) | 0 (0.0%) |
| Manufacturing | 162 (86.6%) | 25 (13.4%) |
| Wholesale Trade | 5 (55.6%) | 4 (44.4%) |
| Retail Trade | 55 (82.1%) | 12 (17.9%) |
| Transportation & Warehousing | 106 (86.9%) | 16 (13.1%) |
| Utilities | 0 (0.0%) | 9 (100.0%) |
| Information | 15 (60.0%) | 10 (40.0%) |
| Finance & Insurance | 44 (50.6%) | 43 (49.4%) |
| Real Estate, Rental & Leasing | 0 (0.0%) | 4 (100.0%) |
| Professional & Scientific | 11 (61.1%) | 7 (38.9%) |
| Enterprise Management | 0 (0.0%) | 0 (0.0%) |
| Administrative & Support | 20 (100.0%) | 0 (0.0%) |
| Educational Services | 80 (54.4%) | 67 (45.6%) |
| Health Care & Social Assistance | 43 (18.4%) | 190 (81.6%) |
| Arts, Entertainment & Recreation | 12 (44.4%) | 15 (55.6%) |
| Accommodation & Food Services | 27 (34.6%) | 51 (65.4%) |
| Public Administration | 18 (47.4%) | 20 (52.6%) |
| Total | 703 (59.2%) | 485 (40.8%) |
Education in Pine Ridge
School Enrollment in Pine Ridge
The most common levels of schooling among the 665 students in Pine Ridge are middle school (197 | 29.6%), elementary school (165 | 24.8%), and college / undergraduate (134 | 20.2%).
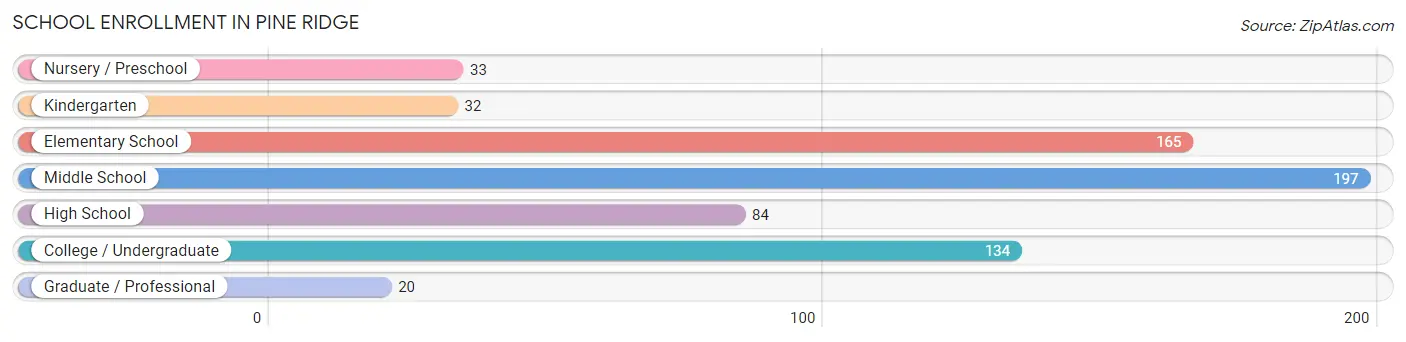
| School Level | # Students | % Students |
| Nursery / Preschool | 33 | 5.0% |
| Kindergarten | 32 | 4.8% |
| Elementary School | 165 | 24.8% |
| Middle School | 197 | 29.6% |
| High School | 84 | 12.6% |
| College / Undergraduate | 134 | 20.2% |
| Graduate / Professional | 20 | 3.0% |
| Total | 665 | 100.0% |
School Enrollment by Age by Funding Source in Pine Ridge
Out of a total of 665 students who are enrolled in schools in Pine Ridge, 41 (6.2%) attend a private institution, while the remaining 624 (93.8%) are enrolled in public schools. The age group of 3 to 4 year olds has the highest likelihood of being enrolled in private schools, with 24 (72.7% in the age bracket) enrolled. Conversely, the age group of 5 to 9 year old has the lowest likelihood of being enrolled in a private school, with 181 (100.0% in the age bracket) attending a public institution.
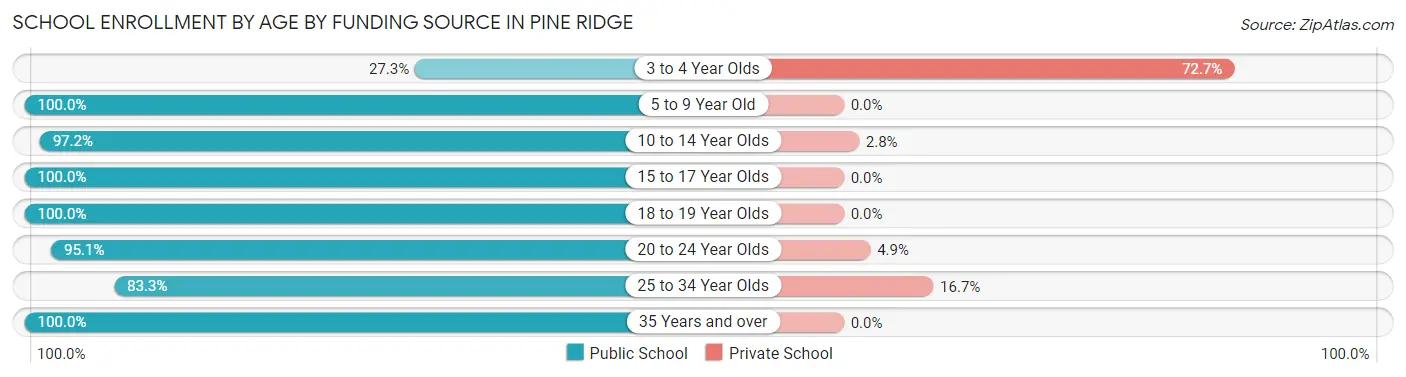
| Age Bracket | Public School | Private School |
| 3 to 4 Year Olds | 9 (27.3%) | 24 (72.7%) |
| 5 to 9 Year Old | 181 (100.0%) | 0 (0.0%) |
| 10 to 14 Year Olds | 207 (97.2%) | 6 (2.8%) |
| 15 to 17 Year Olds | 79 (100.0%) | 0 (0.0%) |
| 18 to 19 Year Olds | 29 (100.0%) | 0 (0.0%) |
| 20 to 24 Year Olds | 77 (95.1%) | 4 (4.9%) |
| 25 to 34 Year Olds | 35 (83.3%) | 7 (16.7%) |
| 35 Years and over | 7 (100.0%) | 0 (0.0%) |
| Total | 624 (93.8%) | 41 (6.2%) |
Educational Attainment by Field of Study in Pine Ridge
Business (100 | 19.7%), education (69 | 13.6%), science & technology (51 | 10.1%), computers & mathematics (47 | 9.3%), and liberal arts & history (42 | 8.3%) are the most common fields of study among 507 individuals in Pine Ridge who have obtained a bachelor's degree or higher.
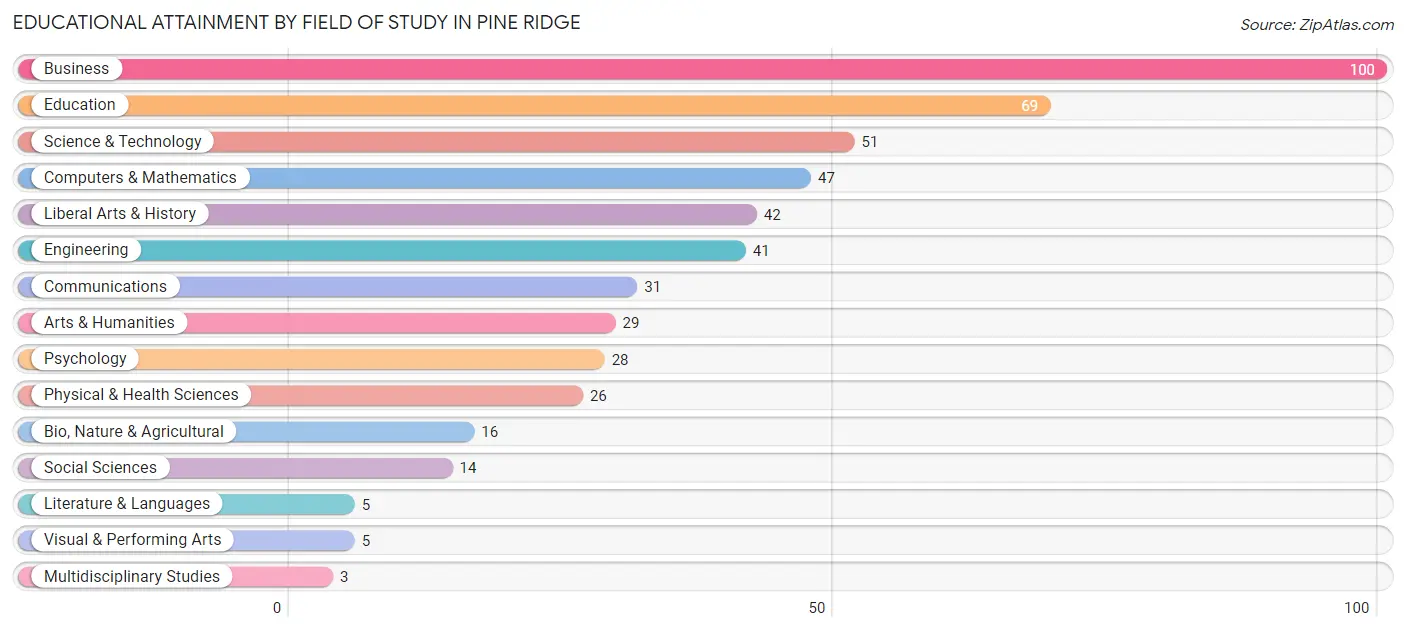
| Field of Study | # Graduates | % Graduates |
| Computers & Mathematics | 47 | 9.3% |
| Bio, Nature & Agricultural | 16 | 3.2% |
| Physical & Health Sciences | 26 | 5.1% |
| Psychology | 28 | 5.5% |
| Social Sciences | 14 | 2.8% |
| Engineering | 41 | 8.1% |
| Multidisciplinary Studies | 3 | 0.6% |
| Science & Technology | 51 | 10.1% |
| Business | 100 | 19.7% |
| Education | 69 | 13.6% |
| Literature & Languages | 5 | 1.0% |
| Liberal Arts & History | 42 | 8.3% |
| Visual & Performing Arts | 5 | 1.0% |
| Communications | 31 | 6.1% |
| Arts & Humanities | 29 | 5.7% |
| Total | 507 | 100.0% |
Transportation & Commute in Pine Ridge
Vehicle Availability by Sex in Pine Ridge
The most prevalent vehicle ownership categories in Pine Ridge are males with 2 vehicles (384, accounting for 58.1%) and females with 2 vehicles (211, making up 79.2%).
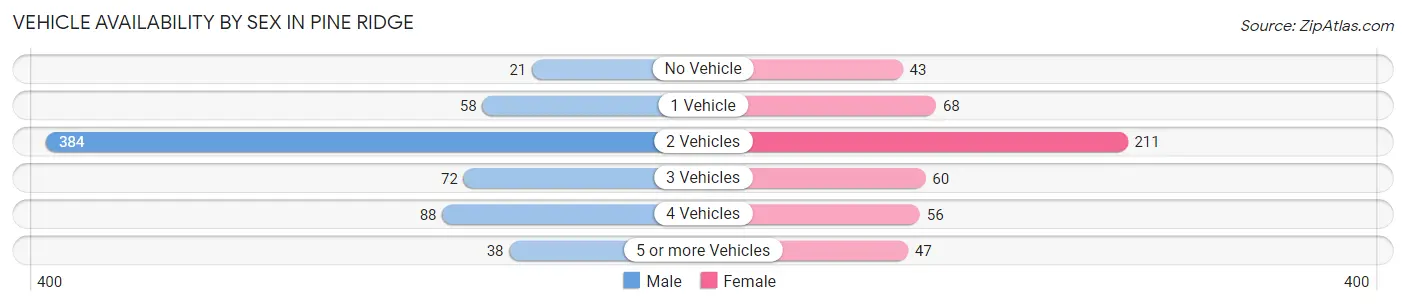
| Vehicles Available | Male | Female |
| No Vehicle | 21 (3.2%) | 43 (8.9%) |
| 1 Vehicle | 58 (8.8%) | 68 (14.0%) |
| 2 Vehicles | 384 (58.1%) | 211 (43.5%) |
| 3 Vehicles | 72 (10.9%) | 60 (12.4%) |
| 4 Vehicles | 88 (13.3%) | 56 (11.6%) |
| 5 or more Vehicles | 38 (5.8%) | 47 (9.7%) |
| Total | 661 (100.0%) | 485 (100.0%) |
Commute Time in Pine Ridge
The most frequently occuring commute durations in Pine Ridge are 15 to 19 minutes (369 commuters, 35.9%), 10 to 14 minutes (155 commuters, 15.1%), and 25 to 29 minutes (151 commuters, 14.7%).
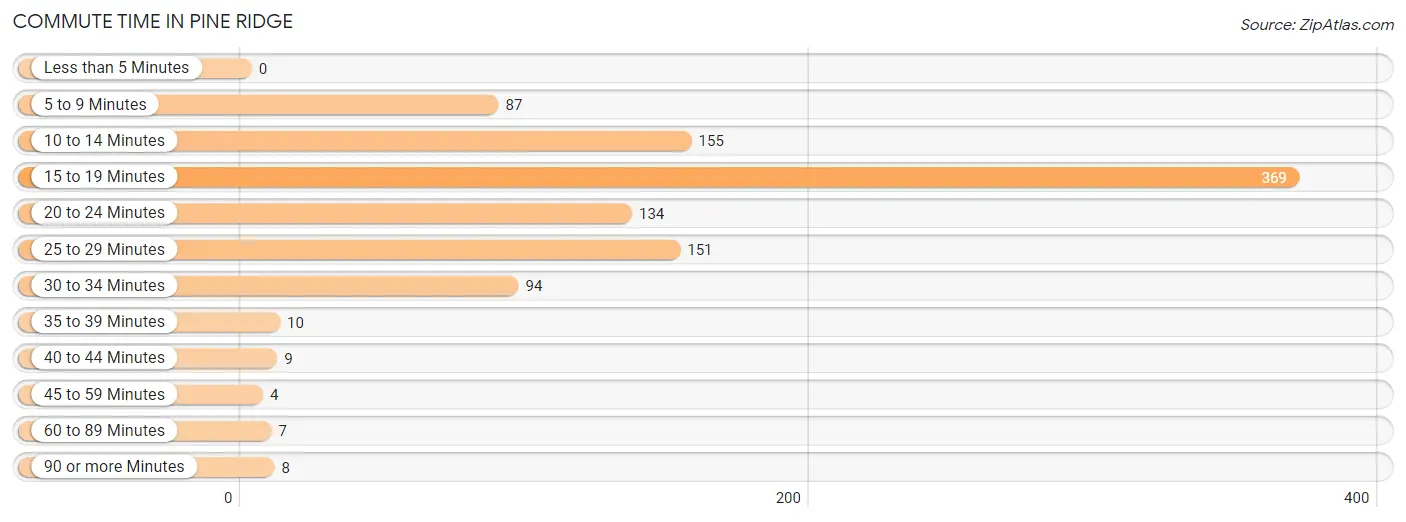
| Commute Time | # Commuters | % Commuters |
| Less than 5 Minutes | 0 | 0.0% |
| 5 to 9 Minutes | 87 | 8.5% |
| 10 to 14 Minutes | 155 | 15.1% |
| 15 to 19 Minutes | 369 | 35.9% |
| 20 to 24 Minutes | 134 | 13.0% |
| 25 to 29 Minutes | 151 | 14.7% |
| 30 to 34 Minutes | 94 | 9.1% |
| 35 to 39 Minutes | 10 | 1.0% |
| 40 to 44 Minutes | 9 | 0.9% |
| 45 to 59 Minutes | 4 | 0.4% |
| 60 to 89 Minutes | 7 | 0.7% |
| 90 or more Minutes | 8 | 0.8% |
Commute Time by Sex in Pine Ridge
The most common commute times in Pine Ridge are 15 to 19 minutes (233 commuters, 38.8%) for males and 15 to 19 minutes (136 commuters, 31.8%) for females.
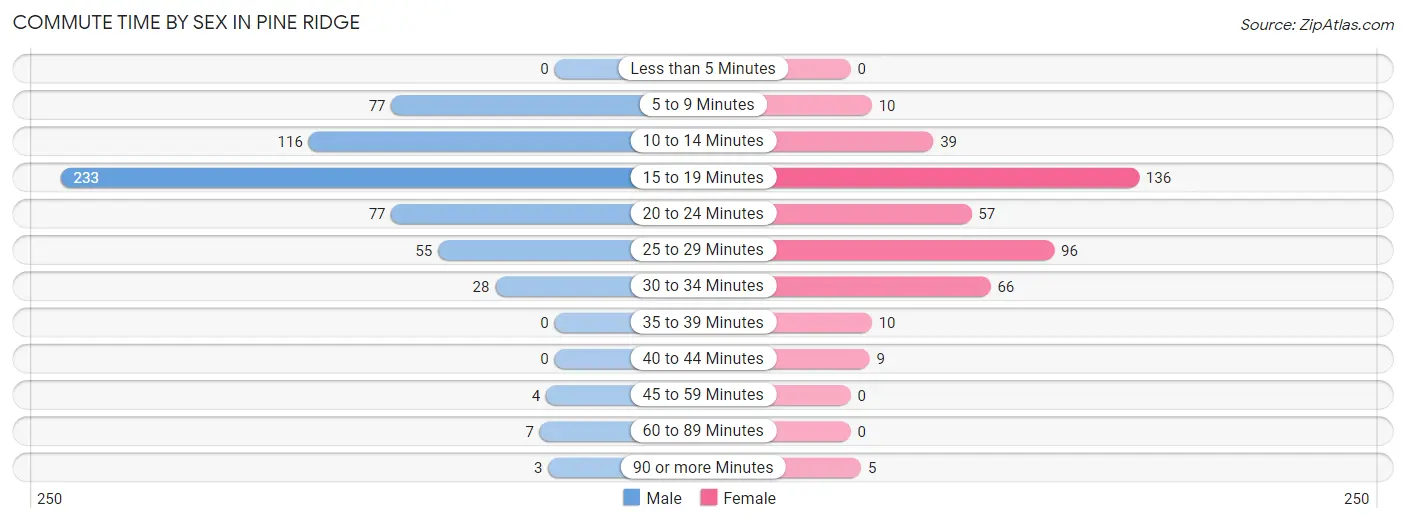
| Commute Time | Male | Female |
| Less than 5 Minutes | 0 (0.0%) | 0 (0.0%) |
| 5 to 9 Minutes | 77 (12.8%) | 10 (2.3%) |
| 10 to 14 Minutes | 116 (19.3%) | 39 (9.1%) |
| 15 to 19 Minutes | 233 (38.8%) | 136 (31.8%) |
| 20 to 24 Minutes | 77 (12.8%) | 57 (13.3%) |
| 25 to 29 Minutes | 55 (9.2%) | 96 (22.4%) |
| 30 to 34 Minutes | 28 (4.7%) | 66 (15.4%) |
| 35 to 39 Minutes | 0 (0.0%) | 10 (2.3%) |
| 40 to 44 Minutes | 0 (0.0%) | 9 (2.1%) |
| 45 to 59 Minutes | 4 (0.7%) | 0 (0.0%) |
| 60 to 89 Minutes | 7 (1.2%) | 0 (0.0%) |
| 90 or more Minutes | 3 (0.5%) | 5 (1.2%) |
Time of Departure to Work by Sex in Pine Ridge
The most frequent times of departure to work in Pine Ridge are 7:00 AM to 7:29 AM (138, 23.0%) for males and 7:30 AM to 7:59 AM (115, 26.9%) for females.
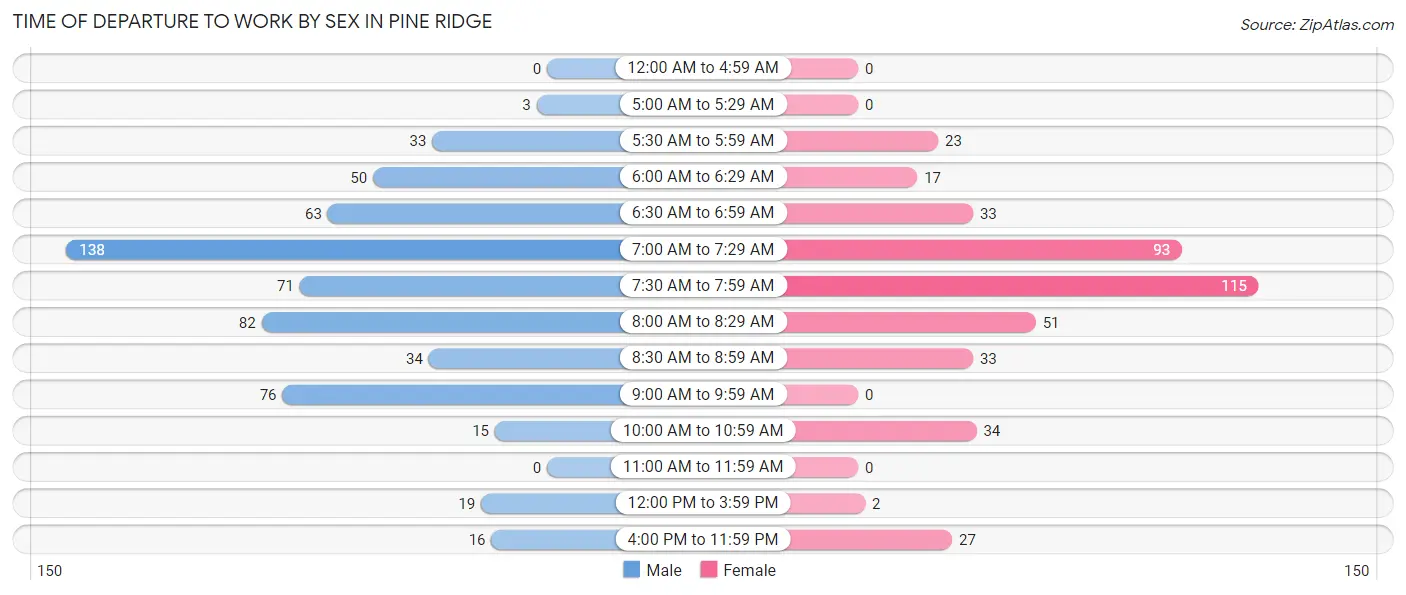
| Time of Departure | Male | Female |
| 12:00 AM to 4:59 AM | 0 (0.0%) | 0 (0.0%) |
| 5:00 AM to 5:29 AM | 3 (0.5%) | 0 (0.0%) |
| 5:30 AM to 5:59 AM | 33 (5.5%) | 23 (5.4%) |
| 6:00 AM to 6:29 AM | 50 (8.3%) | 17 (4.0%) |
| 6:30 AM to 6:59 AM | 63 (10.5%) | 33 (7.7%) |
| 7:00 AM to 7:29 AM | 138 (23.0%) | 93 (21.7%) |
| 7:30 AM to 7:59 AM | 71 (11.8%) | 115 (26.9%) |
| 8:00 AM to 8:29 AM | 82 (13.7%) | 51 (11.9%) |
| 8:30 AM to 8:59 AM | 34 (5.7%) | 33 (7.7%) |
| 9:00 AM to 9:59 AM | 76 (12.7%) | 0 (0.0%) |
| 10:00 AM to 10:59 AM | 15 (2.5%) | 34 (7.9%) |
| 11:00 AM to 11:59 AM | 0 (0.0%) | 0 (0.0%) |
| 12:00 PM to 3:59 PM | 19 (3.2%) | 2 (0.5%) |
| 4:00 PM to 11:59 PM | 16 (2.7%) | 27 (6.3%) |
| Total | 600 (100.0%) | 428 (100.0%) |
Housing Occupancy in Pine Ridge
Occupancy by Ownership in Pine Ridge
Of the total 1,056 dwellings in Pine Ridge, owner-occupied units account for 884 (83.7%), while renter-occupied units make up 172 (16.3%).
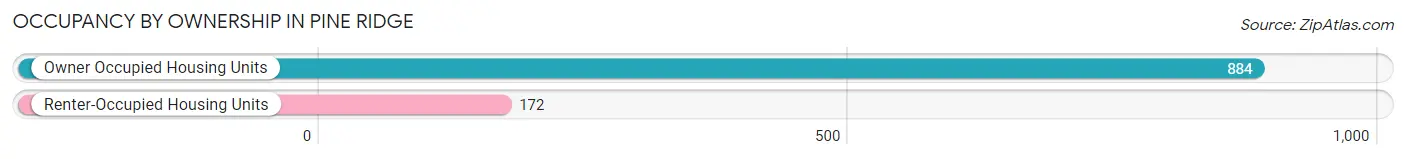
| Occupancy | # Housing Units | % Housing Units |
| Owner Occupied Housing Units | 884 | 83.7% |
| Renter-Occupied Housing Units | 172 | 16.3% |
| Total Occupied Housing Units | 1,056 | 100.0% |
Occupancy by Household Size in Pine Ridge
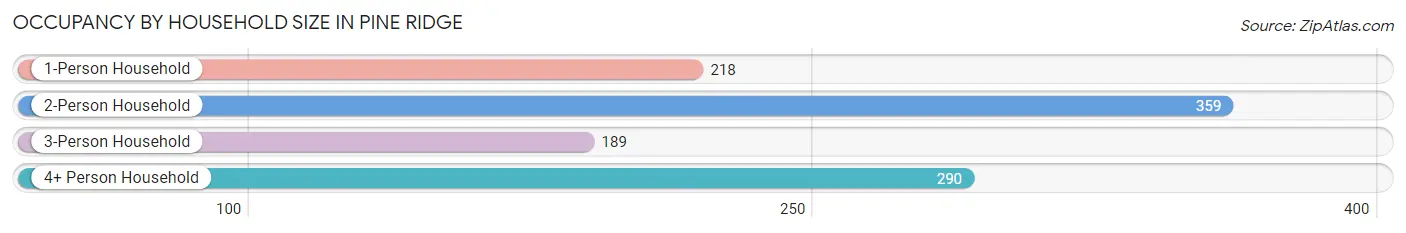
| Household Size | # Housing Units | % Housing Units |
| 1-Person Household | 218 | 20.6% |
| 2-Person Household | 359 | 34.0% |
| 3-Person Household | 189 | 17.9% |
| 4+ Person Household | 290 | 27.5% |
| Total Housing Units | 1,056 | 100.0% |
Occupancy by Ownership by Household Size in Pine Ridge
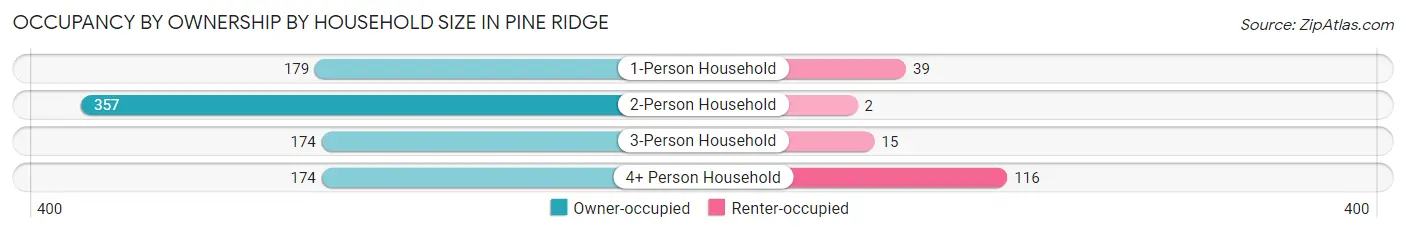
| Household Size | Owner-occupied | Renter-occupied |
| 1-Person Household | 179 (82.1%) | 39 (17.9%) |
| 2-Person Household | 357 (99.4%) | 2 (0.6%) |
| 3-Person Household | 174 (92.1%) | 15 (7.9%) |
| 4+ Person Household | 174 (60.0%) | 116 (40.0%) |
| Total Housing Units | 884 (83.7%) | 172 (16.3%) |
Occupancy by Educational Attainment in Pine Ridge
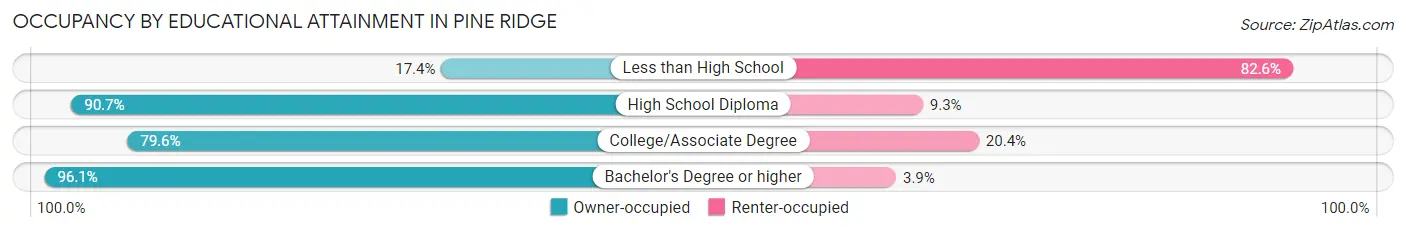
| Household Size | Owner-occupied | Renter-occupied |
| Less than High School | 8 (17.4%) | 38 (82.6%) |
| High School Diploma | 245 (90.7%) | 25 (9.3%) |
| College/Associate Degree | 387 (79.6%) | 99 (20.4%) |
| Bachelor's Degree or higher | 244 (96.1%) | 10 (3.9%) |
Occupancy by Age of Householder in Pine Ridge
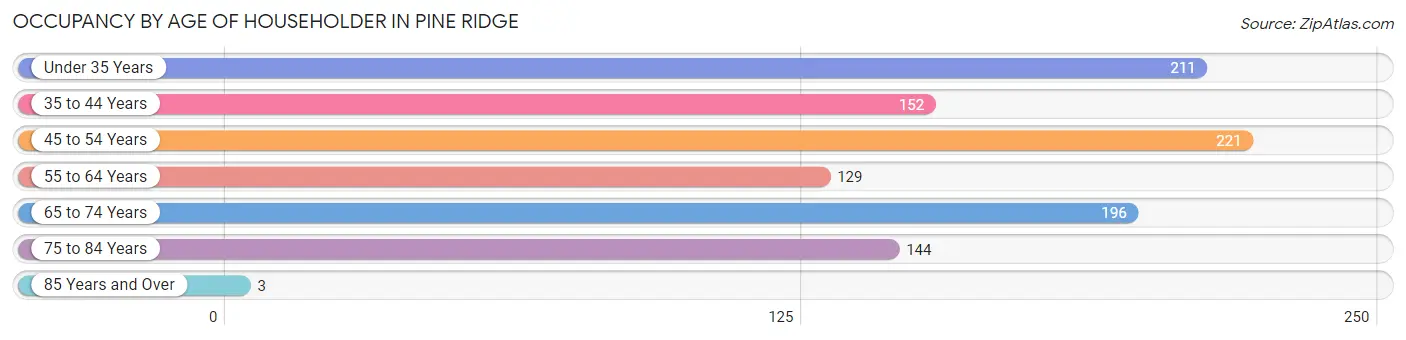
| Age Bracket | # Households | % Households |
| Under 35 Years | 211 | 20.0% |
| 35 to 44 Years | 152 | 14.4% |
| 45 to 54 Years | 221 | 20.9% |
| 55 to 64 Years | 129 | 12.2% |
| 65 to 74 Years | 196 | 18.6% |
| 75 to 84 Years | 144 | 13.6% |
| 85 Years and Over | 3 | 0.3% |
| Total | 1,056 | 100.0% |
Housing Finances in Pine Ridge
Median Income by Occupancy in Pine Ridge
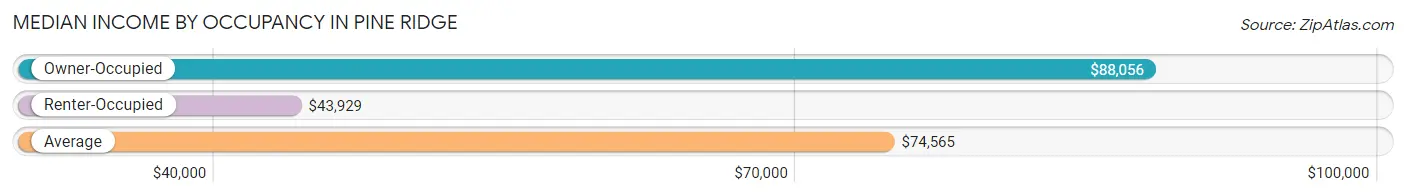
| Occupancy Type | # Households | Median Income |
| Owner-Occupied | 884 (83.7%) | $88,056 |
| Renter-Occupied | 172 (16.3%) | $43,929 |
| Average | 1,056 (100.0%) | $74,565 |
Occupancy by Householder Income Bracket in Pine Ridge
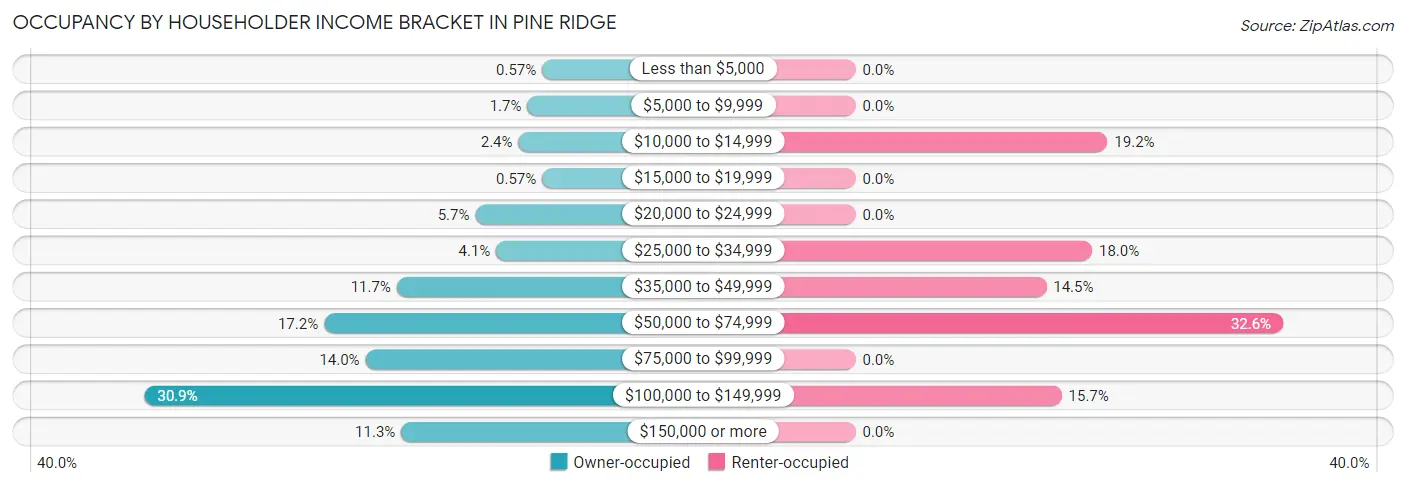
| Income Bracket | Owner-occupied | Renter-occupied |
| Less than $5,000 | 5 (0.6%) | 0 (0.0%) |
| $5,000 to $9,999 | 15 (1.7%) | 0 (0.0%) |
| $10,000 to $14,999 | 21 (2.4%) | 33 (19.2%) |
| $15,000 to $19,999 | 5 (0.6%) | 0 (0.0%) |
| $20,000 to $24,999 | 50 (5.7%) | 0 (0.0%) |
| $25,000 to $34,999 | 36 (4.1%) | 31 (18.0%) |
| $35,000 to $49,999 | 103 (11.7%) | 25 (14.5%) |
| $50,000 to $74,999 | 152 (17.2%) | 56 (32.6%) |
| $75,000 to $99,999 | 124 (14.0%) | 0 (0.0%) |
| $100,000 to $149,999 | 273 (30.9%) | 27 (15.7%) |
| $150,000 or more | 100 (11.3%) | 0 (0.0%) |
| Total | 884 (100.0%) | 172 (100.0%) |
Monthly Housing Cost Tiers in Pine Ridge
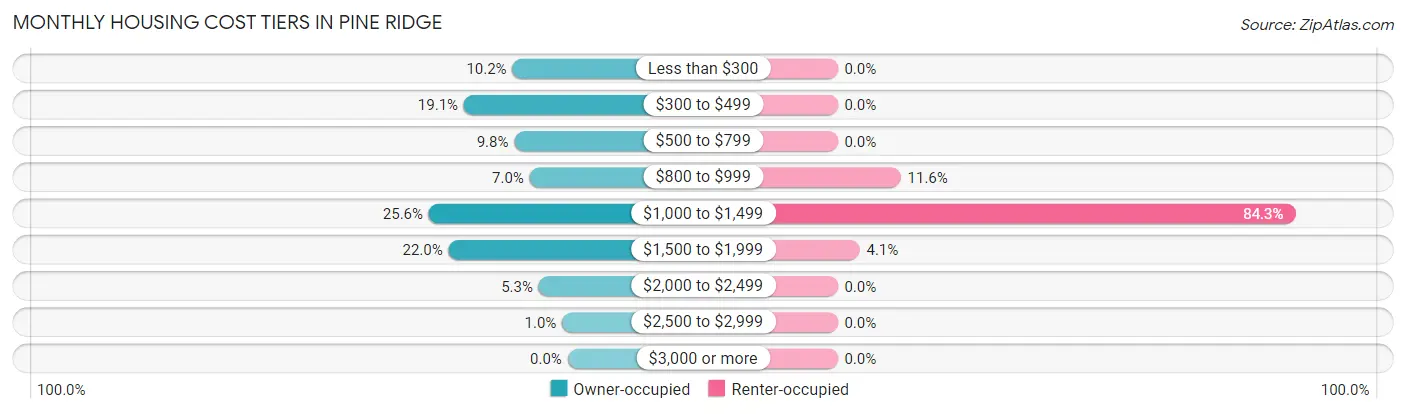
| Monthly Cost | Owner-occupied | Renter-occupied |
| Less than $300 | 90 (10.2%) | 0 (0.0%) |
| $300 to $499 | 169 (19.1%) | 0 (0.0%) |
| $500 to $799 | 87 (9.8%) | 0 (0.0%) |
| $800 to $999 | 62 (7.0%) | 20 (11.6%) |
| $1,000 to $1,499 | 226 (25.6%) | 145 (84.3%) |
| $1,500 to $1,999 | 194 (22.0%) | 7 (4.1%) |
| $2,000 to $2,499 | 47 (5.3%) | 0 (0.0%) |
| $2,500 to $2,999 | 9 (1.0%) | 0 (0.0%) |
| $3,000 or more | 0 (0.0%) | 0 (0.0%) |
| Total | 884 (100.0%) | 172 (100.0%) |
Physical Housing Characteristics in Pine Ridge
Housing Structures in Pine Ridge
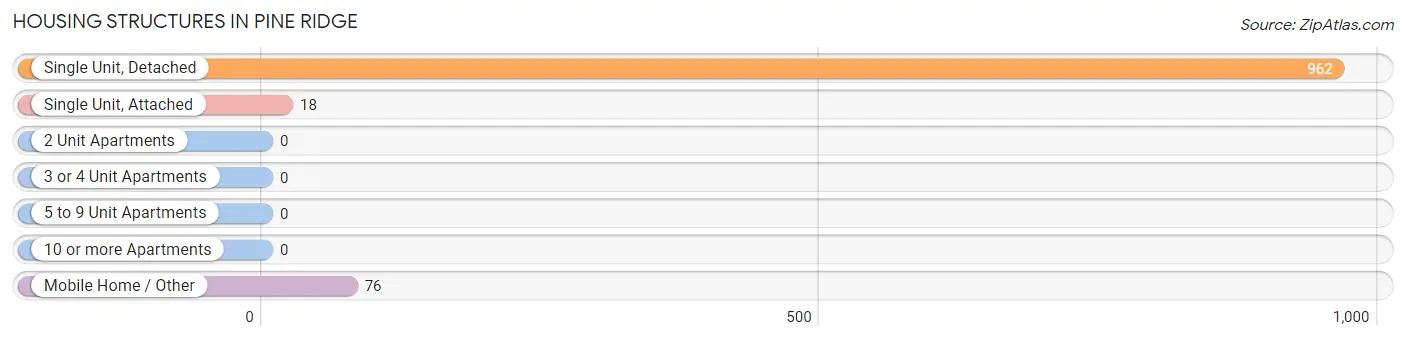
| Structure Type | # Housing Units | % Housing Units |
| Single Unit, Detached | 962 | 91.1% |
| Single Unit, Attached | 18 | 1.7% |
| 2 Unit Apartments | 0 | 0.0% |
| 3 or 4 Unit Apartments | 0 | 0.0% |
| 5 to 9 Unit Apartments | 0 | 0.0% |
| 10 or more Apartments | 0 | 0.0% |
| Mobile Home / Other | 76 | 7.2% |
| Total | 1,056 | 100.0% |
Housing Structures by Occupancy in Pine Ridge
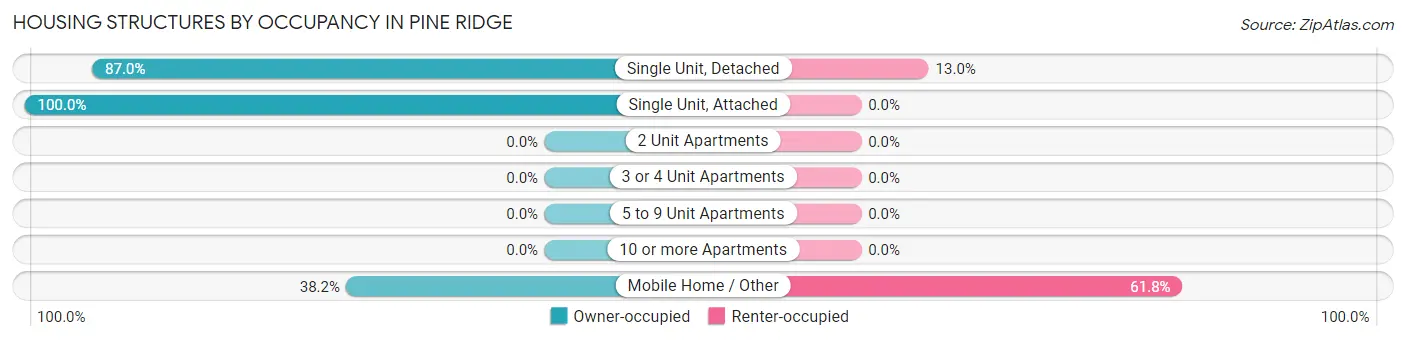
| Structure Type | Owner-occupied | Renter-occupied |
| Single Unit, Detached | 837 (87.0%) | 125 (13.0%) |
| Single Unit, Attached | 18 (100.0%) | 0 (0.0%) |
| 2 Unit Apartments | 0 (0.0%) | 0 (0.0%) |
| 3 or 4 Unit Apartments | 0 (0.0%) | 0 (0.0%) |
| 5 to 9 Unit Apartments | 0 (0.0%) | 0 (0.0%) |
| 10 or more Apartments | 0 (0.0%) | 0 (0.0%) |
| Mobile Home / Other | 29 (38.2%) | 47 (61.8%) |
| Total | 884 (83.7%) | 172 (16.3%) |
Housing Structures by Number of Rooms in Pine Ridge
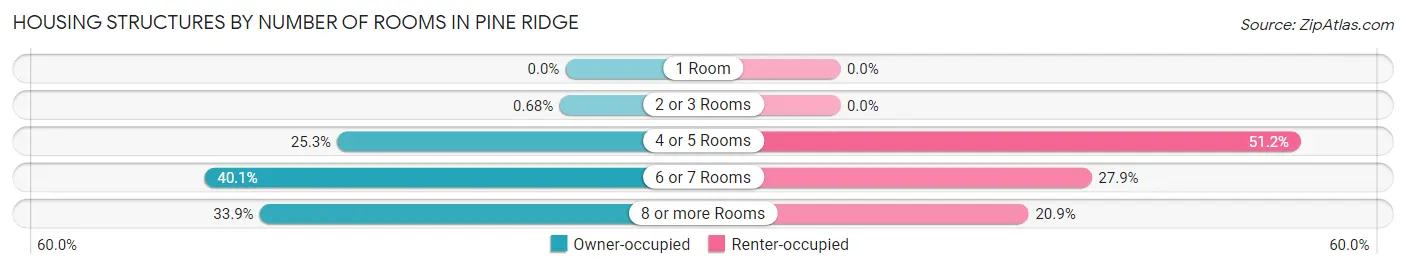
| Number of Rooms | Owner-occupied | Renter-occupied |
| 1 Room | 0 (0.0%) | 0 (0.0%) |
| 2 or 3 Rooms | 6 (0.7%) | 0 (0.0%) |
| 4 or 5 Rooms | 224 (25.3%) | 88 (51.2%) |
| 6 or 7 Rooms | 354 (40.1%) | 48 (27.9%) |
| 8 or more Rooms | 300 (33.9%) | 36 (20.9%) |
| Total | 884 (100.0%) | 172 (100.0%) |
Housing Structure by Heating Type in Pine Ridge
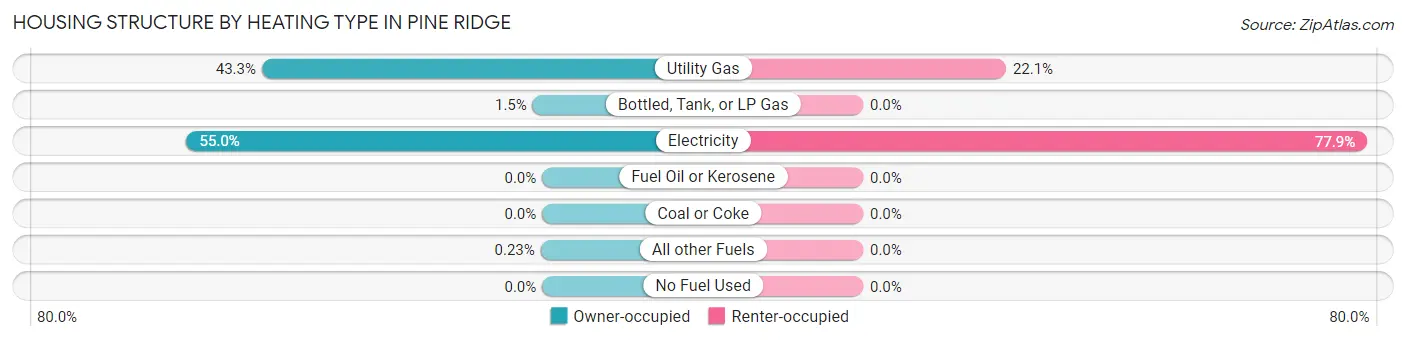
| Heating Type | Owner-occupied | Renter-occupied |
| Utility Gas | 383 (43.3%) | 38 (22.1%) |
| Bottled, Tank, or LP Gas | 13 (1.5%) | 0 (0.0%) |
| Electricity | 486 (55.0%) | 134 (77.9%) |
| Fuel Oil or Kerosene | 0 (0.0%) | 0 (0.0%) |
| Coal or Coke | 0 (0.0%) | 0 (0.0%) |
| All other Fuels | 2 (0.2%) | 0 (0.0%) |
| No Fuel Used | 0 (0.0%) | 0 (0.0%) |
| Total | 884 (100.0%) | 172 (100.0%) |
Household Vehicle Usage in Pine Ridge
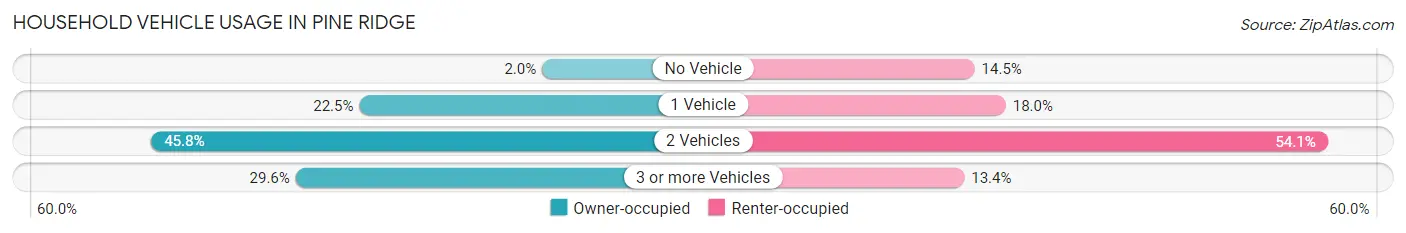
| Vehicles per Household | Owner-occupied | Renter-occupied |
| No Vehicle | 18 (2.0%) | 25 (14.5%) |
| 1 Vehicle | 199 (22.5%) | 31 (18.0%) |
| 2 Vehicles | 405 (45.8%) | 93 (54.1%) |
| 3 or more Vehicles | 262 (29.6%) | 23 (13.4%) |
| Total | 884 (100.0%) | 172 (100.0%) |
Real Estate & Mortgages in Pine Ridge
Real Estate and Mortgage Overview in Pine Ridge
| Characteristic | Without Mortgage | With Mortgage |
| Housing Units | 305 | 579 |
| Median Property Value | $187,300 | $226,400 |
| Median Household Income | $50,764 | $85 |
| Monthly Housing Costs | $368 | $0 |
| Real Estate Taxes | $733 | $43 |
Property Value by Mortgage Status in Pine Ridge
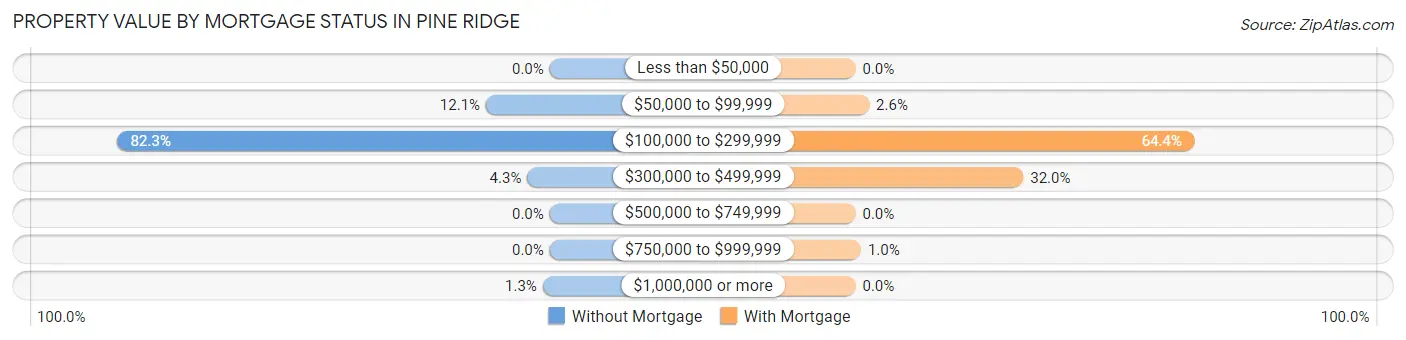
| Property Value | Without Mortgage | With Mortgage |
| Less than $50,000 | 0 (0.0%) | 0 (0.0%) |
| $50,000 to $99,999 | 37 (12.1%) | 15 (2.6%) |
| $100,000 to $299,999 | 251 (82.3%) | 373 (64.4%) |
| $300,000 to $499,999 | 13 (4.3%) | 185 (32.0%) |
| $500,000 to $749,999 | 0 (0.0%) | 0 (0.0%) |
| $750,000 to $999,999 | 0 (0.0%) | 6 (1.0%) |
| $1,000,000 or more | 4 (1.3%) | 0 (0.0%) |
| Total | 305 (100.0%) | 579 (100.0%) |
Household Income by Mortgage Status in Pine Ridge
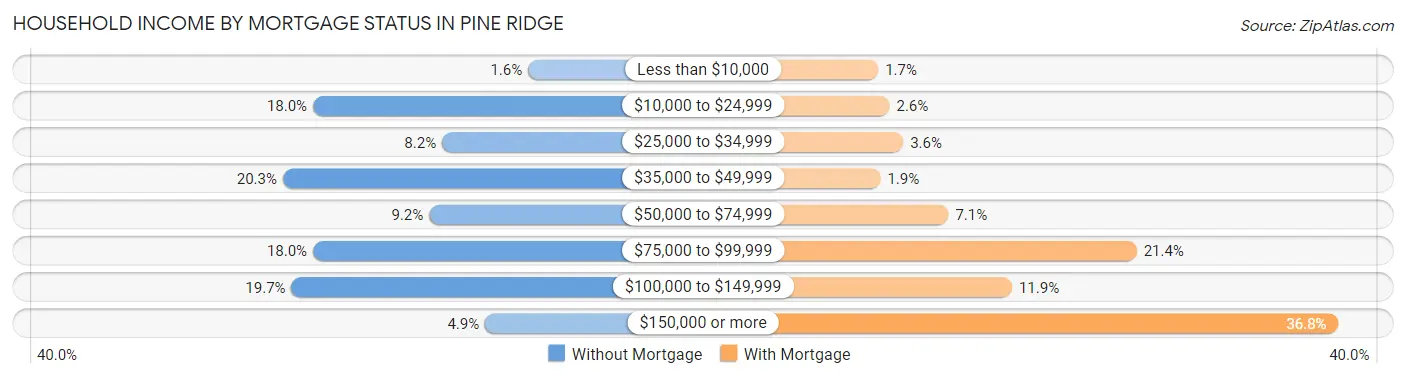
| Household Income | Without Mortgage | With Mortgage |
| Less than $10,000 | 5 (1.6%) | 10 (1.7%) |
| $10,000 to $24,999 | 55 (18.0%) | 15 (2.6%) |
| $25,000 to $34,999 | 25 (8.2%) | 21 (3.6%) |
| $35,000 to $49,999 | 62 (20.3%) | 11 (1.9%) |
| $50,000 to $74,999 | 28 (9.2%) | 41 (7.1%) |
| $75,000 to $99,999 | 55 (18.0%) | 124 (21.4%) |
| $100,000 to $149,999 | 60 (19.7%) | 69 (11.9%) |
| $150,000 or more | 15 (4.9%) | 213 (36.8%) |
| Total | 305 (100.0%) | 579 (100.0%) |
Property Value to Household Income Ratio in Pine Ridge
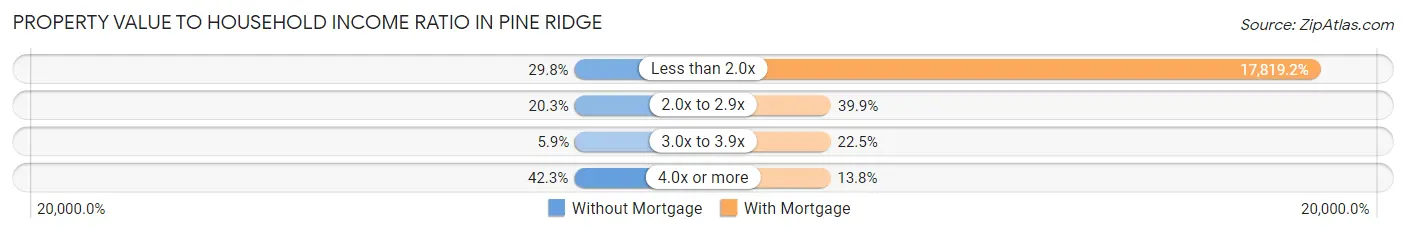
| Value-to-Income Ratio | Without Mortgage | With Mortgage |
| Less than 2.0x | 91 (29.8%) | 103,173 (17,819.2%) |
| 2.0x to 2.9x | 62 (20.3%) | 231 (39.9%) |
| 3.0x to 3.9x | 18 (5.9%) | 130 (22.5%) |
| 4.0x or more | 129 (42.3%) | 80 (13.8%) |
| Total | 305 (100.0%) | 579 (100.0%) |
Real Estate Taxes by Mortgage Status in Pine Ridge
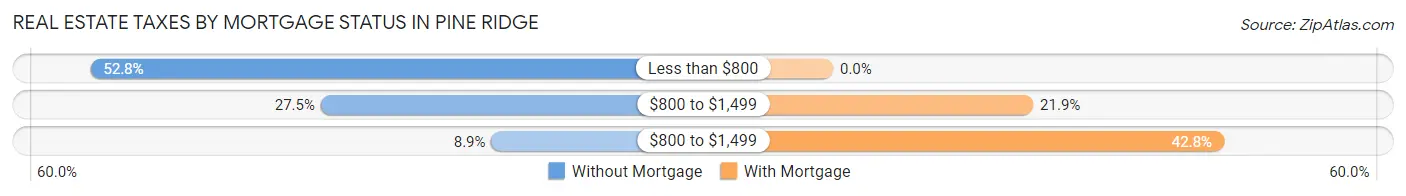
| Property Taxes | Without Mortgage | With Mortgage |
| Less than $800 | 161 (52.8%) | 0 (0.0%) |
| $800 to $1,499 | 84 (27.5%) | 127 (21.9%) |
| $800 to $1,499 | 27 (8.8%) | 248 (42.8%) |
| Total | 305 (100.0%) | 579 (100.0%) |
Health & Disability in Pine Ridge
Health Insurance Coverage by Age in Pine Ridge
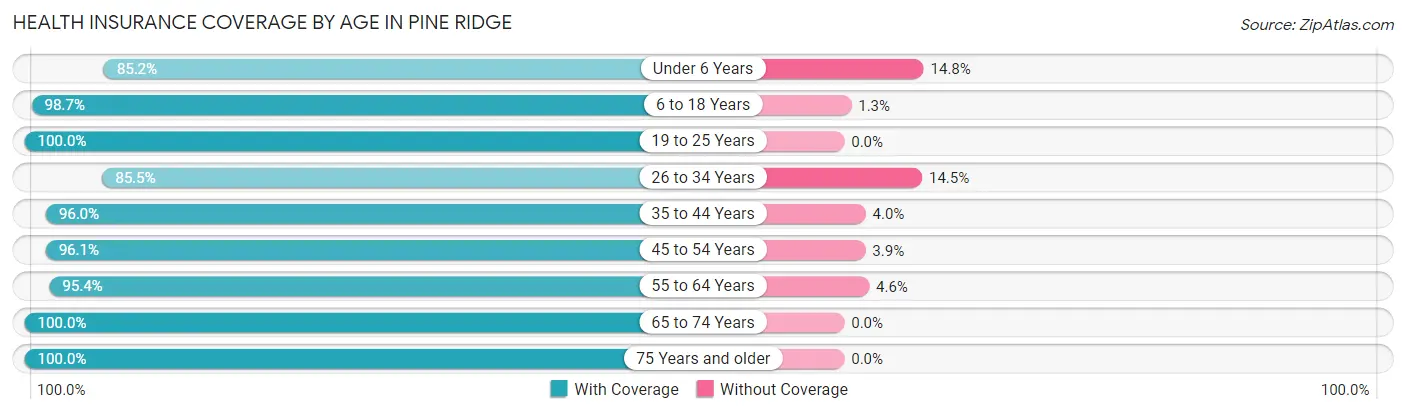
| Age Bracket | With Coverage | Without Coverage |
| Under 6 Years | 144 (85.2%) | 25 (14.8%) |
| 6 to 18 Years | 457 (98.7%) | 6 (1.3%) |
| 19 to 25 Years | 220 (100.0%) | 0 (0.0%) |
| 26 to 34 Years | 289 (85.5%) | 49 (14.5%) |
| 35 to 44 Years | 339 (96.0%) | 14 (4.0%) |
| 45 to 54 Years | 341 (96.1%) | 14 (3.9%) |
| 55 to 64 Years | 247 (95.4%) | 12 (4.6%) |
| 65 to 74 Years | 300 (100.0%) | 0 (0.0%) |
| 75 Years and older | 230 (100.0%) | 0 (0.0%) |
| Total | 2,567 (95.5%) | 120 (4.5%) |
Health Insurance Coverage by Citizenship Status in Pine Ridge
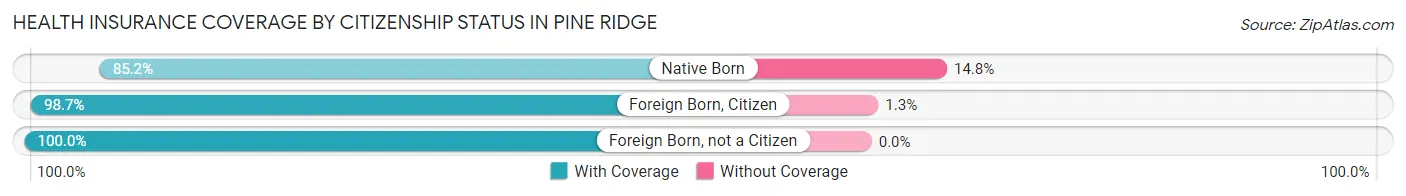
| Citizenship Status | With Coverage | Without Coverage |
| Native Born | 144 (85.2%) | 25 (14.8%) |
| Foreign Born, Citizen | 457 (98.7%) | 6 (1.3%) |
| Foreign Born, not a Citizen | 220 (100.0%) | 0 (0.0%) |
Health Insurance Coverage by Household Income in Pine Ridge
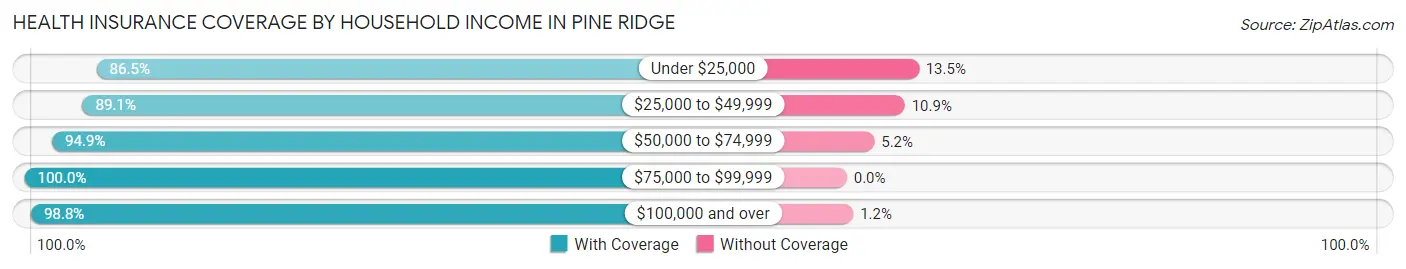
| Household Income | With Coverage | Without Coverage |
| Under $25,000 | 122 (86.5%) | 19 (13.5%) |
| $25,000 to $49,999 | 476 (89.1%) | 58 (10.9%) |
| $50,000 to $74,999 | 534 (94.9%) | 29 (5.1%) |
| $75,000 to $99,999 | 284 (100.0%) | 0 (0.0%) |
| $100,000 and over | 1,151 (98.8%) | 14 (1.2%) |
Public vs Private Health Insurance Coverage by Age in Pine Ridge
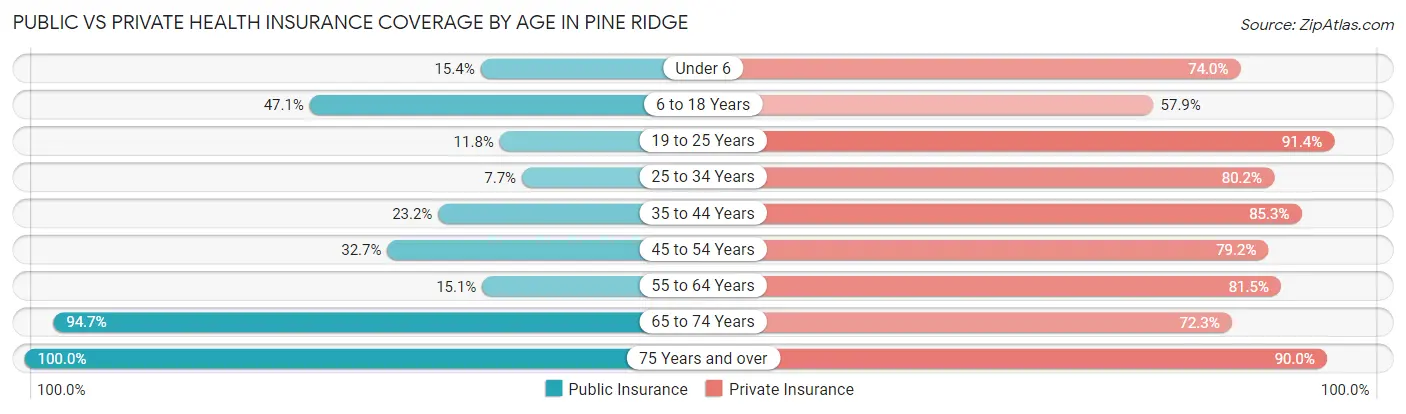
| Age Bracket | Public Insurance | Private Insurance |
| Under 6 | 26 (15.4%) | 125 (74.0%) |
| 6 to 18 Years | 218 (47.1%) | 268 (57.9%) |
| 19 to 25 Years | 26 (11.8%) | 201 (91.4%) |
| 25 to 34 Years | 26 (7.7%) | 271 (80.2%) |
| 35 to 44 Years | 82 (23.2%) | 301 (85.3%) |
| 45 to 54 Years | 116 (32.7%) | 281 (79.1%) |
| 55 to 64 Years | 39 (15.1%) | 211 (81.5%) |
| 65 to 74 Years | 284 (94.7%) | 217 (72.3%) |
| 75 Years and over | 230 (100.0%) | 207 (90.0%) |
| Total | 1,047 (39.0%) | 2,082 (77.5%) |
Disability Status by Sex by Age in Pine Ridge
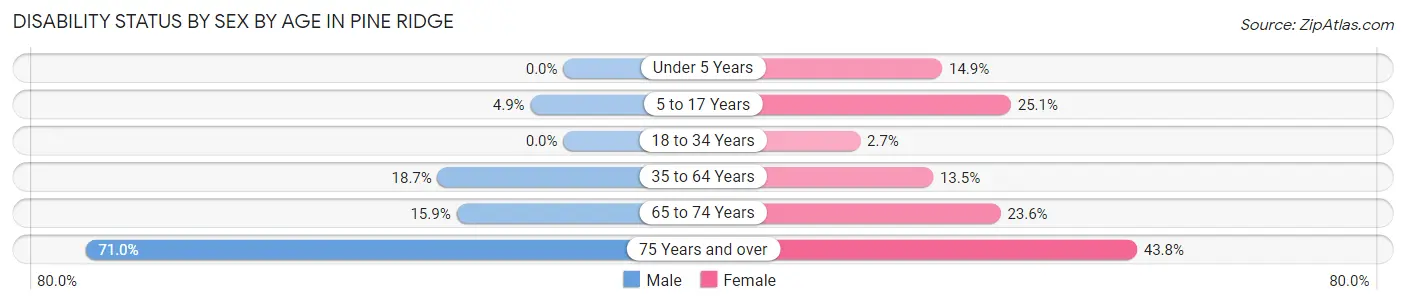
| Age Bracket | Male | Female |
| Under 5 Years | 0 (0.0%) | 7 (14.9%) |
| 5 to 17 Years | 11 (4.9%) | 64 (25.1%) |
| 18 to 34 Years | 0 (0.0%) | 7 (2.7%) |
| 35 to 64 Years | 84 (18.7%) | 70 (13.5%) |
| 65 to 74 Years | 20 (15.9%) | 41 (23.6%) |
| 75 Years and over | 66 (71.0%) | 60 (43.8%) |
Disability Class by Sex by Age in Pine Ridge
Disability Class: Hearing Difficulty
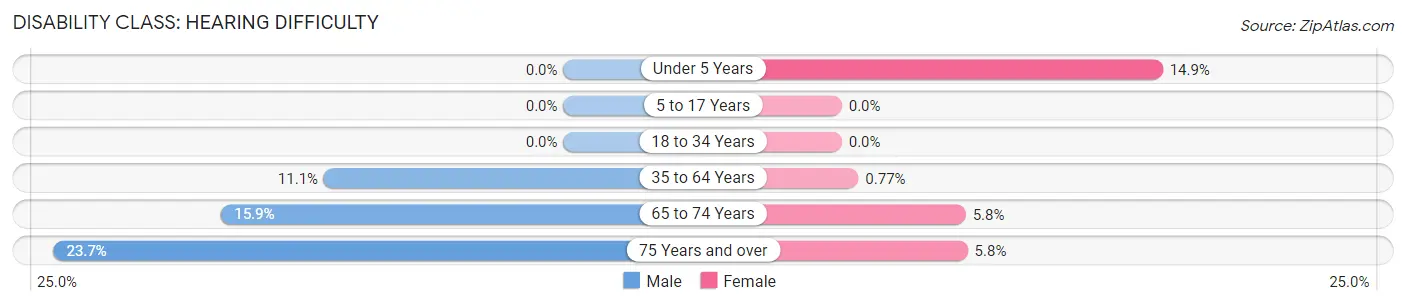
| Age Bracket | Male | Female |
| Under 5 Years | 0 (0.0%) | 7 (14.9%) |
| 5 to 17 Years | 0 (0.0%) | 0 (0.0%) |
| 18 to 34 Years | 0 (0.0%) | 0 (0.0%) |
| 35 to 64 Years | 50 (11.1%) | 4 (0.8%) |
| 65 to 74 Years | 20 (15.9%) | 10 (5.8%) |
| 75 Years and over | 22 (23.7%) | 8 (5.8%) |
Disability Class: Vision Difficulty
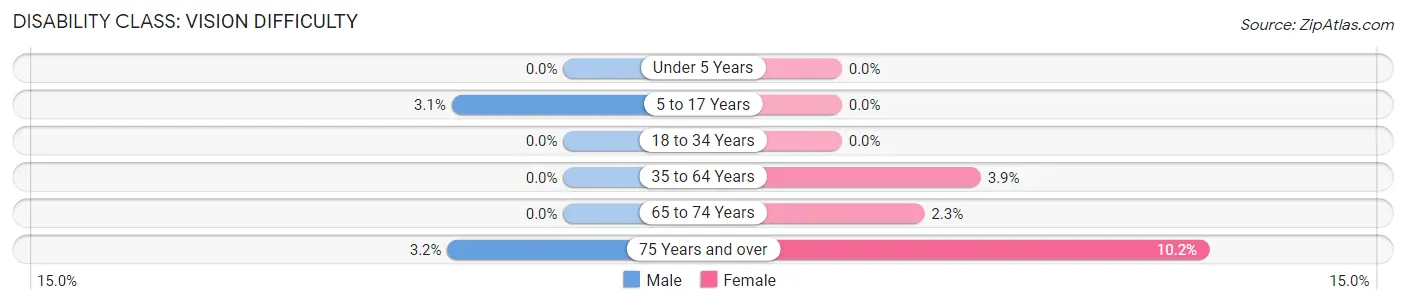
| Age Bracket | Male | Female |
| Under 5 Years | 0 (0.0%) | 0 (0.0%) |
| 5 to 17 Years | 7 (3.1%) | 0 (0.0%) |
| 18 to 34 Years | 0 (0.0%) | 0 (0.0%) |
| 35 to 64 Years | 0 (0.0%) | 20 (3.9%) |
| 65 to 74 Years | 0 (0.0%) | 4 (2.3%) |
| 75 Years and over | 3 (3.2%) | 14 (10.2%) |
Disability Class: Cognitive Difficulty
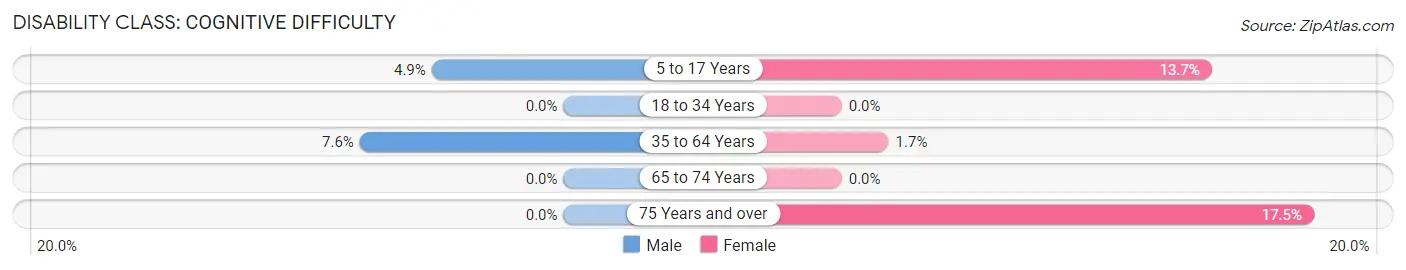
| Age Bracket | Male | Female |
| 5 to 17 Years | 11 (4.9%) | 35 (13.7%) |
| 18 to 34 Years | 0 (0.0%) | 0 (0.0%) |
| 35 to 64 Years | 34 (7.6%) | 9 (1.7%) |
| 65 to 74 Years | 0 (0.0%) | 0 (0.0%) |
| 75 Years and over | 0 (0.0%) | 24 (17.5%) |
Disability Class: Ambulatory Difficulty
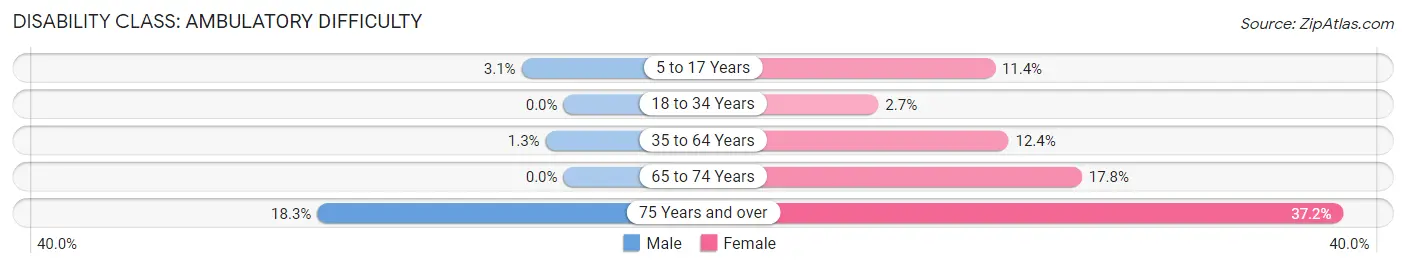
| Age Bracket | Male | Female |
| 5 to 17 Years | 7 (3.1%) | 29 (11.4%) |
| 18 to 34 Years | 0 (0.0%) | 7 (2.7%) |
| 35 to 64 Years | 6 (1.3%) | 64 (12.4%) |
| 65 to 74 Years | 0 (0.0%) | 31 (17.8%) |
| 75 Years and over | 17 (18.3%) | 51 (37.2%) |
Disability Class: Self-Care Difficulty
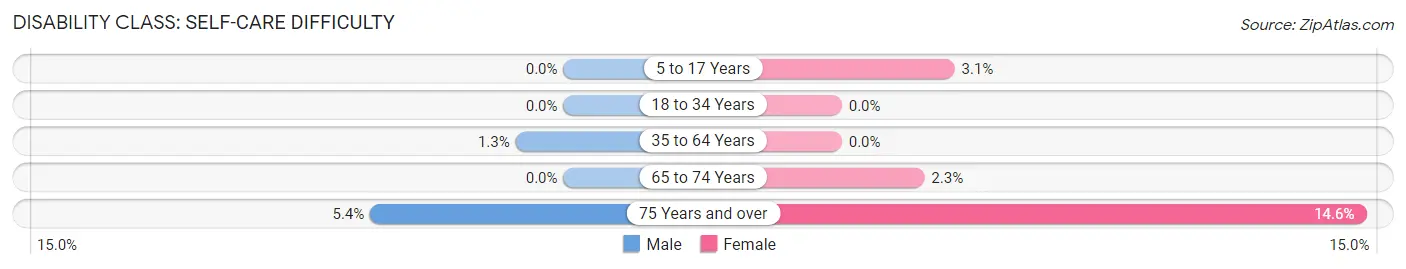
| Age Bracket | Male | Female |
| 5 to 17 Years | 0 (0.0%) | 8 (3.1%) |
| 18 to 34 Years | 0 (0.0%) | 0 (0.0%) |
| 35 to 64 Years | 6 (1.3%) | 0 (0.0%) |
| 65 to 74 Years | 0 (0.0%) | 4 (2.3%) |
| 75 Years and over | 5 (5.4%) | 20 (14.6%) |
Technology Access in Pine Ridge
Computing Device Access in Pine Ridge
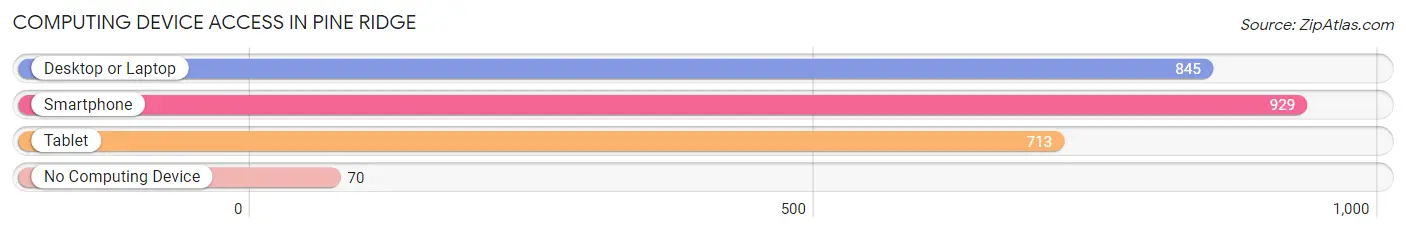
| Device Type | # Households | % Households |
| Desktop or Laptop | 845 | 80.0% |
| Smartphone | 929 | 88.0% |
| Tablet | 713 | 67.5% |
| No Computing Device | 70 | 6.6% |
| Total | 1,056 | 100.0% |
Internet Access in Pine Ridge
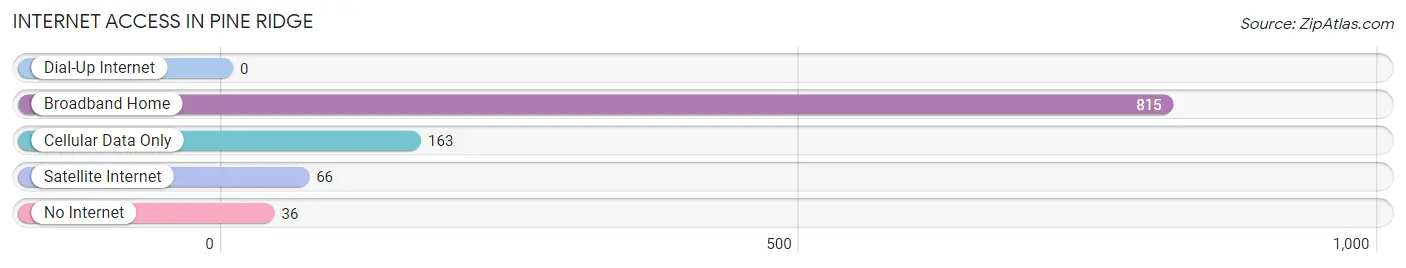
| Internet Type | # Households | % Households |
| Dial-Up Internet | 0 | 0.0% |
| Broadband Home | 815 | 77.2% |
| Cellular Data Only | 163 | 15.4% |
| Satellite Internet | 66 | 6.2% |
| No Internet | 36 | 3.4% |
| Total | 1,056 | 100.0% |
Pine Ridge Summary
Pine Ridge is a small unincorporated community located in the Lowcountry region of South Carolina. It is situated in the northern part of Dorchester County, approximately 20 miles northwest of Charleston. The community is bordered by the Ashley River to the east and the Edisto River to the west. The population of Pine Ridge was estimated to be around 1,000 in 2000.
History
Pine Ridge was first settled in the late 1700s by a group of settlers from England. The area was originally known as “Pine Ridge Plantation” and was owned by the prominent Pinckney family. The plantation was used for growing cotton and other crops. In the early 1800s, the plantation was divided into smaller parcels and sold to other families.
The community of Pine Ridge was officially established in 1820. The town was named after the nearby pine trees that grew in the area. During the Civil War, the town was occupied by Union forces and the local economy suffered. After the war, the town slowly began to rebuild and the population began to grow.
In the late 1800s, the town was home to several businesses, including a sawmill, a gristmill, and a cotton gin. The town also had a post office, a school, and several churches. In the early 1900s, the town was home to a number of small businesses, including a general store, a blacksmith shop, and a barber shop.
Geography
Pine Ridge is located in the Lowcountry region of South Carolina. The town is situated in the northern part of Dorchester County, approximately 20 miles northwest of Charleston. The community is bordered by the Ashley River to the east and the Edisto River to the west. The town is located on a flat, sandy plain and is surrounded by pine forests.
The climate in Pine Ridge is humid subtropical, with hot, humid summers and mild winters. The average annual temperature is around 70 degrees Fahrenheit. The average annual precipitation is around 50 inches.
Economy
The economy of Pine Ridge is largely based on agriculture. The town is home to several farms that grow a variety of crops, including cotton, corn, soybeans, and peanuts. The town also has a number of small businesses, including a general store, a barber shop, and a blacksmith shop.
Demographics
The population of Pine Ridge was estimated to be around 1,000 in 2000. The racial makeup of the town was 97.2% White, 1.2% African American, 0.7% Native American, and 0.9% from other races. The median household income was $30,000 and the median family income was $35,000. The per capita income was $14,000.
Common Questions
What is the Total Population of Pine Ridge?
Total Population of Pine Ridge is 2,687.
What is the Total Male Population of Pine Ridge?
Total Male Population of Pine Ridge is 1,300.
What is the Total Female Population of Pine Ridge?
Total Female Population of Pine Ridge is 1,387.
What is the Ratio of Males per 100 Females in Pine Ridge?
There are 93.73 Males per 100 Females in Pine Ridge.
What is the Ratio of Females per 100 Males in Pine Ridge?
There are 106.69 Females per 100 Males in Pine Ridge.
What is the Median Population Age in Pine Ridge?
Median Population Age in Pine Ridge is 37.1 Years.
What is the Average Family Size in Pine Ridge
Average Family Size in Pine Ridge is 2.9 People.
What is the Average Household Size in Pine Ridge
Average Household Size in Pine Ridge is 2.5 People.
What is Per Capita Income in Pine Ridge?
Per Capita income in Pine Ridge is $34,372.
What is the Median Family Income in Pine Ridge?
Median Family Income in Pine Ridge is $87,963.
What is the Median Household income in Pine Ridge?
Median Household Income in Pine Ridge is $74,565.
What is Income or Wage Gap in Pine Ridge?
Income or Wage Gap in Pine Ridge is 11.2%.
Women in Pine Ridge earn 88.8 cents for every dollar earned by a man.
What is Inequality or Gini Index in Pine Ridge?
Inequality or Gini Index in Pine Ridge is 0.36.
How Large is the Labor Force in Pine Ridge?
There are 1,277 People in the Labor Forcein in Pine Ridge.
What is the Percentage of People in the Labor Force in Pine Ridge?
59.6% of People are in the Labor Force in Pine Ridge.
What is the Unemployment Rate in Pine Ridge?
Unemployment Rate in Pine Ridge is 6.9%.