Cities with the Highest Percentage of Population Employed in Material Moving in South Carolina
RELATED REPORTS & OPTIONS
Material Moving
South Carolina
Compare Cities
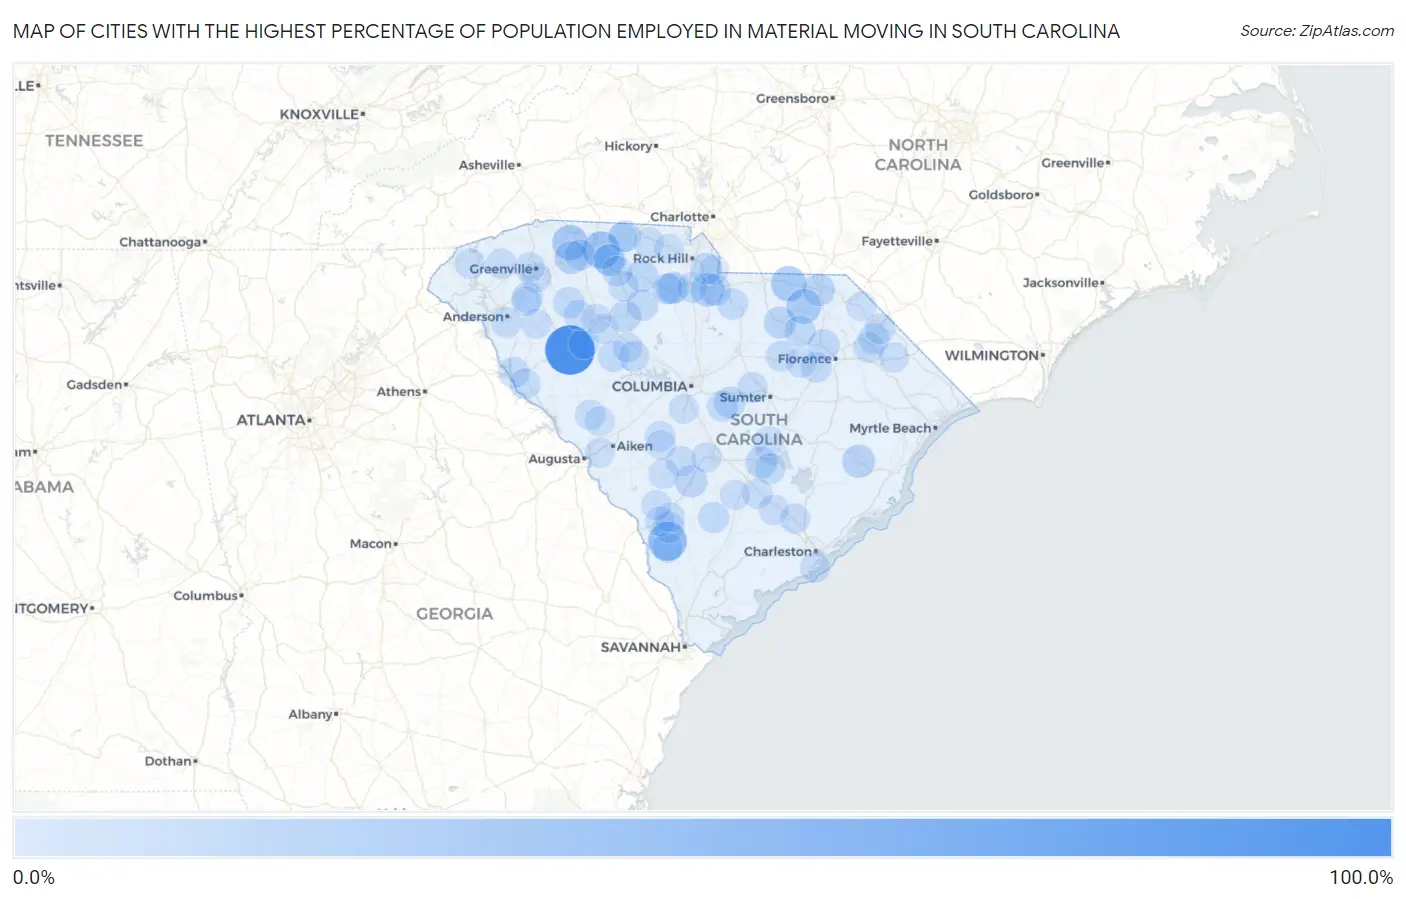
Map of Cities with the Highest Percentage of Population Employed in Material Moving in South Carolina
0.0%
100.0%
Cities with the Highest Percentage of Population Employed in Material Moving in South Carolina
| City | % Employed | vs State | vs National | |
| 1. | Coronaca | 100.0% | 4.1%(+95.9)#1 | 3.8%(+96.2)#24 |
| 2. | Gifford | 47.7% | 4.1%(+43.6)#2 | 3.8%(+43.8)#114 |
| 3. | Clifton | 40.3% | 4.1%(+36.2)#3 | 3.8%(+36.5)#160 |
| 4. | Inman Mills | 31.5% | 4.1%(+27.4)#4 | 3.8%(+27.7)#276 |
| 5. | Ruby | 31.3% | 4.1%(+27.2)#5 | 3.8%(+27.5)#282 |
| 6. | Patrick | 29.7% | 4.1%(+25.6)#6 | 3.8%(+25.9)#313 |
| 7. | Edmund | 28.4% | 4.1%(+24.3)#7 | 3.8%(+24.6)#344 |
| 8. | Lobeco | 23.0% | 4.1%(+18.9)#8 | 3.8%(+19.2)#537 |
| 9. | Fort Lawn | 22.8% | 4.1%(+18.7)#9 | 3.8%(+18.9)#553 |
| 10. | Startex | 21.8% | 4.1%(+17.7)#10 | 3.8%(+18.0)#604 |
| 11. | Andrews | 20.2% | 4.1%(+16.1)#11 | 3.8%(+16.4)#711 |
| 12. | Bamberg | 18.3% | 4.1%(+14.2)#12 | 3.8%(+14.4)#875 |
| 13. | Cheraw | 17.9% | 4.1%(+13.8)#13 | 3.8%(+14.0)#921 |
| 14. | Mcbee | 17.8% | 4.1%(+13.7)#14 | 3.8%(+14.0)#930 |
| 15. | Zion | 17.2% | 4.1%(+13.1)#15 | 3.8%(+13.4)#1,005 |
| 16. | Central Pacolet | 16.9% | 4.1%(+12.8)#16 | 3.8%(+13.1)#1,050 |
| 17. | Beech Island | 16.9% | 4.1%(+12.8)#17 | 3.8%(+13.0)#1,058 |
| 18. | Whitney | 16.6% | 4.1%(+12.5)#18 | 3.8%(+12.8)#1,106 |
| 19. | Vance | 15.7% | 4.1%(+11.6)#19 | 3.8%(+11.9)#1,248 |
| 20. | Lockhart | 15.6% | 4.1%(+11.5)#20 | 3.8%(+11.8)#1,258 |
| 21. | Newtown | 15.2% | 4.1%(+11.1)#21 | 3.8%(+11.4)#1,337 |
| 22. | Eureka Mill | 15.1% | 4.1%(+11.0)#22 | 3.8%(+11.3)#1,351 |
| 23. | Hilltop | 15.1% | 4.1%(+11.0)#23 | 3.8%(+11.2)#1,363 |
| 24. | Whitmire | 15.0% | 4.1%(+10.8)#24 | 3.8%(+11.1)#1,385 |
| 25. | Darlington | 14.9% | 4.1%(+10.8)#25 | 3.8%(+11.0)#1,401 |
| 26. | Irwin | 14.8% | 4.1%(+10.7)#26 | 3.8%(+11.0)#1,410 |
| 27. | Eastover | 14.8% | 4.1%(+10.7)#27 | 3.8%(+11.0)#1,411 |
| 28. | Carlisle | 14.5% | 4.1%(+10.3)#28 | 3.8%(+10.6)#1,495 |
| 29. | Catawba | 14.4% | 4.1%(+10.2)#29 | 3.8%(+10.5)#1,510 |
| 30. | North Hartsville | 14.3% | 4.1%(+10.2)#30 | 3.8%(+10.5)#1,522 |
| 31. | Chester | 14.1% | 4.1%(+10.0)#31 | 3.8%(+10.3)#1,577 |
| 32. | East Gaffney | 13.7% | 4.1%(+9.57)#32 | 3.8%(+9.86)#1,704 |
| 33. | Drayton | 13.6% | 4.1%(+9.44)#33 | 3.8%(+9.73)#1,749 |
| 34. | Silverstreet | 13.6% | 4.1%(+9.44)#34 | 3.8%(+9.73)#1,751 |
| 35. | Grover | 13.4% | 4.1%(+9.26)#35 | 3.8%(+9.55)#1,789 |
| 36. | Gray Court | 13.3% | 4.1%(+9.16)#36 | 3.8%(+9.44)#1,830 |
| 37. | West Pelzer | 13.0% | 4.1%(+8.90)#37 | 3.8%(+9.19)#1,918 |
| 38. | Latta | 13.0% | 4.1%(+8.90)#38 | 3.8%(+9.18)#1,920 |
| 39. | Williams | 13.0% | 4.1%(+8.84)#39 | 3.8%(+9.13)#1,937 |
| 40. | Fairfax | 12.6% | 4.1%(+8.51)#40 | 3.8%(+8.80)#2,051 |
| 41. | Heath Springs | 12.6% | 4.1%(+8.46)#41 | 3.8%(+8.75)#2,075 |
| 42. | Fairforest | 12.6% | 4.1%(+8.45)#42 | 3.8%(+8.74)#2,079 |
| 43. | Pacolet | 12.4% | 4.1%(+8.24)#43 | 3.8%(+8.52)#2,155 |
| 44. | Timmonsville | 12.1% | 4.1%(+7.97)#44 | 3.8%(+8.26)#2,257 |
| 45. | Gadsden | 12.1% | 4.1%(+7.96)#45 | 3.8%(+8.25)#2,266 |
| 46. | Eutawville | 11.9% | 4.1%(+7.81)#46 | 3.8%(+8.10)#2,316 |
| 47. | Calhoun Falls | 11.6% | 4.1%(+7.49)#47 | 3.8%(+7.78)#2,451 |
| 48. | Sellers | 11.1% | 4.1%(+6.99)#48 | 3.8%(+7.28)#2,683 |
| 49. | Richburg | 10.9% | 4.1%(+6.83)#49 | 3.8%(+7.12)#2,758 |
| 50. | Union | 10.9% | 4.1%(+6.78)#50 | 3.8%(+7.07)#2,780 |
| 51. | Bishopville | 10.7% | 4.1%(+6.58)#51 | 3.8%(+6.86)#2,875 |
| 52. | Homeland Park | 10.7% | 4.1%(+6.54)#52 | 3.8%(+6.83)#2,896 |
| 53. | Dillon | 10.6% | 4.1%(+6.50)#53 | 3.8%(+6.78)#2,919 |
| 54. | Hamer | 10.6% | 4.1%(+6.47)#54 | 3.8%(+6.76)#2,929 |
| 55. | Oakland | 10.5% | 4.1%(+6.35)#55 | 3.8%(+6.64)#2,997 |
| 56. | Gayle Mill | 10.4% | 4.1%(+6.30)#56 | 3.8%(+6.59)#3,029 |
| 57. | Pickens | 10.2% | 4.1%(+6.04)#57 | 3.8%(+6.33)#3,181 |
| 58. | Jonesville | 10.1% | 4.1%(+5.98)#58 | 3.8%(+6.26)#3,231 |
| 59. | Prosperity | 10.1% | 4.1%(+5.95)#59 | 3.8%(+6.24)#3,247 |
| 60. | Mount Carmel | 10.1% | 4.1%(+5.94)#60 | 3.8%(+6.23)#3,252 |
| 61. | Smyrna | 10.0% | 4.1%(+5.88)#61 | 3.8%(+6.17)#3,316 |
| 62. | Edgefield | 9.9% | 4.1%(+5.82)#62 | 3.8%(+6.11)#3,337 |
| 63. | Norway | 9.9% | 4.1%(+5.80)#63 | 3.8%(+6.09)#3,350 |
| 64. | Blackville | 9.9% | 4.1%(+5.73)#64 | 3.8%(+6.02)#3,396 |
| 65. | Salem | 9.8% | 4.1%(+5.69)#65 | 3.8%(+5.97)#3,431 |
| 66. | Lamar | 9.7% | 4.1%(+5.57)#66 | 3.8%(+5.86)#3,518 |
| 67. | Cross Hill | 9.7% | 4.1%(+5.56)#67 | 3.8%(+5.85)#3,522 |
| 68. | Laurens | 9.7% | 4.1%(+5.55)#68 | 3.8%(+5.84)#3,529 |
| 69. | Gantt | 9.6% | 4.1%(+5.53)#69 | 3.8%(+5.81)#3,543 |
| 70. | Mullins | 9.6% | 4.1%(+5.43)#70 | 3.8%(+5.72)#3,607 |
| 71. | Danwood | 9.5% | 4.1%(+5.42)#71 | 3.8%(+5.71)#3,612 |
| 72. | Ridgeville | 9.4% | 4.1%(+5.24)#72 | 3.8%(+5.53)#3,786 |
| 73. | Seabrook | 9.3% | 4.1%(+5.21)#73 | 3.8%(+5.49)#3,804 |
| 74. | Edisto | 9.3% | 4.1%(+5.19)#74 | 3.8%(+5.48)#3,816 |
| 75. | Sangaree | 9.3% | 4.1%(+5.14)#75 | 3.8%(+5.43)#3,851 |
| 76. | Joanna | 9.3% | 4.1%(+5.13)#76 | 3.8%(+5.42)#3,857 |
| 77. | Summerton | 9.2% | 4.1%(+5.05)#77 | 3.8%(+5.34)#3,929 |
| 78. | Honea Path | 8.9% | 4.1%(+4.79)#78 | 3.8%(+5.07)#4,146 |
| 79. | Perry | 8.8% | 4.1%(+4.73)#79 | 3.8%(+5.02)#4,190 |
| 80. | Folly Beach | 8.8% | 4.1%(+4.66)#80 | 3.8%(+4.95)#4,252 |
| 81. | Harleyville | 8.8% | 4.1%(+4.65)#81 | 3.8%(+4.94)#4,254 |
| 82. | Sycamore | 8.7% | 4.1%(+4.58)#82 | 3.8%(+4.87)#4,326 |
| 83. | Newberry | 8.7% | 4.1%(+4.56)#83 | 3.8%(+4.85)#4,340 |
| 84. | Luray | 8.7% | 4.1%(+4.54)#84 | 3.8%(+4.82)#4,356 |
| 85. | Reevesville | 8.6% | 4.1%(+4.50)#85 | 3.8%(+4.79)#4,393 |
| 86. | Kline | 8.6% | 4.1%(+4.45)#86 | 3.8%(+4.74)#4,443 |
| 87. | Capitol View | 8.6% | 4.1%(+4.45)#87 | 3.8%(+4.74)#4,454 |
| 88. | Allendale | 8.3% | 4.1%(+4.23)#88 | 3.8%(+4.51)#4,660 |
| 89. | Clinton | 8.3% | 4.1%(+4.22)#89 | 3.8%(+4.51)#4,661 |
| 90. | Trenton | 8.3% | 4.1%(+4.21)#90 | 3.8%(+4.50)#4,669 |
| 91. | Parker | 8.3% | 4.1%(+4.18)#91 | 3.8%(+4.47)#4,711 |
| 92. | Gaston | 8.3% | 4.1%(+4.14)#92 | 3.8%(+4.43)#4,756 |
| 93. | Gaffney | 8.2% | 4.1%(+4.08)#93 | 3.8%(+4.37)#4,833 |
| 94. | Camp Croft | 8.2% | 4.1%(+4.07)#94 | 3.8%(+4.36)#4,839 |
| 95. | Clio | 8.1% | 4.1%(+4.00)#95 | 3.8%(+4.29)#4,908 |
| 96. | Salley | 8.1% | 4.1%(+3.99)#96 | 3.8%(+4.28)#4,923 |
| 97. | York | 7.8% | 4.1%(+3.72)#97 | 3.8%(+4.01)#5,256 |
| 98. | Williamston | 7.8% | 4.1%(+3.65)#98 | 3.8%(+3.93)#5,353 |
| 99. | Van Wyck | 7.6% | 4.1%(+3.49)#99 | 3.8%(+3.78)#5,538 |
| 100. | Langley | 7.6% | 4.1%(+3.45)#100 | 3.8%(+3.74)#5,586 |
Common Questions
What are the Top 10 Cities with the Highest Percentage of Population Employed in Material Moving in South Carolina?
Top 10 Cities with the Highest Percentage of Population Employed in Material Moving in South Carolina are:
What city has the Highest Percentage of Population Employed in Material Moving in South Carolina?
Coronaca has the Highest Percentage of Population Employed in Material Moving in South Carolina with 100.0%.
What is the Percentage of Population Employed in Material Moving in the State of South Carolina?
Percentage of Population Employed in Material Moving in South Carolina is 4.1%.
What is the Percentage of Population Employed in Material Moving in the United States?
Percentage of Population Employed in Material Moving in the United States is 3.8%.