Wade Hampton, SC
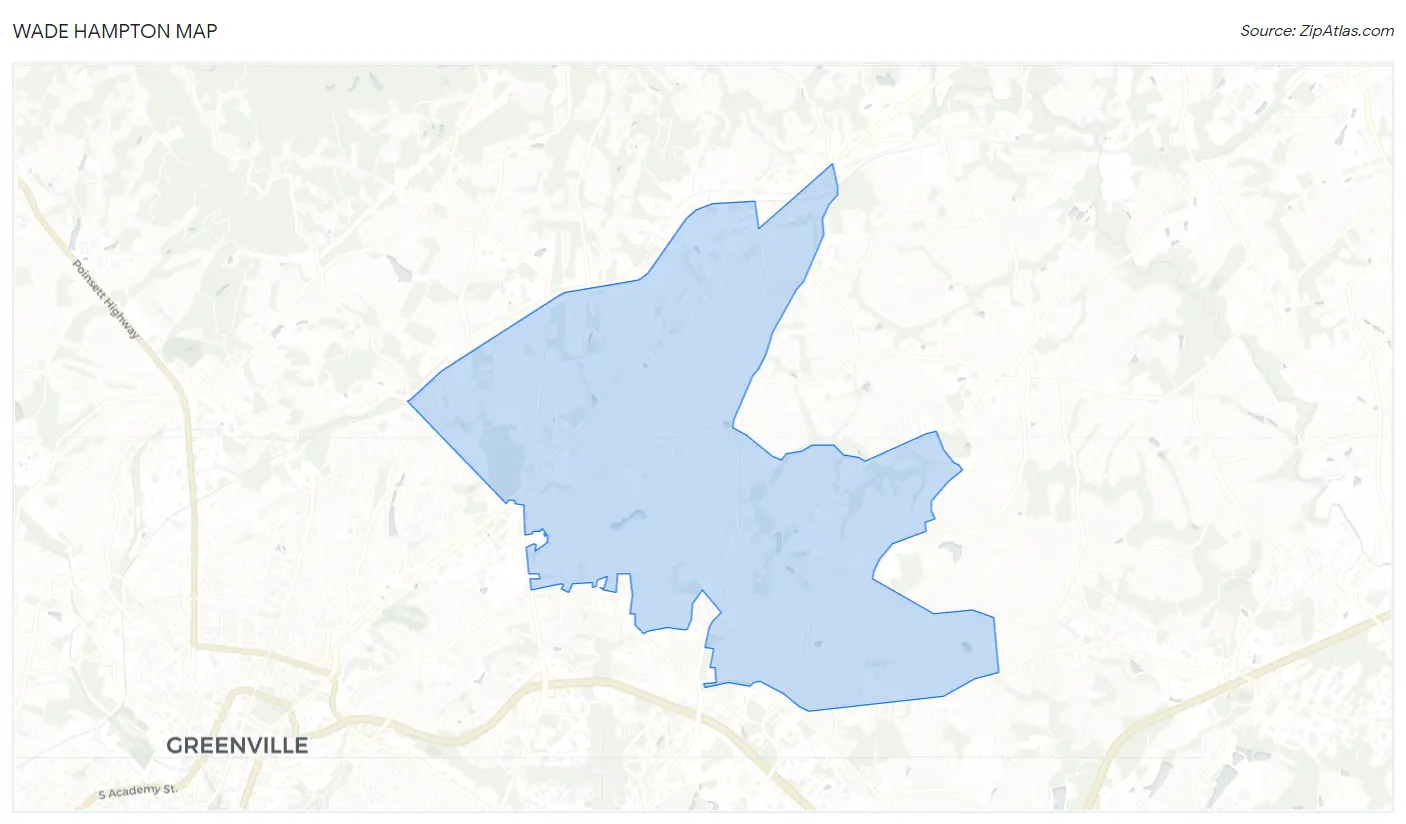
Wade Hampton Map
Wade Hampton Overview
21,029
TOTAL POPULATION
10,078
MALE POPULATION
10,951
FEMALE POPULATION
92.03
MALES / 100 FEMALES
108.66
FEMALES / 100 MALES
41.4
MEDIAN AGE
3.0
AVG FAMILY SIZE
2.3
AVG HOUSEHOLD SIZE
$39,311
PER CAPITA INCOME
$92,218
AVG FAMILY INCOME
$71,564
AVG HOUSEHOLD INCOME
26.6%
WAGE / INCOME GAP [ % ]
73.4¢/ $1
WAGE / INCOME GAP [ $ ]
$7,421
FAMILY INCOME DEFICIT
0.42
INEQUALITY / GINI INDEX
10,825
LABOR FORCE [ PEOPLE ]
64.3%
PERCENT IN LABOR FORCE
3.1%
UNEMPLOYMENT RATE
Race in Wade Hampton
The most populous races in Wade Hampton are White / Caucasian (16,299 | 77.5%), Hispanic or Latino (1,968 | 9.4%), and Black / African American (1,895 | 9.0%).
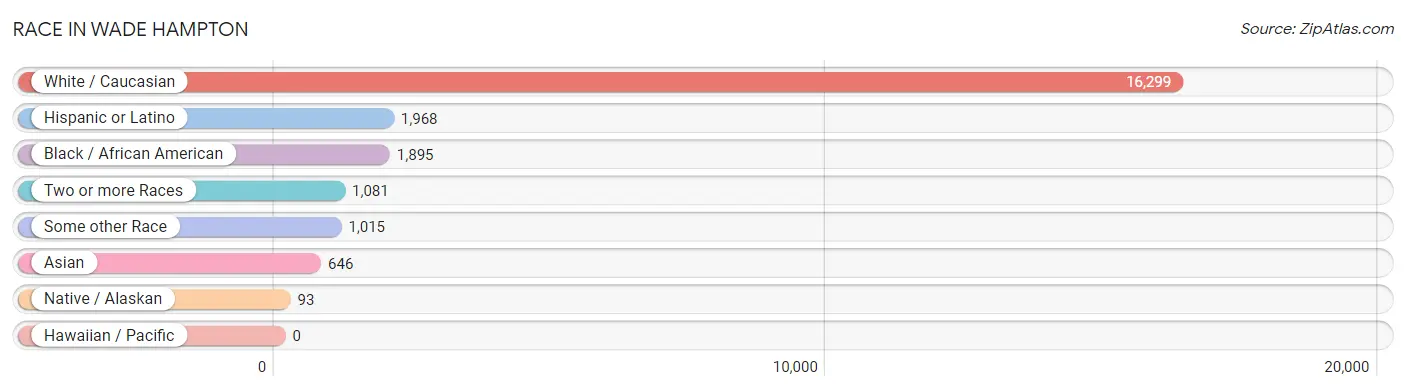
| Race | # Population | % Population |
| Asian | 646 | 3.1% |
| Black / African American | 1,895 | 9.0% |
| Hawaiian / Pacific | 0 | 0.0% |
| Hispanic or Latino | 1,968 | 9.4% |
| Native / Alaskan | 93 | 0.4% |
| White / Caucasian | 16,299 | 77.5% |
| Two or more Races | 1,081 | 5.1% |
| Some other Race | 1,015 | 4.8% |
| Total | 21,029 | 100.0% |
Ancestry in Wade Hampton
The most populous ancestries reported in Wade Hampton are English (3,913 | 18.6%), German (2,835 | 13.5%), Irish (2,374 | 11.3%), American (1,245 | 5.9%), and Mexican (967 | 4.6%), together accounting for 53.9% of all Wade Hampton residents.
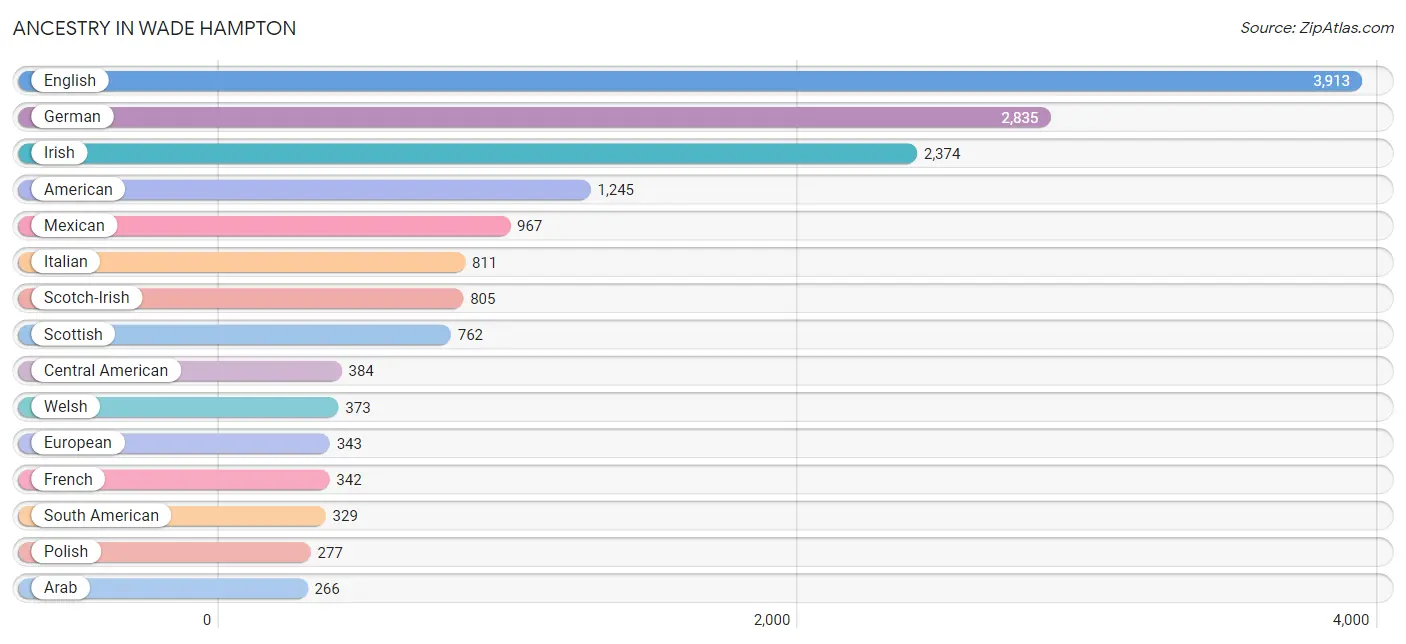
| Ancestry | # Population | % Population |
| African | 18 | 0.1% |
| American | 1,245 | 5.9% |
| Arab | 266 | 1.3% |
| Argentinean | 61 | 0.3% |
| Armenian | 121 | 0.6% |
| Assyrian / Chaldean / Syriac | 49 | 0.2% |
| Austrian | 11 | 0.1% |
| Belgian | 23 | 0.1% |
| Bhutanese | 2 | 0.0% |
| Bolivian | 6 | 0.0% |
| Brazilian | 35 | 0.2% |
| British | 149 | 0.7% |
| Bulgarian | 51 | 0.2% |
| Burmese | 26 | 0.1% |
| Canadian | 24 | 0.1% |
| Celtic | 11 | 0.1% |
| Central American | 384 | 1.8% |
| Central American Indian | 18 | 0.1% |
| Cherokee | 23 | 0.1% |
| Choctaw | 5 | 0.0% |
| Colombian | 170 | 0.8% |
| Cuban | 25 | 0.1% |
| Czech | 28 | 0.1% |
| Dominican | 36 | 0.2% |
| Dutch | 133 | 0.6% |
| English | 3,913 | 18.6% |
| European | 343 | 1.6% |
| Filipino | 166 | 0.8% |
| Finnish | 10 | 0.1% |
| French | 342 | 1.6% |
| French Canadian | 126 | 0.6% |
| German | 2,835 | 13.5% |
| Greek | 126 | 0.6% |
| Guatemalan | 93 | 0.4% |
| Honduran | 145 | 0.7% |
| Hungarian | 72 | 0.3% |
| Indian (Asian) | 152 | 0.7% |
| Iraqi | 5 | 0.0% |
| Irish | 2,374 | 11.3% |
| Italian | 811 | 3.9% |
| Jamaican | 31 | 0.2% |
| Korean | 50 | 0.2% |
| Laotian | 13 | 0.1% |
| Lebanese | 81 | 0.4% |
| Lithuanian | 32 | 0.2% |
| Mexican | 967 | 4.6% |
| Mexican American Indian | 73 | 0.4% |
| Native Hawaiian | 29 | 0.1% |
| Northern European | 46 | 0.2% |
| Norwegian | 176 | 0.8% |
| Pakistani | 29 | 0.1% |
| Panamanian | 39 | 0.2% |
| Polish | 277 | 1.3% |
| Portuguese | 46 | 0.2% |
| Potawatomi | 5 | 0.0% |
| Puerto Rican | 152 | 0.7% |
| Russian | 102 | 0.5% |
| Salvadoran | 107 | 0.5% |
| Scandinavian | 69 | 0.3% |
| Scotch-Irish | 805 | 3.8% |
| Scottish | 762 | 3.6% |
| Serbian | 99 | 0.5% |
| Slovak | 47 | 0.2% |
| South African | 68 | 0.3% |
| South American | 329 | 1.6% |
| Spanish | 6 | 0.0% |
| Sri Lankan | 246 | 1.2% |
| Subsaharan African | 86 | 0.4% |
| Swedish | 117 | 0.6% |
| Swiss | 22 | 0.1% |
| Thai | 21 | 0.1% |
| Tlingit-Haida | 7 | 0.0% |
| Turkish | 3 | 0.0% |
| Ukrainian | 30 | 0.1% |
| Uruguayan | 41 | 0.2% |
| Venezuelan | 51 | 0.2% |
| Welsh | 373 | 1.8% | View All 77 Rows |
Immigrants in Wade Hampton
The most numerous immigrant groups reported in Wade Hampton came from Latin America (1,006 | 4.8%), Central America (761 | 3.6%), Asia (600 | 2.9%), Mexico (542 | 2.6%), and South Eastern Asia (225 | 1.1%), together accounting for 14.9% of all Wade Hampton residents.
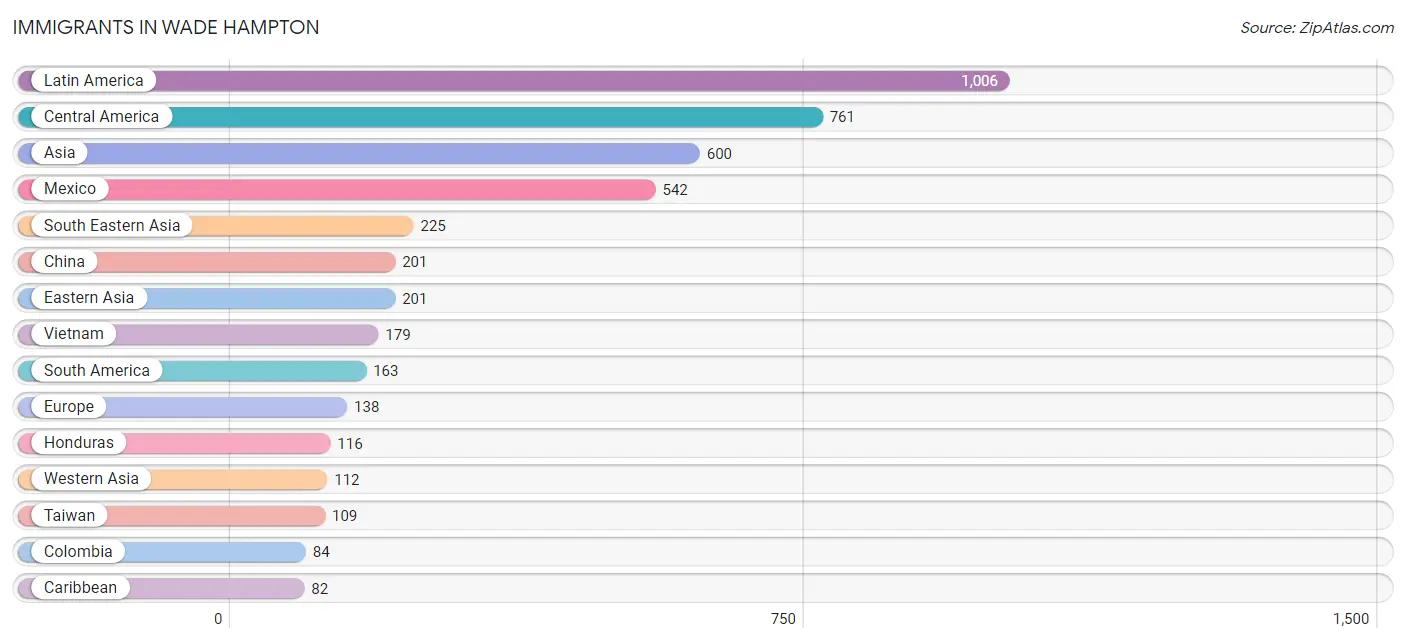
| Immigration Origin | # Population | % Population |
| Africa | 16 | 0.1% |
| Argentina | 9 | 0.0% |
| Asia | 600 | 2.9% |
| Brazil | 19 | 0.1% |
| Bulgaria | 11 | 0.1% |
| Canada | 23 | 0.1% |
| Caribbean | 82 | 0.4% |
| Central America | 761 | 3.6% |
| China | 201 | 1.0% |
| Colombia | 84 | 0.4% |
| Cuba | 25 | 0.1% |
| Czechoslovakia | 11 | 0.1% |
| Dominican Republic | 26 | 0.1% |
| Eastern Asia | 201 | 1.0% |
| Eastern Europe | 80 | 0.4% |
| El Salvador | 39 | 0.2% |
| Europe | 138 | 0.7% |
| Germany | 31 | 0.2% |
| Greece | 6 | 0.0% |
| Guatemala | 64 | 0.3% |
| Honduras | 116 | 0.5% |
| India | 62 | 0.3% |
| Indonesia | 13 | 0.1% |
| Iraq | 68 | 0.3% |
| Jamaica | 31 | 0.2% |
| Kuwait | 41 | 0.2% |
| Latin America | 1,006 | 4.8% |
| Latvia | 4 | 0.0% |
| Mexico | 542 | 2.6% |
| Netherlands | 9 | 0.0% |
| Northern Europe | 12 | 0.1% |
| Norway | 8 | 0.0% |
| Philippines | 19 | 0.1% |
| Russia | 54 | 0.3% |
| South Africa | 16 | 0.1% |
| South America | 163 | 0.8% |
| South Central Asia | 62 | 0.3% |
| South Eastern Asia | 225 | 1.1% |
| Southern Europe | 6 | 0.0% |
| Taiwan | 109 | 0.5% |
| Thailand | 14 | 0.1% |
| Turkey | 3 | 0.0% |
| Venezuela | 51 | 0.2% |
| Vietnam | 179 | 0.9% |
| Western Asia | 112 | 0.5% |
| Western Europe | 40 | 0.2% | View All 46 Rows |
Sex and Age in Wade Hampton
Sex and Age in Wade Hampton
The most populous age groups in Wade Hampton are 35 to 39 Years (867 | 8.6%) for men and 40 to 44 Years (1,065 | 9.7%) for women.
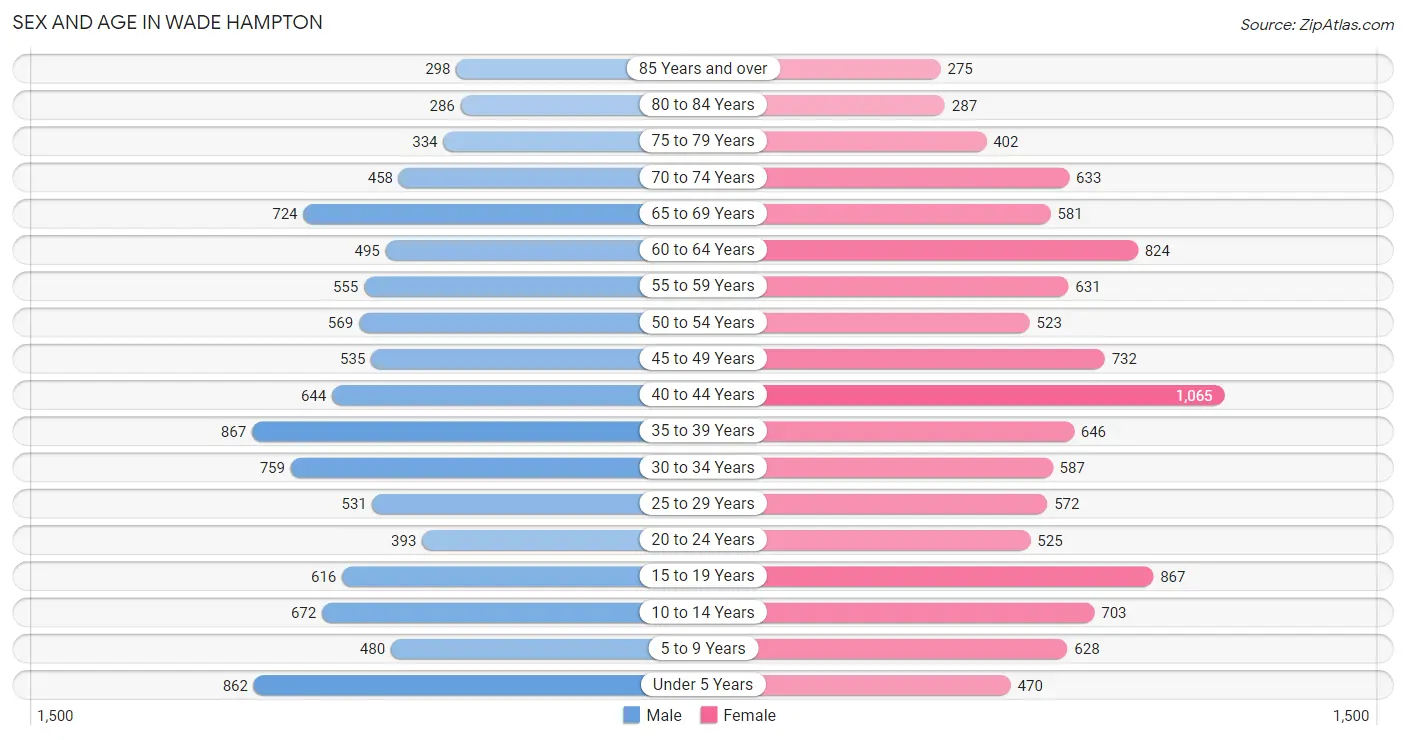
| Age Bracket | Male | Female |
| Under 5 Years | 862 (8.6%) | 470 (4.3%) |
| 5 to 9 Years | 480 (4.8%) | 628 (5.7%) |
| 10 to 14 Years | 672 (6.7%) | 703 (6.4%) |
| 15 to 19 Years | 616 (6.1%) | 867 (7.9%) |
| 20 to 24 Years | 393 (3.9%) | 525 (4.8%) |
| 25 to 29 Years | 531 (5.3%) | 572 (5.2%) |
| 30 to 34 Years | 759 (7.5%) | 587 (5.4%) |
| 35 to 39 Years | 867 (8.6%) | 646 (5.9%) |
| 40 to 44 Years | 644 (6.4%) | 1,065 (9.7%) |
| 45 to 49 Years | 535 (5.3%) | 732 (6.7%) |
| 50 to 54 Years | 569 (5.7%) | 523 (4.8%) |
| 55 to 59 Years | 555 (5.5%) | 631 (5.8%) |
| 60 to 64 Years | 495 (4.9%) | 824 (7.5%) |
| 65 to 69 Years | 724 (7.2%) | 581 (5.3%) |
| 70 to 74 Years | 458 (4.5%) | 633 (5.8%) |
| 75 to 79 Years | 334 (3.3%) | 402 (3.7%) |
| 80 to 84 Years | 286 (2.8%) | 287 (2.6%) |
| 85 Years and over | 298 (3.0%) | 275 (2.5%) |
| Total | 10,078 (100.0%) | 10,951 (100.0%) |
Families and Households in Wade Hampton
Median Family Size in Wade Hampton
The median family size in Wade Hampton is 2.95 persons per family, with married-couple families (4,241 | 75.2%) accounting for the largest median family size of 3.02 persons per family. On the other hand, single female/mother families (940 | 16.7%) represent the smallest median family size with 2.70 persons per family.
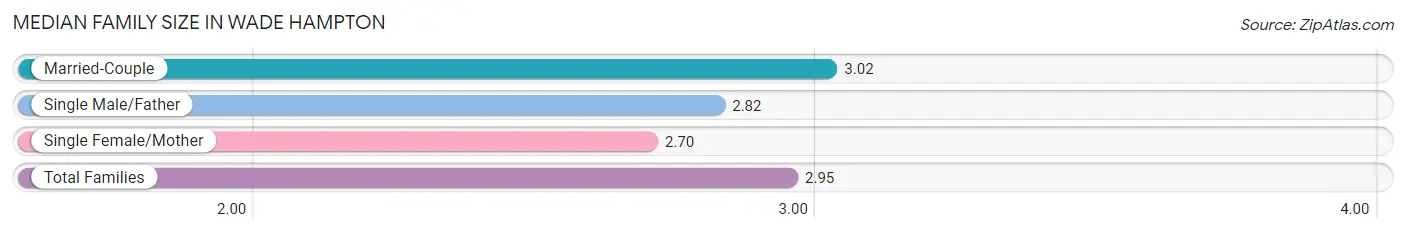
| Family Type | # Families | Family Size |
| Married-Couple | 4,241 (75.2%) | 3.02 |
| Single Male/Father | 456 (8.1%) | 2.82 |
| Single Female/Mother | 940 (16.7%) | 2.70 |
| Total Families | 5,637 (100.0%) | 2.95 |
Median Household Size in Wade Hampton
The median household size in Wade Hampton is 2.34 persons per household, with single male/father households (456 | 5.1%) accounting for the largest median household size of 3.17 persons per household. non-family households (3,333 | 37.2%) represent the smallest median household size with 1.21 persons per household.

| Household Type | # Households | Household Size |
| Married-Couple | 4,241 (47.3%) | 3.02 |
| Single Male/Father | 456 (5.1%) | 3.17 |
| Single Female/Mother | 940 (10.5%) | 2.83 |
| Non-family | 3,333 (37.2%) | 1.21 |
| Total Households | 8,970 (100.0%) | 2.34 |
Household Size by Marriage Status in Wade Hampton
Out of a total of 8,970 households in Wade Hampton, 5,637 (62.8%) are family households, while 3,333 (37.2%) are nonfamily households. The most numerous type of family households are 2-person households, comprising 2,806, and the most common type of nonfamily households are 1-person households, comprising 2,771.
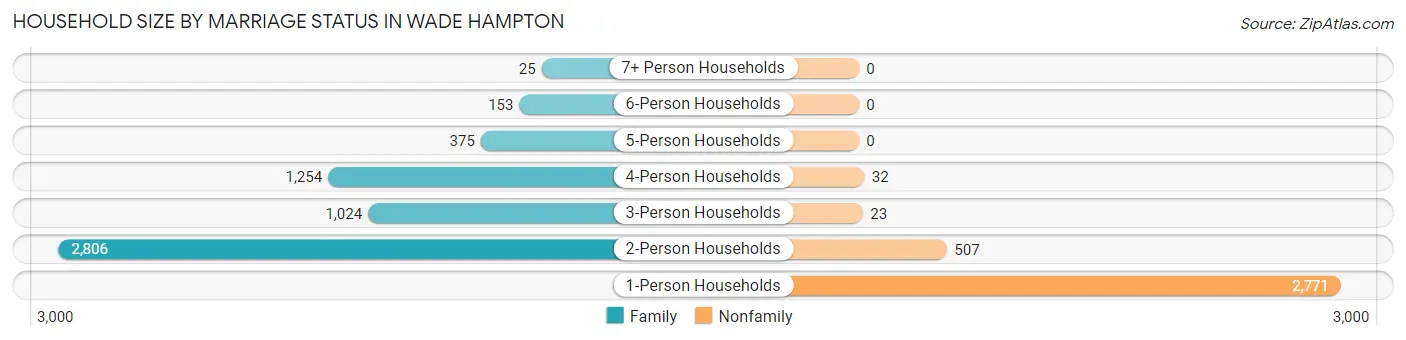
| Household Size | Family Households | Nonfamily Households |
| 1-Person Households | - | 2,771 (30.9%) |
| 2-Person Households | 2,806 (31.3%) | 507 (5.7%) |
| 3-Person Households | 1,024 (11.4%) | 23 (0.3%) |
| 4-Person Households | 1,254 (14.0%) | 32 (0.4%) |
| 5-Person Households | 375 (4.2%) | 0 (0.0%) |
| 6-Person Households | 153 (1.7%) | 0 (0.0%) |
| 7+ Person Households | 25 (0.3%) | 0 (0.0%) |
| Total | 5,637 (62.8%) | 3,333 (37.2%) |
Female Fertility in Wade Hampton
Fertility by Age in Wade Hampton
Average fertility rate in Wade Hampton is 51.0 births per 1,000 women. Women in the age bracket of 20 to 34 years have the highest fertility rate with 111.0 births per 1,000 women. Women in the age bracket of 20 to 34 years acount for 71.4% of all women with births.
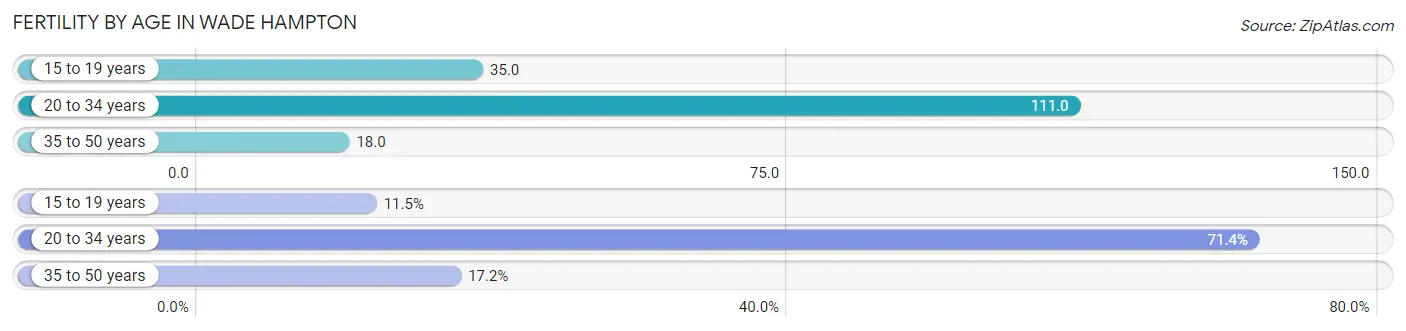
| Age Bracket | Women with Births | Births / 1,000 Women |
| 15 to 19 years | 30 (11.5%) | 35.0 |
| 20 to 34 years | 187 (71.4%) | 111.0 |
| 35 to 50 years | 45 (17.2%) | 18.0 |
| Total | 262 (100.0%) | 51.0 |
Fertility by Age by Marriage Status in Wade Hampton
77.1% of women with births (262) in Wade Hampton are married. The highest percentage of unmarried women with births falls into 15 to 19 years age bracket with 100.0% of them unmarried at the time of birth, while the lowest percentage of unmarried women with births belong to 35 to 50 years age bracket with 0.0% of them unmarried.
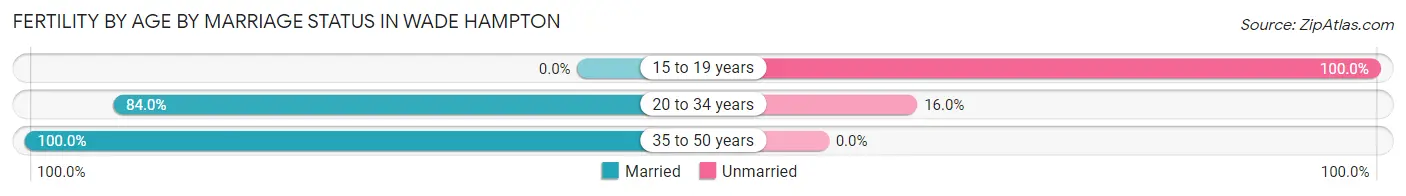
| Age Bracket | Married | Unmarried |
| 15 to 19 years | 0 (0.0%) | 30 (100.0%) |
| 20 to 34 years | 157 (84.0%) | 30 (16.0%) |
| 35 to 50 years | 45 (100.0%) | 0 (0.0%) |
| Total | 202 (77.1%) | 60 (22.9%) |
Fertility by Education in Wade Hampton
Average fertility rate in Wade Hampton is 51.0 births per 1,000 women. Women with the education attainment of bachelor's degree have the highest fertility rate of 86.0 births per 1,000 women, while women with the education attainment of graduate degree have the lowest fertility at 28.0 births per 1,000 women. Women with the education attainment of bachelor's degree represent 45.0% of all women with births.
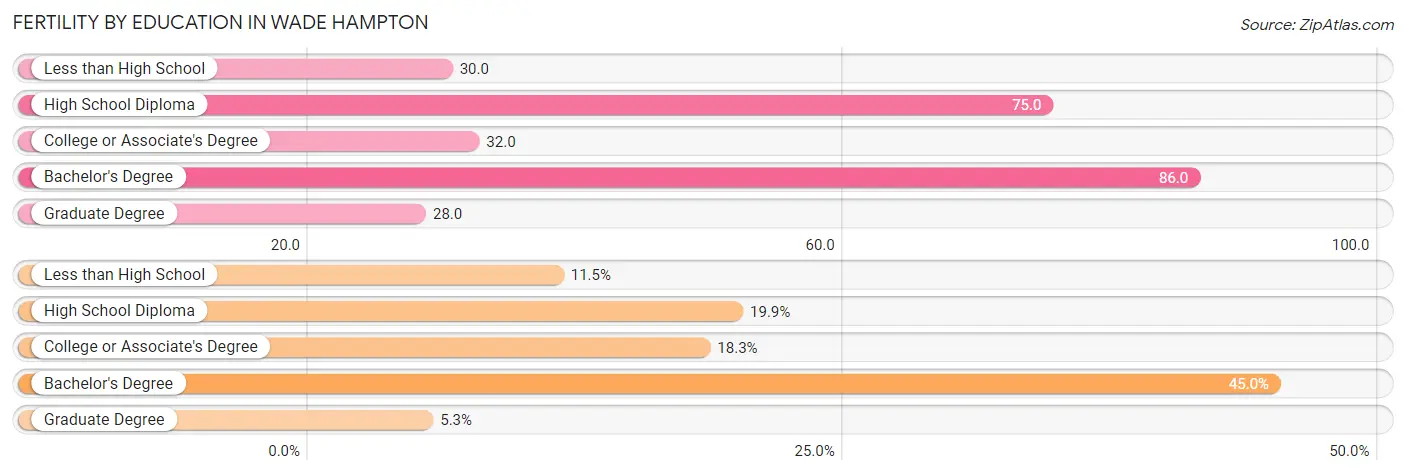
| Educational Attainment | Women with Births | Births / 1,000 Women |
| Less than High School | 30 (11.5%) | 30.0 |
| High School Diploma | 52 (19.9%) | 75.0 |
| College or Associate's Degree | 48 (18.3%) | 32.0 |
| Bachelor's Degree | 118 (45.0%) | 86.0 |
| Graduate Degree | 14 (5.3%) | 28.0 |
| Total | 262 (100.0%) | 51.0 |
Fertility by Education by Marriage Status in Wade Hampton
22.9% of women with births in Wade Hampton are unmarried. Women with the educational attainment of college or associate's degree are most likely to be married with 100.0% of them married at childbirth, while women with the educational attainment of less than high school are least likely to be married with 100.0% of them unmarried at childbirth.
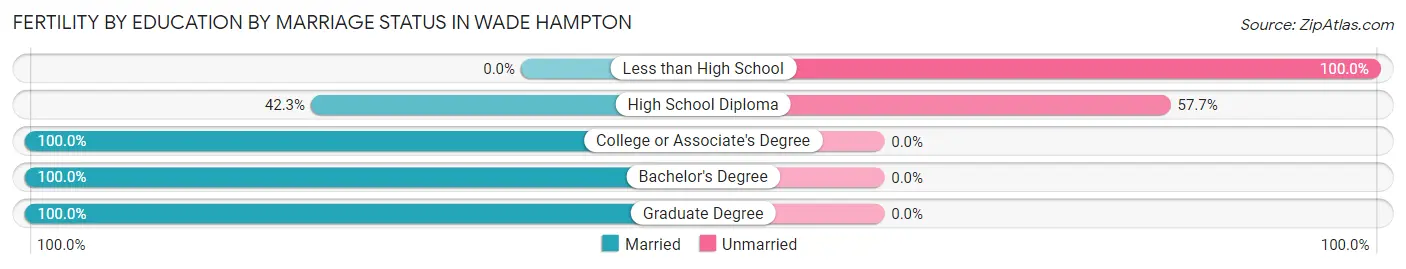
| Educational Attainment | Married | Unmarried |
| Less than High School | 0 (0.0%) | 30 (100.0%) |
| High School Diploma | 22 (42.3%) | 30 (57.7%) |
| College or Associate's Degree | 48 (100.0%) | 0 (0.0%) |
| Bachelor's Degree | 118 (100.0%) | 0 (0.0%) |
| Graduate Degree | 14 (100.0%) | 0 (0.0%) |
| Total | 202 (77.1%) | 60 (22.9%) |
Income in Wade Hampton
Income Overview in Wade Hampton
Per Capita Income in Wade Hampton is $39,311, while median incomes of families and households are $92,218 and $71,564 respectively.
| Characteristic | Number | Measure |
| Per Capita Income | 21,029 | $39,311 |
| Median Family Income | 5,637 | $92,218 |
| Mean Family Income | 5,637 | $112,587 |
| Median Household Income | 8,970 | $71,564 |
| Mean Household Income | 8,970 | $91,676 |
| Income Deficit | 5,637 | $7,421 |
| Wage / Income Gap (%) | 21,029 | 26.57% |
| Wage / Income Gap ($) | 21,029 | 73.43¢ per $1 |
| Gini / Inequality Index | 21,029 | 0.42 |
Earnings by Sex in Wade Hampton
Average Earnings in Wade Hampton are $42,586, $50,669 for men and $37,207 for women, a difference of 26.6%.
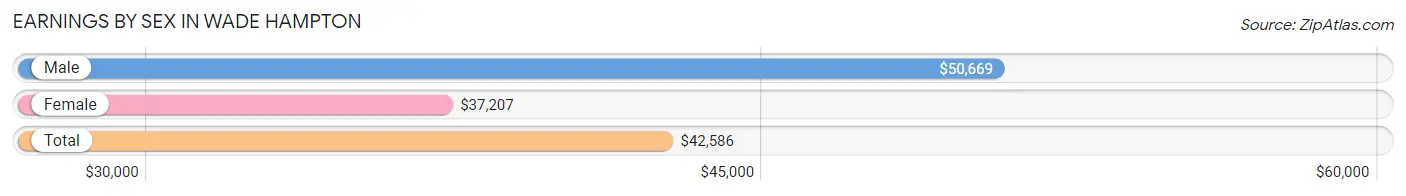
| Sex | Number | Average Earnings |
| Male | 5,826 (52.5%) | $50,669 |
| Female | 5,280 (47.5%) | $37,207 |
| Total | 11,106 (100.0%) | $42,586 |
Earnings by Sex by Income Bracket in Wade Hampton
The most common earnings brackets in Wade Hampton are $100,000+ for men (1,208 | 20.7%) and $40,000 to $44,999 for women (520 | 9.9%).
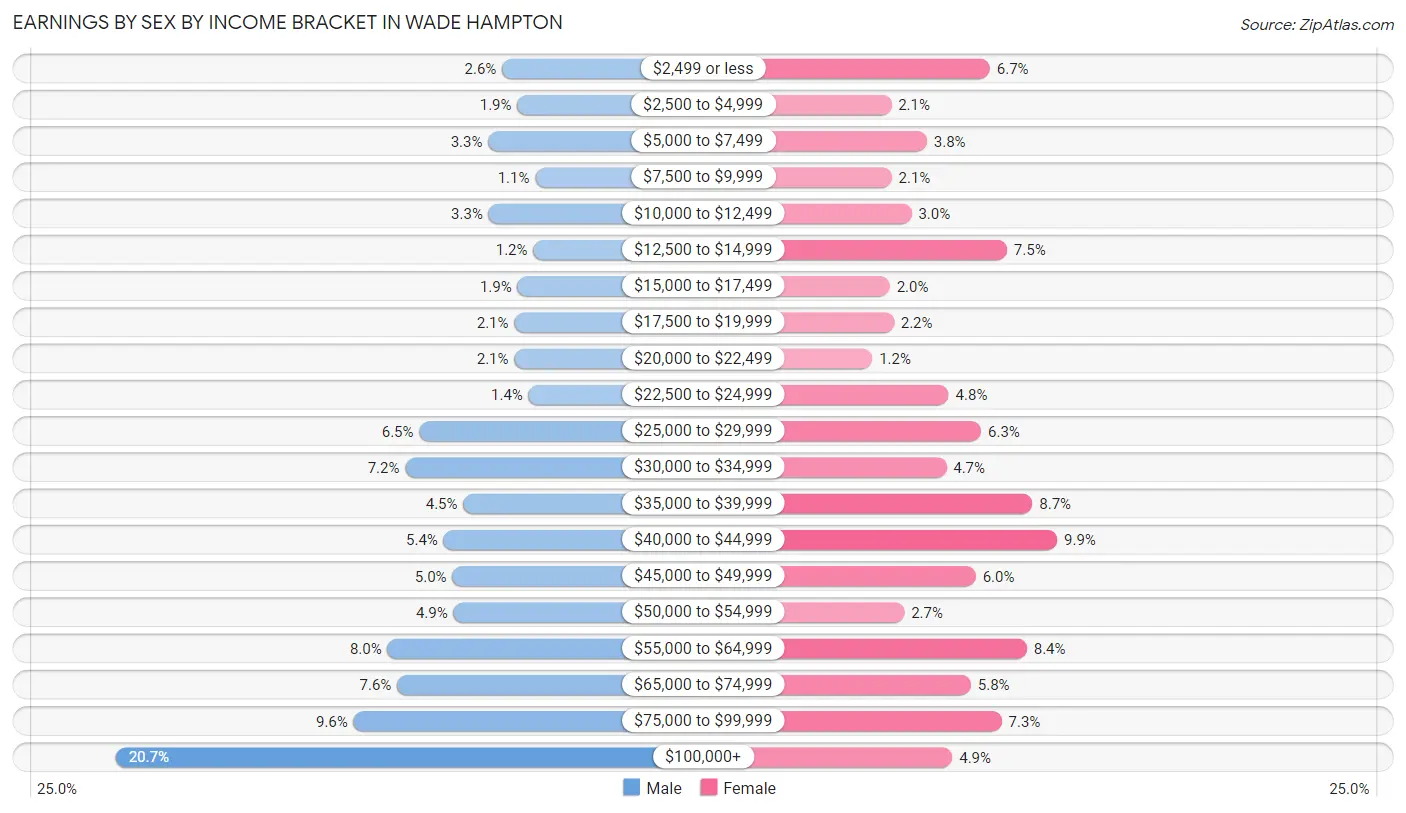
| Income | Male | Female |
| $2,499 or less | 153 (2.6%) | 354 (6.7%) |
| $2,500 to $4,999 | 112 (1.9%) | 110 (2.1%) |
| $5,000 to $7,499 | 191 (3.3%) | 198 (3.7%) |
| $7,500 to $9,999 | 63 (1.1%) | 111 (2.1%) |
| $10,000 to $12,499 | 190 (3.3%) | 160 (3.0%) |
| $12,500 to $14,999 | 68 (1.2%) | 396 (7.5%) |
| $15,000 to $17,499 | 111 (1.9%) | 106 (2.0%) |
| $17,500 to $19,999 | 120 (2.1%) | 116 (2.2%) |
| $20,000 to $22,499 | 120 (2.1%) | 63 (1.2%) |
| $22,500 to $24,999 | 81 (1.4%) | 252 (4.8%) |
| $25,000 to $29,999 | 379 (6.5%) | 332 (6.3%) |
| $30,000 to $34,999 | 418 (7.2%) | 246 (4.7%) |
| $35,000 to $39,999 | 259 (4.4%) | 459 (8.7%) |
| $40,000 to $44,999 | 313 (5.4%) | 520 (9.9%) |
| $45,000 to $49,999 | 289 (5.0%) | 319 (6.0%) |
| $50,000 to $54,999 | 286 (4.9%) | 142 (2.7%) |
| $55,000 to $64,999 | 466 (8.0%) | 445 (8.4%) |
| $65,000 to $74,999 | 440 (7.5%) | 307 (5.8%) |
| $75,000 to $99,999 | 559 (9.6%) | 383 (7.2%) |
| $100,000+ | 1,208 (20.7%) | 261 (4.9%) |
| Total | 5,826 (100.0%) | 5,280 (100.0%) |
Earnings by Sex by Educational Attainment in Wade Hampton
Average earnings in Wade Hampton are $55,506 for men and $40,130 for women, a difference of 27.7%. Men with an educational attainment of graduate degree enjoy the highest average annual earnings of $82,500, while those with less than high school education earn the least with $25,919. Women with an educational attainment of graduate degree earn the most with the average annual earnings of $57,756, while those with less than high school education have the smallest earnings of $24,654.
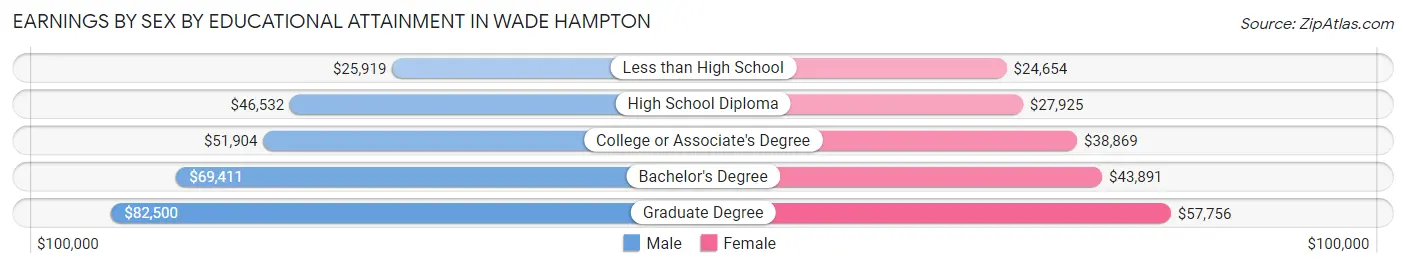
| Educational Attainment | Male Income | Female Income |
| Less than High School | $25,919 | $24,654 |
| High School Diploma | $46,532 | $27,925 |
| College or Associate's Degree | $51,904 | $38,869 |
| Bachelor's Degree | $69,411 | $43,891 |
| Graduate Degree | $82,500 | $57,756 |
| Total | $55,506 | $40,130 |
Family Income in Wade Hampton
Family Income Brackets in Wade Hampton
According to the Wade Hampton family income data, there are 1,246 families falling into the $100,000 to $149,999 income range, which is the most common income bracket and makes up 22.1% of all families. Conversely, the $10,000 to $14,999 income bracket is the least frequent group with only 85 families (1.5%) belonging to this category.
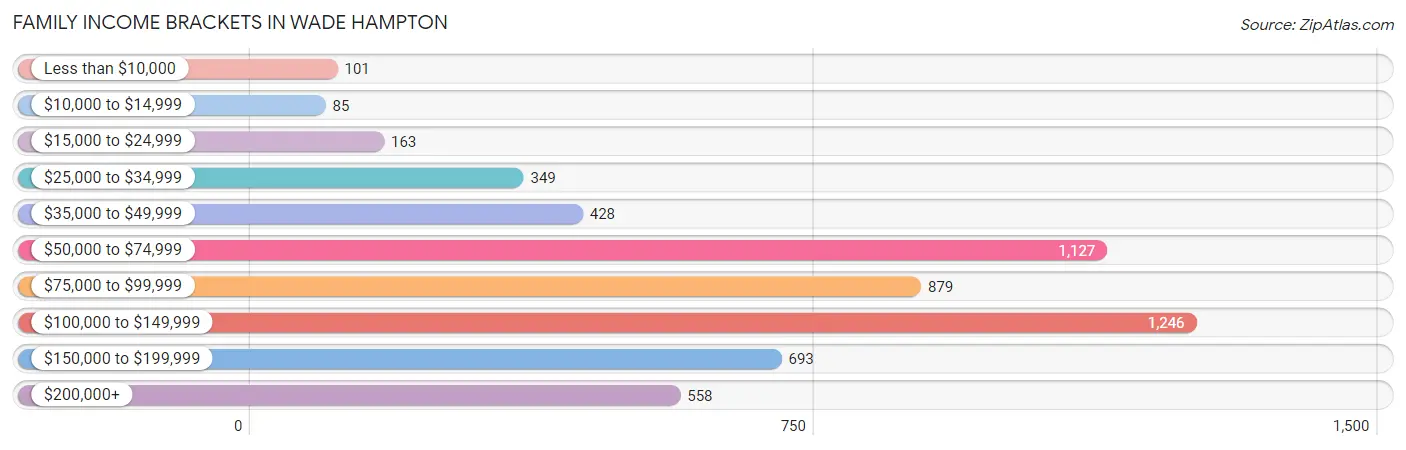
| Income Bracket | # Families | % Families |
| Less than $10,000 | 101 | 1.8% |
| $10,000 to $14,999 | 85 | 1.5% |
| $15,000 to $24,999 | 163 | 2.9% |
| $25,000 to $34,999 | 349 | 6.2% |
| $35,000 to $49,999 | 428 | 7.6% |
| $50,000 to $74,999 | 1,127 | 20.0% |
| $75,000 to $99,999 | 879 | 15.6% |
| $100,000 to $149,999 | 1,246 | 22.1% |
| $150,000 to $199,999 | 693 | 12.3% |
| $200,000+ | 558 | 9.9% |
Family Income by Famaliy Size in Wade Hampton
4-person families (1,183 | 21.0%) account for the highest median family income in Wade Hampton with $128,217 per family, while 3-person families (930 | 16.5%) have the highest median income of $39,722 per family member.
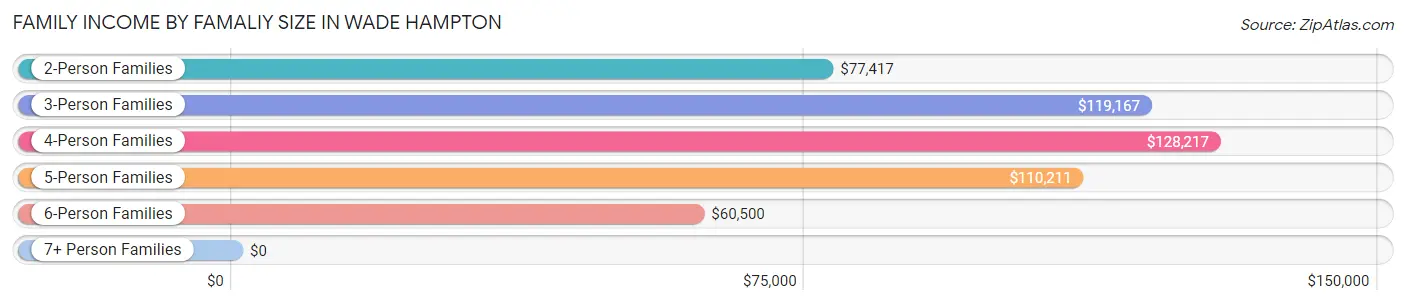
| Income Bracket | # Families | Median Income |
| 2-Person Families | 2,981 (52.9%) | $77,417 |
| 3-Person Families | 930 (16.5%) | $119,167 |
| 4-Person Families | 1,183 (21.0%) | $128,217 |
| 5-Person Families | 416 (7.4%) | $110,211 |
| 6-Person Families | 102 (1.8%) | $60,500 |
| 7+ Person Families | 25 (0.4%) | $0 |
| Total | 5,637 (100.0%) | $92,218 |
Family Income by Number of Earners in Wade Hampton
The median family income in Wade Hampton is $92,218, with families comprising 2 earners (2,265) having the highest median family income of $121,827, while families with 1 earner (1,844) have the lowest median family income of $64,475, accounting for 40.2% and 32.7% of families, respectively.
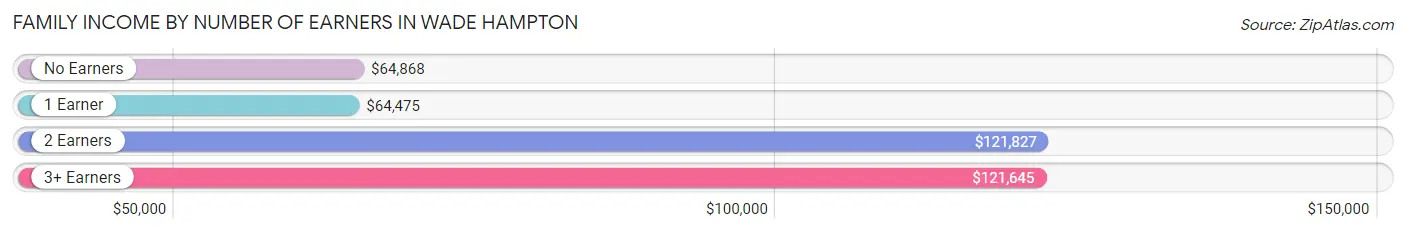
| Number of Earners | # Families | Median Income |
| No Earners | 1,074 (19.1%) | $64,868 |
| 1 Earner | 1,844 (32.7%) | $64,475 |
| 2 Earners | 2,265 (40.2%) | $121,827 |
| 3+ Earners | 454 (8.1%) | $121,645 |
| Total | 5,637 (100.0%) | $92,218 |
Household Income in Wade Hampton
Household Income Brackets in Wade Hampton
With 1,776 households falling in the category, the $50,000 to $74,999 income range is the most frequent in Wade Hampton, accounting for 19.8% of all households. In contrast, only 215 households (2.4%) fall into the $10,000 to $14,999 income bracket, making it the least populous group.
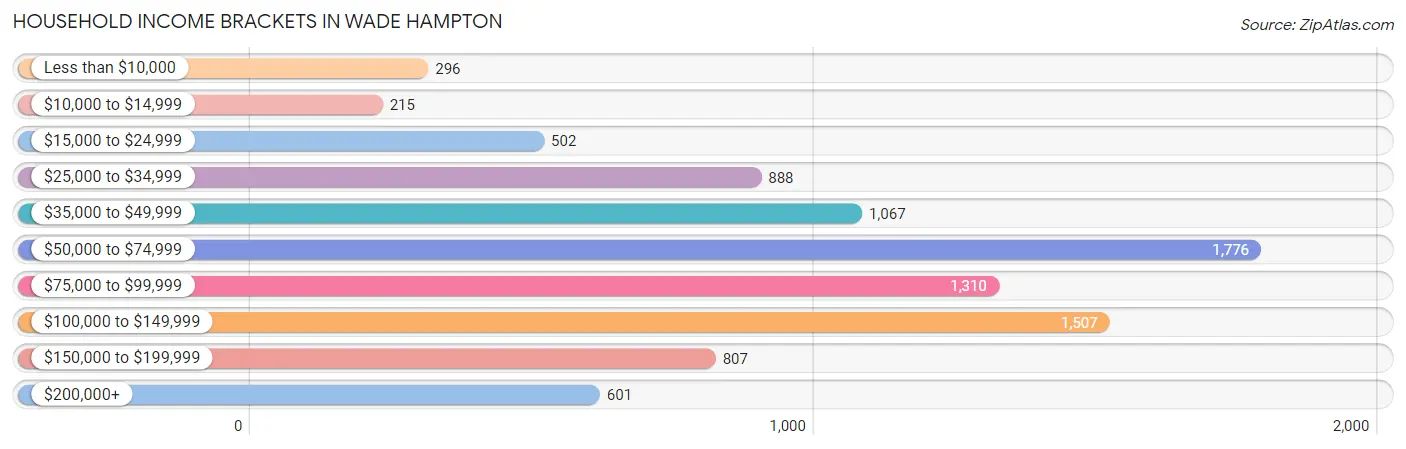
| Income Bracket | # Households | % Households |
| Less than $10,000 | 296 | 3.3% |
| $10,000 to $14,999 | 215 | 2.4% |
| $15,000 to $24,999 | 502 | 5.6% |
| $25,000 to $34,999 | 888 | 9.9% |
| $35,000 to $49,999 | 1,067 | 11.9% |
| $50,000 to $74,999 | 1,776 | 19.8% |
| $75,000 to $99,999 | 1,310 | 14.6% |
| $100,000 to $149,999 | 1,507 | 16.8% |
| $150,000 to $199,999 | 807 | 9.0% |
| $200,000+ | 601 | 6.7% |
Household Income by Householder Age in Wade Hampton
The median household income in Wade Hampton is $71,564, with the highest median household income of $86,667 found in the 45 to 64 years age bracket for the primary householder. A total of 3,010 households (33.6%) fall into this category. Meanwhile, the 15 to 24 years age bracket for the primary householder has the lowest median household income of $32,112, with 454 households (5.1%) in this group.
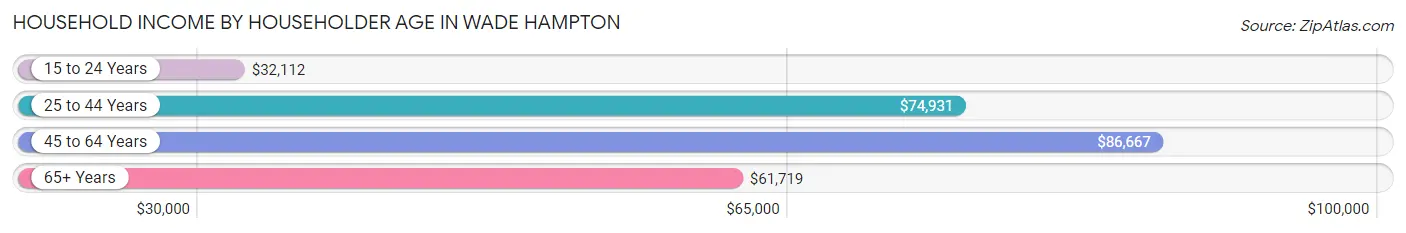
| Income Bracket | # Households | Median Income |
| 15 to 24 Years | 454 (5.1%) | $32,112 |
| 25 to 44 Years | 2,868 (32.0%) | $74,931 |
| 45 to 64 Years | 3,010 (33.6%) | $86,667 |
| 65+ Years | 2,638 (29.4%) | $61,719 |
| Total | 8,970 (100.0%) | $71,564 |
Poverty in Wade Hampton
Income Below Poverty by Sex and Age in Wade Hampton
With 8.2% poverty level for males and 10.6% for females among the residents of Wade Hampton, 18 to 24 year old males and 12 to 14 year old females are the most vulnerable to poverty, with 173 males (26.4%) and 113 females (24.3%) in their respective age groups living below the poverty level.
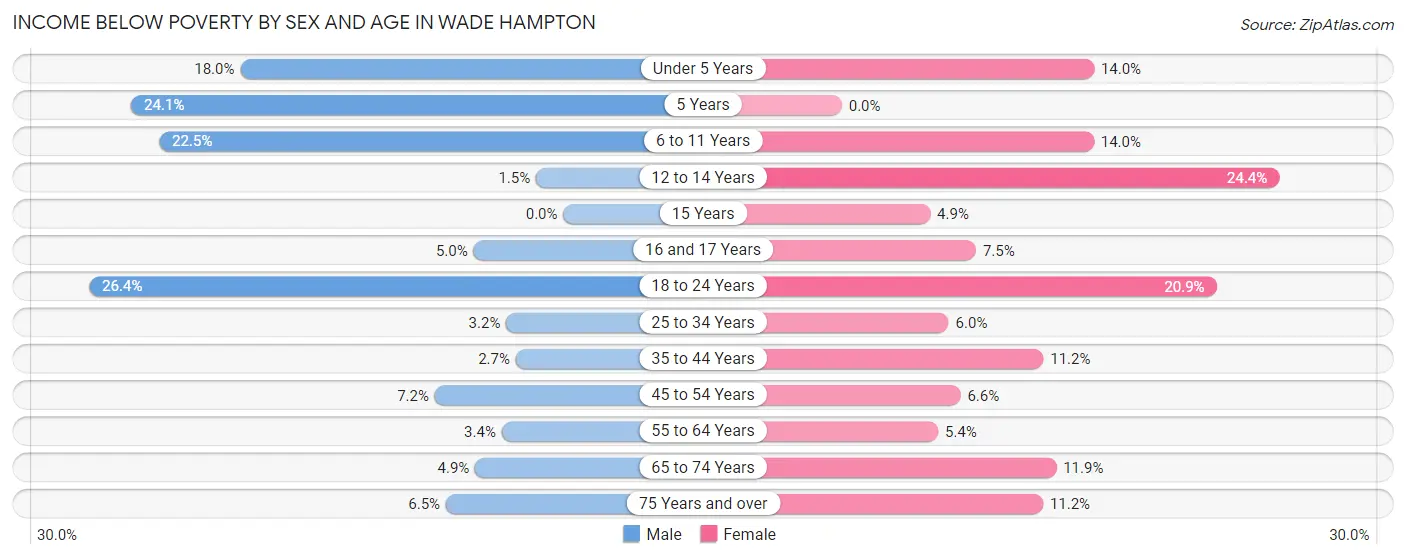
| Age Bracket | Male | Female |
| Under 5 Years | 154 (18.0%) | 66 (14.0%) |
| 5 Years | 26 (24.1%) | 0 (0.0%) |
| 6 to 11 Years | 131 (22.5%) | 111 (14.0%) |
| 12 to 14 Years | 7 (1.5%) | 113 (24.3%) |
| 15 Years | 0 (0.0%) | 16 (4.9%) |
| 16 and 17 Years | 15 (5.0%) | 26 (7.5%) |
| 18 to 24 Years | 173 (26.4%) | 150 (20.9%) |
| 25 to 34 Years | 41 (3.2%) | 69 (5.9%) |
| 35 to 44 Years | 40 (2.6%) | 192 (11.2%) |
| 45 to 54 Years | 79 (7.2%) | 83 (6.6%) |
| 55 to 64 Years | 36 (3.4%) | 78 (5.4%) |
| 65 to 74 Years | 58 (4.9%) | 145 (11.9%) |
| 75 Years and over | 60 (6.5%) | 108 (11.2%) |
| Total | 820 (8.2%) | 1,157 (10.6%) |
Income Above Poverty by Sex and Age in Wade Hampton
According to the poverty statistics in Wade Hampton, males aged 15 years and females aged 5 years are the age groups that are most secure financially, with 100.0% of males and 100.0% of females in these age groups living above the poverty line.
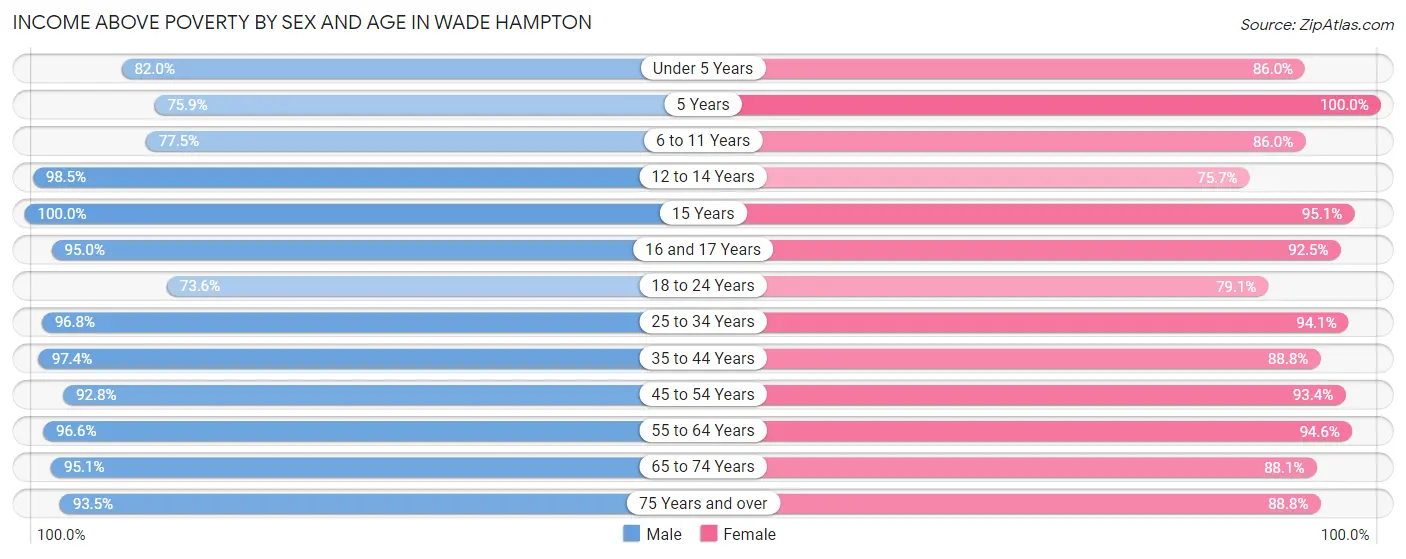
| Age Bracket | Male | Female |
| Under 5 Years | 702 (82.0%) | 404 (86.0%) |
| 5 Years | 82 (75.9%) | 76 (100.0%) |
| 6 to 11 Years | 451 (77.5%) | 680 (86.0%) |
| 12 to 14 Years | 455 (98.5%) | 351 (75.6%) |
| 15 Years | 45 (100.0%) | 309 (95.1%) |
| 16 and 17 Years | 285 (95.0%) | 322 (92.5%) |
| 18 to 24 Years | 482 (73.6%) | 569 (79.1%) |
| 25 to 34 Years | 1,249 (96.8%) | 1,090 (94.1%) |
| 35 to 44 Years | 1,471 (97.4%) | 1,519 (88.8%) |
| 45 to 54 Years | 1,025 (92.8%) | 1,172 (93.4%) |
| 55 to 64 Years | 1,014 (96.6%) | 1,377 (94.6%) |
| 65 to 74 Years | 1,124 (95.1%) | 1,069 (88.1%) |
| 75 Years and over | 858 (93.5%) | 856 (88.8%) |
| Total | 9,243 (91.8%) | 9,794 (89.4%) |
Income Below Poverty Among Married-Couple Families in Wade Hampton
The poverty statistics for married-couple families in Wade Hampton show that 3.0% or 126 of the total 4,241 families live below the poverty line. Families with 3 or 4 children have the highest poverty rate of 22.2%, comprising of 80 families. On the other hand, families with 1 or 2 children have the lowest poverty rate of 0.0%, which includes 0 families.
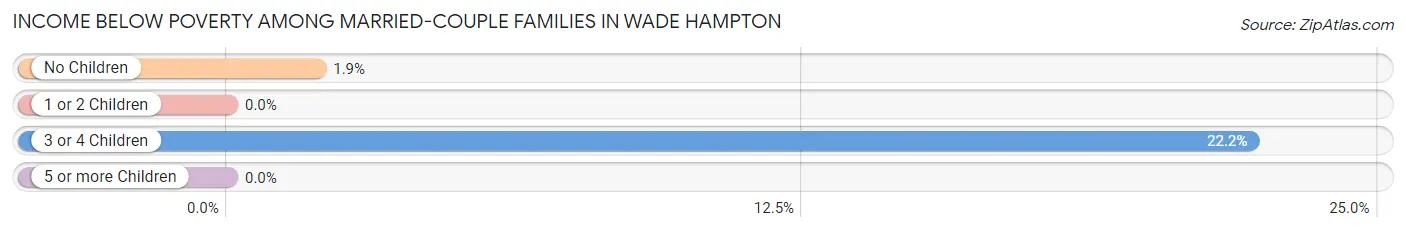
| Children | Above Poverty | Below Poverty |
| No Children | 2,352 (98.1%) | 46 (1.9%) |
| 1 or 2 Children | 1,458 (100.0%) | 0 (0.0%) |
| 3 or 4 Children | 280 (77.8%) | 80 (22.2%) |
| 5 or more Children | 25 (100.0%) | 0 (0.0%) |
| Total | 4,115 (97.0%) | 126 (3.0%) |
Income Below Poverty Among Single-Parent Households in Wade Hampton
According to the poverty data in Wade Hampton, 9.9% or 45 single-father households and 23.0% or 216 single-mother households are living below the poverty line. Among single-father households, those with 1 or 2 children have the highest poverty rate, with 35 households (21.6%) experiencing poverty. Likewise, among single-mother households, those with 1 or 2 children have the highest poverty rate, with 216 households (50.0%) falling below the poverty line.
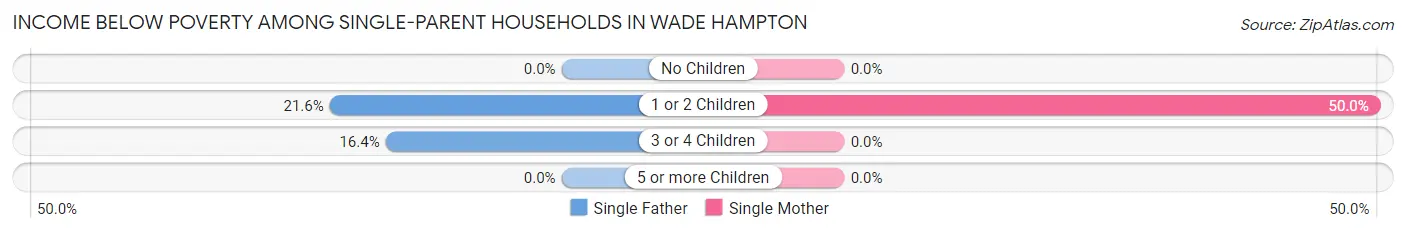
| Children | Single Father | Single Mother |
| No Children | 0 (0.0%) | 0 (0.0%) |
| 1 or 2 Children | 35 (21.6%) | 216 (50.0%) |
| 3 or 4 Children | 10 (16.4%) | 0 (0.0%) |
| 5 or more Children | 0 (0.0%) | 0 (0.0%) |
| Total | 45 (9.9%) | 216 (23.0%) |
Income Below Poverty Among Married-Couple vs Single-Parent Households in Wade Hampton
The poverty data for Wade Hampton shows that 126 of the married-couple family households (3.0%) and 261 of the single-parent households (18.7%) are living below the poverty level. Within the married-couple family households, those with 3 or 4 children have the highest poverty rate, with 80 households (22.2%) falling below the poverty line. Among the single-parent households, those with 1 or 2 children have the highest poverty rate, with 251 household (42.3%) living below poverty.
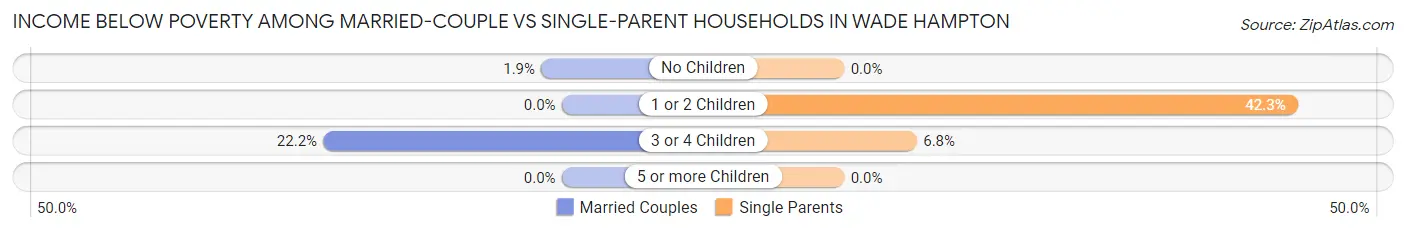
| Children | Married-Couple Families | Single-Parent Households |
| No Children | 46 (1.9%) | 0 (0.0%) |
| 1 or 2 Children | 0 (0.0%) | 251 (42.3%) |
| 3 or 4 Children | 80 (22.2%) | 10 (6.8%) |
| 5 or more Children | 0 (0.0%) | 0 (0.0%) |
| Total | 126 (3.0%) | 261 (18.7%) |
Employment Characteristics in Wade Hampton
Employment by Class of Employer in Wade Hampton
Among the 10,414 employed individuals in Wade Hampton, private company employees (7,258 | 69.7%), not-for-profit organizations (964 | 9.3%), and self-employed (not incorporated) (627 | 6.0%) make up the most common classes of employment.
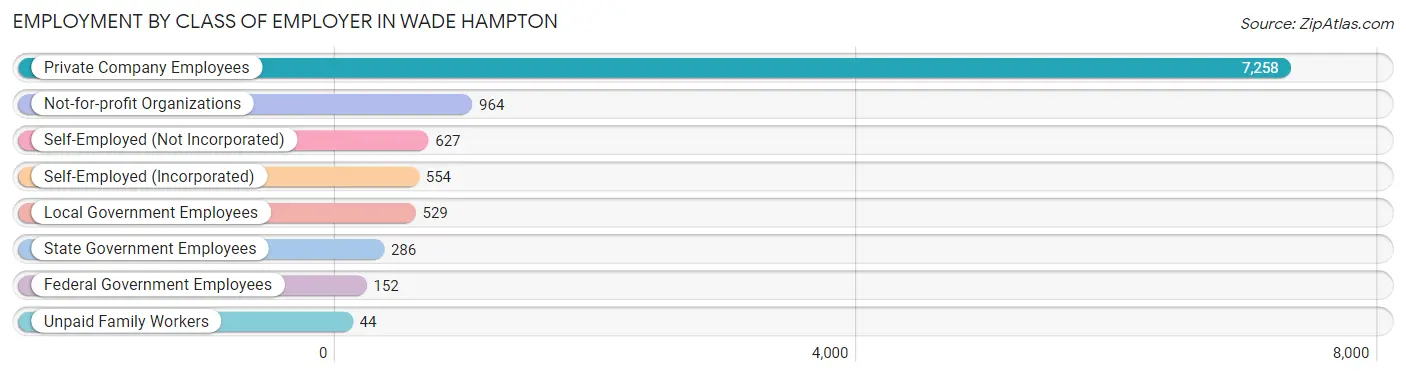
| Employer Class | # Employees | % Employees |
| Private Company Employees | 7,258 | 69.7% |
| Self-Employed (Incorporated) | 554 | 5.3% |
| Self-Employed (Not Incorporated) | 627 | 6.0% |
| Not-for-profit Organizations | 964 | 9.3% |
| Local Government Employees | 529 | 5.1% |
| State Government Employees | 286 | 2.8% |
| Federal Government Employees | 152 | 1.5% |
| Unpaid Family Workers | 44 | 0.4% |
| Total | 10,414 | 100.0% |
Employment Status by Age in Wade Hampton
According to the labor force statistics for Wade Hampton, out of the total population over 16 years of age (16,835), 64.3% or 10,825 individuals are in the labor force, with 3.1% or 336 of them unemployed. The age group with the highest labor force participation rate is 30 to 34 years, with 91.5% or 1,232 individuals in the labor force. Within the labor force, the 55 to 59 years age range has the highest percentage of unemployed individuals, with 7.6% or 79 of them being unemployed.
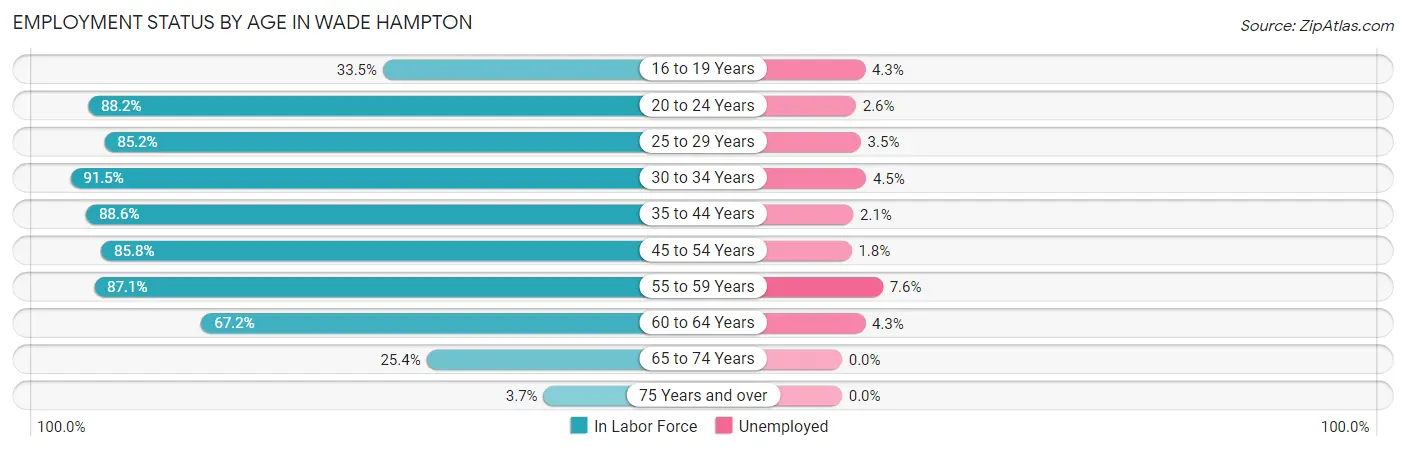
| Age Bracket | In Labor Force | Unemployed |
| 16 to 19 Years | 370 (33.5%) | 16 (4.3%) |
| 20 to 24 Years | 810 (88.2%) | 21 (2.6%) |
| 25 to 29 Years | 940 (85.2%) | 33 (3.5%) |
| 30 to 34 Years | 1,232 (91.5%) | 55 (4.5%) |
| 35 to 44 Years | 2,855 (88.6%) | 60 (2.1%) |
| 45 to 54 Years | 2,024 (85.8%) | 36 (1.8%) |
| 55 to 59 Years | 1,033 (87.1%) | 79 (7.6%) |
| 60 to 64 Years | 886 (67.2%) | 38 (4.3%) |
| 65 to 74 Years | 609 (25.4%) | 0 (0.0%) |
| 75 Years and over | 70 (3.7%) | 0 (0.0%) |
| Total | 10,825 (64.3%) | 336 (3.1%) |
Employment Status by Educational Attainment in Wade Hampton
According to labor force statistics for Wade Hampton, 85.1% of individuals (8,965) out of the total population between 25 and 64 years of age (10,535) are in the labor force, with 3.4% or 305 of them being unemployed. The group with the highest labor force participation rate are those with the educational attainment of college / associate degree, with 88.3% or 3,226 individuals in the labor force. Within the labor force, individuals with less than high school education have the highest percentage of unemployment, with 8.7% or 35 of them being unemployed.
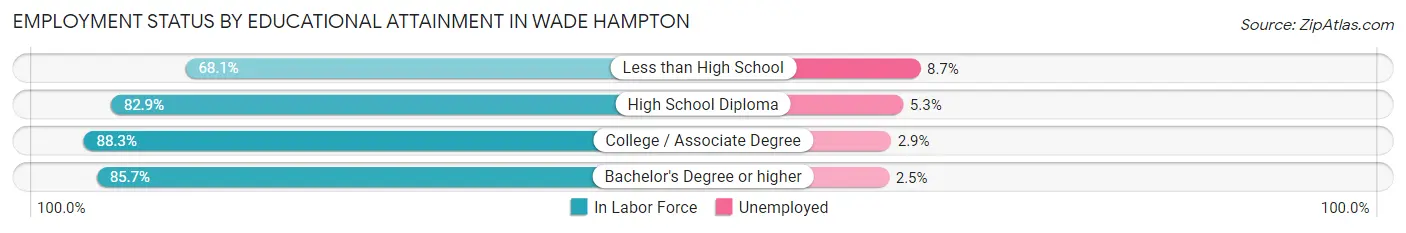
| Educational Attainment | In Labor Force | Unemployed |
| Less than High School | 403 (68.1%) | 52 (8.7%) |
| High School Diploma | 1,444 (82.9%) | 92 (5.3%) |
| College / Associate Degree | 3,226 (88.3%) | 106 (2.9%) |
| Bachelor's Degree or higher | 3,897 (85.7%) | 114 (2.5%) |
| Total | 8,965 (85.1%) | 358 (3.4%) |
Employment Occupations by Sex in Wade Hampton
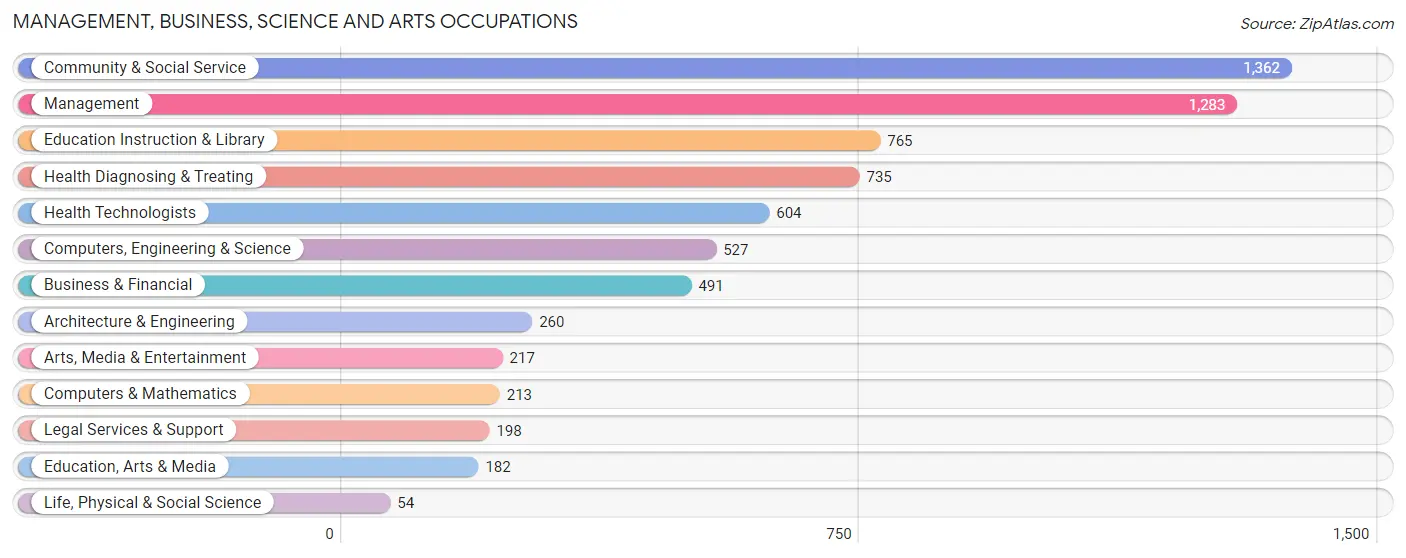
Management, Business, Science and Arts Occupations
The most common Management, Business, Science and Arts occupations in Wade Hampton are Community & Social Service (1,362 | 13.0%), Management (1,283 | 12.2%), Education Instruction & Library (765 | 7.3%), Health Diagnosing & Treating (735 | 7.0%), and Health Technologists (604 | 5.8%).
Management, Business, Science and Arts Occupations by Sex
Within the Management, Business, Science and Arts occupations in Wade Hampton, the most male-oriented occupations are Life, Physical & Social Science (100.0%), Architecture & Engineering (87.3%), and Computers, Engineering & Science (82.9%), while the most female-oriented occupations are Health Diagnosing & Treating (80.8%), Health Technologists (79.0%), and Arts, Media & Entertainment (68.2%).
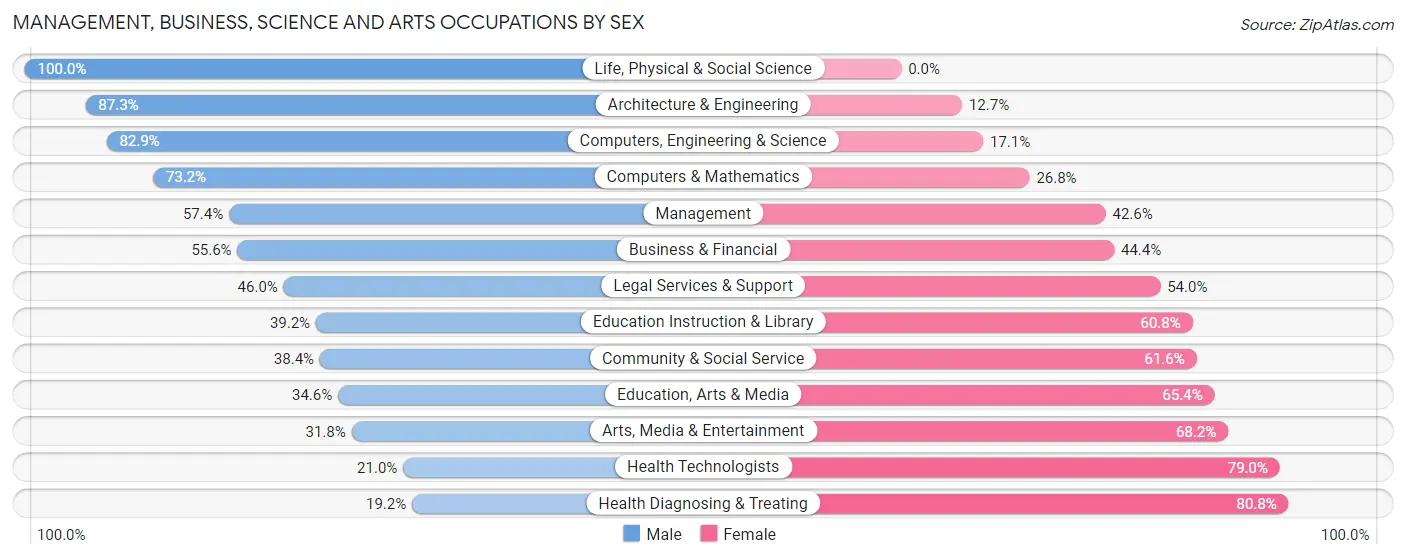
| Occupation | Male | Female |
| Management | 736 (57.4%) | 547 (42.6%) |
| Business & Financial | 273 (55.6%) | 218 (44.4%) |
| Computers, Engineering & Science | 437 (82.9%) | 90 (17.1%) |
| Computers & Mathematics | 156 (73.2%) | 57 (26.8%) |
| Architecture & Engineering | 227 (87.3%) | 33 (12.7%) |
| Life, Physical & Social Science | 54 (100.0%) | 0 (0.0%) |
| Community & Social Service | 523 (38.4%) | 839 (61.6%) |
| Education, Arts & Media | 63 (34.6%) | 119 (65.4%) |
| Legal Services & Support | 91 (46.0%) | 107 (54.0%) |
| Education Instruction & Library | 300 (39.2%) | 465 (60.8%) |
| Arts, Media & Entertainment | 69 (31.8%) | 148 (68.2%) |
| Health Diagnosing & Treating | 141 (19.2%) | 594 (80.8%) |
| Health Technologists | 127 (21.0%) | 477 (79.0%) |
| Total (Category) | 2,110 (48.0%) | 2,288 (52.0%) |
| Total (Overall) | 5,573 (53.2%) | 4,899 (46.8%) |
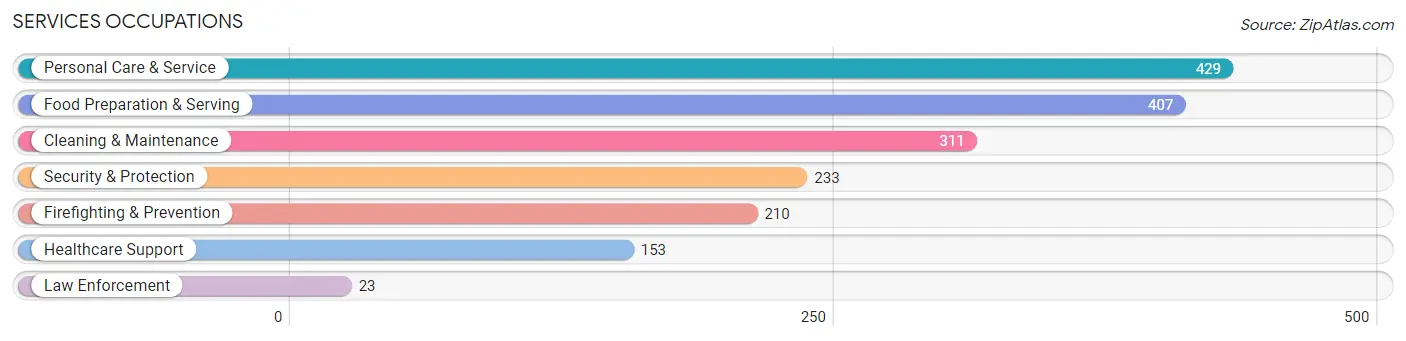
Services Occupations
The most common Services occupations in Wade Hampton are Personal Care & Service (429 | 4.1%), Food Preparation & Serving (407 | 3.9%), Cleaning & Maintenance (311 | 3.0%), Security & Protection (233 | 2.2%), and Firefighting & Prevention (210 | 2.0%).
Services Occupations by Sex
Within the Services occupations in Wade Hampton, the most male-oriented occupations are Cleaning & Maintenance (58.5%), Food Preparation & Serving (57.7%), and Law Enforcement (39.1%), while the most female-oriented occupations are Healthcare Support (77.8%), Firefighting & Prevention (73.8%), and Security & Protection (72.5%).
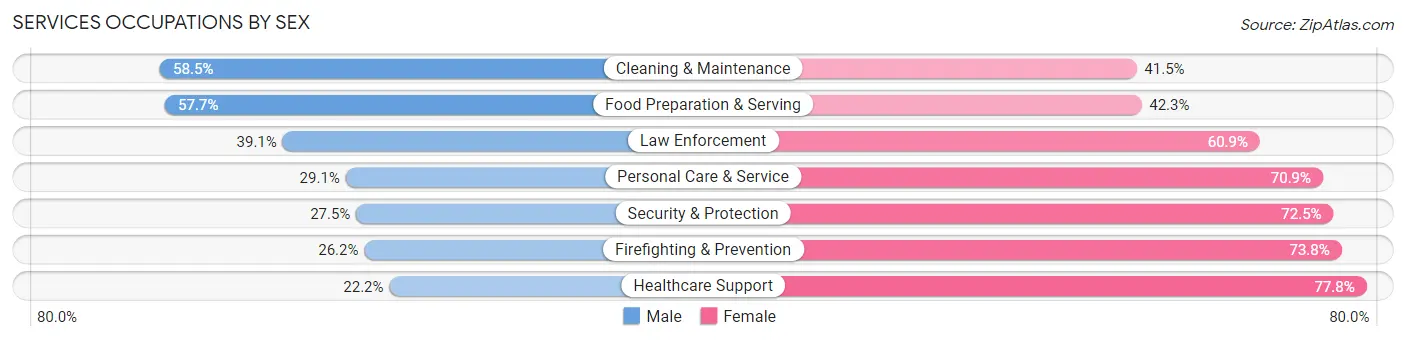
| Occupation | Male | Female |
| Healthcare Support | 34 (22.2%) | 119 (77.8%) |
| Security & Protection | 64 (27.5%) | 169 (72.5%) |
| Firefighting & Prevention | 55 (26.2%) | 155 (73.8%) |
| Law Enforcement | 9 (39.1%) | 14 (60.9%) |
| Food Preparation & Serving | 235 (57.7%) | 172 (42.3%) |
| Cleaning & Maintenance | 182 (58.5%) | 129 (41.5%) |
| Personal Care & Service | 125 (29.1%) | 304 (70.9%) |
| Total (Category) | 640 (41.7%) | 893 (58.3%) |
| Total (Overall) | 5,573 (53.2%) | 4,899 (46.8%) |
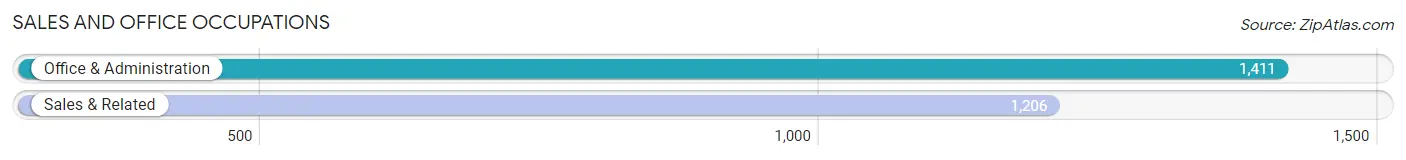
Sales and Office Occupations
The most common Sales and Office occupations in Wade Hampton are Office & Administration (1,411 | 13.5%), and Sales & Related (1,206 | 11.5%).
Sales and Office Occupations by Sex
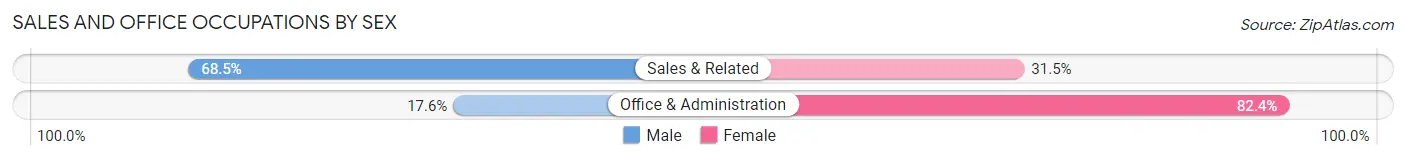
| Occupation | Male | Female |
| Sales & Related | 826 (68.5%) | 380 (31.5%) |
| Office & Administration | 248 (17.6%) | 1,163 (82.4%) |
| Total (Category) | 1,074 (41.0%) | 1,543 (59.0%) |
| Total (Overall) | 5,573 (53.2%) | 4,899 (46.8%) |
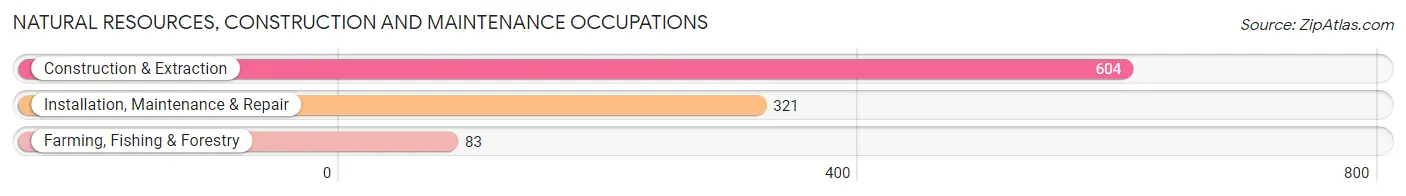
Natural Resources, Construction and Maintenance Occupations
The most common Natural Resources, Construction and Maintenance occupations in Wade Hampton are Construction & Extraction (604 | 5.8%), Installation, Maintenance & Repair (321 | 3.1%), and Farming, Fishing & Forestry (83 | 0.8%).
Natural Resources, Construction and Maintenance Occupations by Sex
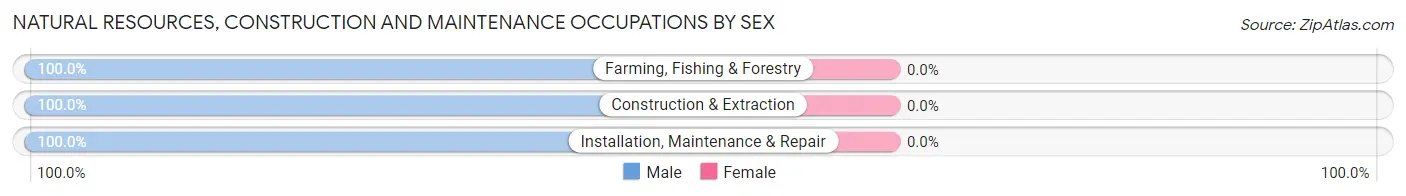
| Occupation | Male | Female |
| Farming, Fishing & Forestry | 83 (100.0%) | 0 (0.0%) |
| Construction & Extraction | 604 (100.0%) | 0 (0.0%) |
| Installation, Maintenance & Repair | 321 (100.0%) | 0 (0.0%) |
| Total (Category) | 1,008 (100.0%) | 0 (0.0%) |
| Total (Overall) | 5,573 (53.2%) | 4,899 (46.8%) |
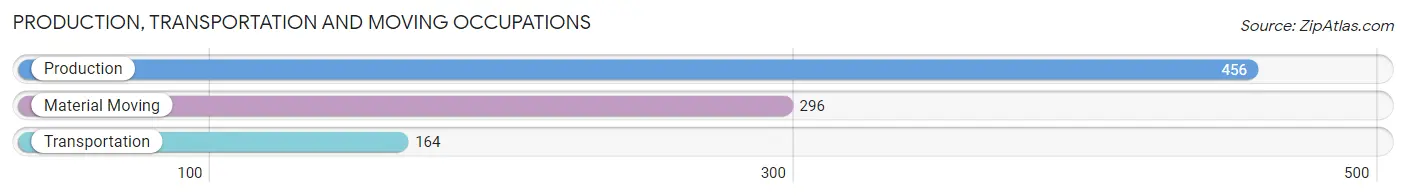
Production, Transportation and Moving Occupations
The most common Production, Transportation and Moving occupations in Wade Hampton are Production (456 | 4.3%), Material Moving (296 | 2.8%), and Transportation (164 | 1.6%).
Production, Transportation and Moving Occupations by Sex
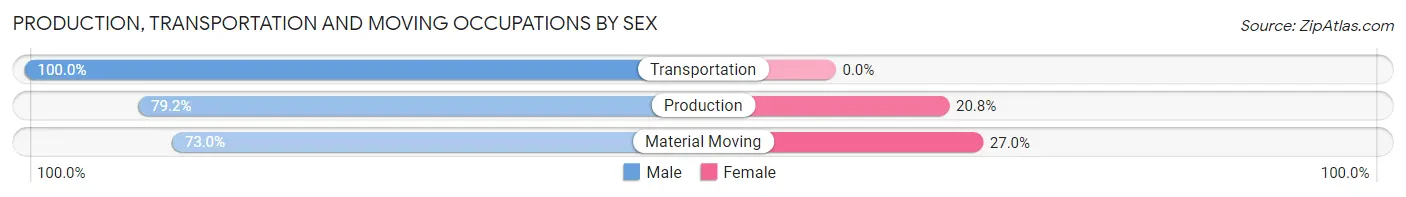
| Occupation | Male | Female |
| Production | 361 (79.2%) | 95 (20.8%) |
| Transportation | 164 (100.0%) | 0 (0.0%) |
| Material Moving | 216 (73.0%) | 80 (27.0%) |
| Total (Category) | 741 (80.9%) | 175 (19.1%) |
| Total (Overall) | 5,573 (53.2%) | 4,899 (46.8%) |
Employment Industries by Sex in Wade Hampton
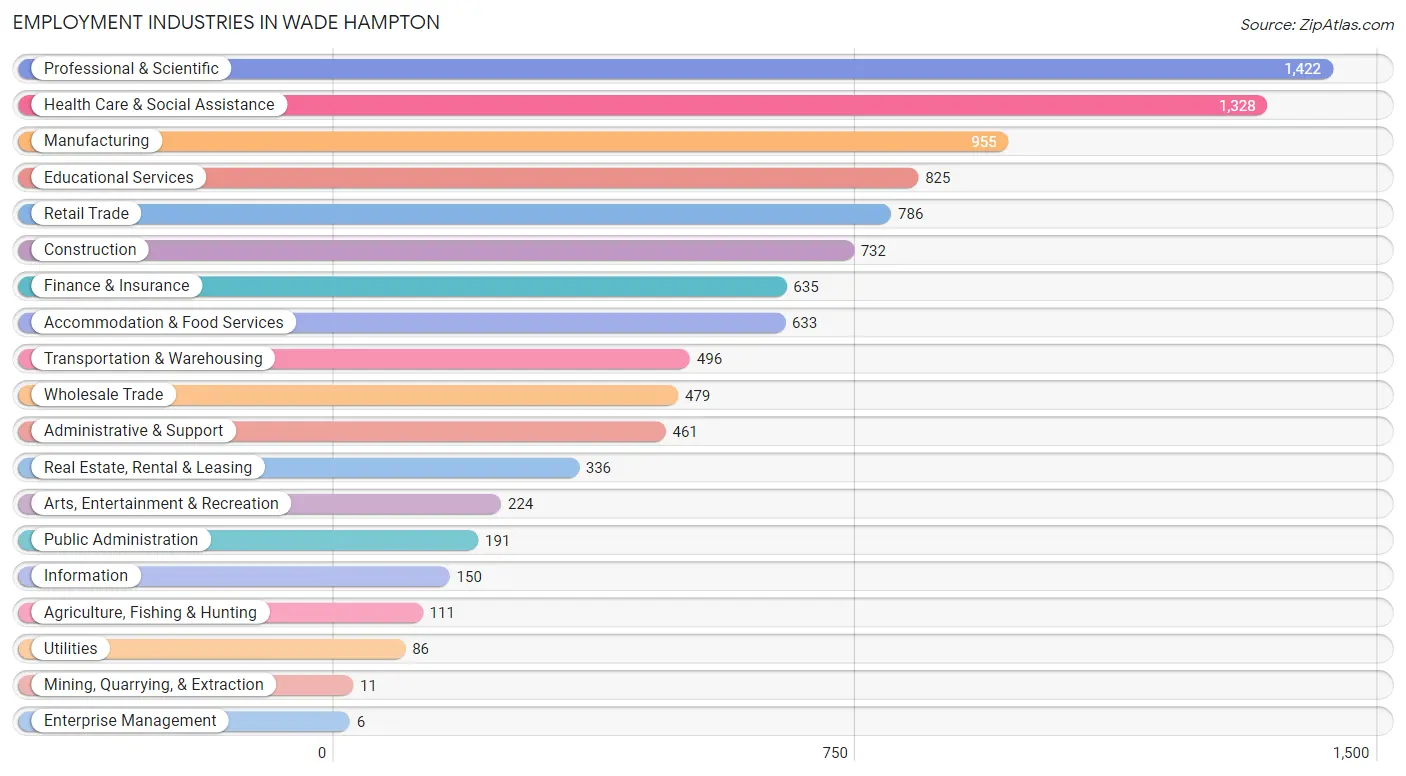
Employment Industries in Wade Hampton
The major employment industries in Wade Hampton include Professional & Scientific (1,422 | 13.6%), Health Care & Social Assistance (1,328 | 12.7%), Manufacturing (955 | 9.1%), Educational Services (825 | 7.9%), and Retail Trade (786 | 7.5%).
Employment Industries by Sex in Wade Hampton
The Wade Hampton industries that see more men than women are Mining, Quarrying, & Extraction (100.0%), Utilities (100.0%), and Enterprise Management (100.0%), whereas the industries that tend to have a higher number of women are Health Care & Social Assistance (76.8%), Information (76.0%), and Arts, Entertainment & Recreation (67.4%).
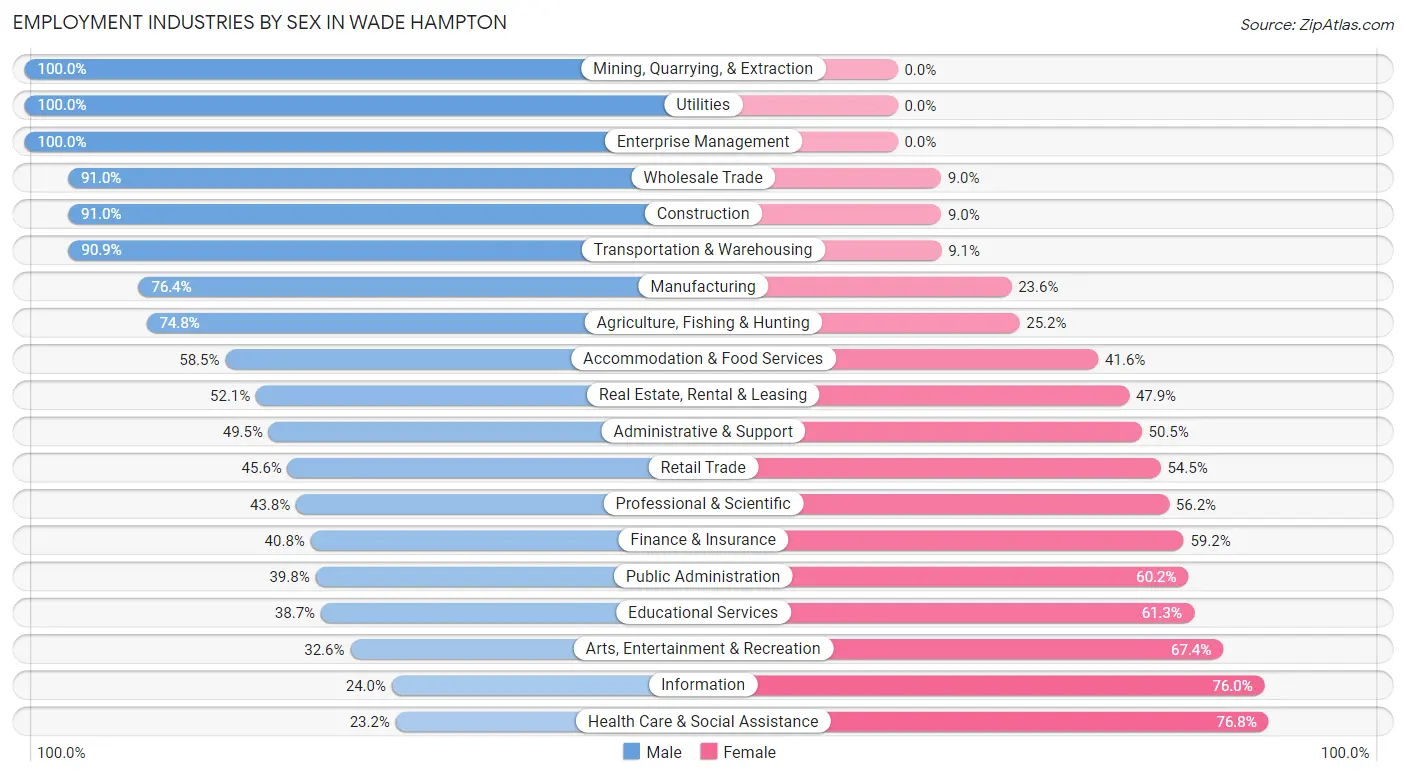
| Industry | Male | Female |
| Agriculture, Fishing & Hunting | 83 (74.8%) | 28 (25.2%) |
| Mining, Quarrying, & Extraction | 11 (100.0%) | 0 (0.0%) |
| Construction | 666 (91.0%) | 66 (9.0%) |
| Manufacturing | 730 (76.4%) | 225 (23.6%) |
| Wholesale Trade | 436 (91.0%) | 43 (9.0%) |
| Retail Trade | 358 (45.6%) | 428 (54.4%) |
| Transportation & Warehousing | 451 (90.9%) | 45 (9.1%) |
| Utilities | 86 (100.0%) | 0 (0.0%) |
| Information | 36 (24.0%) | 114 (76.0%) |
| Finance & Insurance | 259 (40.8%) | 376 (59.2%) |
| Real Estate, Rental & Leasing | 175 (52.1%) | 161 (47.9%) |
| Professional & Scientific | 623 (43.8%) | 799 (56.2%) |
| Enterprise Management | 6 (100.0%) | 0 (0.0%) |
| Administrative & Support | 228 (49.5%) | 233 (50.5%) |
| Educational Services | 319 (38.7%) | 506 (61.3%) |
| Health Care & Social Assistance | 308 (23.2%) | 1,020 (76.8%) |
| Arts, Entertainment & Recreation | 73 (32.6%) | 151 (67.4%) |
| Accommodation & Food Services | 370 (58.5%) | 263 (41.5%) |
| Public Administration | 76 (39.8%) | 115 (60.2%) |
| Total | 5,573 (53.2%) | 4,899 (46.8%) |
Education in Wade Hampton
School Enrollment in Wade Hampton
The most common levels of schooling among the 4,562 students in Wade Hampton are high school (1,288 | 28.2%), middle school (1,153 | 25.3%), and elementary school (995 | 21.8%).
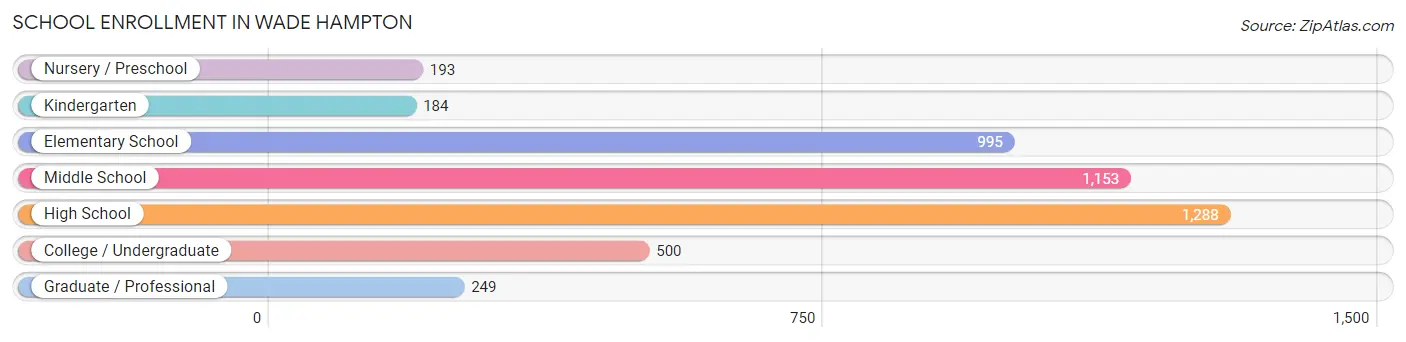
| School Level | # Students | % Students |
| Nursery / Preschool | 193 | 4.2% |
| Kindergarten | 184 | 4.0% |
| Elementary School | 995 | 21.8% |
| Middle School | 1,153 | 25.3% |
| High School | 1,288 | 28.2% |
| College / Undergraduate | 500 | 11.0% |
| Graduate / Professional | 249 | 5.5% |
| Total | 4,562 | 100.0% |
School Enrollment by Age by Funding Source in Wade Hampton
Out of a total of 4,562 students who are enrolled in schools in Wade Hampton, 1,099 (24.1%) attend a private institution, while the remaining 3,463 (75.9%) are enrolled in public schools. The age group of 3 to 4 year olds has the highest likelihood of being enrolled in private schools, with 108 (73.0% in the age bracket) enrolled. Conversely, the age group of 18 to 19 year olds has the lowest likelihood of being enrolled in a private school, with 344 (98.6% in the age bracket) attending a public institution.
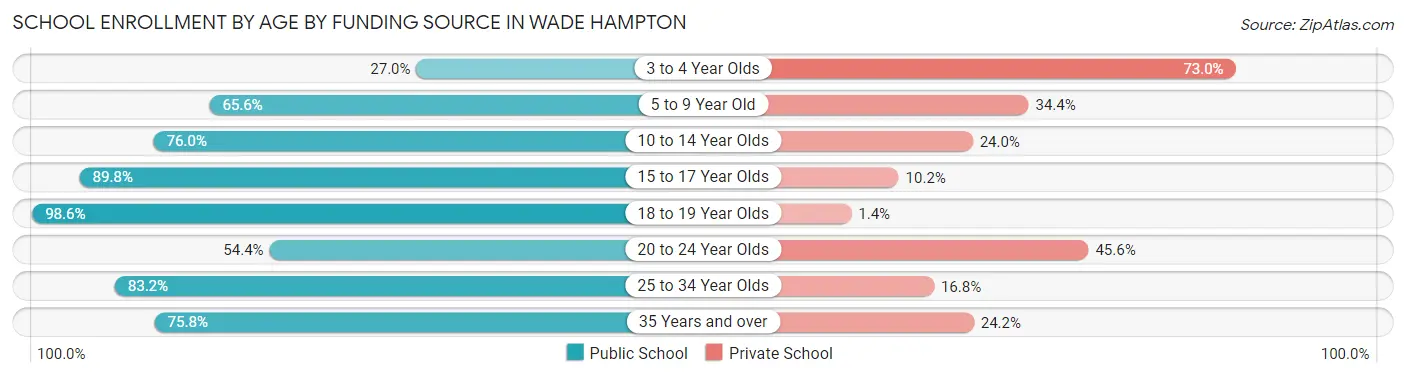
| Age Bracket | Public School | Private School |
| 3 to 4 Year Olds | 40 (27.0%) | 108 (73.0%) |
| 5 to 9 Year Old | 712 (65.6%) | 374 (34.4%) |
| 10 to 14 Year Olds | 1,037 (76.0%) | 328 (24.0%) |
| 15 to 17 Year Olds | 850 (89.8%) | 97 (10.2%) |
| 18 to 19 Year Olds | 344 (98.6%) | 5 (1.4%) |
| 20 to 24 Year Olds | 105 (54.4%) | 88 (45.6%) |
| 25 to 34 Year Olds | 178 (83.2%) | 36 (16.8%) |
| 35 Years and over | 197 (75.8%) | 63 (24.2%) |
| Total | 3,463 (75.9%) | 1,099 (24.1%) |
Educational Attainment by Field of Study in Wade Hampton
Business (1,572 | 21.9%), education (985 | 13.7%), science & technology (684 | 9.5%), liberal arts & history (588 | 8.2%), and social sciences (498 | 6.9%) are the most common fields of study among 7,182 individuals in Wade Hampton who have obtained a bachelor's degree or higher.
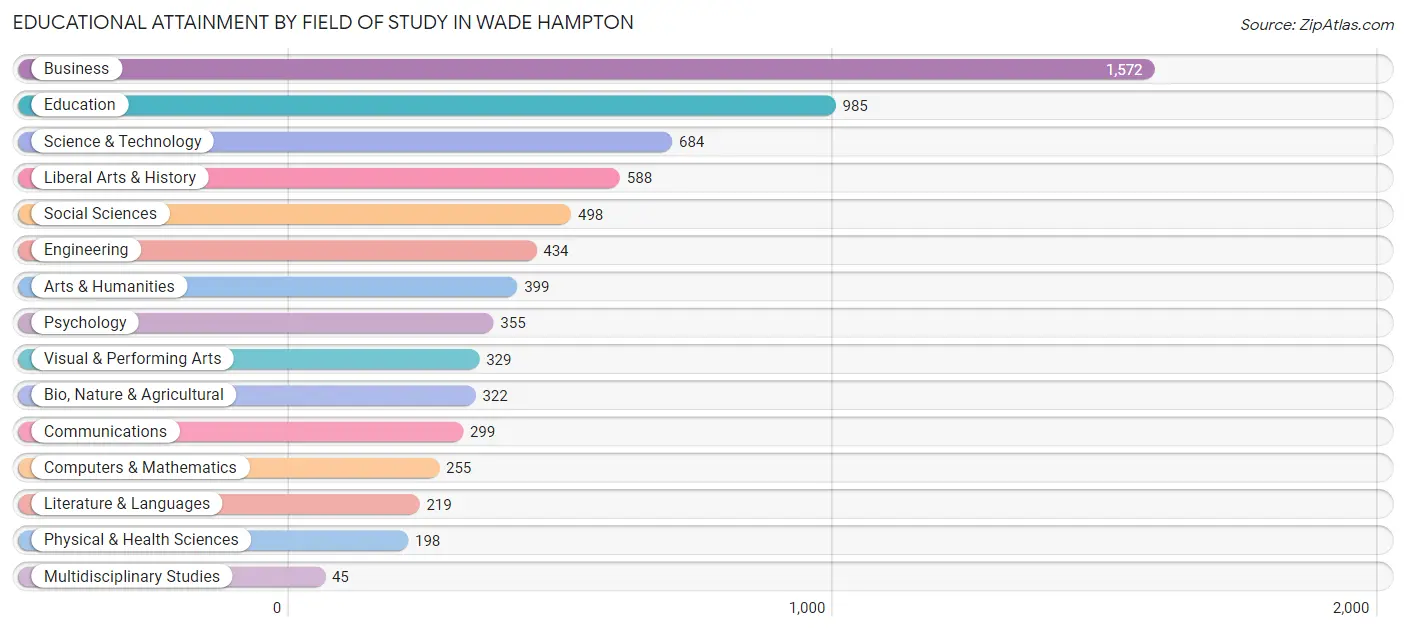
| Field of Study | # Graduates | % Graduates |
| Computers & Mathematics | 255 | 3.5% |
| Bio, Nature & Agricultural | 322 | 4.5% |
| Physical & Health Sciences | 198 | 2.8% |
| Psychology | 355 | 4.9% |
| Social Sciences | 498 | 6.9% |
| Engineering | 434 | 6.0% |
| Multidisciplinary Studies | 45 | 0.6% |
| Science & Technology | 684 | 9.5% |
| Business | 1,572 | 21.9% |
| Education | 985 | 13.7% |
| Literature & Languages | 219 | 3.0% |
| Liberal Arts & History | 588 | 8.2% |
| Visual & Performing Arts | 329 | 4.6% |
| Communications | 299 | 4.2% |
| Arts & Humanities | 399 | 5.6% |
| Total | 7,182 | 100.0% |
Transportation & Commute in Wade Hampton
Vehicle Availability by Sex in Wade Hampton
The most prevalent vehicle ownership categories in Wade Hampton are males with 2 vehicles (2,338, accounting for 42.0%) and females with 2 vehicles (1,957, making up 48.4%).
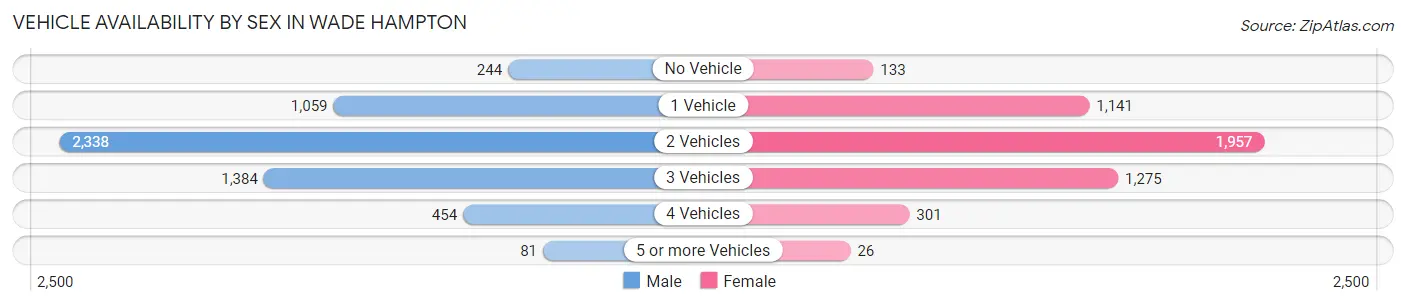
| Vehicles Available | Male | Female |
| No Vehicle | 244 (4.4%) | 133 (2.8%) |
| 1 Vehicle | 1,059 (19.1%) | 1,141 (23.6%) |
| 2 Vehicles | 2,338 (42.0%) | 1,957 (40.5%) |
| 3 Vehicles | 1,384 (24.9%) | 1,275 (26.4%) |
| 4 Vehicles | 454 (8.2%) | 301 (6.2%) |
| 5 or more Vehicles | 81 (1.5%) | 26 (0.5%) |
| Total | 5,560 (100.0%) | 4,833 (100.0%) |
Commute Time in Wade Hampton
The most frequently occuring commute durations in Wade Hampton are 15 to 19 minutes (2,342 commuters, 25.4%), 20 to 24 minutes (1,982 commuters, 21.5%), and 10 to 14 minutes (1,200 commuters, 13.0%).
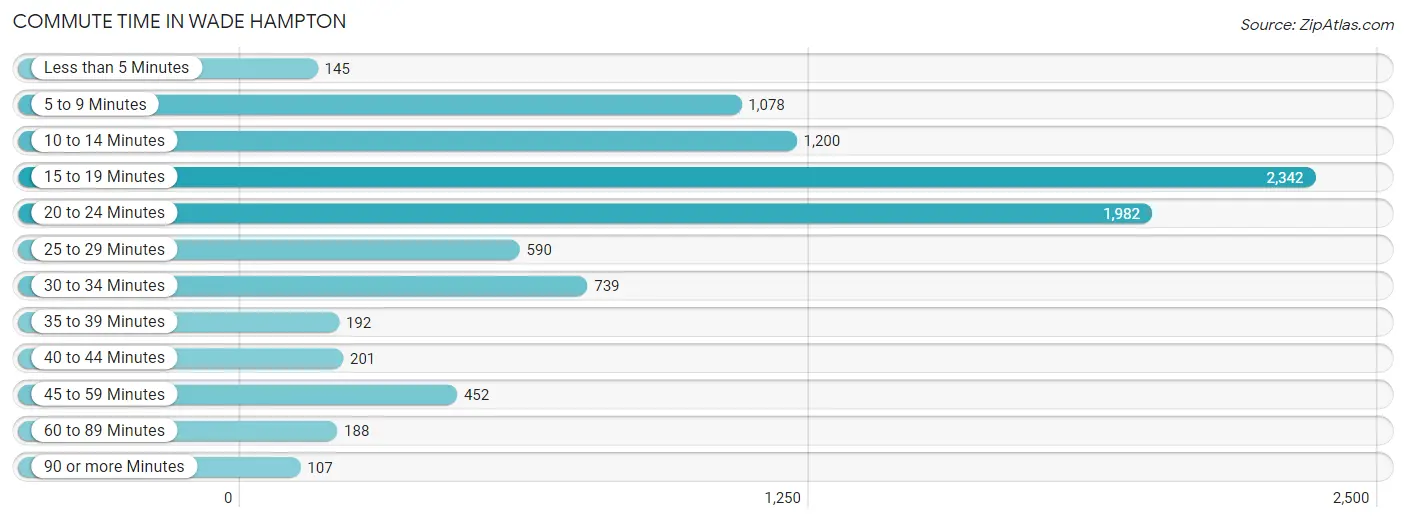
| Commute Time | # Commuters | % Commuters |
| Less than 5 Minutes | 145 | 1.6% |
| 5 to 9 Minutes | 1,078 | 11.7% |
| 10 to 14 Minutes | 1,200 | 13.0% |
| 15 to 19 Minutes | 2,342 | 25.4% |
| 20 to 24 Minutes | 1,982 | 21.5% |
| 25 to 29 Minutes | 590 | 6.4% |
| 30 to 34 Minutes | 739 | 8.0% |
| 35 to 39 Minutes | 192 | 2.1% |
| 40 to 44 Minutes | 201 | 2.2% |
| 45 to 59 Minutes | 452 | 4.9% |
| 60 to 89 Minutes | 188 | 2.0% |
| 90 or more Minutes | 107 | 1.2% |
Commute Time by Sex in Wade Hampton
The most common commute times in Wade Hampton are 15 to 19 minutes (1,277 commuters, 25.1%) for males and 15 to 19 minutes (1,065 commuters, 25.8%) for females.
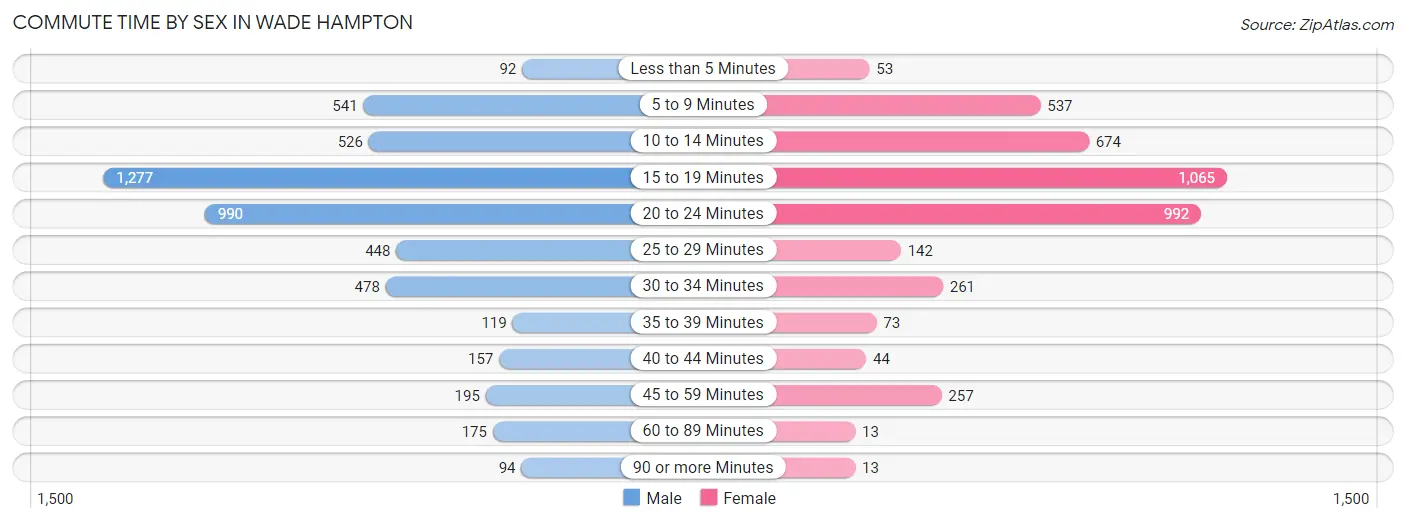
| Commute Time | Male | Female |
| Less than 5 Minutes | 92 (1.8%) | 53 (1.3%) |
| 5 to 9 Minutes | 541 (10.6%) | 537 (13.0%) |
| 10 to 14 Minutes | 526 (10.3%) | 674 (16.3%) |
| 15 to 19 Minutes | 1,277 (25.1%) | 1,065 (25.8%) |
| 20 to 24 Minutes | 990 (19.4%) | 992 (24.0%) |
| 25 to 29 Minutes | 448 (8.8%) | 142 (3.4%) |
| 30 to 34 Minutes | 478 (9.4%) | 261 (6.3%) |
| 35 to 39 Minutes | 119 (2.3%) | 73 (1.8%) |
| 40 to 44 Minutes | 157 (3.1%) | 44 (1.1%) |
| 45 to 59 Minutes | 195 (3.8%) | 257 (6.2%) |
| 60 to 89 Minutes | 175 (3.4%) | 13 (0.3%) |
| 90 or more Minutes | 94 (1.8%) | 13 (0.3%) |
Time of Departure to Work by Sex in Wade Hampton
The most frequent times of departure to work in Wade Hampton are 8:00 AM to 8:29 AM (771, 15.1%) for males and 7:30 AM to 7:59 AM (791, 19.2%) for females.
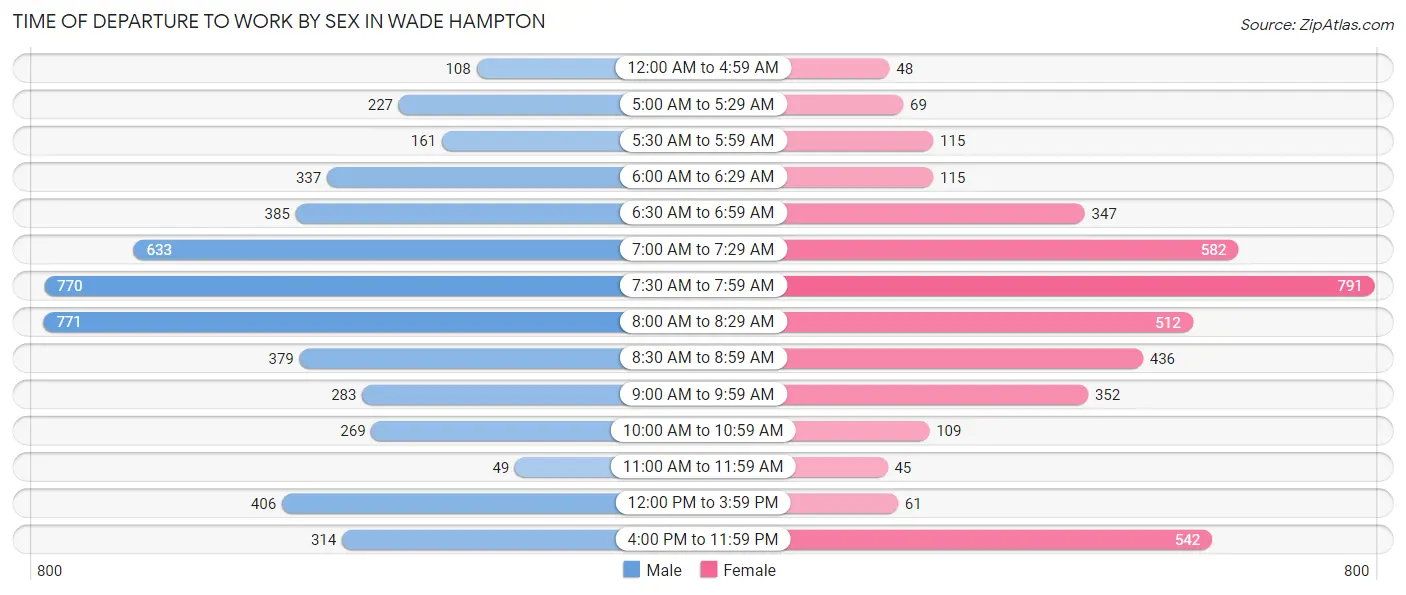
| Time of Departure | Male | Female |
| 12:00 AM to 4:59 AM | 108 (2.1%) | 48 (1.2%) |
| 5:00 AM to 5:29 AM | 227 (4.5%) | 69 (1.7%) |
| 5:30 AM to 5:59 AM | 161 (3.2%) | 115 (2.8%) |
| 6:00 AM to 6:29 AM | 337 (6.6%) | 115 (2.8%) |
| 6:30 AM to 6:59 AM | 385 (7.6%) | 347 (8.4%) |
| 7:00 AM to 7:29 AM | 633 (12.4%) | 582 (14.1%) |
| 7:30 AM to 7:59 AM | 770 (15.1%) | 791 (19.2%) |
| 8:00 AM to 8:29 AM | 771 (15.1%) | 512 (12.4%) |
| 8:30 AM to 8:59 AM | 379 (7.4%) | 436 (10.6%) |
| 9:00 AM to 9:59 AM | 283 (5.6%) | 352 (8.5%) |
| 10:00 AM to 10:59 AM | 269 (5.3%) | 109 (2.6%) |
| 11:00 AM to 11:59 AM | 49 (1.0%) | 45 (1.1%) |
| 12:00 PM to 3:59 PM | 406 (8.0%) | 61 (1.5%) |
| 4:00 PM to 11:59 PM | 314 (6.2%) | 542 (13.1%) |
| Total | 5,092 (100.0%) | 4,124 (100.0%) |
Housing Occupancy in Wade Hampton
Occupancy by Ownership in Wade Hampton
Of the total 8,970 dwellings in Wade Hampton, owner-occupied units account for 5,767 (64.3%), while renter-occupied units make up 3,203 (35.7%).
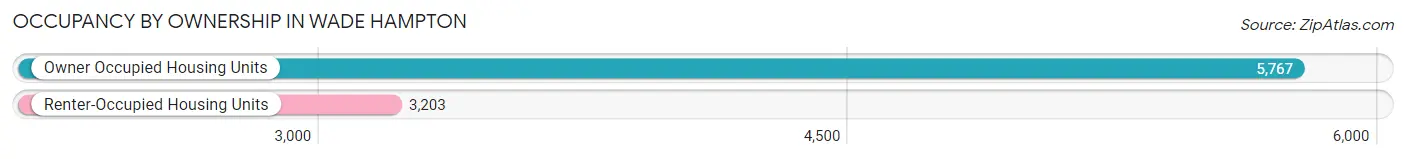
| Occupancy | # Housing Units | % Housing Units |
| Owner Occupied Housing Units | 5,767 | 64.3% |
| Renter-Occupied Housing Units | 3,203 | 35.7% |
| Total Occupied Housing Units | 8,970 | 100.0% |
Occupancy by Household Size in Wade Hampton
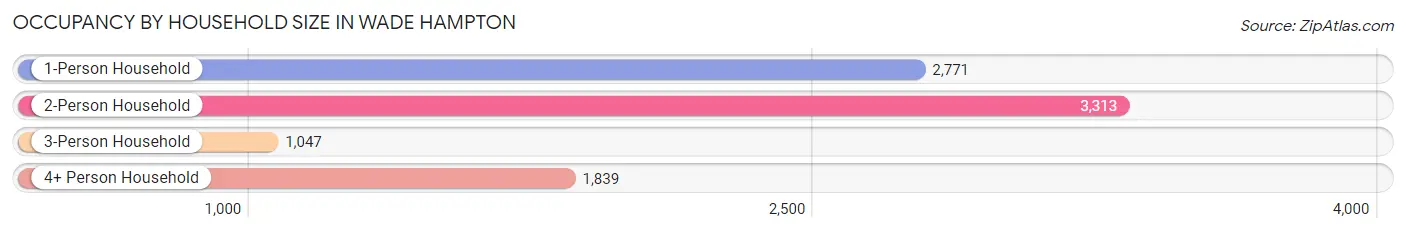
| Household Size | # Housing Units | % Housing Units |
| 1-Person Household | 2,771 | 30.9% |
| 2-Person Household | 3,313 | 36.9% |
| 3-Person Household | 1,047 | 11.7% |
| 4+ Person Household | 1,839 | 20.5% |
| Total Housing Units | 8,970 | 100.0% |
Occupancy by Ownership by Household Size in Wade Hampton
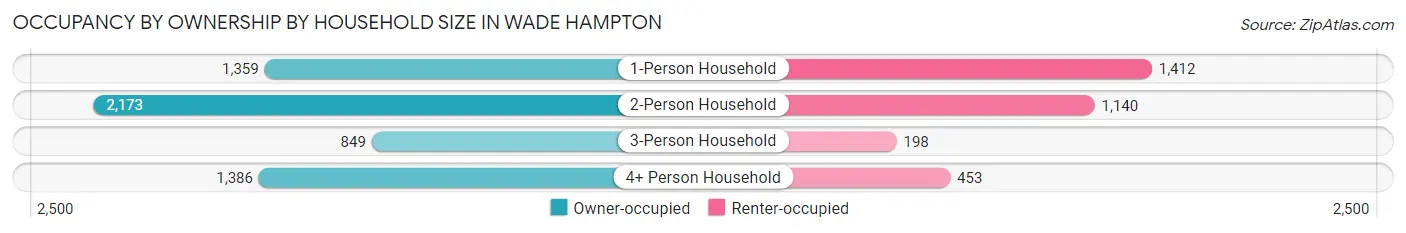
| Household Size | Owner-occupied | Renter-occupied |
| 1-Person Household | 1,359 (49.0%) | 1,412 (51.0%) |
| 2-Person Household | 2,173 (65.6%) | 1,140 (34.4%) |
| 3-Person Household | 849 (81.1%) | 198 (18.9%) |
| 4+ Person Household | 1,386 (75.4%) | 453 (24.6%) |
| Total Housing Units | 5,767 (64.3%) | 3,203 (35.7%) |
Occupancy by Educational Attainment in Wade Hampton
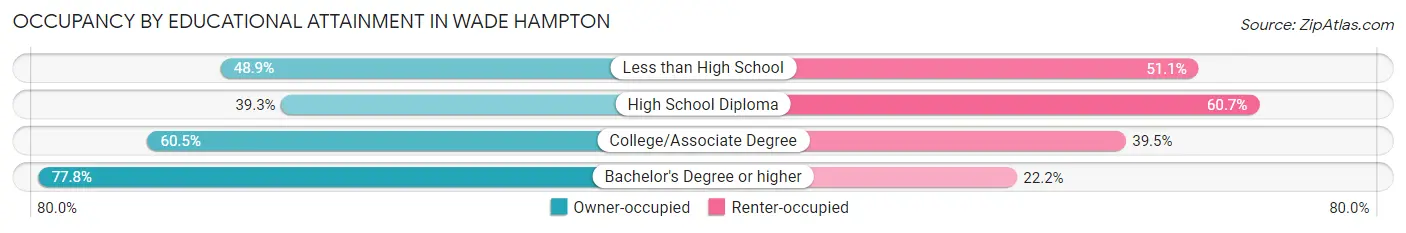
| Household Size | Owner-occupied | Renter-occupied |
| Less than High School | 218 (48.9%) | 228 (51.1%) |
| High School Diploma | 594 (39.3%) | 919 (60.7%) |
| College/Associate Degree | 1,739 (60.5%) | 1,136 (39.5%) |
| Bachelor's Degree or higher | 3,216 (77.8%) | 920 (22.2%) |
Occupancy by Age of Householder in Wade Hampton
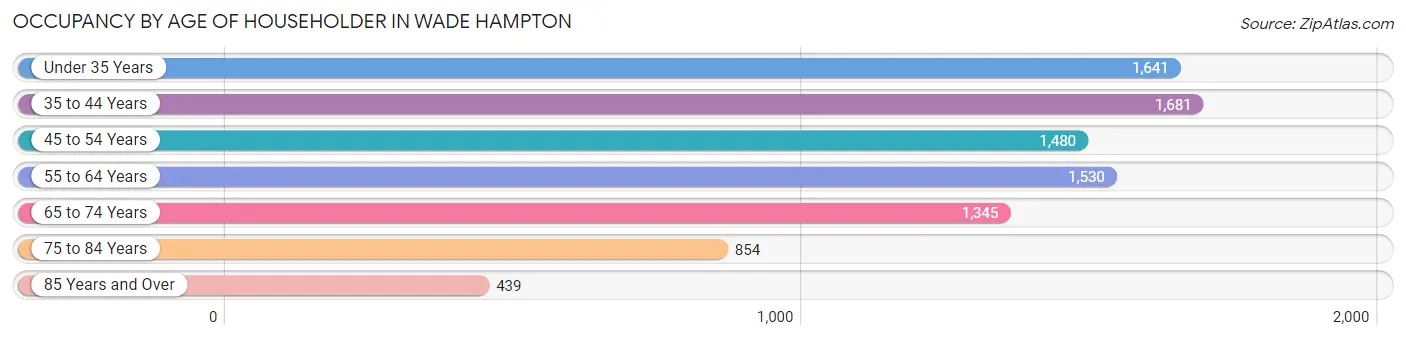
| Age Bracket | # Households | % Households |
| Under 35 Years | 1,641 | 18.3% |
| 35 to 44 Years | 1,681 | 18.7% |
| 45 to 54 Years | 1,480 | 16.5% |
| 55 to 64 Years | 1,530 | 17.1% |
| 65 to 74 Years | 1,345 | 15.0% |
| 75 to 84 Years | 854 | 9.5% |
| 85 Years and Over | 439 | 4.9% |
| Total | 8,970 | 100.0% |
Housing Finances in Wade Hampton
Median Income by Occupancy in Wade Hampton
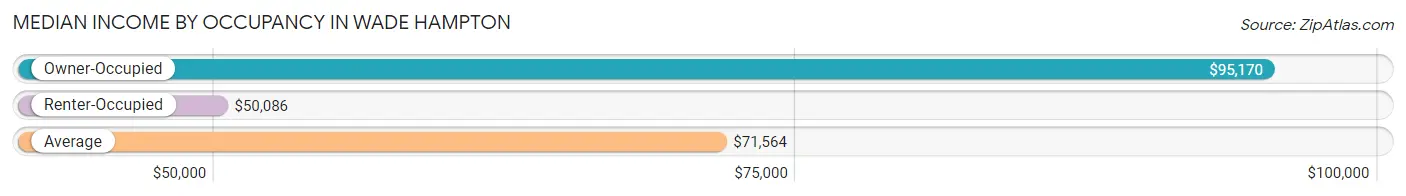
| Occupancy Type | # Households | Median Income |
| Owner-Occupied | 5,767 (64.3%) | $95,170 |
| Renter-Occupied | 3,203 (35.7%) | $50,086 |
| Average | 8,970 (100.0%) | $71,564 |
Occupancy by Householder Income Bracket in Wade Hampton
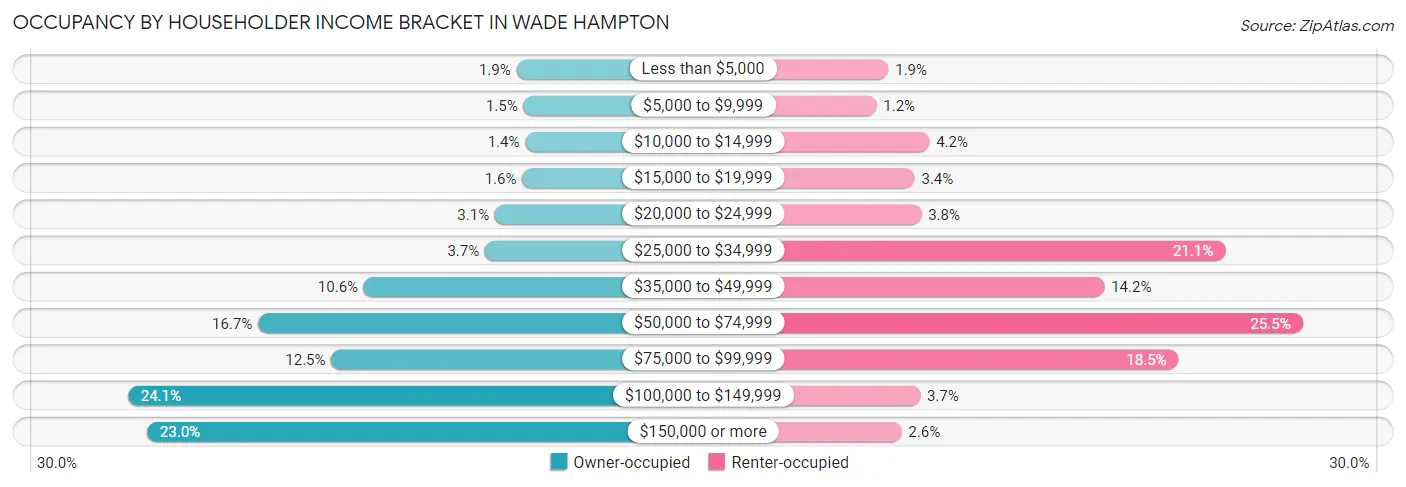
| Income Bracket | Owner-occupied | Renter-occupied |
| Less than $5,000 | 109 (1.9%) | 60 (1.9%) |
| $5,000 to $9,999 | 86 (1.5%) | 38 (1.2%) |
| $10,000 to $14,999 | 80 (1.4%) | 135 (4.2%) |
| $15,000 to $19,999 | 90 (1.6%) | 108 (3.4%) |
| $20,000 to $24,999 | 180 (3.1%) | 120 (3.7%) |
| $25,000 to $34,999 | 213 (3.7%) | 676 (21.1%) |
| $35,000 to $49,999 | 612 (10.6%) | 455 (14.2%) |
| $50,000 to $74,999 | 961 (16.7%) | 818 (25.5%) |
| $75,000 to $99,999 | 719 (12.5%) | 591 (18.4%) |
| $100,000 to $149,999 | 1,390 (24.1%) | 118 (3.7%) |
| $150,000 or more | 1,327 (23.0%) | 84 (2.6%) |
| Total | 5,767 (100.0%) | 3,203 (100.0%) |
Monthly Housing Cost Tiers in Wade Hampton
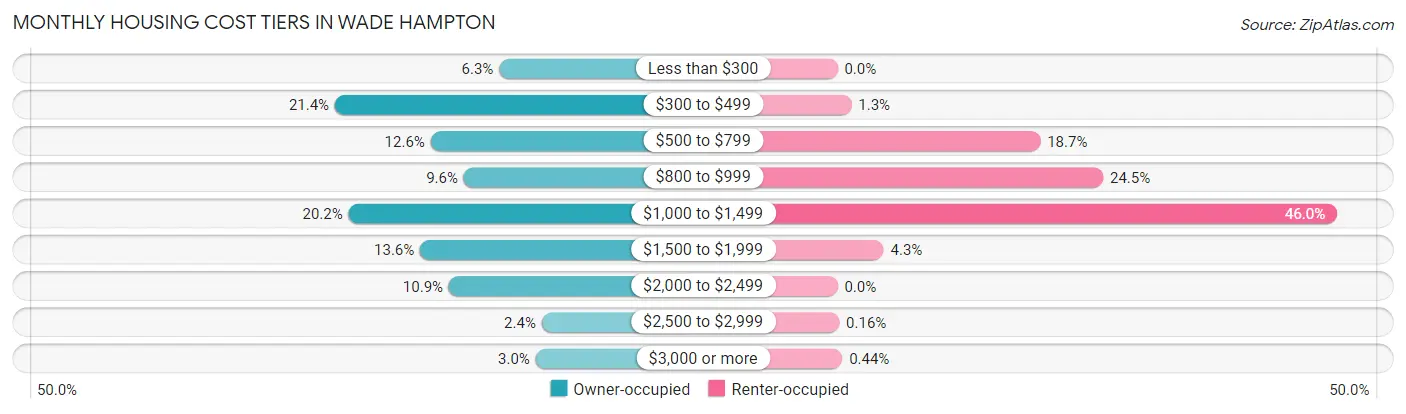
| Monthly Cost | Owner-occupied | Renter-occupied |
| Less than $300 | 364 (6.3%) | 0 (0.0%) |
| $300 to $499 | 1,236 (21.4%) | 41 (1.3%) |
| $500 to $799 | 728 (12.6%) | 598 (18.7%) |
| $800 to $999 | 552 (9.6%) | 783 (24.4%) |
| $1,000 to $1,499 | 1,164 (20.2%) | 1,473 (46.0%) |
| $1,500 to $1,999 | 784 (13.6%) | 136 (4.3%) |
| $2,000 to $2,499 | 631 (10.9%) | 0 (0.0%) |
| $2,500 to $2,999 | 138 (2.4%) | 5 (0.2%) |
| $3,000 or more | 170 (2.9%) | 14 (0.4%) |
| Total | 5,767 (100.0%) | 3,203 (100.0%) |
Physical Housing Characteristics in Wade Hampton
Housing Structures in Wade Hampton
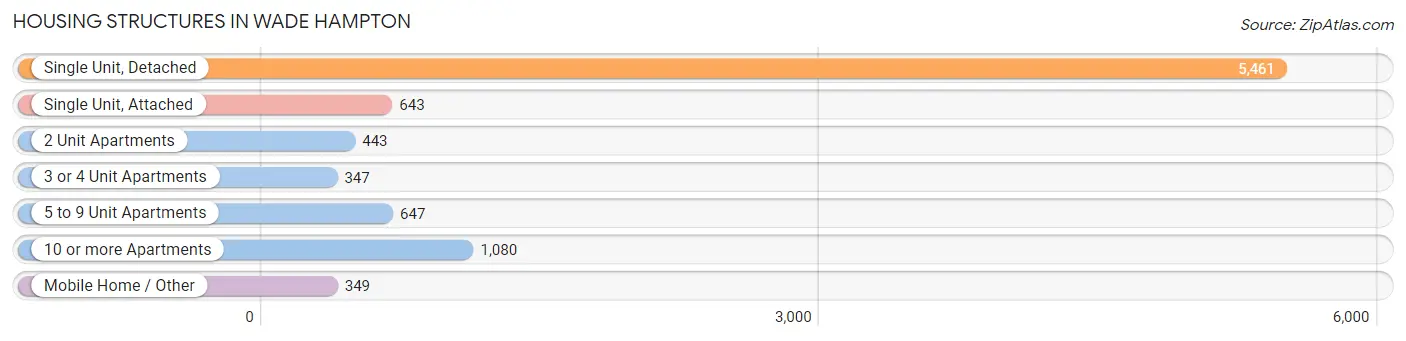
| Structure Type | # Housing Units | % Housing Units |
| Single Unit, Detached | 5,461 | 60.9% |
| Single Unit, Attached | 643 | 7.2% |
| 2 Unit Apartments | 443 | 4.9% |
| 3 or 4 Unit Apartments | 347 | 3.9% |
| 5 to 9 Unit Apartments | 647 | 7.2% |
| 10 or more Apartments | 1,080 | 12.0% |
| Mobile Home / Other | 349 | 3.9% |
| Total | 8,970 | 100.0% |
Housing Structures by Occupancy in Wade Hampton
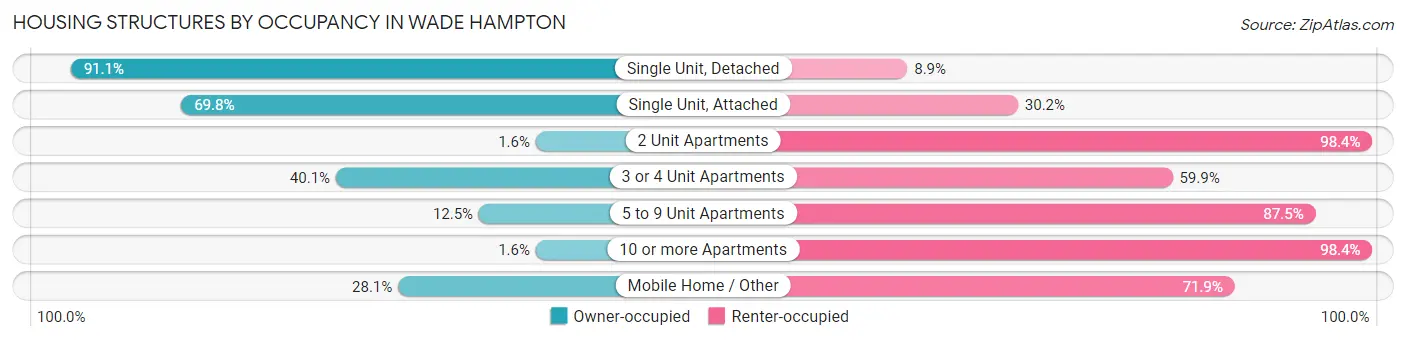
| Structure Type | Owner-occupied | Renter-occupied |
| Single Unit, Detached | 4,976 (91.1%) | 485 (8.9%) |
| Single Unit, Attached | 449 (69.8%) | 194 (30.2%) |
| 2 Unit Apartments | 7 (1.6%) | 436 (98.4%) |
| 3 or 4 Unit Apartments | 139 (40.1%) | 208 (59.9%) |
| 5 to 9 Unit Apartments | 81 (12.5%) | 566 (87.5%) |
| 10 or more Apartments | 17 (1.6%) | 1,063 (98.4%) |
| Mobile Home / Other | 98 (28.1%) | 251 (71.9%) |
| Total | 5,767 (64.3%) | 3,203 (35.7%) |
Housing Structures by Number of Rooms in Wade Hampton
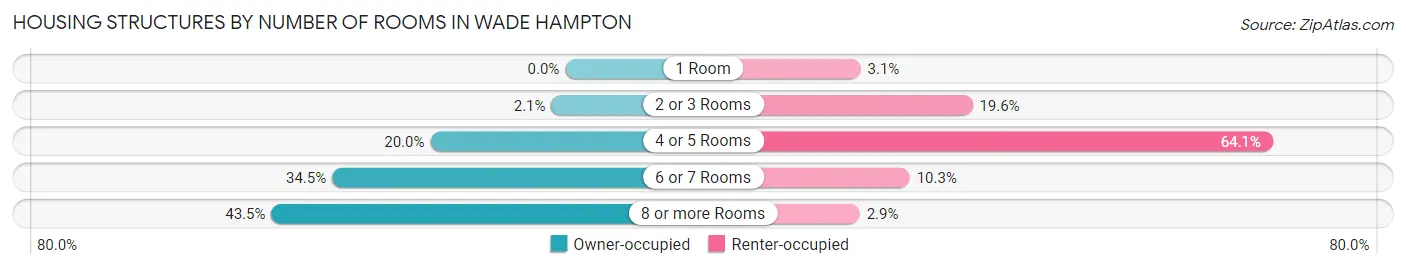
| Number of Rooms | Owner-occupied | Renter-occupied |
| 1 Room | 0 (0.0%) | 98 (3.1%) |
| 2 or 3 Rooms | 118 (2.1%) | 628 (19.6%) |
| 4 or 5 Rooms | 1,151 (20.0%) | 2,052 (64.1%) |
| 6 or 7 Rooms | 1,990 (34.5%) | 331 (10.3%) |
| 8 or more Rooms | 2,508 (43.5%) | 94 (2.9%) |
| Total | 5,767 (100.0%) | 3,203 (100.0%) |
Housing Structure by Heating Type in Wade Hampton
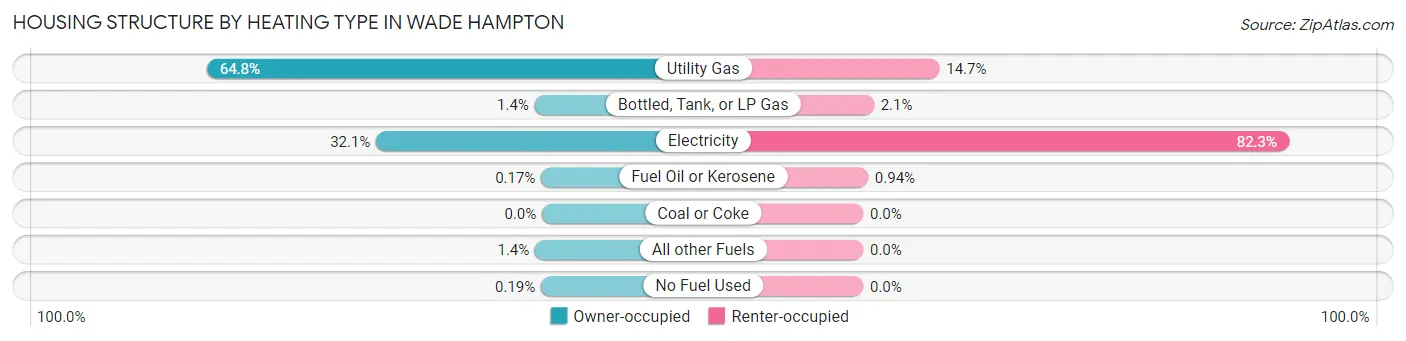
| Heating Type | Owner-occupied | Renter-occupied |
| Utility Gas | 3,736 (64.8%) | 472 (14.7%) |
| Bottled, Tank, or LP Gas | 83 (1.4%) | 66 (2.1%) |
| Electricity | 1,849 (32.1%) | 2,635 (82.3%) |
| Fuel Oil or Kerosene | 10 (0.2%) | 30 (0.9%) |
| Coal or Coke | 0 (0.0%) | 0 (0.0%) |
| All other Fuels | 78 (1.3%) | 0 (0.0%) |
| No Fuel Used | 11 (0.2%) | 0 (0.0%) |
| Total | 5,767 (100.0%) | 3,203 (100.0%) |
Household Vehicle Usage in Wade Hampton
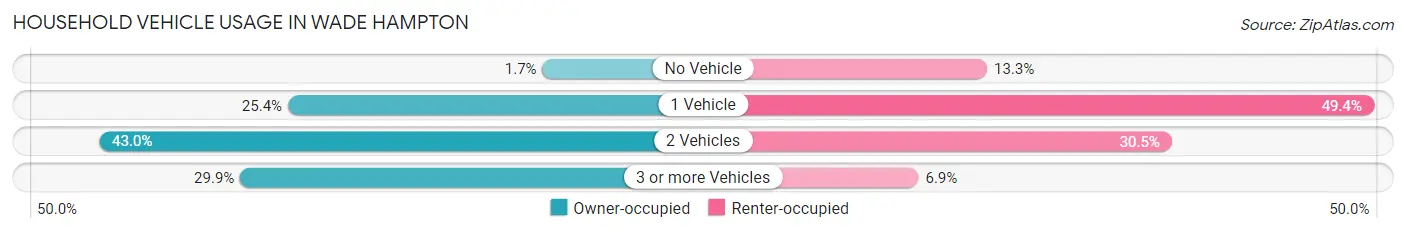
| Vehicles per Household | Owner-occupied | Renter-occupied |
| No Vehicle | 96 (1.7%) | 425 (13.3%) |
| 1 Vehicle | 1,466 (25.4%) | 1,581 (49.4%) |
| 2 Vehicles | 2,482 (43.0%) | 977 (30.5%) |
| 3 or more Vehicles | 1,723 (29.9%) | 220 (6.9%) |
| Total | 5,767 (100.0%) | 3,203 (100.0%) |
Real Estate & Mortgages in Wade Hampton
Real Estate and Mortgage Overview in Wade Hampton
| Characteristic | Without Mortgage | With Mortgage |
| Housing Units | 2,318 | 3,449 |
| Median Property Value | $238,500 | $291,800 |
| Median Household Income | $74,024 | $957 |
| Monthly Housing Costs | $430 | $170 |
| Real Estate Taxes | $1,316 | $8 |
Property Value by Mortgage Status in Wade Hampton
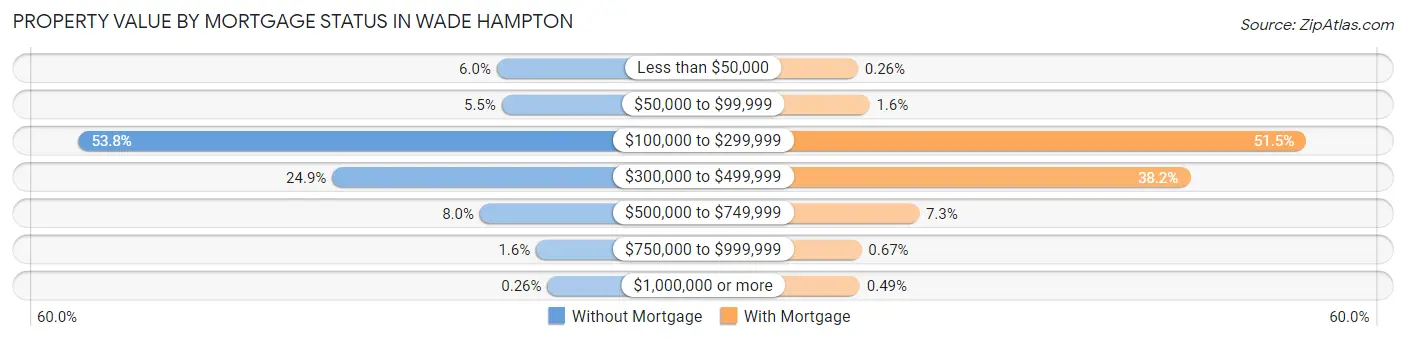
| Property Value | Without Mortgage | With Mortgage |
| Less than $50,000 | 140 (6.0%) | 9 (0.3%) |
| $50,000 to $99,999 | 127 (5.5%) | 55 (1.6%) |
| $100,000 to $299,999 | 1,248 (53.8%) | 1,776 (51.5%) |
| $300,000 to $499,999 | 576 (24.8%) | 1,319 (38.2%) |
| $500,000 to $749,999 | 185 (8.0%) | 250 (7.2%) |
| $750,000 to $999,999 | 36 (1.5%) | 23 (0.7%) |
| $1,000,000 or more | 6 (0.3%) | 17 (0.5%) |
| Total | 2,318 (100.0%) | 3,449 (100.0%) |
Household Income by Mortgage Status in Wade Hampton
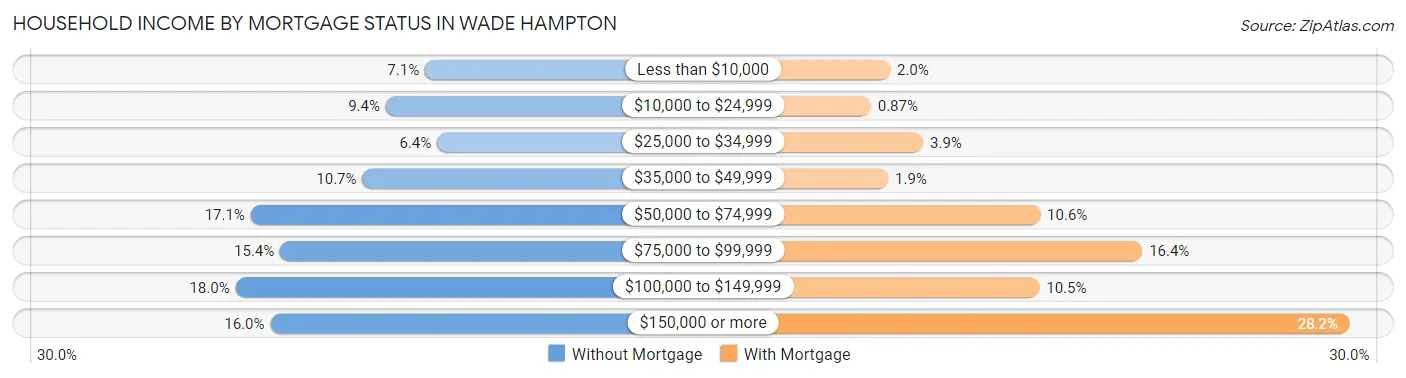
| Household Income | Without Mortgage | With Mortgage |
| Less than $10,000 | 165 (7.1%) | 68 (2.0%) |
| $10,000 to $24,999 | 217 (9.4%) | 30 (0.9%) |
| $25,000 to $34,999 | 149 (6.4%) | 133 (3.9%) |
| $35,000 to $49,999 | 248 (10.7%) | 64 (1.9%) |
| $50,000 to $74,999 | 396 (17.1%) | 364 (10.5%) |
| $75,000 to $99,999 | 357 (15.4%) | 565 (16.4%) |
| $100,000 to $149,999 | 416 (17.9%) | 362 (10.5%) |
| $150,000 or more | 370 (16.0%) | 974 (28.2%) |
| Total | 2,318 (100.0%) | 3,449 (100.0%) |
Property Value to Household Income Ratio in Wade Hampton
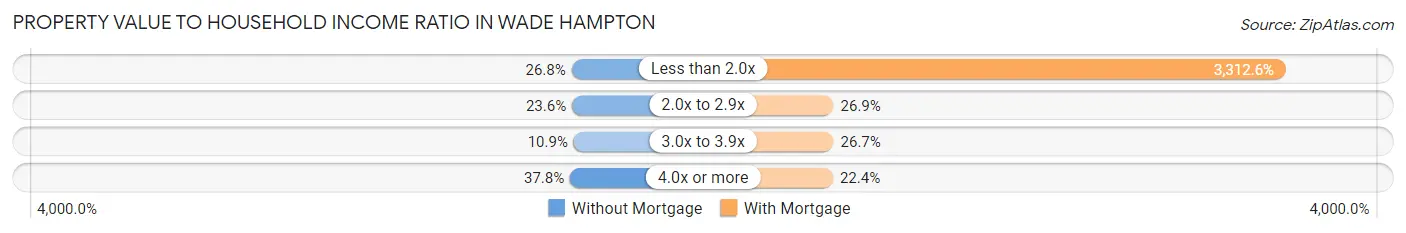
| Value-to-Income Ratio | Without Mortgage | With Mortgage |
| Less than 2.0x | 620 (26.8%) | 114,250 (3,312.6%) |
| 2.0x to 2.9x | 547 (23.6%) | 927 (26.9%) |
| 3.0x to 3.9x | 253 (10.9%) | 921 (26.7%) |
| 4.0x or more | 876 (37.8%) | 772 (22.4%) |
| Total | 2,318 (100.0%) | 3,449 (100.0%) |
Real Estate Taxes by Mortgage Status in Wade Hampton
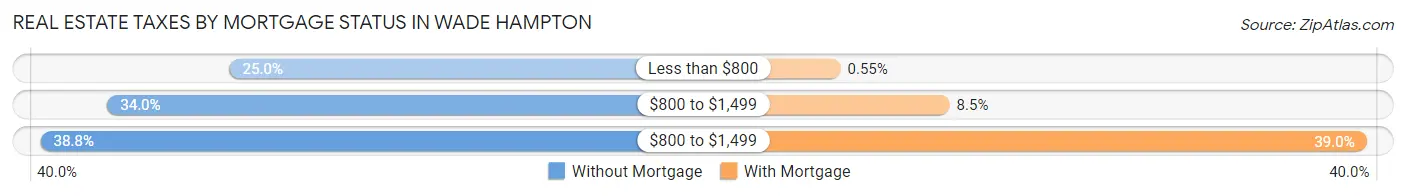
| Property Taxes | Without Mortgage | With Mortgage |
| Less than $800 | 580 (25.0%) | 19 (0.5%) |
| $800 to $1,499 | 787 (34.0%) | 294 (8.5%) |
| $800 to $1,499 | 900 (38.8%) | 1,344 (39.0%) |
| Total | 2,318 (100.0%) | 3,449 (100.0%) |
Health & Disability in Wade Hampton
Health Insurance Coverage by Age in Wade Hampton
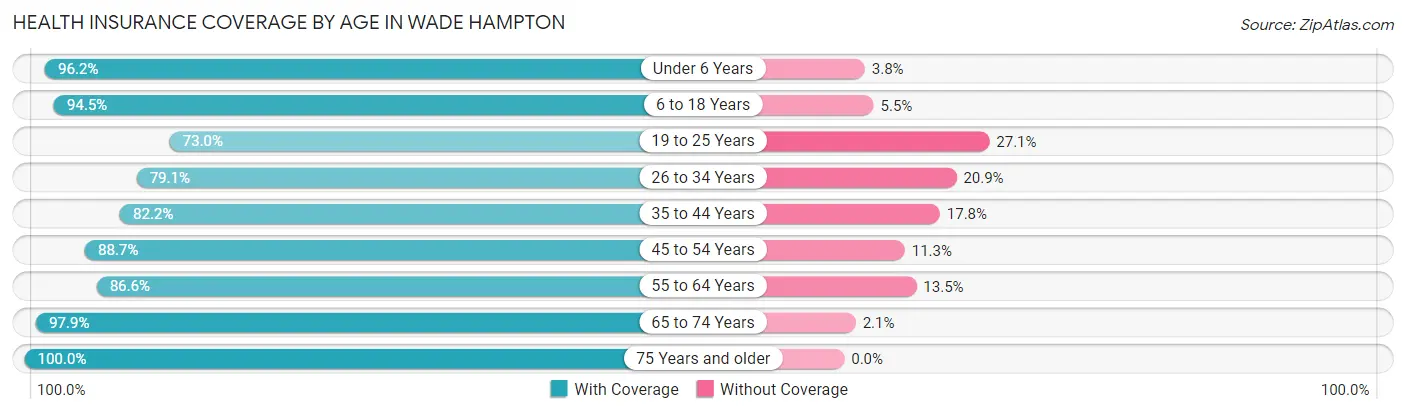
| Age Bracket | With Coverage | Without Coverage |
| Under 6 Years | 1,458 (96.2%) | 58 (3.8%) |
| 6 to 18 Years | 3,437 (94.5%) | 199 (5.5%) |
| 19 to 25 Years | 882 (73.0%) | 327 (27.1%) |
| 26 to 34 Years | 1,800 (79.1%) | 476 (20.9%) |
| 35 to 44 Years | 2,648 (82.2%) | 574 (17.8%) |
| 45 to 54 Years | 2,093 (88.7%) | 266 (11.3%) |
| 55 to 64 Years | 2,168 (86.6%) | 337 (13.5%) |
| 65 to 74 Years | 2,345 (97.9%) | 51 (2.1%) |
| 75 Years and older | 1,882 (100.0%) | 0 (0.0%) |
| Total | 18,713 (89.1%) | 2,288 (10.9%) |
Health Insurance Coverage by Citizenship Status in Wade Hampton
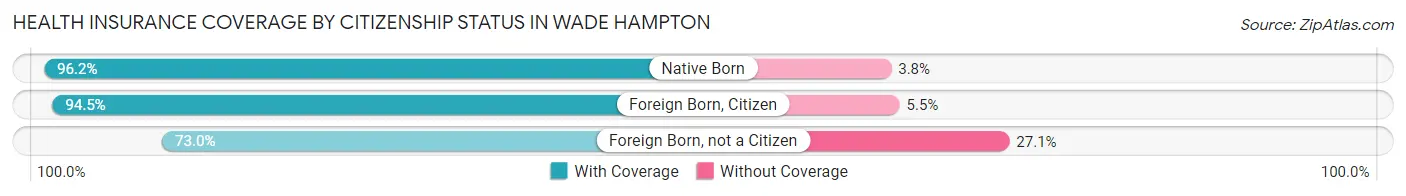
| Citizenship Status | With Coverage | Without Coverage |
| Native Born | 1,458 (96.2%) | 58 (3.8%) |
| Foreign Born, Citizen | 3,437 (94.5%) | 199 (5.5%) |
| Foreign Born, not a Citizen | 882 (73.0%) | 327 (27.1%) |
Health Insurance Coverage by Household Income in Wade Hampton
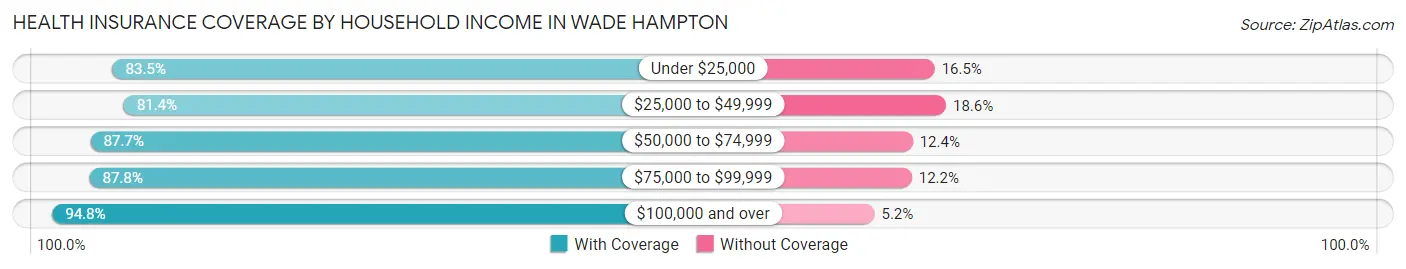
| Household Income | With Coverage | Without Coverage |
| Under $25,000 | 1,232 (83.5%) | 243 (16.5%) |
| $25,000 to $49,999 | 3,108 (81.4%) | 710 (18.6%) |
| $50,000 to $74,999 | 3,408 (87.6%) | 480 (12.3%) |
| $75,000 to $99,999 | 2,683 (87.8%) | 372 (12.2%) |
| $100,000 and over | 8,270 (94.8%) | 454 (5.2%) |
Public vs Private Health Insurance Coverage by Age in Wade Hampton
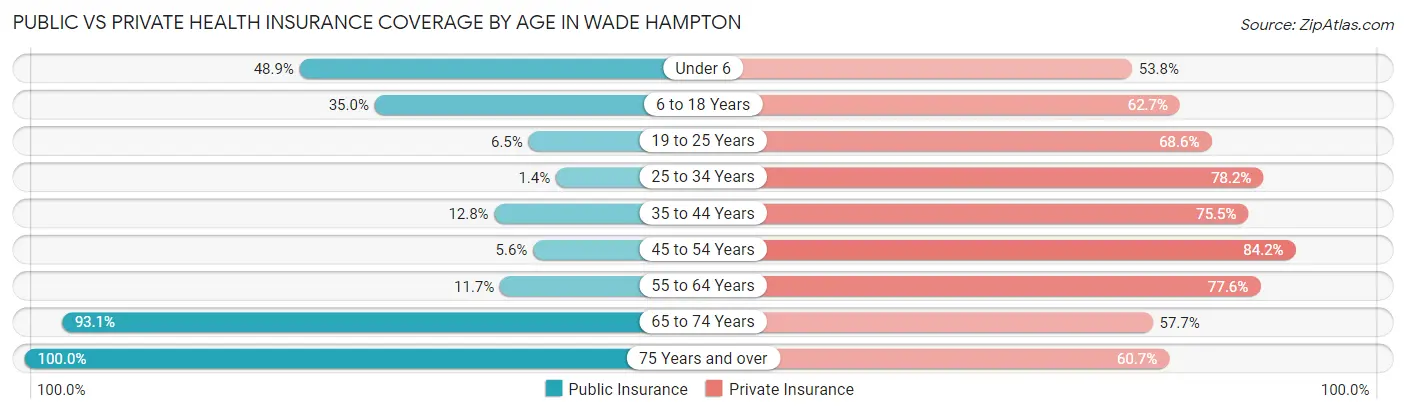
| Age Bracket | Public Insurance | Private Insurance |
| Under 6 | 742 (48.9%) | 816 (53.8%) |
| 6 to 18 Years | 1,273 (35.0%) | 2,281 (62.7%) |
| 19 to 25 Years | 78 (6.5%) | 829 (68.6%) |
| 25 to 34 Years | 31 (1.4%) | 1,780 (78.2%) |
| 35 to 44 Years | 412 (12.8%) | 2,431 (75.4%) |
| 45 to 54 Years | 132 (5.6%) | 1,986 (84.2%) |
| 55 to 64 Years | 294 (11.7%) | 1,945 (77.6%) |
| 65 to 74 Years | 2,231 (93.1%) | 1,382 (57.7%) |
| 75 Years and over | 1,882 (100.0%) | 1,143 (60.7%) |
| Total | 7,075 (33.7%) | 14,593 (69.5%) |
Disability Status by Sex by Age in Wade Hampton
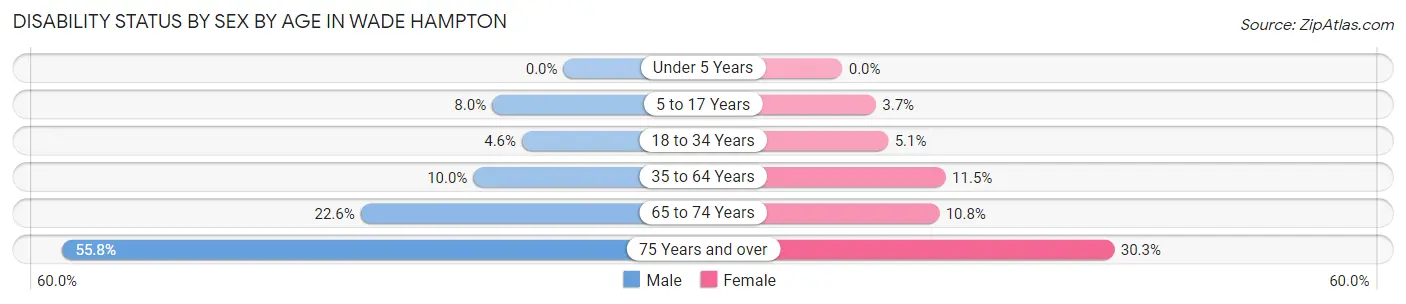
| Age Bracket | Male | Female |
| Under 5 Years | 0 (0.0%) | 0 (0.0%) |
| 5 to 17 Years | 119 (8.0%) | 75 (3.7%) |
| 18 to 34 Years | 89 (4.6%) | 96 (5.1%) |
| 35 to 64 Years | 368 (10.0%) | 509 (11.5%) |
| 65 to 74 Years | 267 (22.6%) | 131 (10.8%) |
| 75 Years and over | 512 (55.8%) | 292 (30.3%) |
Disability Class by Sex by Age in Wade Hampton
Disability Class: Hearing Difficulty
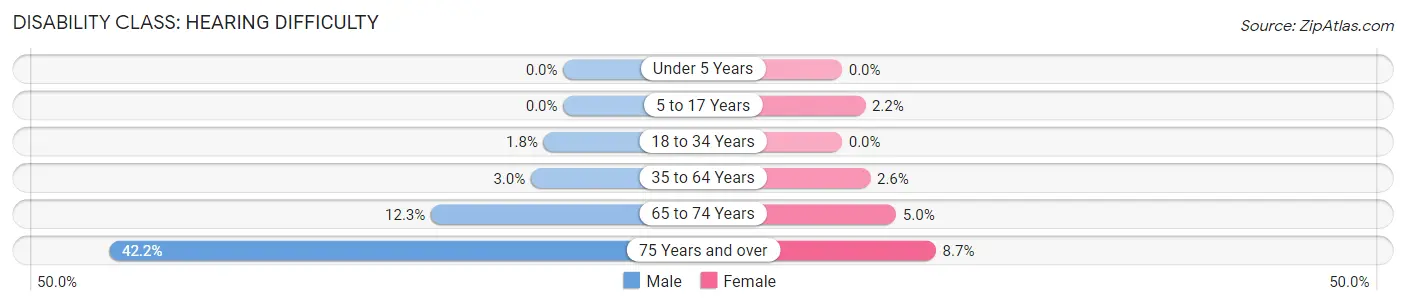
| Age Bracket | Male | Female |
| Under 5 Years | 0 (0.0%) | 0 (0.0%) |
| 5 to 17 Years | 0 (0.0%) | 43 (2.1%) |
| 18 to 34 Years | 35 (1.8%) | 0 (0.0%) |
| 35 to 64 Years | 110 (3.0%) | 116 (2.6%) |
| 65 to 74 Years | 145 (12.3%) | 61 (5.0%) |
| 75 Years and over | 387 (42.2%) | 84 (8.7%) |
Disability Class: Vision Difficulty
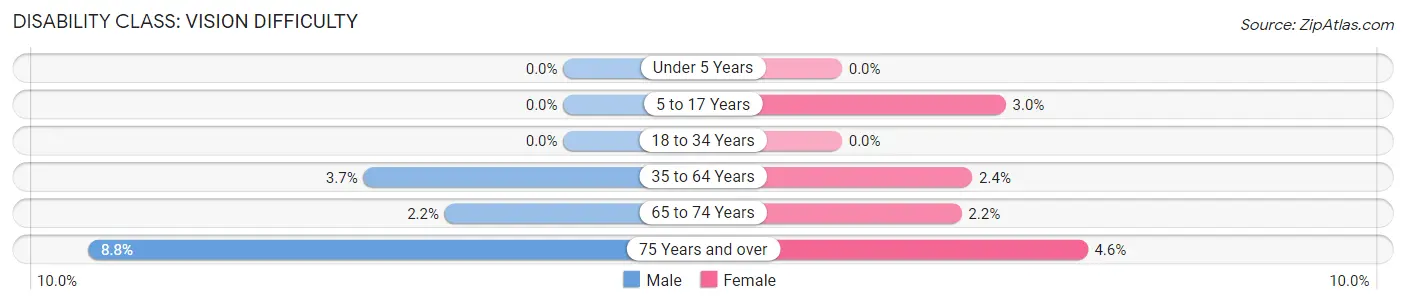
| Age Bracket | Male | Female |
| Under 5 Years | 0 (0.0%) | 0 (0.0%) |
| 5 to 17 Years | 0 (0.0%) | 61 (3.0%) |
| 18 to 34 Years | 0 (0.0%) | 0 (0.0%) |
| 35 to 64 Years | 136 (3.7%) | 107 (2.4%) |
| 65 to 74 Years | 26 (2.2%) | 27 (2.2%) |
| 75 Years and over | 81 (8.8%) | 44 (4.6%) |
Disability Class: Cognitive Difficulty
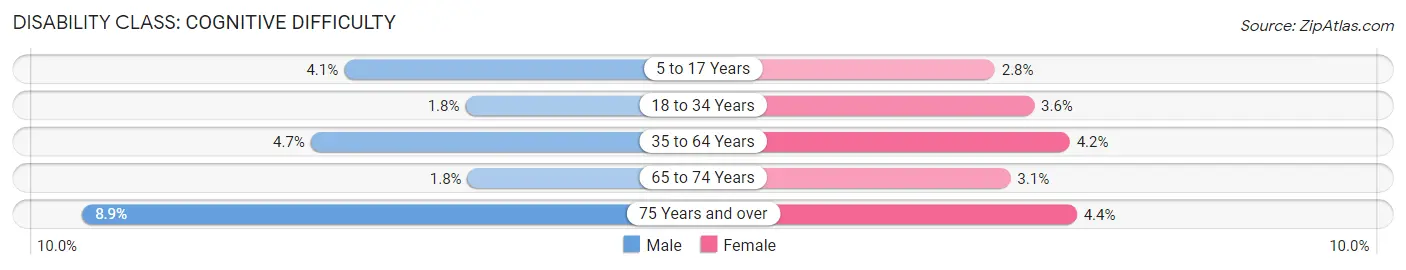
| Age Bracket | Male | Female |
| 5 to 17 Years | 61 (4.1%) | 57 (2.8%) |
| 18 to 34 Years | 35 (1.8%) | 67 (3.6%) |
| 35 to 64 Years | 172 (4.7%) | 187 (4.2%) |
| 65 to 74 Years | 21 (1.8%) | 38 (3.1%) |
| 75 Years and over | 82 (8.9%) | 42 (4.4%) |
Disability Class: Ambulatory Difficulty
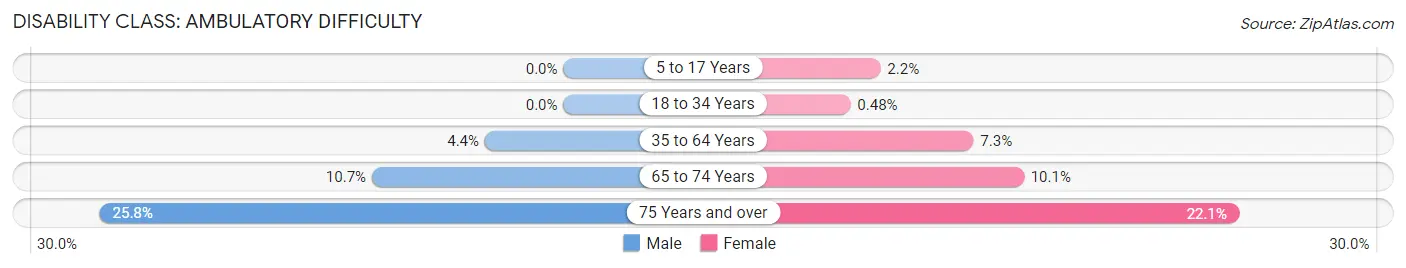
| Age Bracket | Male | Female |
| 5 to 17 Years | 0 (0.0%) | 43 (2.1%) |
| 18 to 34 Years | 0 (0.0%) | 9 (0.5%) |
| 35 to 64 Years | 160 (4.4%) | 324 (7.3%) |
| 65 to 74 Years | 126 (10.7%) | 123 (10.1%) |
| 75 Years and over | 237 (25.8%) | 213 (22.1%) |
Disability Class: Self-Care Difficulty
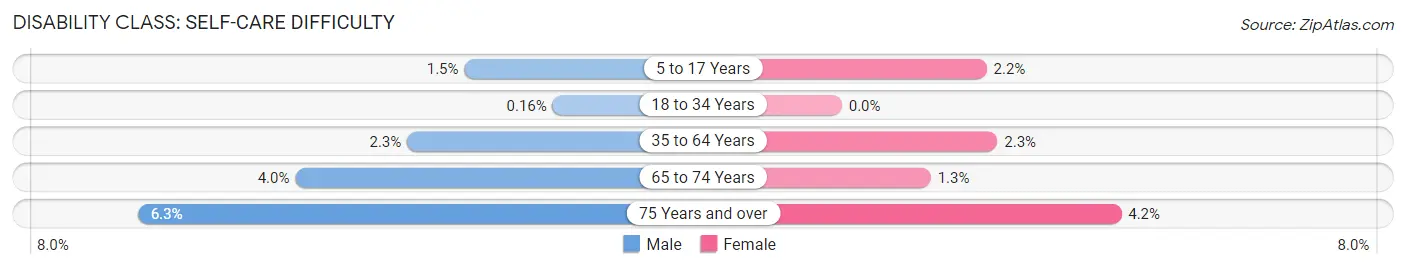
| Age Bracket | Male | Female |
| 5 to 17 Years | 22 (1.5%) | 43 (2.1%) |
| 18 to 34 Years | 3 (0.2%) | 0 (0.0%) |
| 35 to 64 Years | 85 (2.3%) | 102 (2.3%) |
| 65 to 74 Years | 47 (4.0%) | 16 (1.3%) |
| 75 Years and over | 58 (6.3%) | 40 (4.2%) |
Technology Access in Wade Hampton
Computing Device Access in Wade Hampton
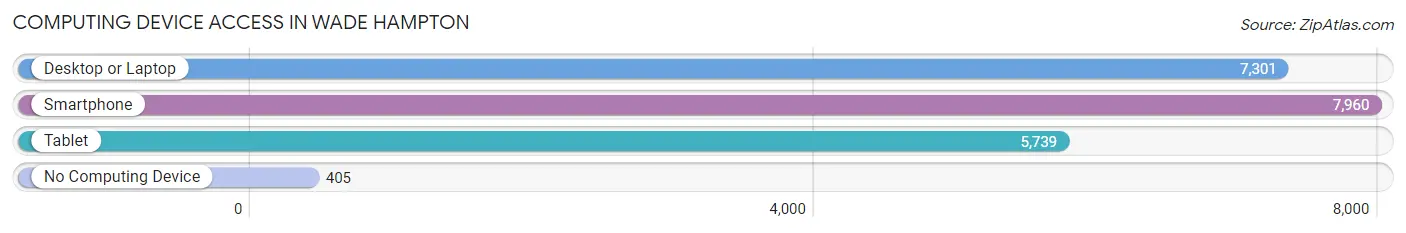
| Device Type | # Households | % Households |
| Desktop or Laptop | 7,301 | 81.4% |
| Smartphone | 7,960 | 88.7% |
| Tablet | 5,739 | 64.0% |
| No Computing Device | 405 | 4.5% |
| Total | 8,970 | 100.0% |
Internet Access in Wade Hampton
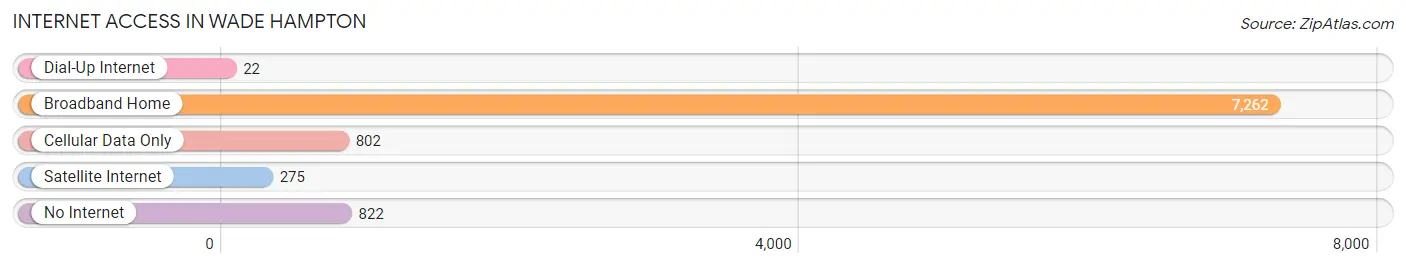
| Internet Type | # Households | % Households |
| Dial-Up Internet | 22 | 0.3% |
| Broadband Home | 7,262 | 81.0% |
| Cellular Data Only | 802 | 8.9% |
| Satellite Internet | 275 | 3.1% |
| No Internet | 822 | 9.2% |
| Total | 8,970 | 100.0% |
Wade Hampton Summary
Wade Hampton is a small town located in the Upstate region of South Carolina. It is situated in Greenville County, approximately 20 miles east of the city of Greenville. The town was named after Confederate General Wade Hampton III, who was a prominent figure in the Reconstruction era. The town was founded in 1879 and has a population of approximately 1,500 people.
Geography
Wade Hampton is located in the foothills of the Blue Ridge Mountains. The town is situated in a valley, surrounded by rolling hills and forests. The town is located at an elevation of 1,000 feet above sea level. The town is located near the Reedy River, which is a tributary of the Saluda River. The town is also located near the Sumter National Forest, which is a popular destination for outdoor recreation.
The climate in Wade Hampton is mild and humid. Summers are hot and humid, with temperatures reaching into the 90s. Winters are mild, with temperatures rarely dropping below freezing. The town receives an average of 48 inches of precipitation per year.
Economy
The economy of Wade Hampton is largely based on agriculture. The town is home to several farms, which produce a variety of crops, including corn, soybeans, and cotton. The town is also home to several small businesses, including restaurants, retail stores, and service providers.
Demographics
As of the 2010 census, the population of Wade Hampton was 1,500. The racial makeup of the town was 94.7% White, 2.7% African American, 0.7% Native American, 0.3% Asian, and 1.6% from other races. The median household income was $37,500, and the median family income was $45,000.
The town is served by the Greenville County School District. The town has one elementary school, one middle school, and one high school. The town is also home to several churches, including the First Baptist Church of Wade Hampton.
Conclusion
Wade Hampton is a small town located in the Upstate region of South Carolina. The town was founded in 1879 and has a population of approximately 1,500 people. The town is situated in a valley, surrounded by rolling hills and forests. The economy of Wade Hampton is largely based on agriculture, and the town is home to several small businesses. The racial makeup of the town is 94.7% White, 2.7% African American, 0.7% Native American, 0.3% Asian, and 1.6% from other races. The town is served by the Greenville County School District and is home to several churches.
Common Questions
What is the Total Population of Wade Hampton?
Total Population of Wade Hampton is 21,029.
What is the Total Male Population of Wade Hampton?
Total Male Population of Wade Hampton is 10,078.
What is the Total Female Population of Wade Hampton?
Total Female Population of Wade Hampton is 10,951.
What is the Ratio of Males per 100 Females in Wade Hampton?
There are 92.03 Males per 100 Females in Wade Hampton.
What is the Ratio of Females per 100 Males in Wade Hampton?
There are 108.66 Females per 100 Males in Wade Hampton.
What is the Median Population Age in Wade Hampton?
Median Population Age in Wade Hampton is 41.4 Years.
What is the Average Family Size in Wade Hampton
Average Family Size in Wade Hampton is 3.0 People.
What is the Average Household Size in Wade Hampton
Average Household Size in Wade Hampton is 2.3 People.
What is Per Capita Income in Wade Hampton?
Per Capita income in Wade Hampton is $39,311.
What is the Median Family Income in Wade Hampton?
Median Family Income in Wade Hampton is $92,218.
What is the Median Household income in Wade Hampton?
Median Household Income in Wade Hampton is $71,564.
What is Income or Wage Gap in Wade Hampton?
Income or Wage Gap in Wade Hampton is 26.6%.
Women in Wade Hampton earn 73.4 cents for every dollar earned by a man.
What is Family Income Deficit in Wade Hampton?
Family Income Deficit in Wade Hampton is $7,421.
Families that are below poverty line in Wade Hampton earn $7,421 less on average than the poverty threshold level.
What is Inequality or Gini Index in Wade Hampton?
Inequality or Gini Index in Wade Hampton is 0.42.
How Large is the Labor Force in Wade Hampton?
There are 10,825 People in the Labor Forcein in Wade Hampton.
What is the Percentage of People in the Labor Force in Wade Hampton?
64.3% of People are in the Labor Force in Wade Hampton.
What is the Unemployment Rate in Wade Hampton?
Unemployment Rate in Wade Hampton is 3.1%.