Forestbrook, SC
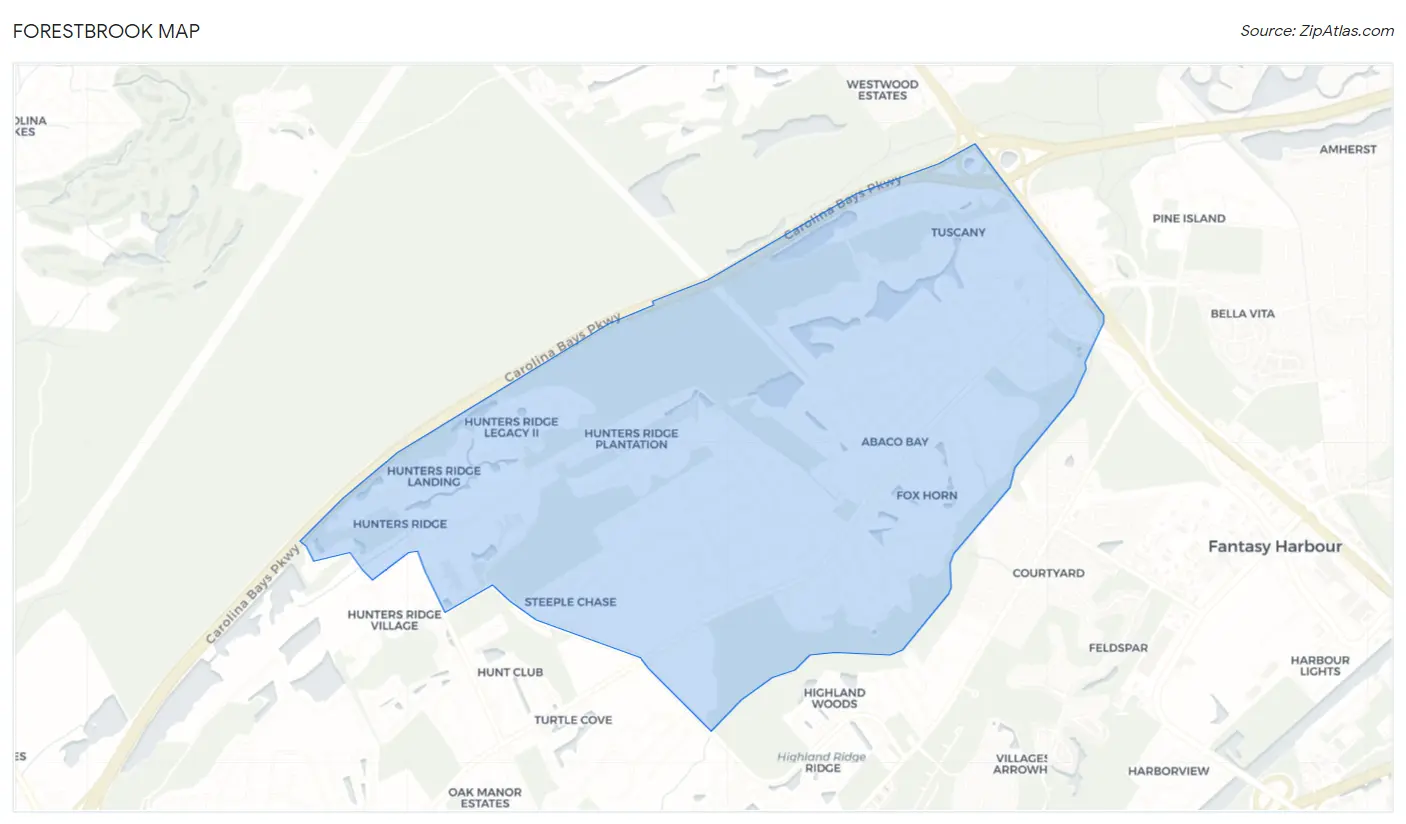
Forestbrook Map
Forestbrook Overview
7,414
TOTAL POPULATION
3,621
MALE POPULATION
3,793
FEMALE POPULATION
95.47
MALES / 100 FEMALES
104.75
FEMALES / 100 MALES
47.9
MEDIAN AGE
2.8
AVG FAMILY SIZE
2.7
AVG HOUSEHOLD SIZE
$38,397
PER CAPITA INCOME
$71,835
AVG FAMILY INCOME
$66,172
AVG HOUSEHOLD INCOME
12.0%
WAGE / INCOME GAP [ % ]
88.0¢/ $1
WAGE / INCOME GAP [ $ ]
0.40
INEQUALITY / GINI INDEX
3,748
LABOR FORCE [ PEOPLE ]
56.4%
PERCENT IN LABOR FORCE
5.9%
UNEMPLOYMENT RATE
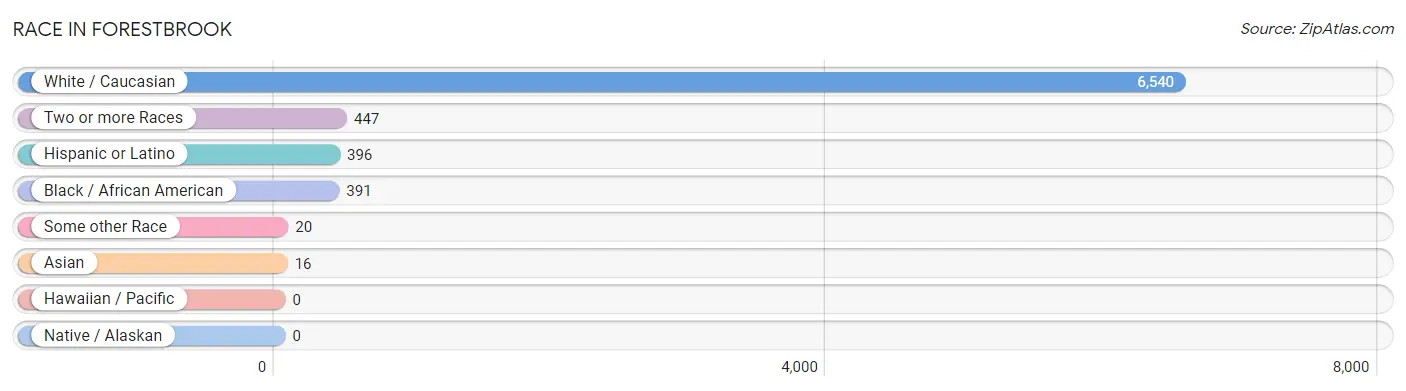
Race in Forestbrook
The most populous races in Forestbrook are White / Caucasian (6,540 | 88.2%), Two or more Races (447 | 6.0%), and Hispanic or Latino (396 | 5.3%).
| Race | # Population | % Population |
| Asian | 16 | 0.2% |
| Black / African American | 391 | 5.3% |
| Hawaiian / Pacific | 0 | 0.0% |
| Hispanic or Latino | 396 | 5.3% |
| Native / Alaskan | 0 | 0.0% |
| White / Caucasian | 6,540 | 88.2% |
| Two or more Races | 447 | 6.0% |
| Some other Race | 20 | 0.3% |
| Total | 7,414 | 100.0% |
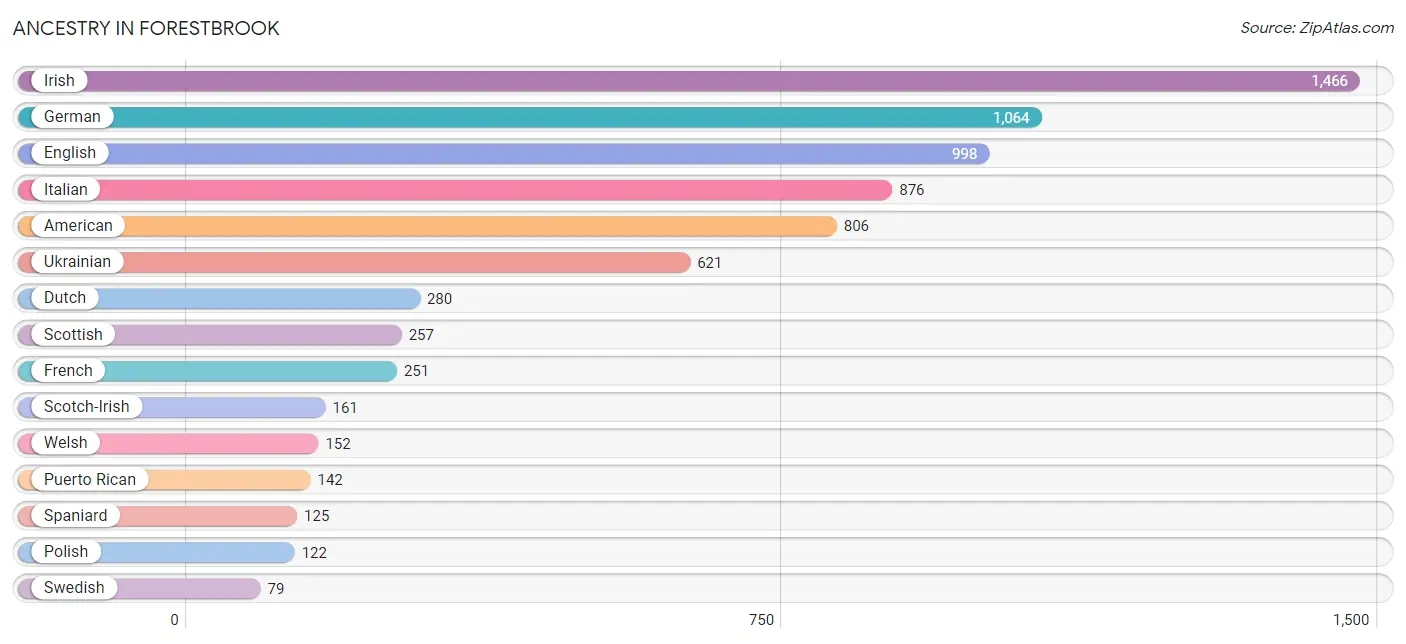
Ancestry in Forestbrook
The most populous ancestries reported in Forestbrook are Irish (1,466 | 19.8%), German (1,064 | 14.3%), English (998 | 13.5%), Italian (876 | 11.8%), and American (806 | 10.9%), together accounting for 70.3% of all Forestbrook residents.
| Ancestry | # Population | % Population |
| American | 806 | 10.9% |
| Arab | 62 | 0.8% |
| Bhutanese | 16 | 0.2% |
| Central American | 24 | 0.3% |
| Cherokee | 1 | 0.0% |
| Cuban | 67 | 0.9% |
| Czech | 72 | 1.0% |
| Czechoslovakian | 14 | 0.2% |
| Dutch | 280 | 3.8% |
| Eastern European | 25 | 0.3% |
| English | 998 | 13.5% |
| Finnish | 59 | 0.8% |
| French | 251 | 3.4% |
| French Canadian | 30 | 0.4% |
| German | 1,064 | 14.3% |
| Honduran | 24 | 0.3% |
| Hungarian | 17 | 0.2% |
| Irish | 1,466 | 19.8% |
| Italian | 876 | 11.8% |
| Korean | 18 | 0.2% |
| Lithuanian | 48 | 0.6% |
| Mexican | 16 | 0.2% |
| Norwegian | 20 | 0.3% |
| Pennsylvania German | 32 | 0.4% |
| Polish | 122 | 1.7% |
| Puerto Rican | 142 | 1.9% |
| Russian | 17 | 0.2% |
| Scotch-Irish | 161 | 2.2% |
| Scottish | 257 | 3.5% |
| Slovak | 18 | 0.2% |
| Spaniard | 125 | 1.7% |
| Spanish | 22 | 0.3% |
| Swedish | 79 | 1.1% |
| Swiss | 51 | 0.7% |
| Thai | 12 | 0.2% |
| Turkish | 12 | 0.2% |
| Ukrainian | 621 | 8.4% |
| Welsh | 152 | 2.1% |
| West Indian | 20 | 0.3% | View All 39 Rows |
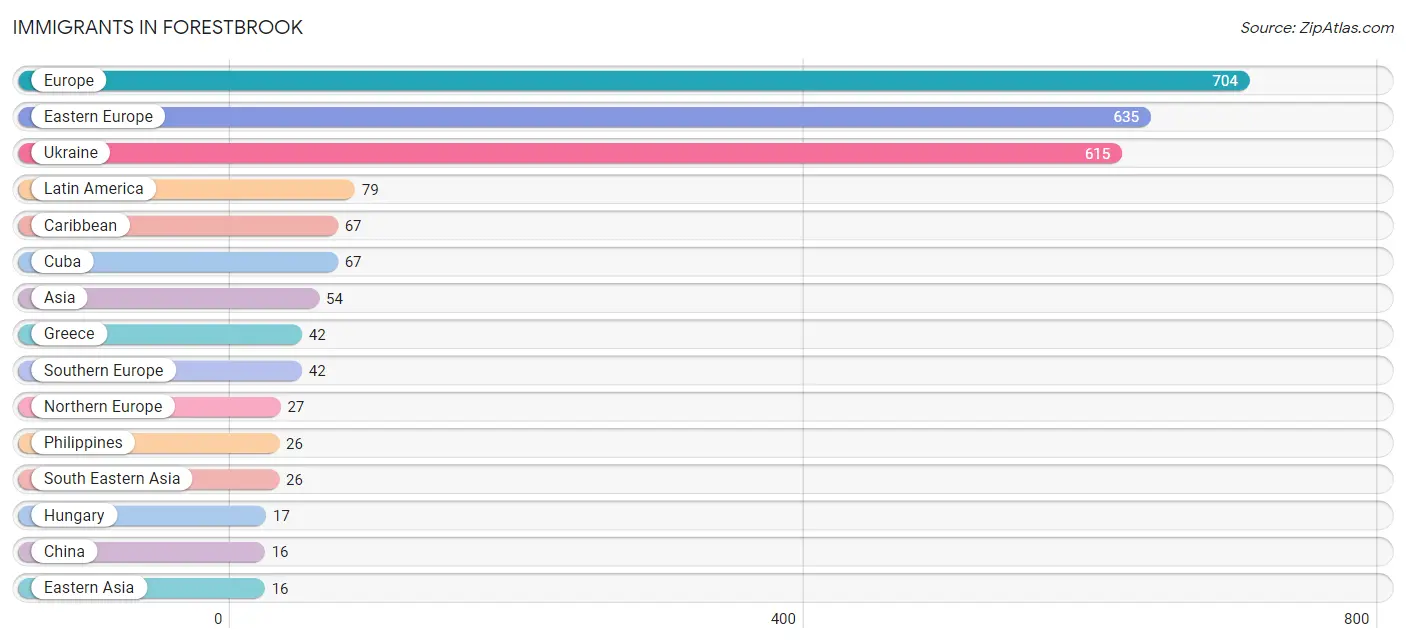
Immigrants in Forestbrook
The most numerous immigrant groups reported in Forestbrook came from Europe (704 | 9.5%), Eastern Europe (635 | 8.6%), Ukraine (615 | 8.3%), Latin America (79 | 1.1%), and Caribbean (67 | 0.9%), together accounting for 28.3% of all Forestbrook residents.
| Immigration Origin | # Population | % Population |
| Asia | 54 | 0.7% |
| Caribbean | 67 | 0.9% |
| China | 16 | 0.2% |
| Cuba | 67 | 0.9% |
| Eastern Asia | 16 | 0.2% |
| Eastern Europe | 635 | 8.6% |
| Europe | 704 | 9.5% |
| Greece | 42 | 0.6% |
| Guyana | 12 | 0.2% |
| Hungary | 17 | 0.2% |
| Latin America | 79 | 1.1% |
| Northern Europe | 27 | 0.4% |
| Philippines | 26 | 0.4% |
| Russia | 3 | 0.0% |
| Scotland | 11 | 0.2% |
| South America | 12 | 0.2% |
| South Eastern Asia | 26 | 0.4% |
| Southern Europe | 42 | 0.6% |
| Ukraine | 615 | 8.3% |
| Western Asia | 12 | 0.2% | View All 20 Rows |
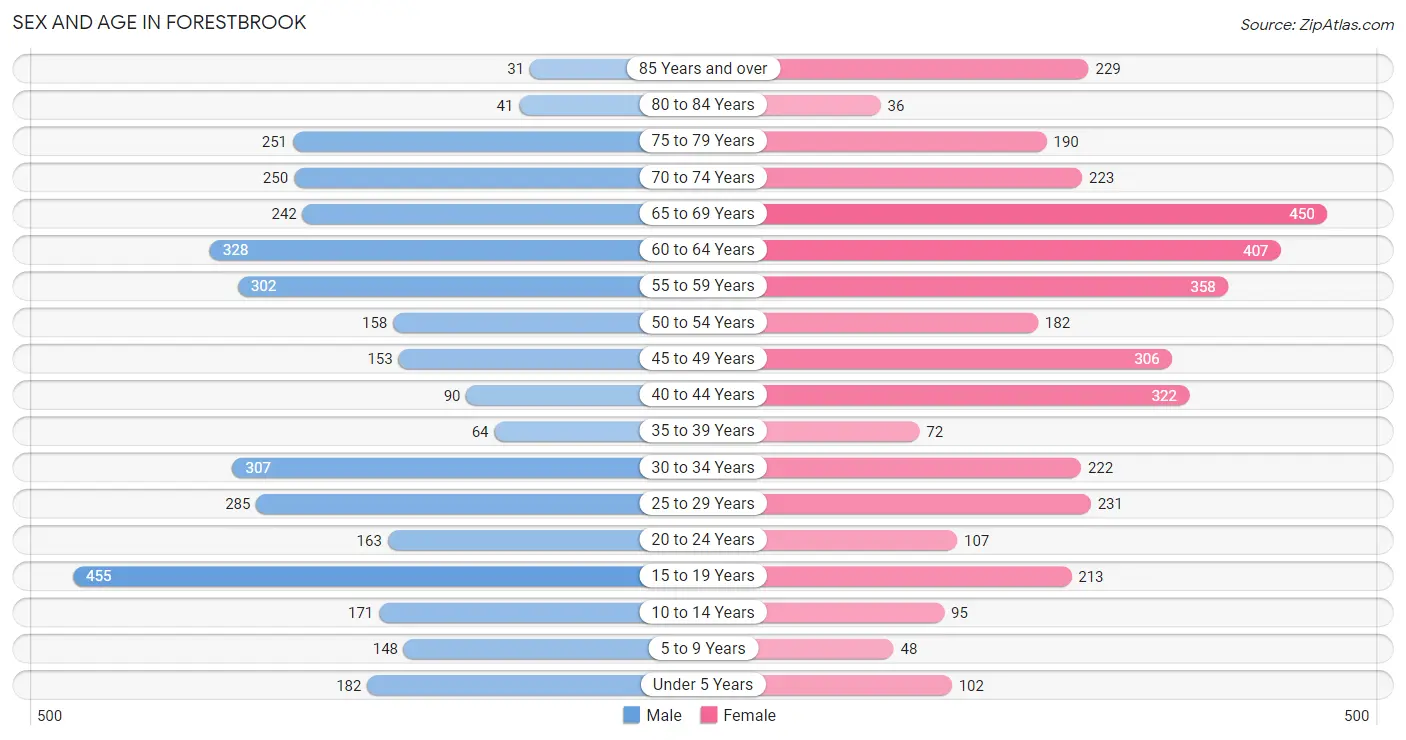
Sex and Age in Forestbrook
Sex and Age in Forestbrook
The most populous age groups in Forestbrook are 15 to 19 Years (455 | 12.6%) for men and 65 to 69 Years (450 | 11.9%) for women.
| Age Bracket | Male | Female |
| Under 5 Years | 182 (5.0%) | 102 (2.7%) |
| 5 to 9 Years | 148 (4.1%) | 48 (1.3%) |
| 10 to 14 Years | 171 (4.7%) | 95 (2.5%) |
| 15 to 19 Years | 455 (12.6%) | 213 (5.6%) |
| 20 to 24 Years | 163 (4.5%) | 107 (2.8%) |
| 25 to 29 Years | 285 (7.9%) | 231 (6.1%) |
| 30 to 34 Years | 307 (8.5%) | 222 (5.9%) |
| 35 to 39 Years | 64 (1.8%) | 72 (1.9%) |
| 40 to 44 Years | 90 (2.5%) | 322 (8.5%) |
| 45 to 49 Years | 153 (4.2%) | 306 (8.1%) |
| 50 to 54 Years | 158 (4.4%) | 182 (4.8%) |
| 55 to 59 Years | 302 (8.3%) | 358 (9.4%) |
| 60 to 64 Years | 328 (9.1%) | 407 (10.7%) |
| 65 to 69 Years | 242 (6.7%) | 450 (11.9%) |
| 70 to 74 Years | 250 (6.9%) | 223 (5.9%) |
| 75 to 79 Years | 251 (6.9%) | 190 (5.0%) |
| 80 to 84 Years | 41 (1.1%) | 36 (0.9%) |
| 85 Years and over | 31 (0.9%) | 229 (6.0%) |
| Total | 3,621 (100.0%) | 3,793 (100.0%) |
Families and Households in Forestbrook
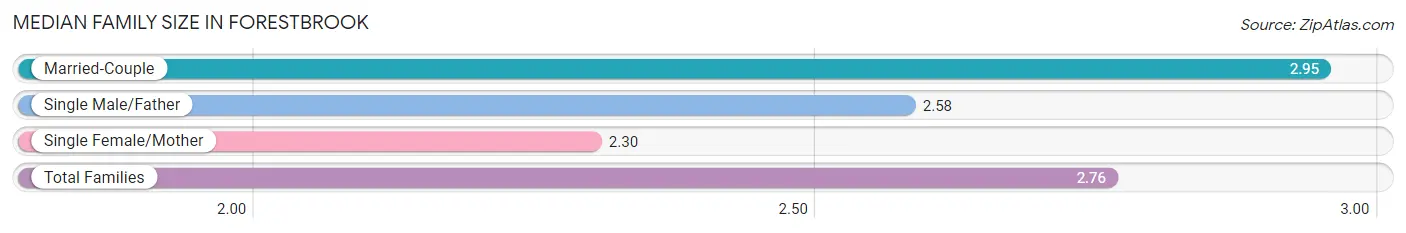
Median Family Size in Forestbrook
The median family size in Forestbrook is 2.76 persons per family, with married-couple families (1,537 | 70.5%) accounting for the largest median family size of 2.95 persons per family. On the other hand, single female/mother families (601 | 27.6%) represent the smallest median family size with 2.30 persons per family.
| Family Type | # Families | Family Size |
| Married-Couple | 1,537 (70.5%) | 2.95 |
| Single Male/Father | 43 (2.0%) | 2.58 |
| Single Female/Mother | 601 (27.6%) | 2.30 |
| Total Families | 2,181 (100.0%) | 2.76 |
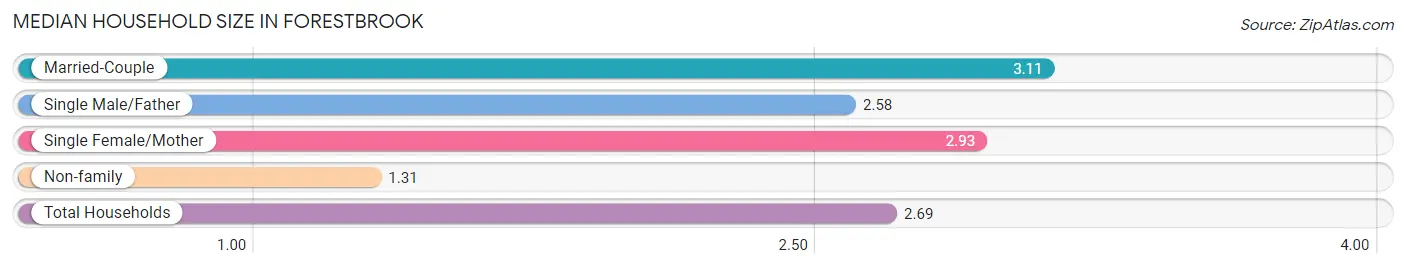
Median Household Size in Forestbrook
The median household size in Forestbrook is 2.69 persons per household, with married-couple households (1,537 | 55.8%) accounting for the largest median household size of 3.11 persons per household. non-family households (573 | 20.8%) represent the smallest median household size with 1.31 persons per household.
| Household Type | # Households | Household Size |
| Married-Couple | 1,537 (55.8%) | 3.11 |
| Single Male/Father | 43 (1.6%) | 2.58 |
| Single Female/Mother | 601 (21.8%) | 2.93 |
| Non-family | 573 (20.8%) | 1.31 |
| Total Households | 2,754 (100.0%) | 2.69 |
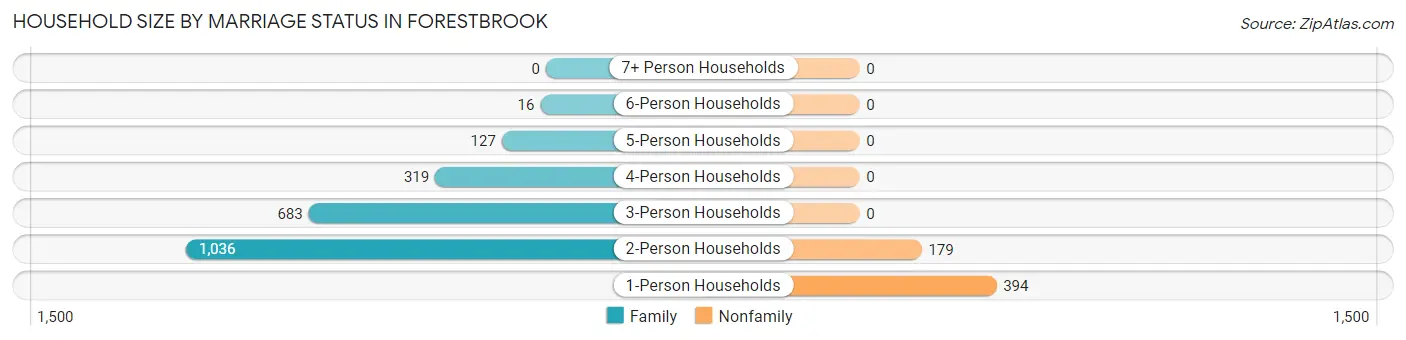
Household Size by Marriage Status in Forestbrook
Out of a total of 2,754 households in Forestbrook, 2,181 (79.2%) are family households, while 573 (20.8%) are nonfamily households. The most numerous type of family households are 2-person households, comprising 1,036, and the most common type of nonfamily households are 1-person households, comprising 394.
| Household Size | Family Households | Nonfamily Households |
| 1-Person Households | - | 394 (14.3%) |
| 2-Person Households | 1,036 (37.6%) | 179 (6.5%) |
| 3-Person Households | 683 (24.8%) | 0 (0.0%) |
| 4-Person Households | 319 (11.6%) | 0 (0.0%) |
| 5-Person Households | 127 (4.6%) | 0 (0.0%) |
| 6-Person Households | 16 (0.6%) | 0 (0.0%) |
| 7+ Person Households | 0 (0.0%) | 0 (0.0%) |
| Total | 2,181 (79.2%) | 573 (20.8%) |
Female Fertility in Forestbrook
Fertility by Age in Forestbrook
Average fertility rate in Forestbrook is 44.0 births per 1,000 women. Women in the age bracket of 15 to 19 years have the highest fertility rate with 99.0 births per 1,000 women. Women in the age bracket of 35 to 50 years acount for 34.8% of all women with births.
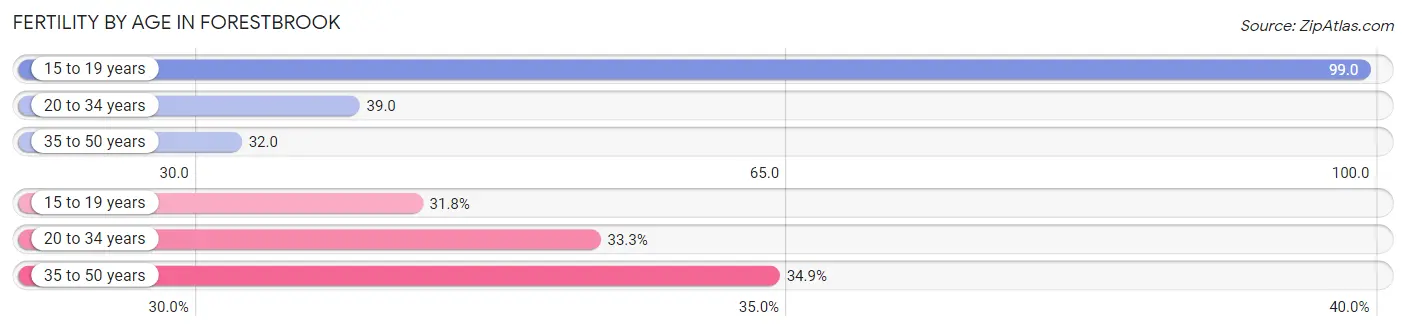
| Age Bracket | Women with Births | Births / 1,000 Women |
| 15 to 19 years | 21 (31.8%) | 99.0 |
| 20 to 34 years | 22 (33.3%) | 39.0 |
| 35 to 50 years | 23 (34.8%) | 32.0 |
| Total | 66 (100.0%) | 44.0 |
Fertility by Age by Marriage Status in Forestbrook
34.8% of women with births (66) in Forestbrook are married. The highest percentage of unmarried women with births falls into 15 to 19 years age bracket with 100.0% of them unmarried at the time of birth, while the lowest percentage of unmarried women with births belong to 35 to 50 years age bracket with 0.0% of them unmarried.
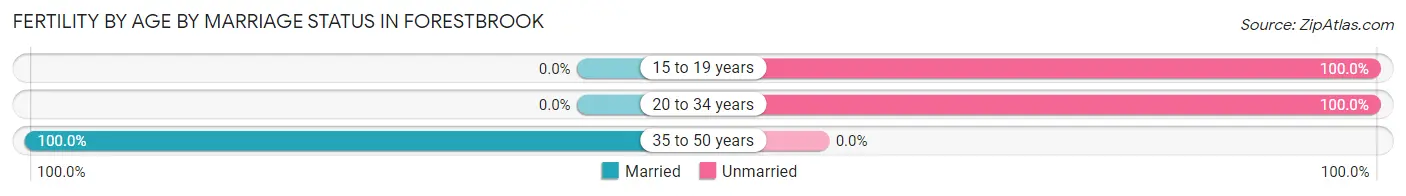
| Age Bracket | Married | Unmarried |
| 15 to 19 years | 0 (0.0%) | 21 (100.0%) |
| 20 to 34 years | 0 (0.0%) | 22 (100.0%) |
| 35 to 50 years | 23 (100.0%) | 0 (0.0%) |
| Total | 23 (34.8%) | 43 (65.1%) |
Fertility by Education in Forestbrook
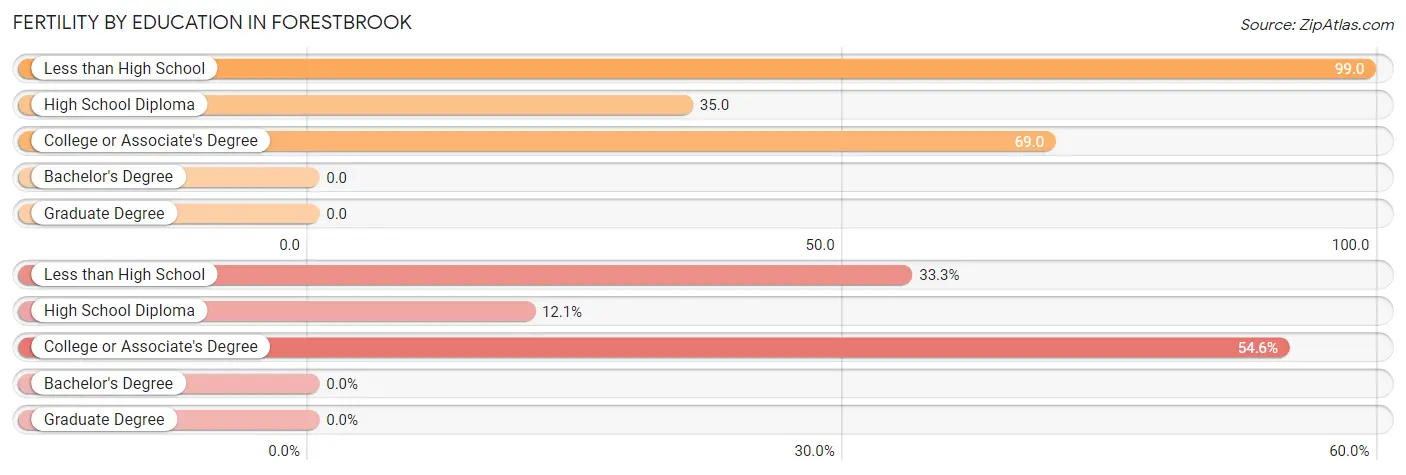
| Educational Attainment | Women with Births | Births / 1,000 Women |
| Less than High School | 22 (33.3%) | 99.0 |
| High School Diploma | 8 (12.1%) | 35.0 |
| College or Associate's Degree | 36 (54.5%) | 69.0 |
| Bachelor's Degree | 0 (0.0%) | 0.0 |
| Graduate Degree | 0 (0.0%) | 0.0 |
| Total | 66 (100.0%) | 44.0 |
Fertility by Education by Marriage Status in Forestbrook
65.1% of women with births in Forestbrook are unmarried. Women with the educational attainment of high school diploma are most likely to be married with 100.0% of them married at childbirth, while women with the educational attainment of less than high school are least likely to be married with 100.0% of them unmarried at childbirth.
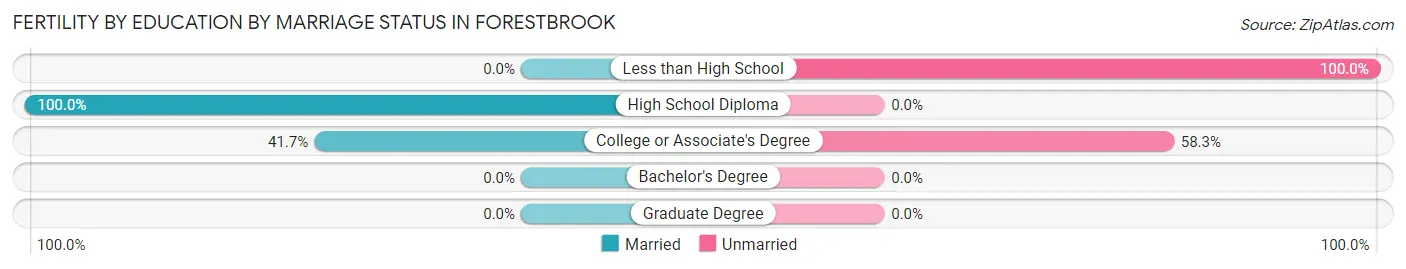
| Educational Attainment | Married | Unmarried |
| Less than High School | 0 (0.0%) | 22 (100.0%) |
| High School Diploma | 8 (100.0%) | 0 (0.0%) |
| College or Associate's Degree | 15 (41.7%) | 21 (58.3%) |
| Bachelor's Degree | 0 (0.0%) | 0 (0.0%) |
| Graduate Degree | 0 (0.0%) | 0 (0.0%) |
| Total | 23 (34.8%) | 43 (65.1%) |
Income in Forestbrook
Income Overview in Forestbrook
Per Capita Income in Forestbrook is $38,397, while median incomes of families and households are $71,835 and $66,172 respectively.
| Characteristic | Number | Measure |
| Per Capita Income | 7,414 | $38,397 |
| Median Family Income | 2,181 | $71,835 |
| Mean Family Income | 2,181 | $95,548 |
| Median Household Income | 2,754 | $66,172 |
| Mean Household Income | 2,754 | $94,176 |
| Income Deficit | 2,181 | $0 |
| Wage / Income Gap (%) | 7,414 | 11.97% |
| Wage / Income Gap ($) | 7,414 | 88.03¢ per $1 |
| Gini / Inequality Index | 7,414 | 0.40 |
Earnings by Sex in Forestbrook
Average Earnings in Forestbrook are $32,439, $36,053 for men and $31,738 for women, a difference of 12.0%.
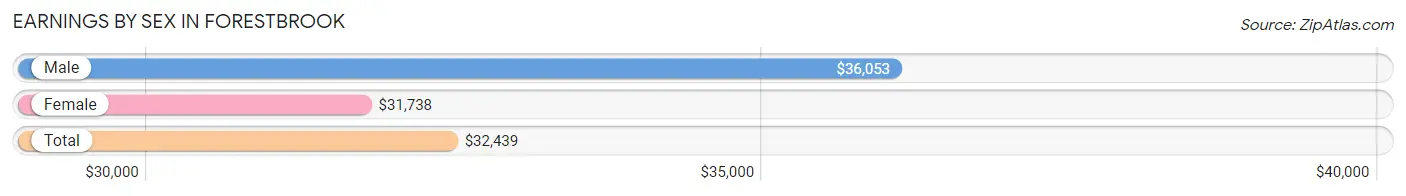
| Sex | Number | Average Earnings |
| Male | 1,904 (47.9%) | $36,053 |
| Female | 2,067 (52.0%) | $31,738 |
| Total | 3,971 (100.0%) | $32,439 |
Earnings by Sex by Income Bracket in Forestbrook
The most common earnings brackets in Forestbrook are $2,499 or less for men (225 | 11.8%) and $35,000 to $39,999 for women (234 | 11.3%).
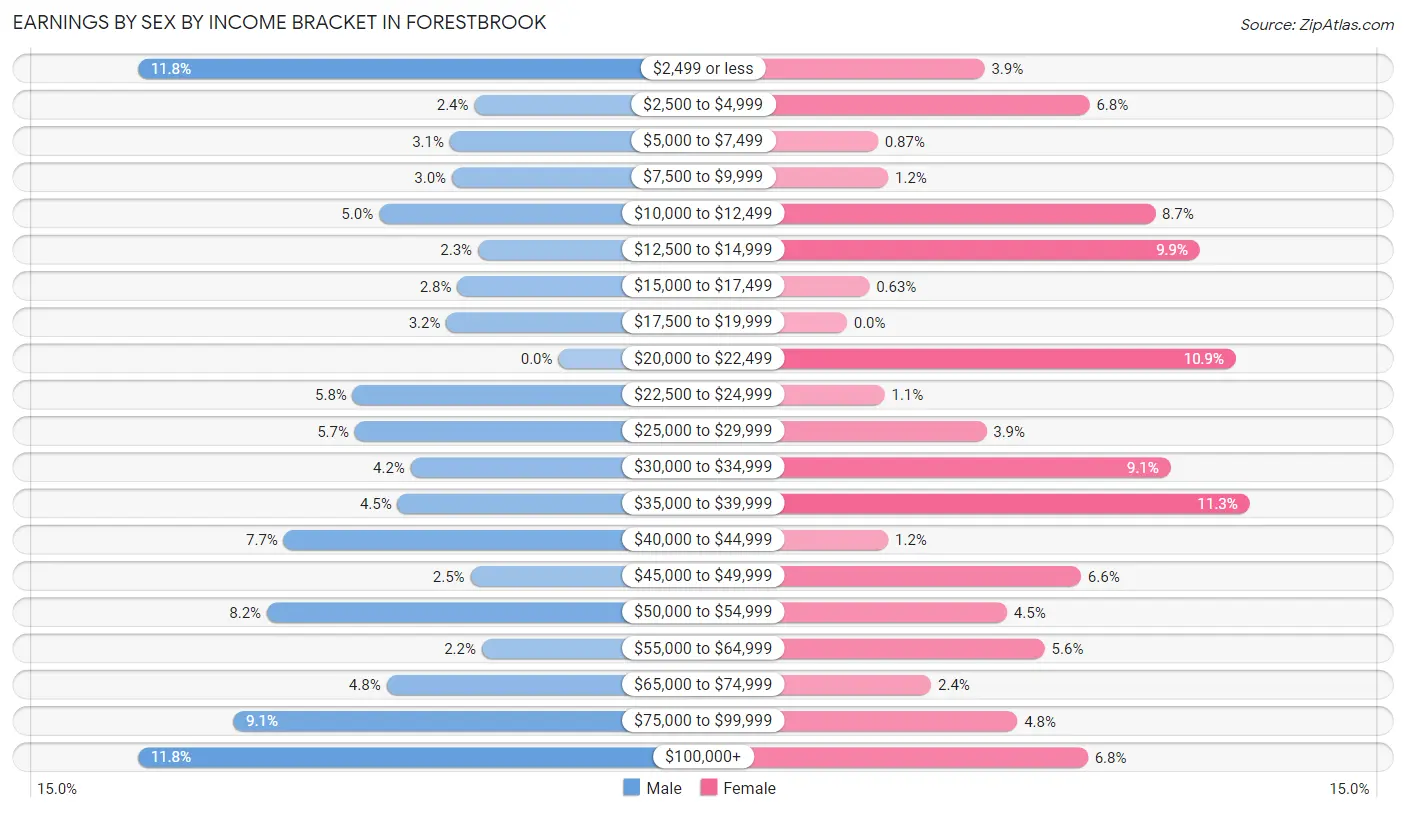
| Income | Male | Female |
| $2,499 or less | 225 (11.8%) | 80 (3.9%) |
| $2,500 to $4,999 | 45 (2.4%) | 141 (6.8%) |
| $5,000 to $7,499 | 58 (3.0%) | 18 (0.9%) |
| $7,500 to $9,999 | 57 (3.0%) | 24 (1.2%) |
| $10,000 to $12,499 | 96 (5.0%) | 179 (8.7%) |
| $12,500 to $14,999 | 43 (2.3%) | 205 (9.9%) |
| $15,000 to $17,499 | 54 (2.8%) | 13 (0.6%) |
| $17,500 to $19,999 | 60 (3.2%) | 0 (0.0%) |
| $20,000 to $22,499 | 0 (0.0%) | 226 (10.9%) |
| $22,500 to $24,999 | 110 (5.8%) | 22 (1.1%) |
| $25,000 to $29,999 | 109 (5.7%) | 81 (3.9%) |
| $30,000 to $34,999 | 79 (4.2%) | 188 (9.1%) |
| $35,000 to $39,999 | 86 (4.5%) | 234 (11.3%) |
| $40,000 to $44,999 | 147 (7.7%) | 24 (1.2%) |
| $45,000 to $49,999 | 47 (2.5%) | 136 (6.6%) |
| $50,000 to $54,999 | 156 (8.2%) | 93 (4.5%) |
| $55,000 to $64,999 | 41 (2.1%) | 115 (5.6%) |
| $65,000 to $74,999 | 92 (4.8%) | 49 (2.4%) |
| $75,000 to $99,999 | 174 (9.1%) | 99 (4.8%) |
| $100,000+ | 225 (11.8%) | 140 (6.8%) |
| Total | 1,904 (100.0%) | 2,067 (100.0%) |
Earnings by Sex by Educational Attainment in Forestbrook
Average earnings in Forestbrook are $49,043 for men and $34,133 for women, a difference of 30.4%. Men with an educational attainment of bachelor's degree enjoy the highest average annual earnings of $66,447, while those with high school diploma education earn the least with $41,111. Women with an educational attainment of bachelor's degree earn the most with the average annual earnings of $54,900, while those with less than high school education have the smallest earnings of $2,499.
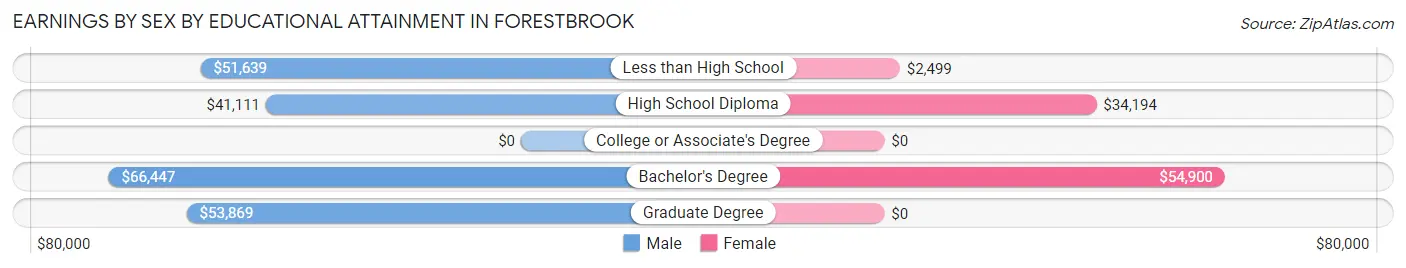
| Educational Attainment | Male Income | Female Income |
| Less than High School | $51,639 | $2,499 |
| High School Diploma | $41,111 | $34,194 |
| College or Associate's Degree | - | - |
| Bachelor's Degree | $66,447 | $54,900 |
| Graduate Degree | $53,869 | $0 |
| Total | $49,043 | $34,133 |
Family Income in Forestbrook
Family Income Brackets in Forestbrook
According to the Forestbrook family income data, there are 423 families falling into the $100,000 to $149,999 income range, which is the most common income bracket and makes up 19.4% of all families. Conversely, the $10,000 to $14,999 income bracket is the least frequent group with only 22 families (1.0%) belonging to this category.
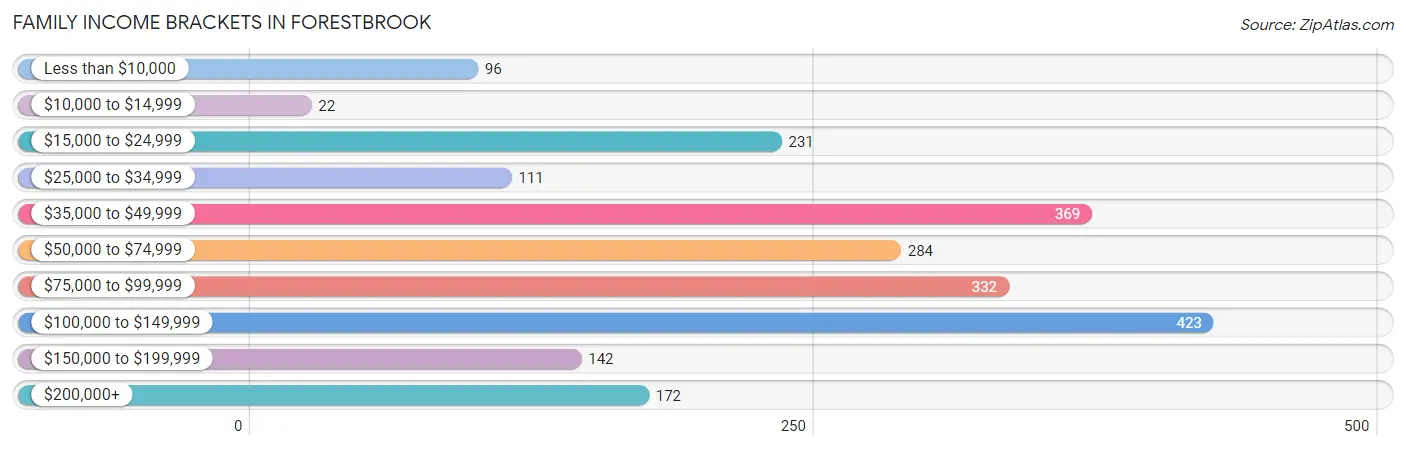
| Income Bracket | # Families | % Families |
| Less than $10,000 | 96 | 4.4% |
| $10,000 to $14,999 | 22 | 1.0% |
| $15,000 to $24,999 | 231 | 10.6% |
| $25,000 to $34,999 | 111 | 5.1% |
| $35,000 to $49,999 | 369 | 16.9% |
| $50,000 to $74,999 | 284 | 13.0% |
| $75,000 to $99,999 | 332 | 15.2% |
| $100,000 to $149,999 | 423 | 19.4% |
| $150,000 to $199,999 | 142 | 6.5% |
| $200,000+ | 172 | 7.9% |
Family Income by Famaliy Size in Forestbrook
5-person families (116 | 5.3%) account for the highest median family income in Forestbrook with $167,955 per family, while 3-person families (385 | 17.6%) have the highest median income of $36,201 per family member.
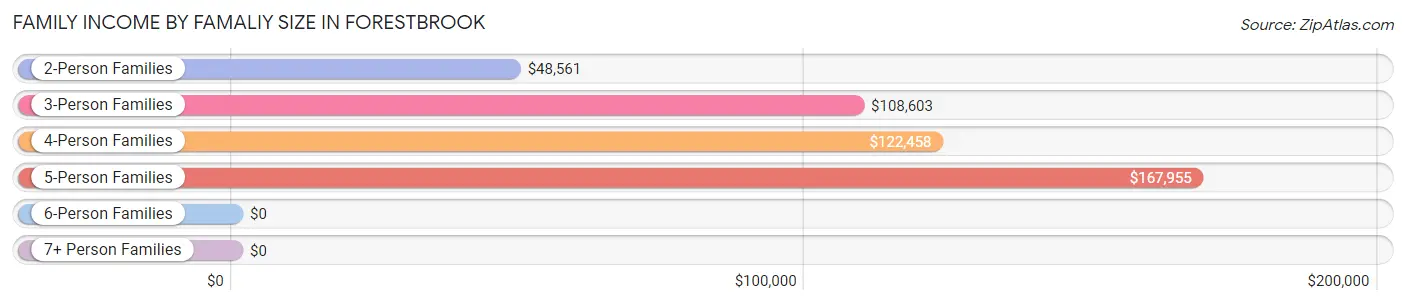
| Income Bracket | # Families | Median Income |
| 2-Person Families | 1,458 (66.8%) | $48,561 |
| 3-Person Families | 385 (17.6%) | $108,603 |
| 4-Person Families | 206 (9.5%) | $122,458 |
| 5-Person Families | 116 (5.3%) | $167,955 |
| 6-Person Families | 16 (0.7%) | $0 |
| 7+ Person Families | 0 (0.0%) | $0 |
| Total | 2,181 (100.0%) | $71,835 |
Family Income by Number of Earners in Forestbrook
The median family income in Forestbrook is $71,835, with families comprising 3+ earners (172) having the highest median family income of $168,182, while families with no earners (615) have the lowest median family income of $47,043, accounting for 7.9% and 28.2% of families, respectively.
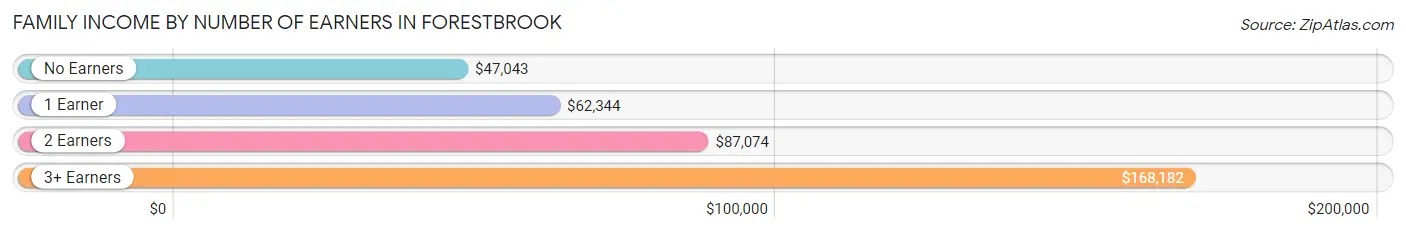
| Number of Earners | # Families | Median Income |
| No Earners | 615 (28.2%) | $47,043 |
| 1 Earner | 476 (21.8%) | $62,344 |
| 2 Earners | 918 (42.1%) | $87,074 |
| 3+ Earners | 172 (7.9%) | $168,182 |
| Total | 2,181 (100.0%) | $71,835 |
Household Income in Forestbrook
Household Income Brackets in Forestbrook
With 650 households falling in the category, the $50,000 to $74,999 income range is the most frequent in Forestbrook, accounting for 23.6% of all households. In contrast, only 8 households (0.3%) fall into the less than $10,000 income bracket, making it the least populous group.
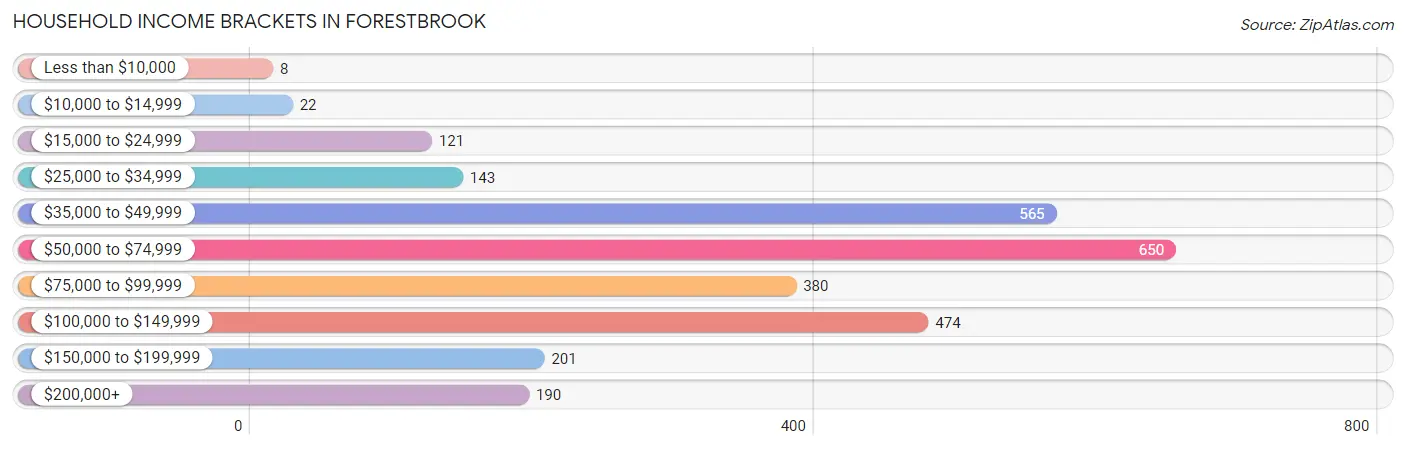
| Income Bracket | # Households | % Households |
| Less than $10,000 | 8 | 0.3% |
| $10,000 to $14,999 | 22 | 0.8% |
| $15,000 to $24,999 | 121 | 4.4% |
| $25,000 to $34,999 | 143 | 5.2% |
| $35,000 to $49,999 | 565 | 20.5% |
| $50,000 to $74,999 | 650 | 23.6% |
| $75,000 to $99,999 | 380 | 13.8% |
| $100,000 to $149,999 | 474 | 17.2% |
| $150,000 to $199,999 | 201 | 7.3% |
| $200,000+ | 190 | 6.9% |
Household Income by Householder Age in Forestbrook
The median household income in Forestbrook is $66,172, with the highest median household income of $75,469 found in the 45 to 64 years age bracket for the primary householder. A total of 1,081 households (39.3%) fall into this category.
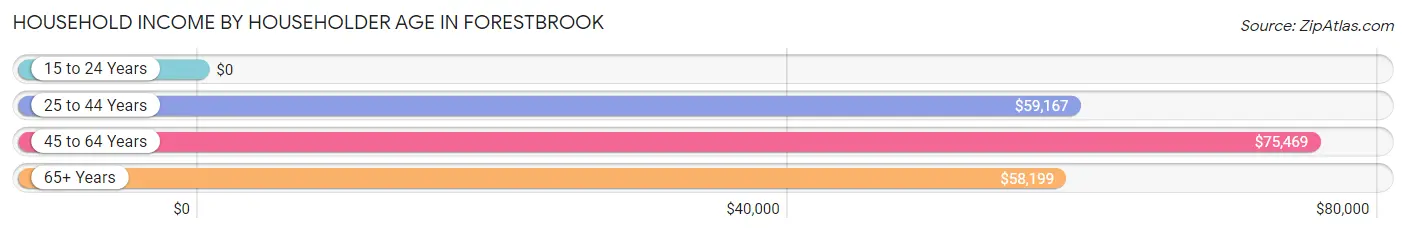
| Income Bracket | # Households | Median Income |
| 15 to 24 Years | 0 (0.0%) | $0 |
| 25 to 44 Years | 658 (23.9%) | $59,167 |
| 45 to 64 Years | 1,081 (39.3%) | $75,469 |
| 65+ Years | 1,015 (36.9%) | $58,199 |
| Total | 2,754 (100.0%) | $66,172 |
Poverty in Forestbrook
Income Below Poverty by Sex and Age in Forestbrook
With 6.3% poverty level for males and 9.3% for females among the residents of Forestbrook, 6 to 11 year old males and 16 and 17 year old females are the most vulnerable to poverty, with 60 males (30.3%) and 49 females (100.0%) in their respective age groups living below the poverty level.
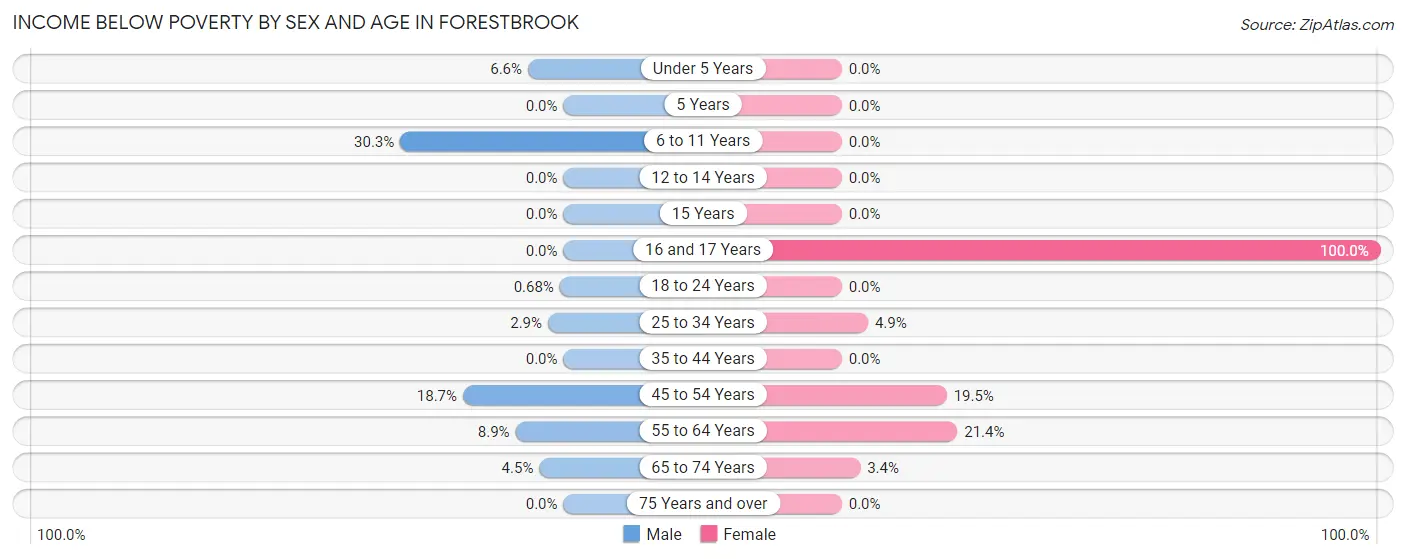
| Age Bracket | Male | Female |
| Under 5 Years | 12 (6.6%) | 0 (0.0%) |
| 5 Years | 0 (0.0%) | 0 (0.0%) |
| 6 to 11 Years | 60 (30.3%) | 0 (0.0%) |
| 12 to 14 Years | 0 (0.0%) | 0 (0.0%) |
| 15 Years | 0 (0.0%) | 0 (0.0%) |
| 16 and 17 Years | 0 (0.0%) | 49 (100.0%) |
| 18 to 24 Years | 2 (0.7%) | 0 (0.0%) |
| 25 to 34 Years | 17 (2.9%) | 22 (4.9%) |
| 35 to 44 Years | 0 (0.0%) | 0 (0.0%) |
| 45 to 54 Years | 58 (18.6%) | 95 (19.5%) |
| 55 to 64 Years | 56 (8.9%) | 164 (21.4%) |
| 65 to 74 Years | 22 (4.5%) | 23 (3.4%) |
| 75 Years and over | 0 (0.0%) | 0 (0.0%) |
| Total | 227 (6.3%) | 353 (9.3%) |
Income Above Poverty by Sex and Age in Forestbrook
According to the poverty statistics in Forestbrook, males aged 12 to 14 years and females aged under 5 years are the age groups that are most secure financially, with 100.0% of males and 100.0% of females in these age groups living above the poverty line.
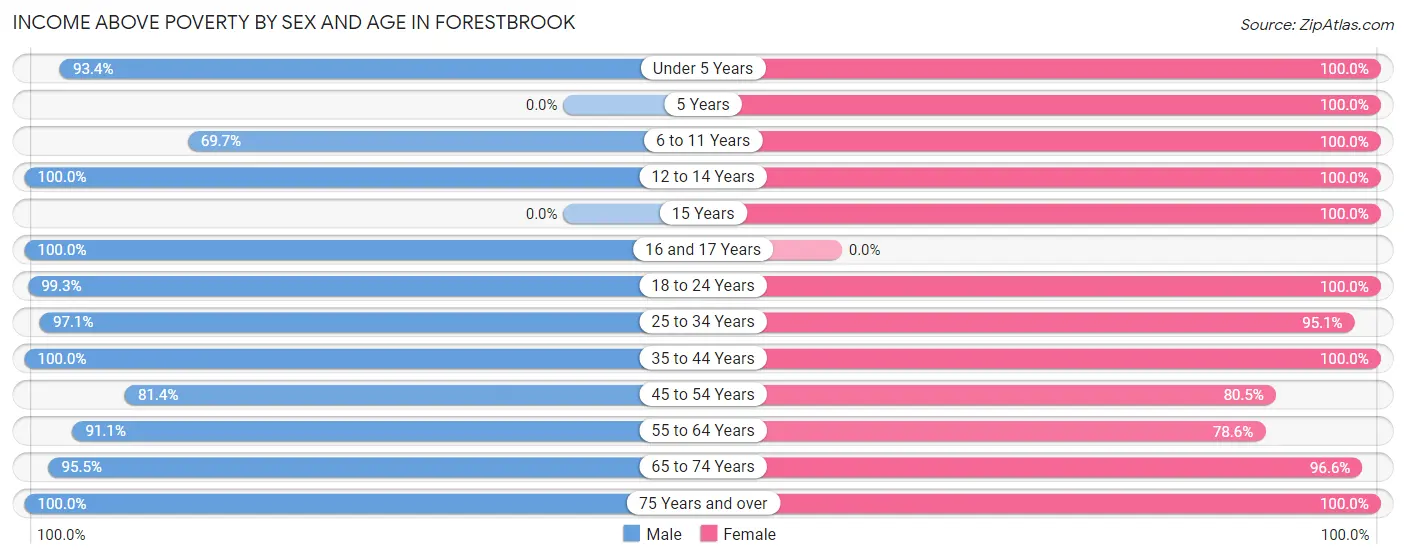
| Age Bracket | Male | Female |
| Under 5 Years | 170 (93.4%) | 102 (100.0%) |
| 5 Years | 0 (0.0%) | 19 (100.0%) |
| 6 to 11 Years | 138 (69.7%) | 63 (100.0%) |
| 12 to 14 Years | 121 (100.0%) | 61 (100.0%) |
| 15 Years | 0 (0.0%) | 23 (100.0%) |
| 16 and 17 Years | 324 (100.0%) | 0 (0.0%) |
| 18 to 24 Years | 292 (99.3%) | 248 (100.0%) |
| 25 to 34 Years | 575 (97.1%) | 431 (95.1%) |
| 35 to 44 Years | 154 (100.0%) | 394 (100.0%) |
| 45 to 54 Years | 253 (81.4%) | 393 (80.5%) |
| 55 to 64 Years | 574 (91.1%) | 601 (78.6%) |
| 65 to 74 Years | 470 (95.5%) | 650 (96.6%) |
| 75 Years and over | 323 (100.0%) | 455 (100.0%) |
| Total | 3,394 (93.7%) | 3,440 (90.7%) |
Income Below Poverty Among Married-Couple Families in Forestbrook
The poverty statistics for married-couple families in Forestbrook show that 2.1% or 33 of the total 1,537 families live below the poverty line. Families with 1 or 2 children have the highest poverty rate of 3.4%, comprising of 11 families. On the other hand, families with 3 or 4 children have the lowest poverty rate of 0.0%, which includes 0 families.
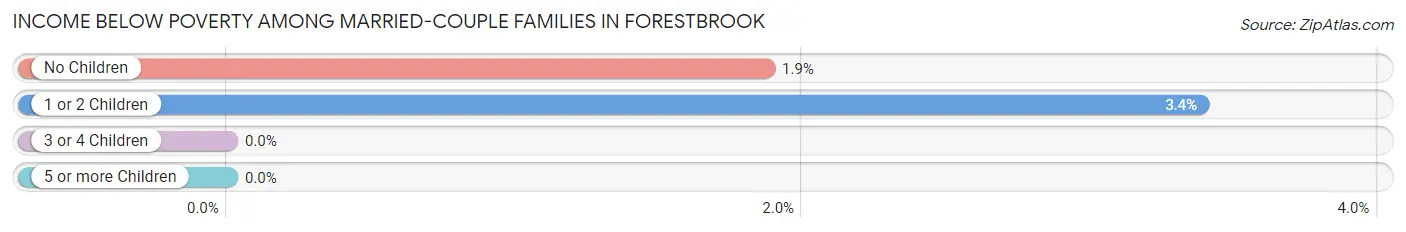
| Children | Above Poverty | Below Poverty |
| No Children | 1,157 (98.1%) | 22 (1.9%) |
| 1 or 2 Children | 314 (96.6%) | 11 (3.4%) |
| 3 or 4 Children | 33 (100.0%) | 0 (0.0%) |
| 5 or more Children | 0 (0.0%) | 0 (0.0%) |
| Total | 1,504 (97.9%) | 33 (2.1%) |
Income Below Poverty Among Single-Parent Households in Forestbrook
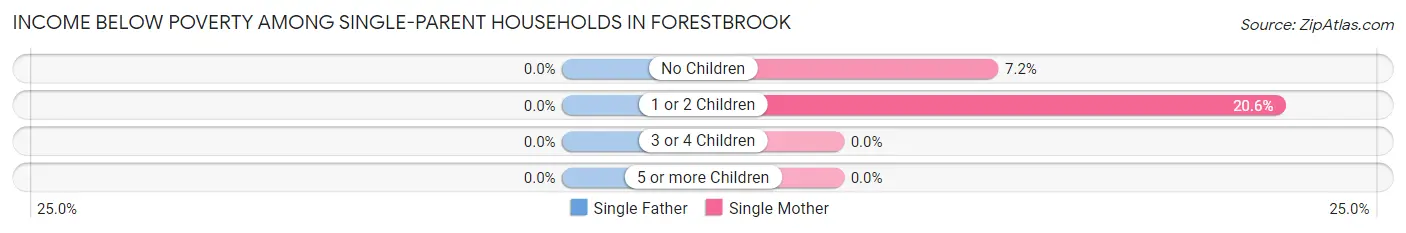
| Children | Single Father | Single Mother |
| No Children | 0 (0.0%) | 10 (7.2%) |
| 1 or 2 Children | 0 (0.0%) | 95 (20.6%) |
| 3 or 4 Children | 0 (0.0%) | 0 (0.0%) |
| 5 or more Children | 0 (0.0%) | 0 (0.0%) |
| Total | 0 (0.0%) | 105 (17.5%) |
Income Below Poverty Among Married-Couple vs Single-Parent Households in Forestbrook
The poverty data for Forestbrook shows that 33 of the married-couple family households (2.1%) and 105 of the single-parent households (16.3%) are living below the poverty level. Within the married-couple family households, those with 1 or 2 children have the highest poverty rate, with 11 households (3.4%) falling below the poverty line. Among the single-parent households, those with 1 or 2 children have the highest poverty rate, with 95 household (20.6%) living below poverty.
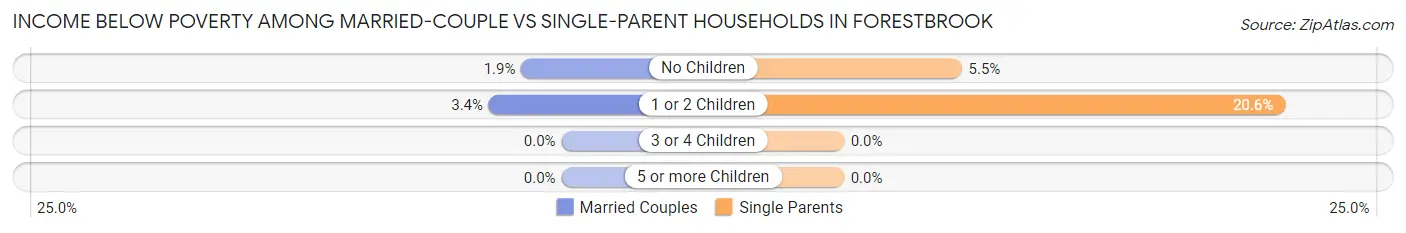
| Children | Married-Couple Families | Single-Parent Households |
| No Children | 22 (1.9%) | 10 (5.5%) |
| 1 or 2 Children | 11 (3.4%) | 95 (20.6%) |
| 3 or 4 Children | 0 (0.0%) | 0 (0.0%) |
| 5 or more Children | 0 (0.0%) | 0 (0.0%) |
| Total | 33 (2.1%) | 105 (16.3%) |
Employment Characteristics in Forestbrook
Employment by Class of Employer in Forestbrook
Among the 3,364 employed individuals in Forestbrook, private company employees (2,217 | 65.9%), local government employees (406 | 12.1%), and self-employed (not incorporated) (302 | 9.0%) make up the most common classes of employment.
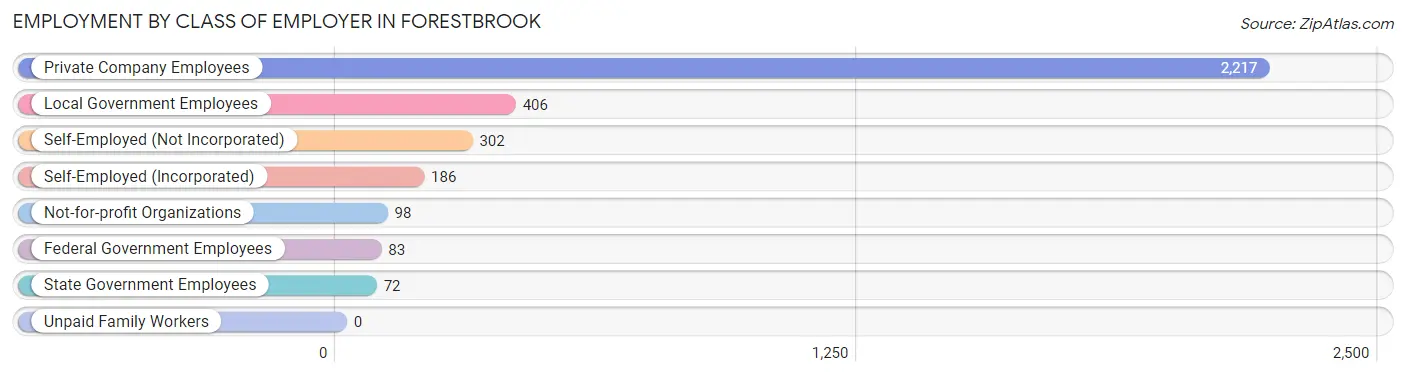
| Employer Class | # Employees | % Employees |
| Private Company Employees | 2,217 | 65.9% |
| Self-Employed (Incorporated) | 186 | 5.5% |
| Self-Employed (Not Incorporated) | 302 | 9.0% |
| Not-for-profit Organizations | 98 | 2.9% |
| Local Government Employees | 406 | 12.1% |
| State Government Employees | 72 | 2.1% |
| Federal Government Employees | 83 | 2.5% |
| Unpaid Family Workers | 0 | 0.0% |
| Total | 3,364 | 100.0% |
Employment Status by Age in Forestbrook
According to the labor force statistics for Forestbrook, out of the total population over 16 years of age (6,645), 56.4% or 3,748 individuals are in the labor force, with 5.9% or 221 of them unemployed. The age group with the highest labor force participation rate is 20 to 24 years, with 99.3% or 268 individuals in the labor force. Within the labor force, the 45 to 54 years age range has the highest percentage of unemployed individuals, with 19.6% or 141 of them being unemployed.
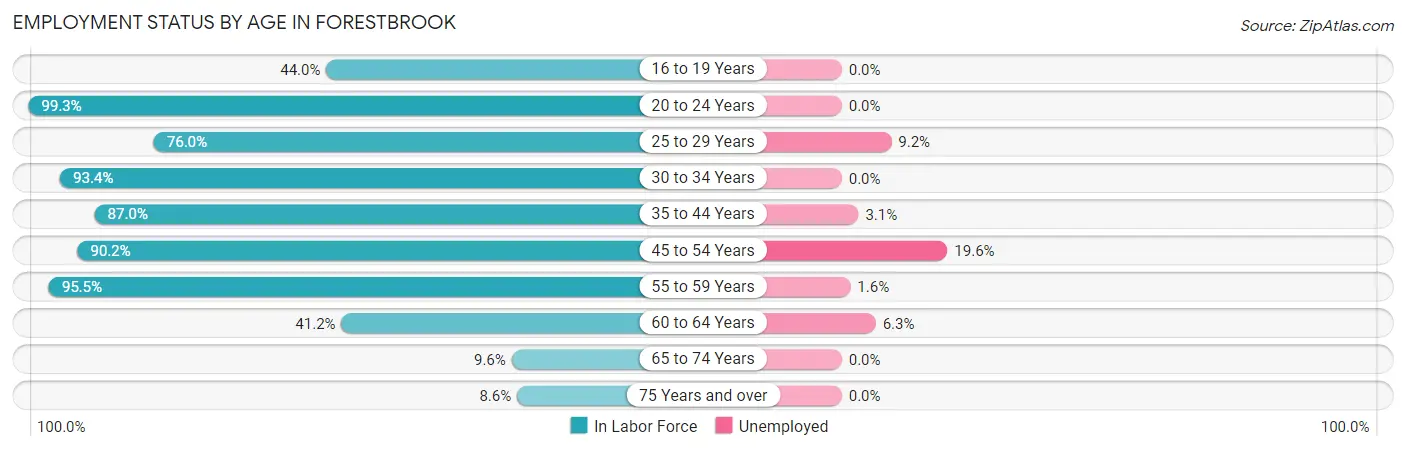
| Age Bracket | In Labor Force | Unemployed |
| 16 to 19 Years | 284 (44.0%) | 0 (0.0%) |
| 20 to 24 Years | 268 (99.3%) | 0 (0.0%) |
| 25 to 29 Years | 392 (76.0%) | 36 (9.2%) |
| 30 to 34 Years | 494 (93.4%) | 0 (0.0%) |
| 35 to 44 Years | 477 (87.0%) | 15 (3.1%) |
| 45 to 54 Years | 721 (90.2%) | 141 (19.6%) |
| 55 to 59 Years | 630 (95.5%) | 10 (1.6%) |
| 60 to 64 Years | 303 (41.2%) | 19 (6.3%) |
| 65 to 74 Years | 112 (9.6%) | 0 (0.0%) |
| 75 Years and over | 67 (8.6%) | 0 (0.0%) |
| Total | 3,748 (56.4%) | 221 (5.9%) |
Employment Status by Educational Attainment in Forestbrook
According to labor force statistics for Forestbrook, 79.7% of individuals (3,018) out of the total population between 25 and 64 years of age (3,787) are in the labor force, with 7.3% or 220 of them being unemployed. The group with the highest labor force participation rate are those with the educational attainment of bachelor's degree or higher, with 89.0% or 1,051 individuals in the labor force. Within the labor force, individuals with college / associate degree education have the highest percentage of unemployment, with 16.8% or 198 of them being unemployed.
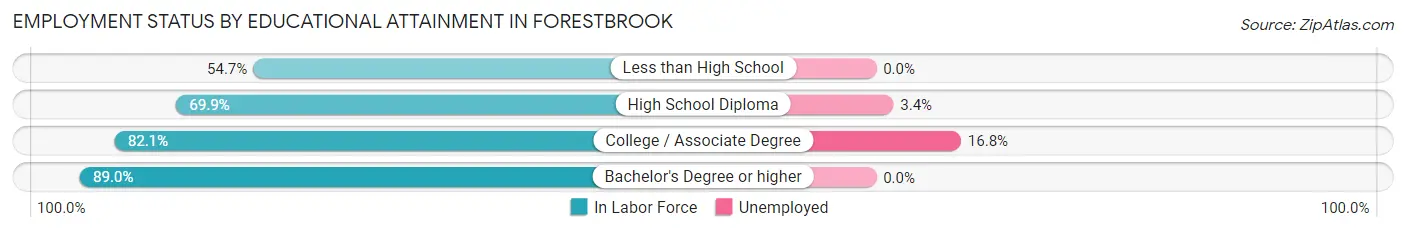
| Educational Attainment | In Labor Force | Unemployed |
| Less than High School | 111 (54.7%) | 0 (0.0%) |
| High School Diploma | 676 (69.9%) | 33 (3.4%) |
| College / Associate Degree | 1,179 (82.1%) | 241 (16.8%) |
| Bachelor's Degree or higher | 1,051 (89.0%) | 0 (0.0%) |
| Total | 3,018 (79.7%) | 276 (7.3%) |
Employment Occupations by Sex in Forestbrook
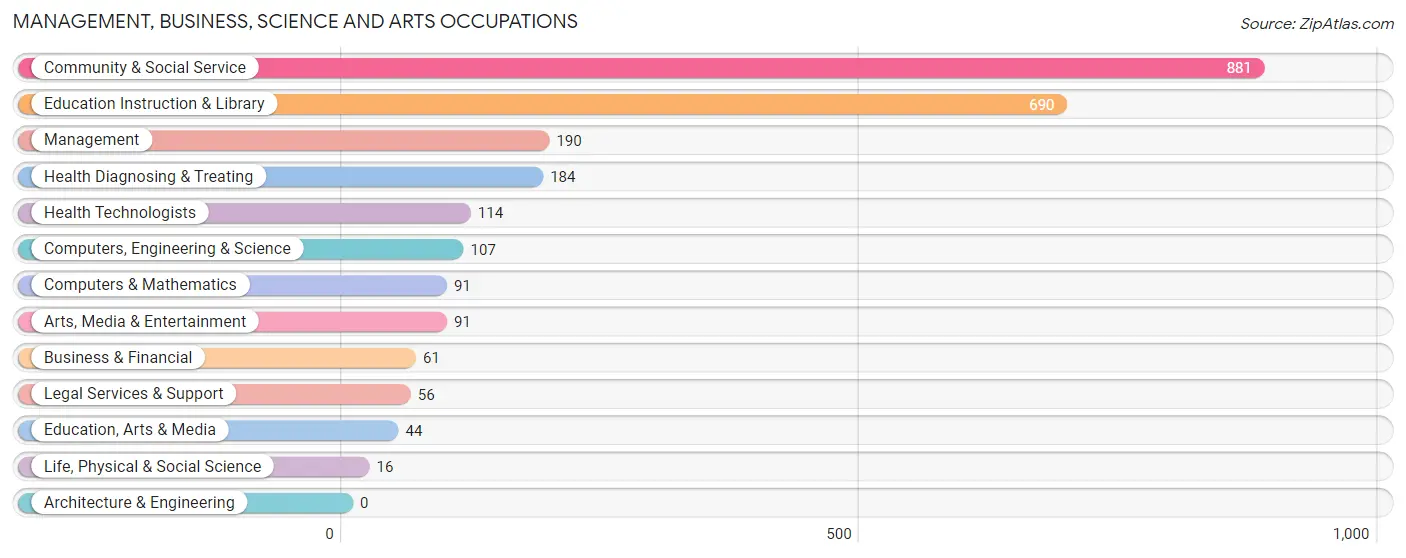
Management, Business, Science and Arts Occupations
The most common Management, Business, Science and Arts occupations in Forestbrook are Community & Social Service (881 | 25.2%), Education Instruction & Library (690 | 19.7%), Management (190 | 5.4%), Health Diagnosing & Treating (184 | 5.2%), and Health Technologists (114 | 3.3%).
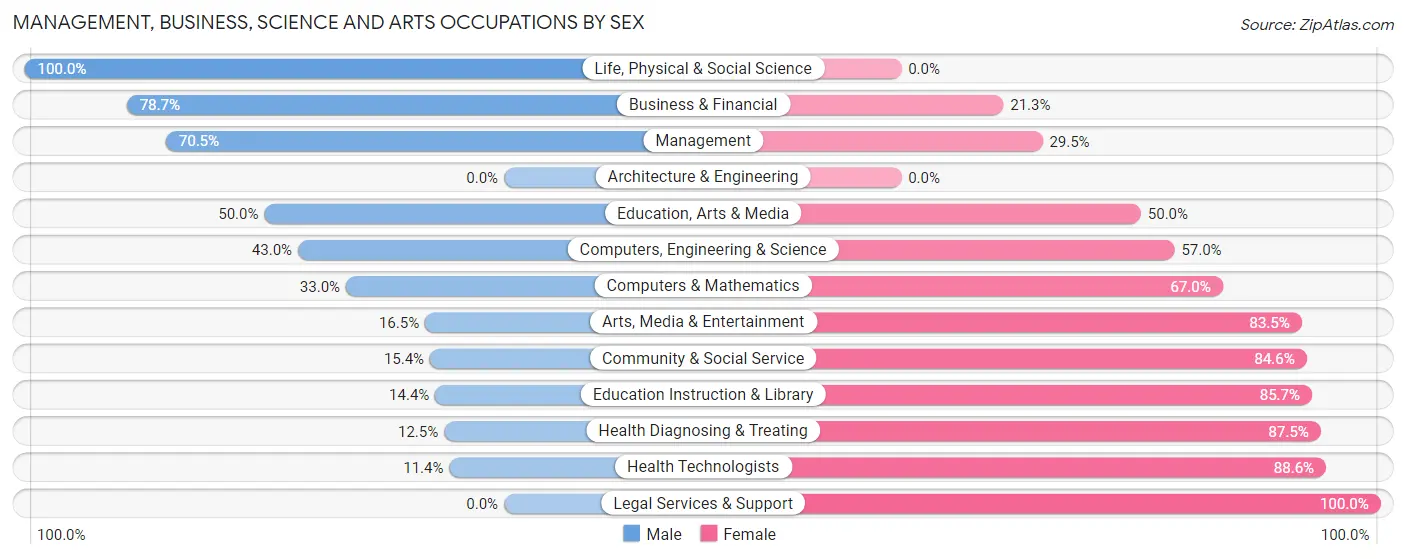
Management, Business, Science and Arts Occupations by Sex
Within the Management, Business, Science and Arts occupations in Forestbrook, the most male-oriented occupations are Life, Physical & Social Science (100.0%), Business & Financial (78.7%), and Management (70.5%), while the most female-oriented occupations are Legal Services & Support (100.0%), Health Technologists (88.6%), and Health Diagnosing & Treating (87.5%).
| Occupation | Male | Female |
| Management | 134 (70.5%) | 56 (29.5%) |
| Business & Financial | 48 (78.7%) | 13 (21.3%) |
| Computers, Engineering & Science | 46 (43.0%) | 61 (57.0%) |
| Computers & Mathematics | 30 (33.0%) | 61 (67.0%) |
| Architecture & Engineering | 0 (0.0%) | 0 (0.0%) |
| Life, Physical & Social Science | 16 (100.0%) | 0 (0.0%) |
| Community & Social Service | 136 (15.4%) | 745 (84.6%) |
| Education, Arts & Media | 22 (50.0%) | 22 (50.0%) |
| Legal Services & Support | 0 (0.0%) | 56 (100.0%) |
| Education Instruction & Library | 99 (14.3%) | 591 (85.7%) |
| Arts, Media & Entertainment | 15 (16.5%) | 76 (83.5%) |
| Health Diagnosing & Treating | 23 (12.5%) | 161 (87.5%) |
| Health Technologists | 13 (11.4%) | 101 (88.6%) |
| Total (Category) | 387 (27.2%) | 1,036 (72.8%) |
| Total (Overall) | 1,531 (43.7%) | 1,972 (56.3%) |
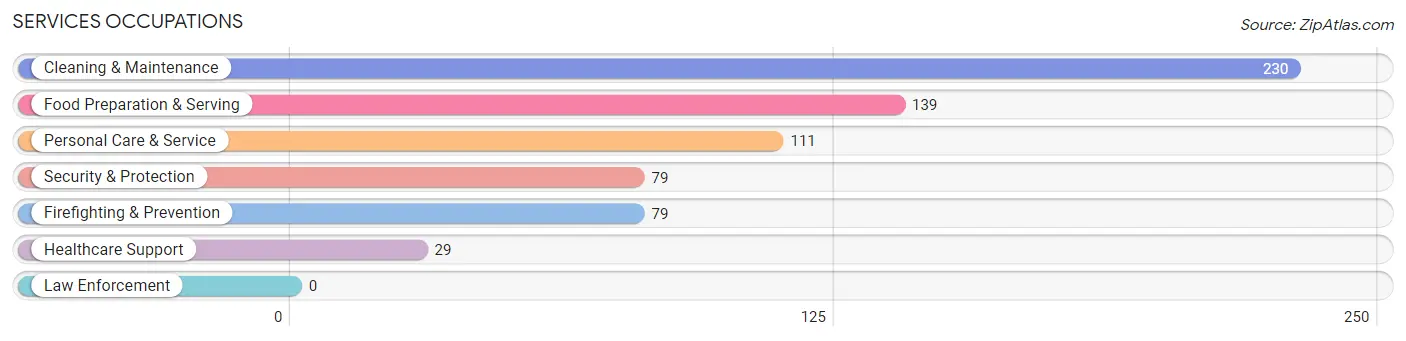
Services Occupations
The most common Services occupations in Forestbrook are Cleaning & Maintenance (230 | 6.6%), Food Preparation & Serving (139 | 4.0%), Personal Care & Service (111 | 3.2%), Security & Protection (79 | 2.3%), and Firefighting & Prevention (79 | 2.3%).
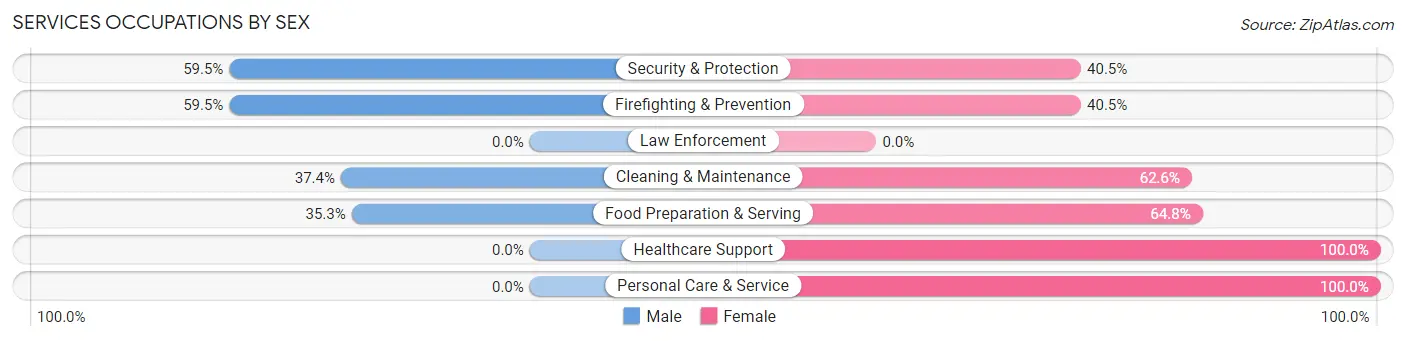
Services Occupations by Sex
Within the Services occupations in Forestbrook, the most male-oriented occupations are Security & Protection (59.5%), Firefighting & Prevention (59.5%), and Cleaning & Maintenance (37.4%), while the most female-oriented occupations are Healthcare Support (100.0%), Personal Care & Service (100.0%), and Food Preparation & Serving (64.7%).
| Occupation | Male | Female |
| Healthcare Support | 0 (0.0%) | 29 (100.0%) |
| Security & Protection | 47 (59.5%) | 32 (40.5%) |
| Firefighting & Prevention | 47 (59.5%) | 32 (40.5%) |
| Law Enforcement | 0 (0.0%) | 0 (0.0%) |
| Food Preparation & Serving | 49 (35.2%) | 90 (64.7%) |
| Cleaning & Maintenance | 86 (37.4%) | 144 (62.6%) |
| Personal Care & Service | 0 (0.0%) | 111 (100.0%) |
| Total (Category) | 182 (30.9%) | 406 (69.1%) |
| Total (Overall) | 1,531 (43.7%) | 1,972 (56.3%) |
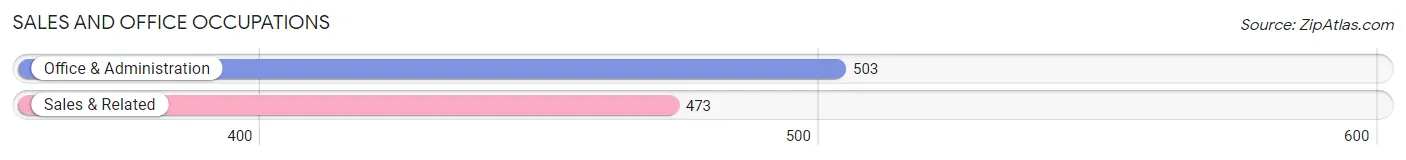
Sales and Office Occupations
The most common Sales and Office occupations in Forestbrook are Office & Administration (503 | 14.4%), and Sales & Related (473 | 13.5%).
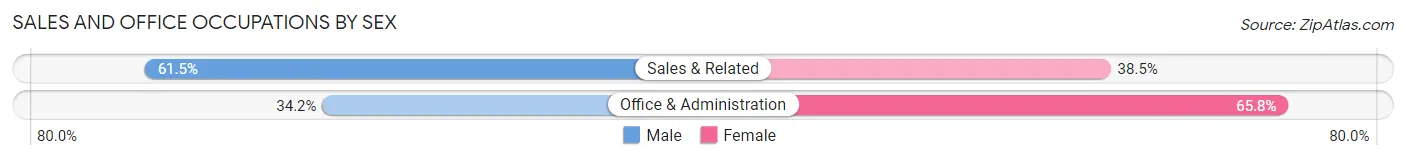
Sales and Office Occupations by Sex
| Occupation | Male | Female |
| Sales & Related | 291 (61.5%) | 182 (38.5%) |
| Office & Administration | 172 (34.2%) | 331 (65.8%) |
| Total (Category) | 463 (47.4%) | 513 (52.6%) |
| Total (Overall) | 1,531 (43.7%) | 1,972 (56.3%) |
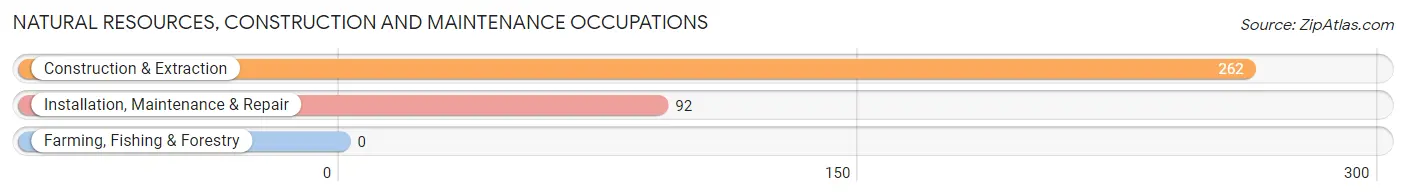
Natural Resources, Construction and Maintenance Occupations
The most common Natural Resources, Construction and Maintenance occupations in Forestbrook are Construction & Extraction (262 | 7.5%), and Installation, Maintenance & Repair (92 | 2.6%).
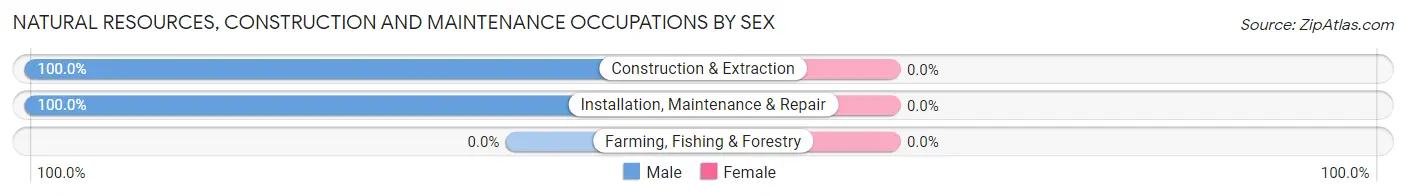
Natural Resources, Construction and Maintenance Occupations by Sex
| Occupation | Male | Female |
| Farming, Fishing & Forestry | 0 (0.0%) | 0 (0.0%) |
| Construction & Extraction | 262 (100.0%) | 0 (0.0%) |
| Installation, Maintenance & Repair | 92 (100.0%) | 0 (0.0%) |
| Total (Category) | 354 (100.0%) | 0 (0.0%) |
| Total (Overall) | 1,531 (43.7%) | 1,972 (56.3%) |
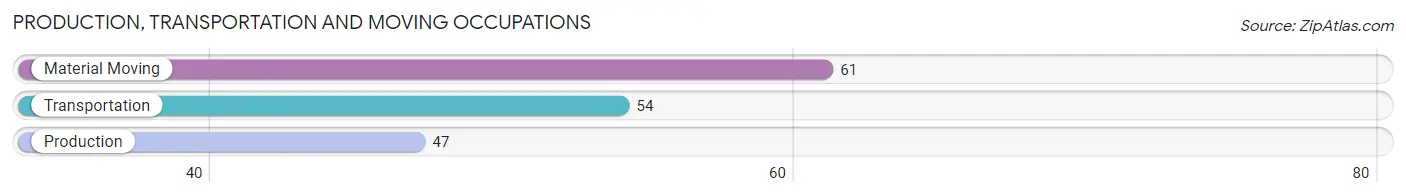
Production, Transportation and Moving Occupations
The most common Production, Transportation and Moving occupations in Forestbrook are Material Moving (61 | 1.7%), Transportation (54 | 1.5%), and Production (47 | 1.3%).
Production, Transportation and Moving Occupations by Sex
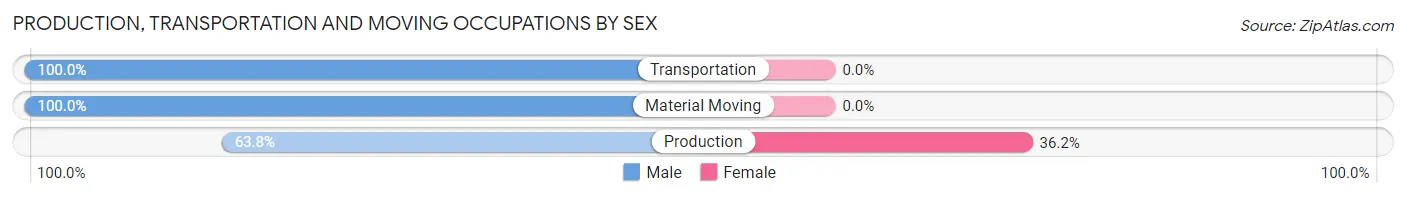
| Occupation | Male | Female |
| Production | 30 (63.8%) | 17 (36.2%) |
| Transportation | 54 (100.0%) | 0 (0.0%) |
| Material Moving | 61 (100.0%) | 0 (0.0%) |
| Total (Category) | 145 (89.5%) | 17 (10.5%) |
| Total (Overall) | 1,531 (43.7%) | 1,972 (56.3%) |
Employment Industries by Sex in Forestbrook
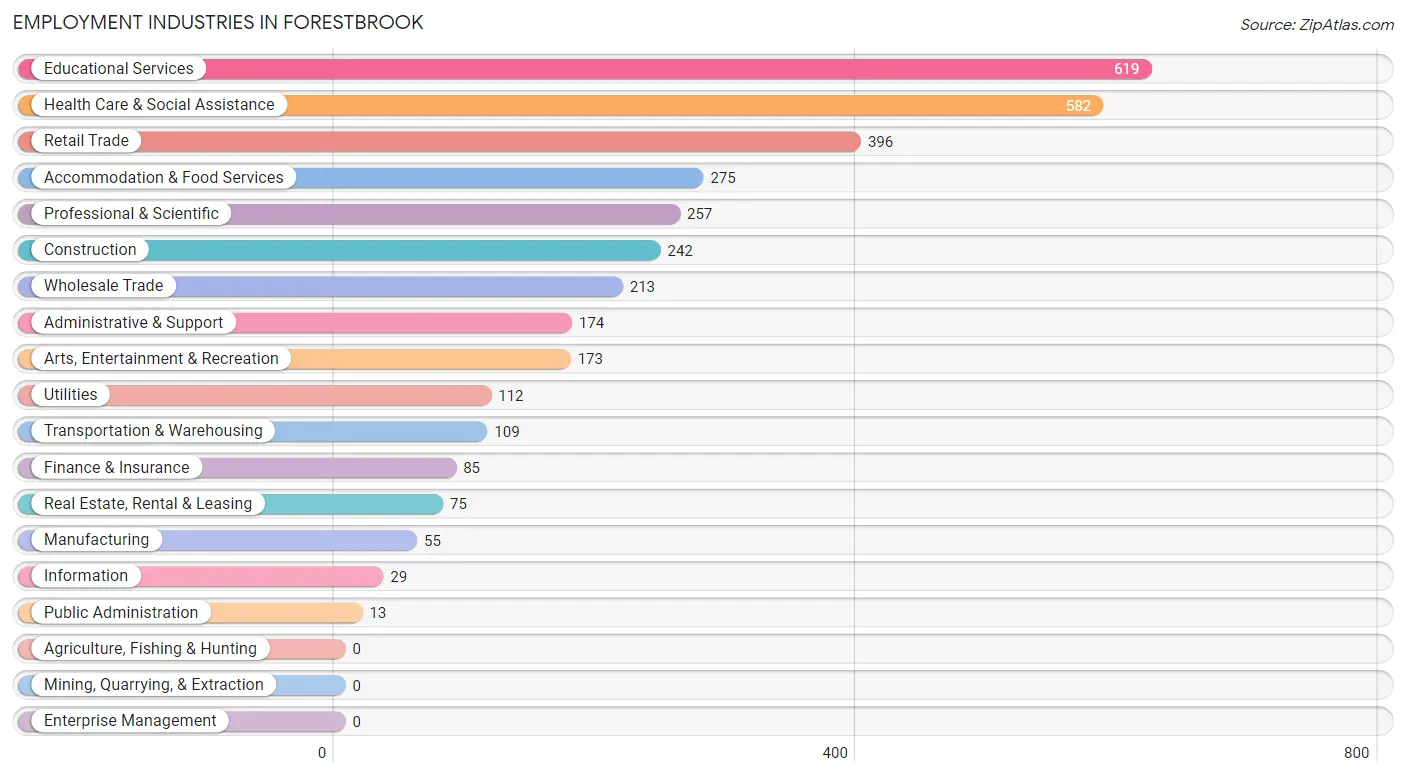
Employment Industries in Forestbrook
The major employment industries in Forestbrook include Educational Services (619 | 17.7%), Health Care & Social Assistance (582 | 16.6%), Retail Trade (396 | 11.3%), Accommodation & Food Services (275 | 7.9%), and Professional & Scientific (257 | 7.3%).
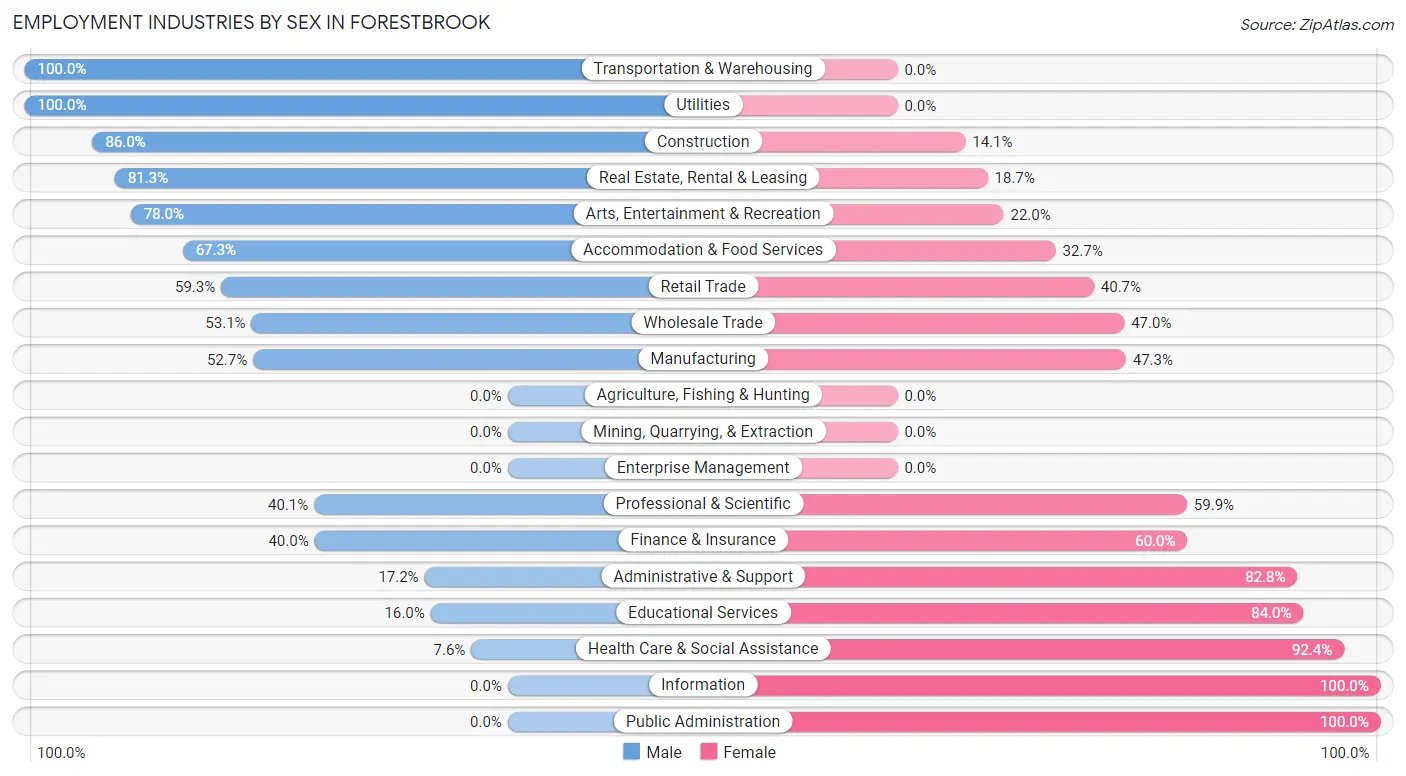
Employment Industries by Sex in Forestbrook
The Forestbrook industries that see more men than women are Transportation & Warehousing (100.0%), Utilities (100.0%), and Construction (86.0%), whereas the industries that tend to have a higher number of women are Information (100.0%), Public Administration (100.0%), and Health Care & Social Assistance (92.4%).
| Industry | Male | Female |
| Agriculture, Fishing & Hunting | 0 (0.0%) | 0 (0.0%) |
| Mining, Quarrying, & Extraction | 0 (0.0%) | 0 (0.0%) |
| Construction | 208 (86.0%) | 34 (14.1%) |
| Manufacturing | 29 (52.7%) | 26 (47.3%) |
| Wholesale Trade | 113 (53.0%) | 100 (46.9%) |
| Retail Trade | 235 (59.3%) | 161 (40.7%) |
| Transportation & Warehousing | 109 (100.0%) | 0 (0.0%) |
| Utilities | 112 (100.0%) | 0 (0.0%) |
| Information | 0 (0.0%) | 29 (100.0%) |
| Finance & Insurance | 34 (40.0%) | 51 (60.0%) |
| Real Estate, Rental & Leasing | 61 (81.3%) | 14 (18.7%) |
| Professional & Scientific | 103 (40.1%) | 154 (59.9%) |
| Enterprise Management | 0 (0.0%) | 0 (0.0%) |
| Administrative & Support | 30 (17.2%) | 144 (82.8%) |
| Educational Services | 99 (16.0%) | 520 (84.0%) |
| Health Care & Social Assistance | 44 (7.6%) | 538 (92.4%) |
| Arts, Entertainment & Recreation | 135 (78.0%) | 38 (22.0%) |
| Accommodation & Food Services | 185 (67.3%) | 90 (32.7%) |
| Public Administration | 0 (0.0%) | 13 (100.0%) |
| Total | 1,531 (43.7%) | 1,972 (56.3%) |
Education in Forestbrook
School Enrollment in Forestbrook
The most common levels of schooling among the 1,318 students in Forestbrook are high school (513 | 38.9%), college / undergraduate (313 | 23.7%), and middle school (221 | 16.8%).
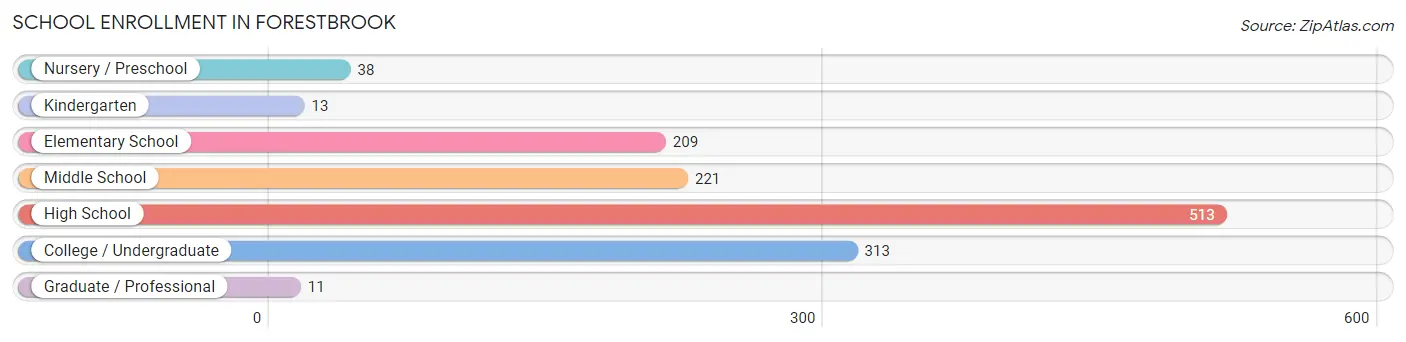
| School Level | # Students | % Students |
| Nursery / Preschool | 38 | 2.9% |
| Kindergarten | 13 | 1.0% |
| Elementary School | 209 | 15.9% |
| Middle School | 221 | 16.8% |
| High School | 513 | 38.9% |
| College / Undergraduate | 313 | 23.7% |
| Graduate / Professional | 11 | 0.8% |
| Total | 1,318 | 100.0% |
School Enrollment by Age by Funding Source in Forestbrook
Out of a total of 1,318 students who are enrolled in schools in Forestbrook, 195 (14.8%) attend a private institution, while the remaining 1,123 (85.2%) are enrolled in public schools. The age group of 25 to 34 year olds has the highest likelihood of being enrolled in private schools, with 52 (59.1% in the age bracket) enrolled. Conversely, the age group of 3 to 4 year olds has the lowest likelihood of being enrolled in a private school, with 19 (100.0% in the age bracket) attending a public institution.
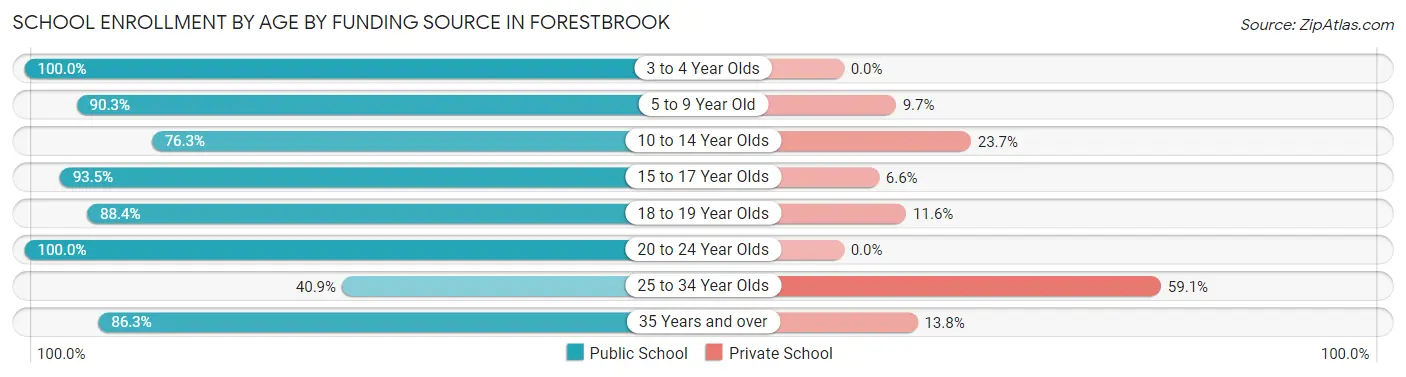
| Age Bracket | Public School | Private School |
| 3 to 4 Year Olds | 19 (100.0%) | 0 (0.0%) |
| 5 to 9 Year Old | 177 (90.3%) | 19 (9.7%) |
| 10 to 14 Year Olds | 203 (76.3%) | 63 (23.7%) |
| 15 to 17 Year Olds | 328 (93.4%) | 23 (6.6%) |
| 18 to 19 Year Olds | 205 (88.4%) | 27 (11.6%) |
| 20 to 24 Year Olds | 86 (100.0%) | 0 (0.0%) |
| 25 to 34 Year Olds | 36 (40.9%) | 52 (59.1%) |
| 35 Years and over | 69 (86.3%) | 11 (13.8%) |
| Total | 1,123 (85.2%) | 195 (14.8%) |
Educational Attainment by Field of Study in Forestbrook
Business (535 | 31.4%), education (260 | 15.2%), science & technology (235 | 13.8%), arts & humanities (117 | 6.9%), and psychology (109 | 6.4%) are the most common fields of study among 1,706 individuals in Forestbrook who have obtained a bachelor's degree or higher.
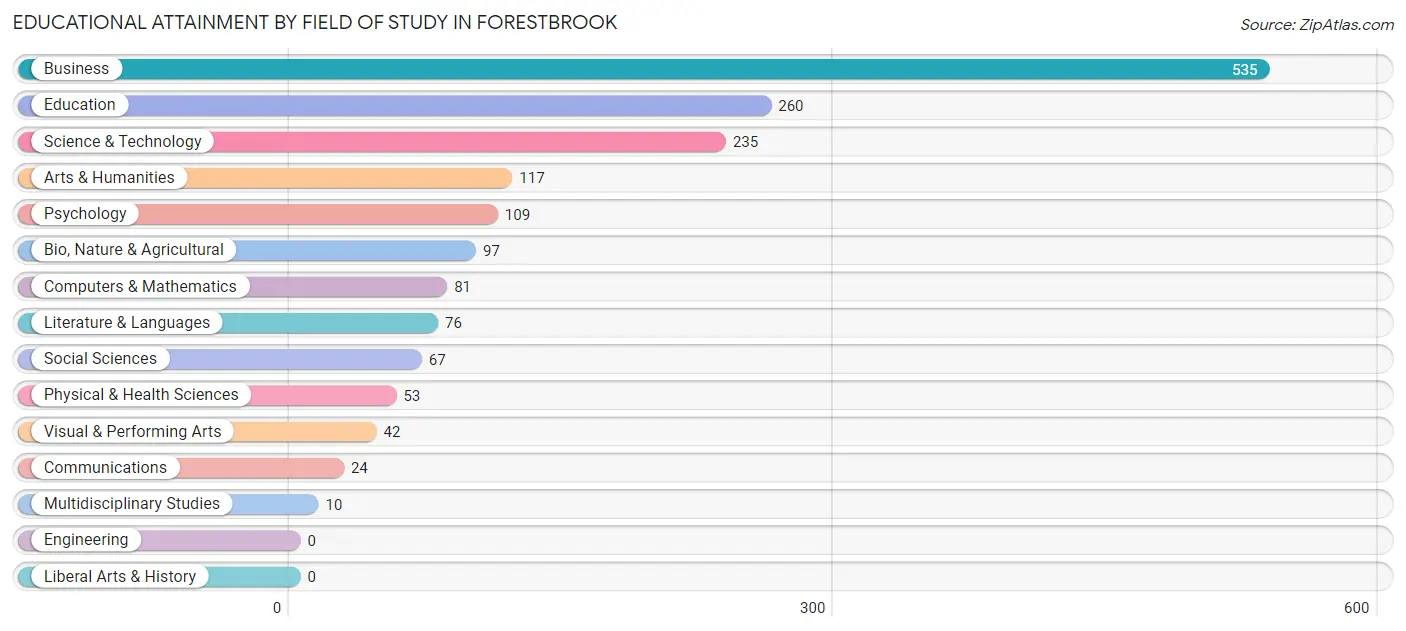
| Field of Study | # Graduates | % Graduates |
| Computers & Mathematics | 81 | 4.8% |
| Bio, Nature & Agricultural | 97 | 5.7% |
| Physical & Health Sciences | 53 | 3.1% |
| Psychology | 109 | 6.4% |
| Social Sciences | 67 | 3.9% |
| Engineering | 0 | 0.0% |
| Multidisciplinary Studies | 10 | 0.6% |
| Science & Technology | 235 | 13.8% |
| Business | 535 | 31.4% |
| Education | 260 | 15.2% |
| Literature & Languages | 76 | 4.4% |
| Liberal Arts & History | 0 | 0.0% |
| Visual & Performing Arts | 42 | 2.5% |
| Communications | 24 | 1.4% |
| Arts & Humanities | 117 | 6.9% |
| Total | 1,706 | 100.0% |
Transportation & Commute in Forestbrook
Vehicle Availability by Sex in Forestbrook
The most prevalent vehicle ownership categories in Forestbrook are males with 2 vehicles (791, accounting for 52.4%) and females with 2 vehicles (651, making up 42.7%).
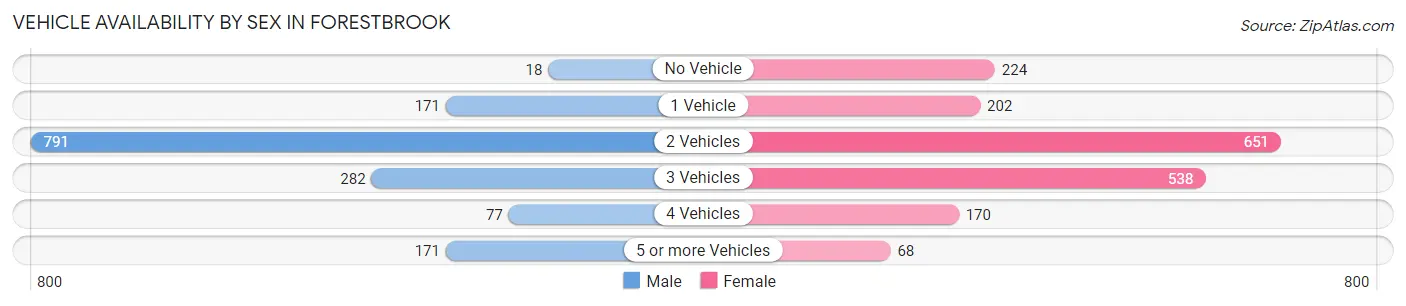
| Vehicles Available | Male | Female |
| No Vehicle | 18 (1.2%) | 224 (12.1%) |
| 1 Vehicle | 171 (11.3%) | 202 (10.9%) |
| 2 Vehicles | 791 (52.4%) | 651 (35.1%) |
| 3 Vehicles | 282 (18.7%) | 538 (29.0%) |
| 4 Vehicles | 77 (5.1%) | 170 (9.2%) |
| 5 or more Vehicles | 171 (11.3%) | 68 (3.7%) |
| Total | 1,510 (100.0%) | 1,853 (100.0%) |
Commute Time in Forestbrook
The most frequently occuring commute durations in Forestbrook are 15 to 19 minutes (1,123 commuters, 36.2%), 10 to 14 minutes (654 commuters, 21.1%), and 20 to 24 minutes (372 commuters, 12.0%).
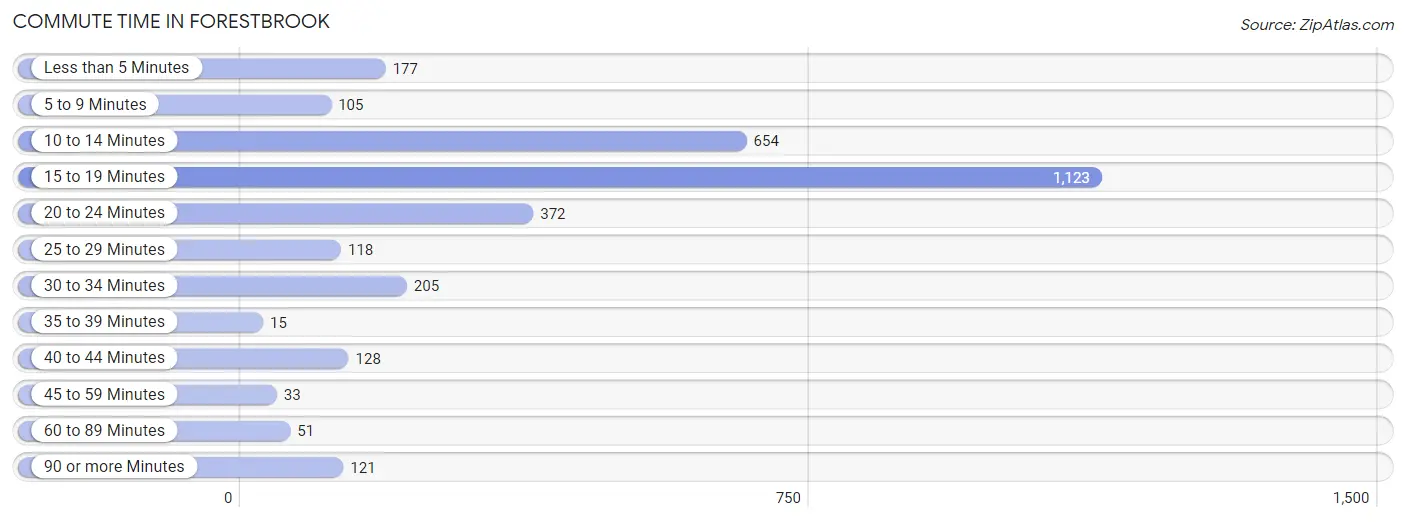
| Commute Time | # Commuters | % Commuters |
| Less than 5 Minutes | 177 | 5.7% |
| 5 to 9 Minutes | 105 | 3.4% |
| 10 to 14 Minutes | 654 | 21.1% |
| 15 to 19 Minutes | 1,123 | 36.2% |
| 20 to 24 Minutes | 372 | 12.0% |
| 25 to 29 Minutes | 118 | 3.8% |
| 30 to 34 Minutes | 205 | 6.6% |
| 35 to 39 Minutes | 15 | 0.5% |
| 40 to 44 Minutes | 128 | 4.1% |
| 45 to 59 Minutes | 33 | 1.1% |
| 60 to 89 Minutes | 51 | 1.6% |
| 90 or more Minutes | 121 | 3.9% |
Commute Time by Sex in Forestbrook
The most common commute times in Forestbrook are 15 to 19 minutes (343 commuters, 25.1%) for males and 15 to 19 minutes (780 commuters, 44.9%) for females.
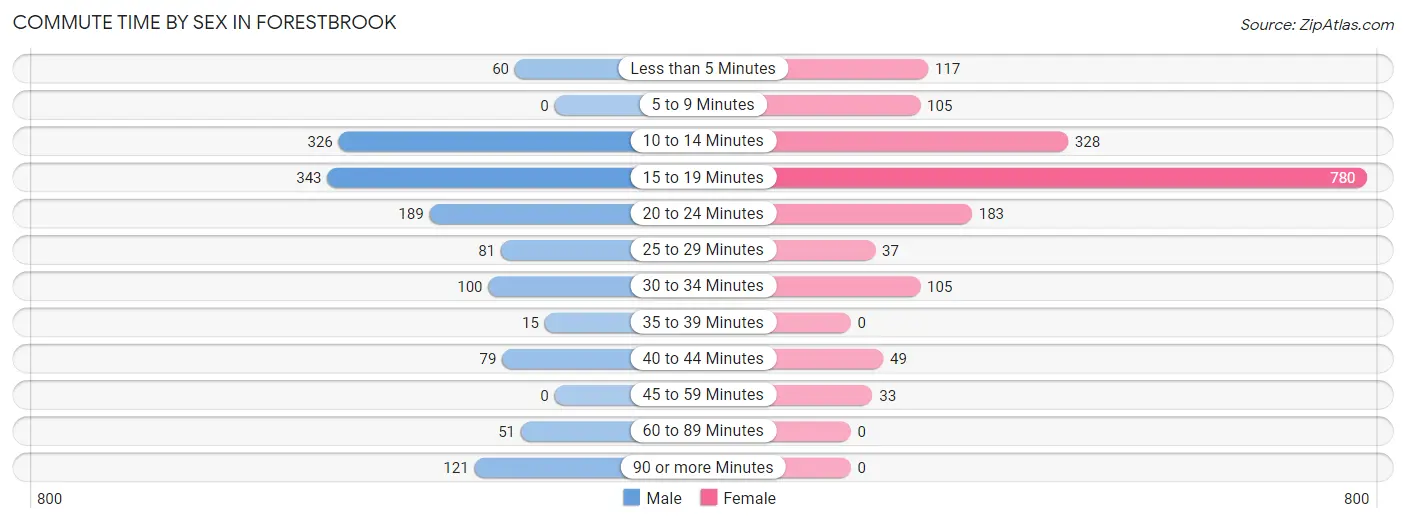
| Commute Time | Male | Female |
| Less than 5 Minutes | 60 (4.4%) | 117 (6.7%) |
| 5 to 9 Minutes | 0 (0.0%) | 105 (6.0%) |
| 10 to 14 Minutes | 326 (23.9%) | 328 (18.9%) |
| 15 to 19 Minutes | 343 (25.1%) | 780 (44.9%) |
| 20 to 24 Minutes | 189 (13.9%) | 183 (10.5%) |
| 25 to 29 Minutes | 81 (5.9%) | 37 (2.1%) |
| 30 to 34 Minutes | 100 (7.3%) | 105 (6.0%) |
| 35 to 39 Minutes | 15 (1.1%) | 0 (0.0%) |
| 40 to 44 Minutes | 79 (5.8%) | 49 (2.8%) |
| 45 to 59 Minutes | 0 (0.0%) | 33 (1.9%) |
| 60 to 89 Minutes | 51 (3.7%) | 0 (0.0%) |
| 90 or more Minutes | 121 (8.9%) | 0 (0.0%) |
Time of Departure to Work by Sex in Forestbrook
The most frequent times of departure to work in Forestbrook are 8:30 AM to 8:59 AM (217, 15.9%) for males and 7:30 AM to 7:59 AM (369, 21.2%) for females.
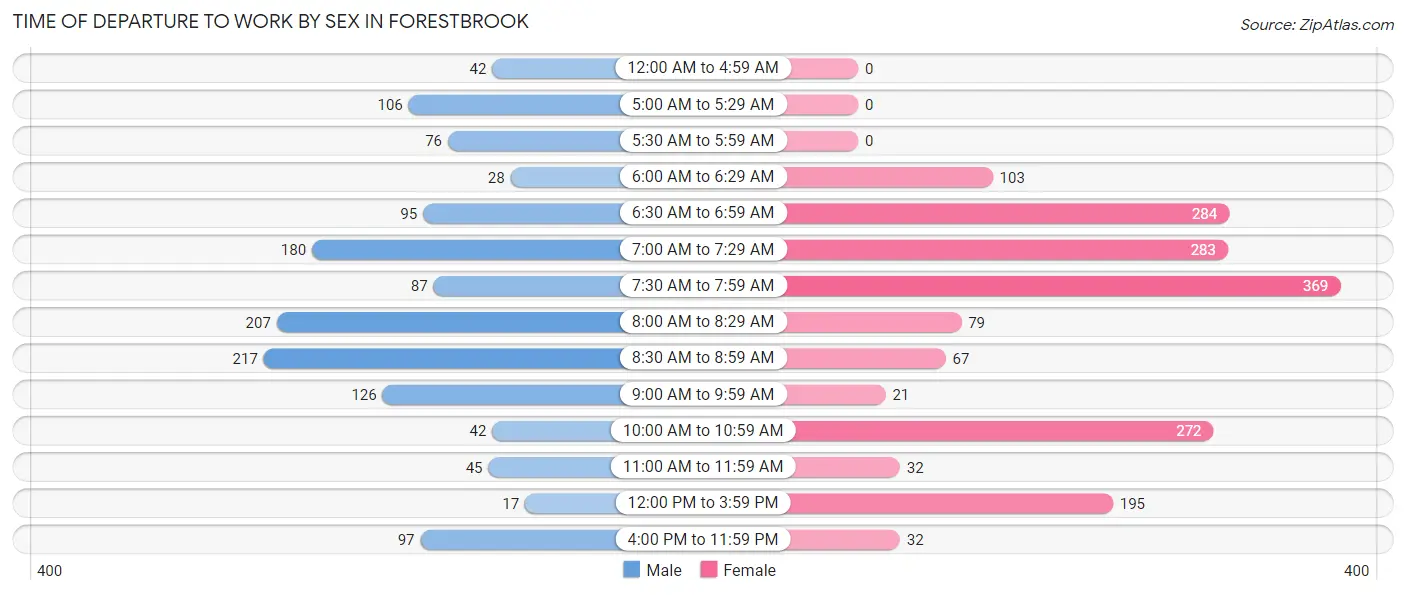
| Time of Departure | Male | Female |
| 12:00 AM to 4:59 AM | 42 (3.1%) | 0 (0.0%) |
| 5:00 AM to 5:29 AM | 106 (7.8%) | 0 (0.0%) |
| 5:30 AM to 5:59 AM | 76 (5.6%) | 0 (0.0%) |
| 6:00 AM to 6:29 AM | 28 (2.1%) | 103 (5.9%) |
| 6:30 AM to 6:59 AM | 95 (7.0%) | 284 (16.4%) |
| 7:00 AM to 7:29 AM | 180 (13.2%) | 283 (16.3%) |
| 7:30 AM to 7:59 AM | 87 (6.4%) | 369 (21.2%) |
| 8:00 AM to 8:29 AM | 207 (15.2%) | 79 (4.5%) |
| 8:30 AM to 8:59 AM | 217 (15.9%) | 67 (3.9%) |
| 9:00 AM to 9:59 AM | 126 (9.2%) | 21 (1.2%) |
| 10:00 AM to 10:59 AM | 42 (3.1%) | 272 (15.7%) |
| 11:00 AM to 11:59 AM | 45 (3.3%) | 32 (1.8%) |
| 12:00 PM to 3:59 PM | 17 (1.3%) | 195 (11.2%) |
| 4:00 PM to 11:59 PM | 97 (7.1%) | 32 (1.8%) |
| Total | 1,365 (100.0%) | 1,737 (100.0%) |
Housing Occupancy in Forestbrook
Occupancy by Ownership in Forestbrook
Of the total 2,754 dwellings in Forestbrook, owner-occupied units account for 2,388 (86.7%), while renter-occupied units make up 366 (13.3%).
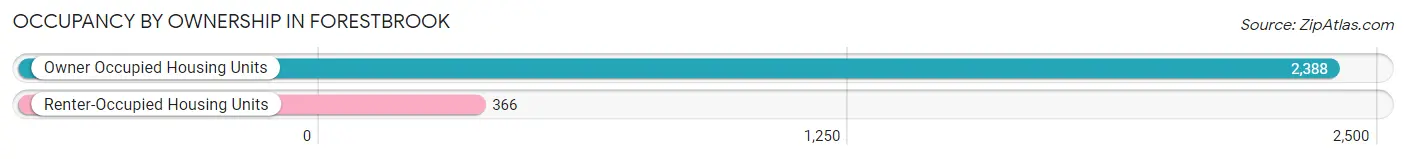
| Occupancy | # Housing Units | % Housing Units |
| Owner Occupied Housing Units | 2,388 | 86.7% |
| Renter-Occupied Housing Units | 366 | 13.3% |
| Total Occupied Housing Units | 2,754 | 100.0% |
Occupancy by Household Size in Forestbrook
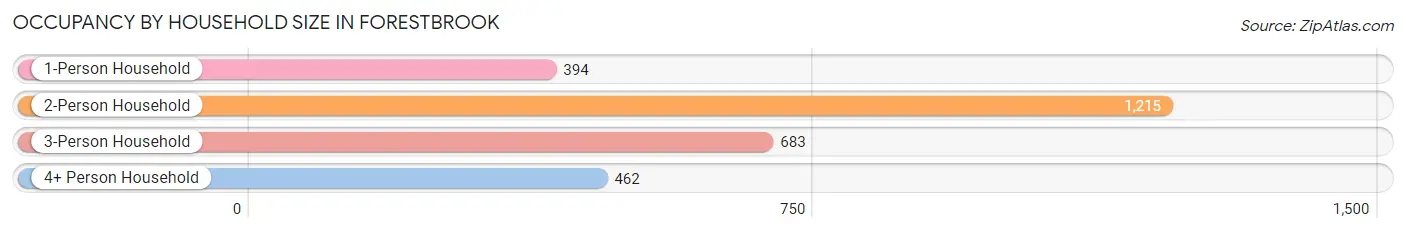
| Household Size | # Housing Units | % Housing Units |
| 1-Person Household | 394 | 14.3% |
| 2-Person Household | 1,215 | 44.1% |
| 3-Person Household | 683 | 24.8% |
| 4+ Person Household | 462 | 16.8% |
| Total Housing Units | 2,754 | 100.0% |
Occupancy by Ownership by Household Size in Forestbrook
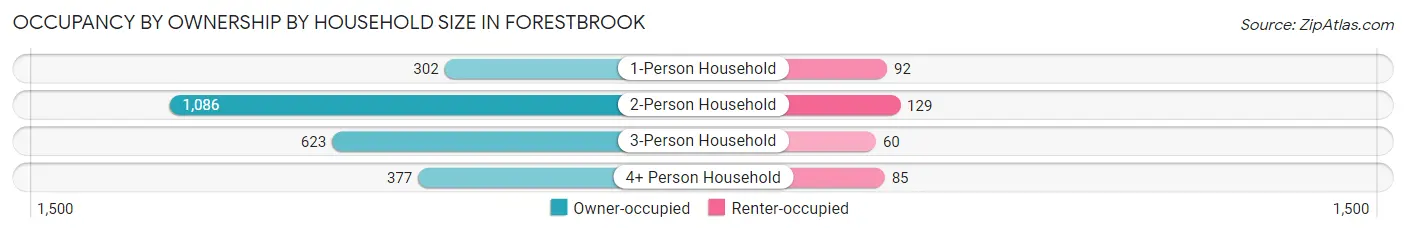
| Household Size | Owner-occupied | Renter-occupied |
| 1-Person Household | 302 (76.6%) | 92 (23.4%) |
| 2-Person Household | 1,086 (89.4%) | 129 (10.6%) |
| 3-Person Household | 623 (91.2%) | 60 (8.8%) |
| 4+ Person Household | 377 (81.6%) | 85 (18.4%) |
| Total Housing Units | 2,388 (86.7%) | 366 (13.3%) |
Occupancy by Educational Attainment in Forestbrook
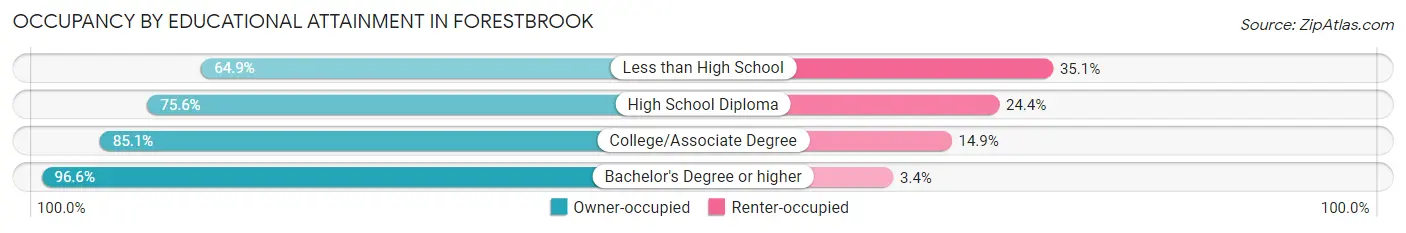
| Household Size | Owner-occupied | Renter-occupied |
| Less than High School | 113 (64.9%) | 61 (35.1%) |
| High School Diploma | 295 (75.6%) | 95 (24.4%) |
| College/Associate Degree | 1,002 (85.1%) | 176 (14.9%) |
| Bachelor's Degree or higher | 978 (96.6%) | 34 (3.4%) |
Occupancy by Age of Householder in Forestbrook
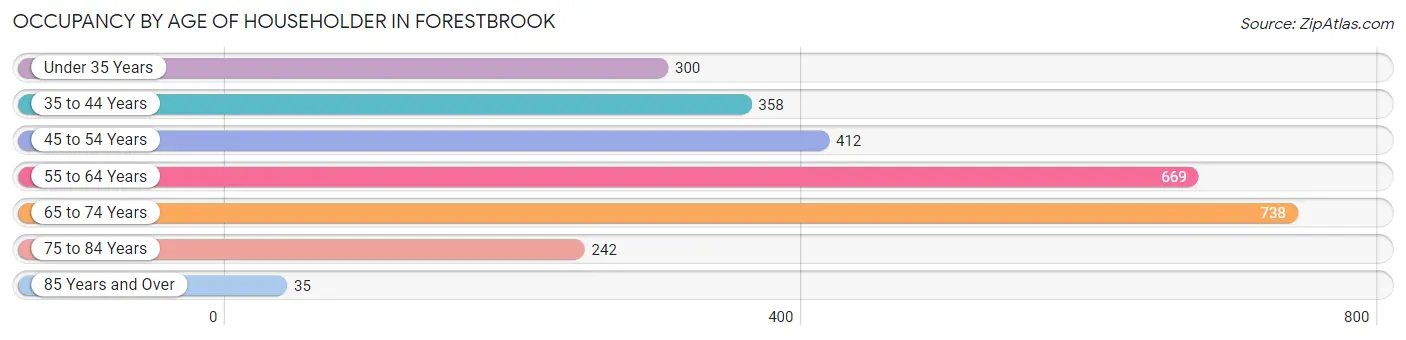
| Age Bracket | # Households | % Households |
| Under 35 Years | 300 | 10.9% |
| 35 to 44 Years | 358 | 13.0% |
| 45 to 54 Years | 412 | 15.0% |
| 55 to 64 Years | 669 | 24.3% |
| 65 to 74 Years | 738 | 26.8% |
| 75 to 84 Years | 242 | 8.8% |
| 85 Years and Over | 35 | 1.3% |
| Total | 2,754 | 100.0% |
Housing Finances in Forestbrook
Median Income by Occupancy in Forestbrook
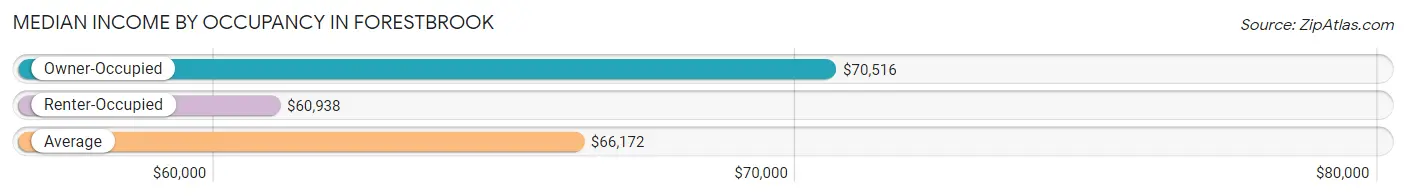
| Occupancy Type | # Households | Median Income |
| Owner-Occupied | 2,388 (86.7%) | $70,516 |
| Renter-Occupied | 366 (13.3%) | $60,938 |
| Average | 2,754 (100.0%) | $66,172 |
Occupancy by Householder Income Bracket in Forestbrook
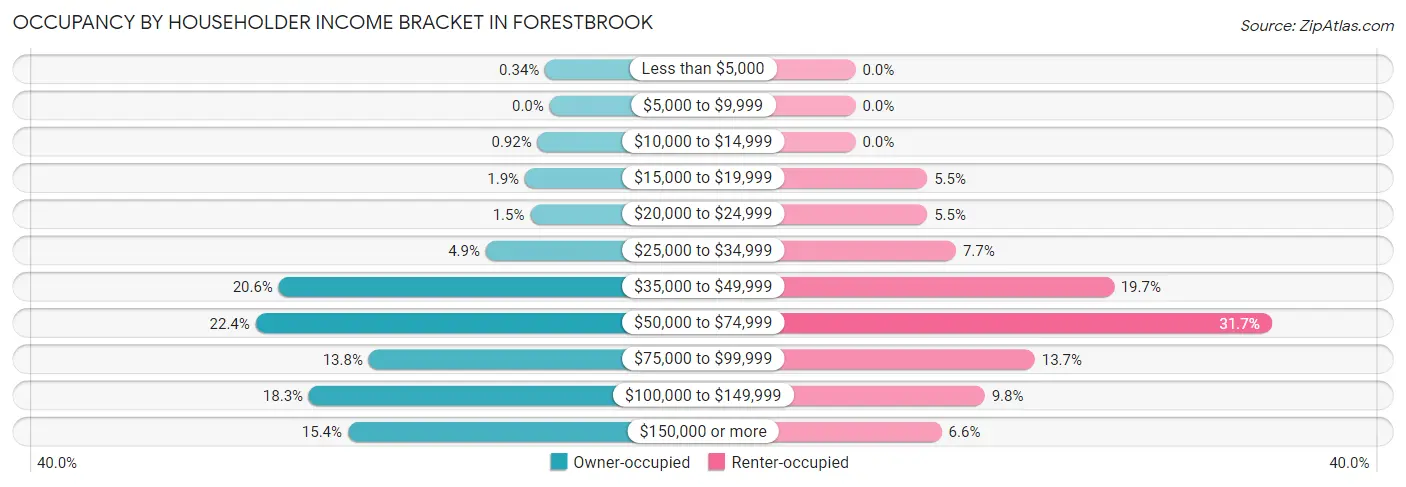
| Income Bracket | Owner-occupied | Renter-occupied |
| Less than $5,000 | 8 (0.3%) | 0 (0.0%) |
| $5,000 to $9,999 | 0 (0.0%) | 0 (0.0%) |
| $10,000 to $14,999 | 22 (0.9%) | 0 (0.0%) |
| $15,000 to $19,999 | 45 (1.9%) | 20 (5.5%) |
| $20,000 to $24,999 | 35 (1.5%) | 20 (5.5%) |
| $25,000 to $34,999 | 116 (4.9%) | 28 (7.6%) |
| $35,000 to $49,999 | 493 (20.6%) | 72 (19.7%) |
| $50,000 to $74,999 | 535 (22.4%) | 116 (31.7%) |
| $75,000 to $99,999 | 329 (13.8%) | 50 (13.7%) |
| $100,000 to $149,999 | 438 (18.3%) | 36 (9.8%) |
| $150,000 or more | 367 (15.4%) | 24 (6.6%) |
| Total | 2,388 (100.0%) | 366 (100.0%) |
Monthly Housing Cost Tiers in Forestbrook
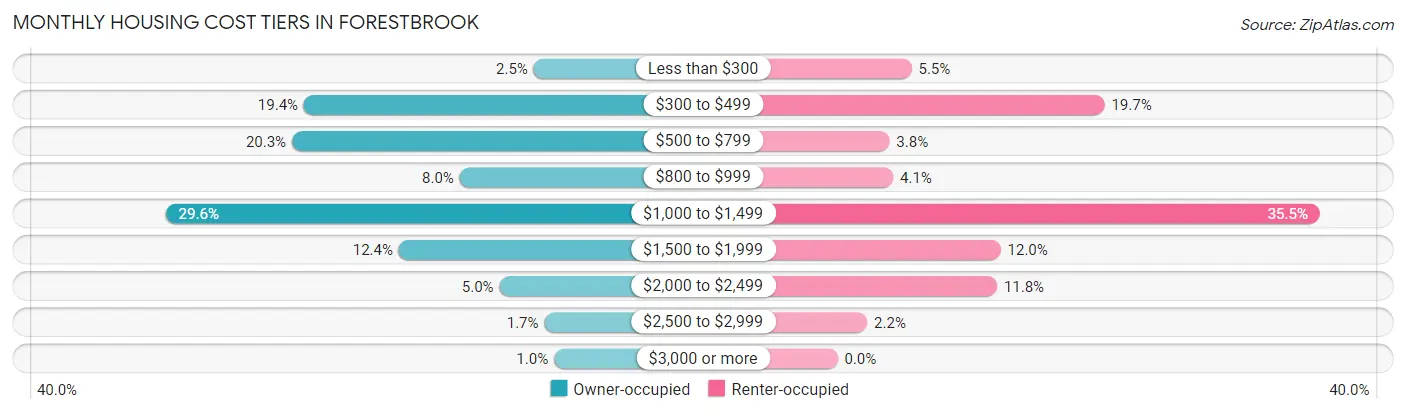
| Monthly Cost | Owner-occupied | Renter-occupied |
| Less than $300 | 60 (2.5%) | 20 (5.5%) |
| $300 to $499 | 464 (19.4%) | 72 (19.7%) |
| $500 to $799 | 485 (20.3%) | 14 (3.8%) |
| $800 to $999 | 190 (8.0%) | 15 (4.1%) |
| $1,000 to $1,499 | 707 (29.6%) | 130 (35.5%) |
| $1,500 to $1,999 | 297 (12.4%) | 44 (12.0%) |
| $2,000 to $2,499 | 120 (5.0%) | 43 (11.7%) |
| $2,500 to $2,999 | 41 (1.7%) | 8 (2.2%) |
| $3,000 or more | 24 (1.0%) | 0 (0.0%) |
| Total | 2,388 (100.0%) | 366 (100.0%) |
Physical Housing Characteristics in Forestbrook
Housing Structures in Forestbrook
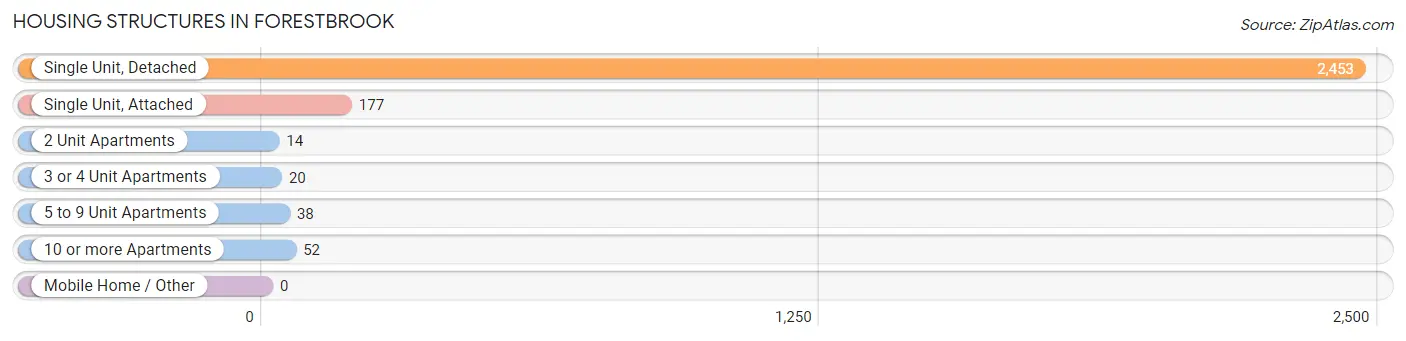
| Structure Type | # Housing Units | % Housing Units |
| Single Unit, Detached | 2,453 | 89.1% |
| Single Unit, Attached | 177 | 6.4% |
| 2 Unit Apartments | 14 | 0.5% |
| 3 or 4 Unit Apartments | 20 | 0.7% |
| 5 to 9 Unit Apartments | 38 | 1.4% |
| 10 or more Apartments | 52 | 1.9% |
| Mobile Home / Other | 0 | 0.0% |
| Total | 2,754 | 100.0% |
Housing Structures by Occupancy in Forestbrook
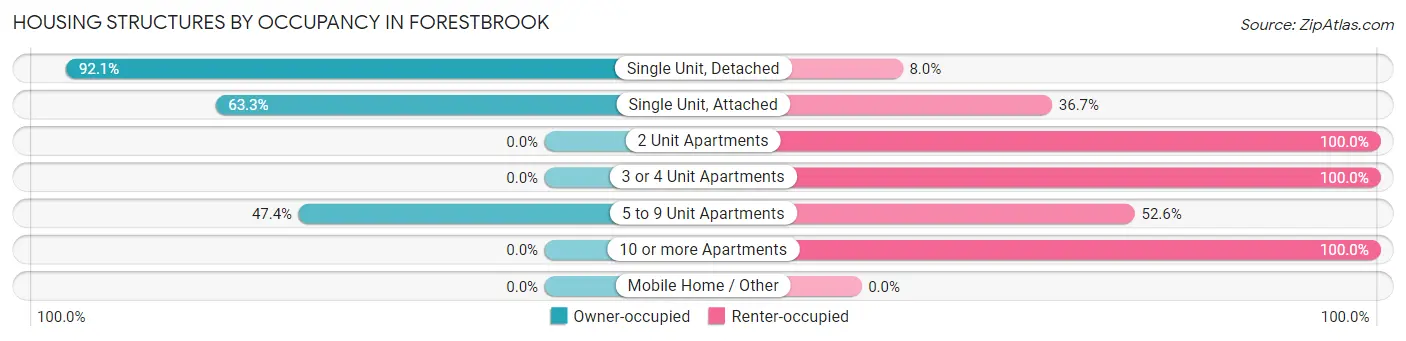
| Structure Type | Owner-occupied | Renter-occupied |
| Single Unit, Detached | 2,258 (92.0%) | 195 (8.0%) |
| Single Unit, Attached | 112 (63.3%) | 65 (36.7%) |
| 2 Unit Apartments | 0 (0.0%) | 14 (100.0%) |
| 3 or 4 Unit Apartments | 0 (0.0%) | 20 (100.0%) |
| 5 to 9 Unit Apartments | 18 (47.4%) | 20 (52.6%) |
| 10 or more Apartments | 0 (0.0%) | 52 (100.0%) |
| Mobile Home / Other | 0 (0.0%) | 0 (0.0%) |
| Total | 2,388 (86.7%) | 366 (13.3%) |
Housing Structures by Number of Rooms in Forestbrook
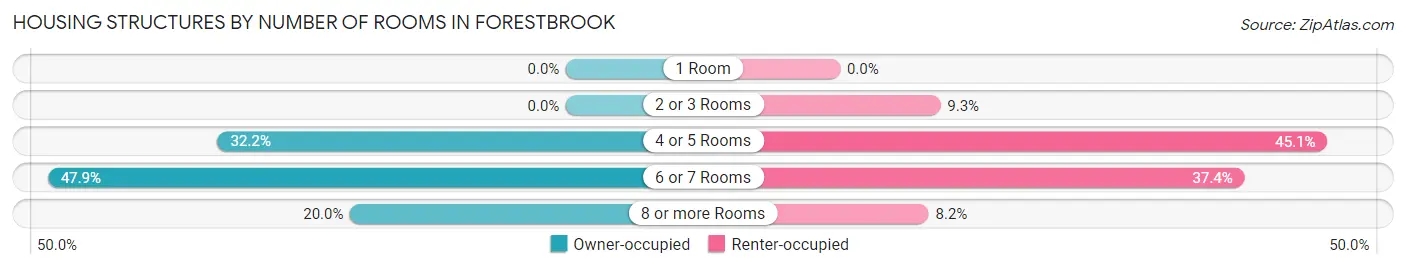
| Number of Rooms | Owner-occupied | Renter-occupied |
| 1 Room | 0 (0.0%) | 0 (0.0%) |
| 2 or 3 Rooms | 0 (0.0%) | 34 (9.3%) |
| 4 or 5 Rooms | 768 (32.2%) | 165 (45.1%) |
| 6 or 7 Rooms | 1,143 (47.9%) | 137 (37.4%) |
| 8 or more Rooms | 477 (20.0%) | 30 (8.2%) |
| Total | 2,388 (100.0%) | 366 (100.0%) |
Housing Structure by Heating Type in Forestbrook
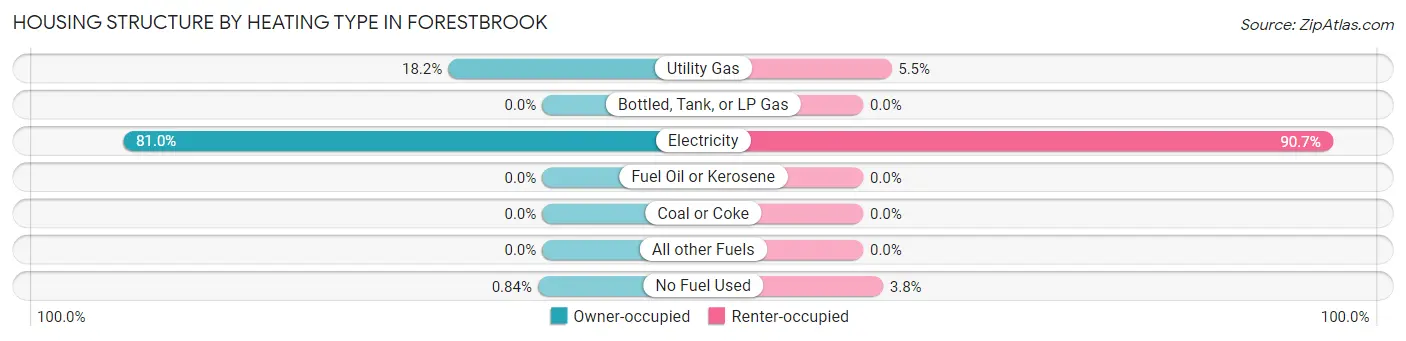
| Heating Type | Owner-occupied | Renter-occupied |
| Utility Gas | 434 (18.2%) | 20 (5.5%) |
| Bottled, Tank, or LP Gas | 0 (0.0%) | 0 (0.0%) |
| Electricity | 1,934 (81.0%) | 332 (90.7%) |
| Fuel Oil or Kerosene | 0 (0.0%) | 0 (0.0%) |
| Coal or Coke | 0 (0.0%) | 0 (0.0%) |
| All other Fuels | 0 (0.0%) | 0 (0.0%) |
| No Fuel Used | 20 (0.8%) | 14 (3.8%) |
| Total | 2,388 (100.0%) | 366 (100.0%) |
Household Vehicle Usage in Forestbrook
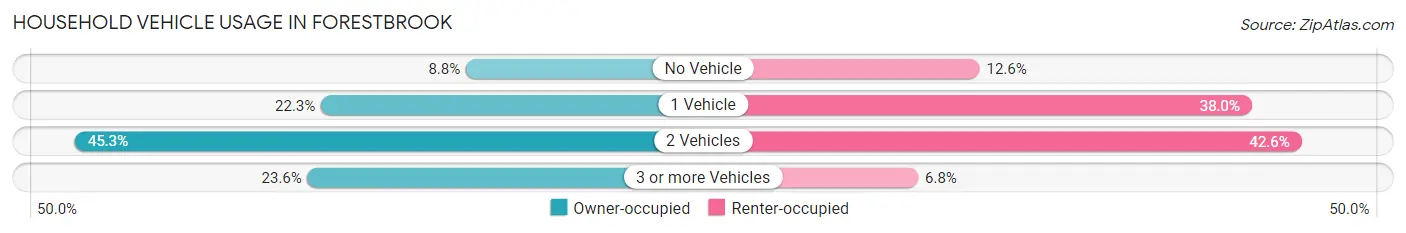
| Vehicles per Household | Owner-occupied | Renter-occupied |
| No Vehicle | 210 (8.8%) | 46 (12.6%) |
| 1 Vehicle | 533 (22.3%) | 139 (38.0%) |
| 2 Vehicles | 1,082 (45.3%) | 156 (42.6%) |
| 3 or more Vehicles | 563 (23.6%) | 25 (6.8%) |
| Total | 2,388 (100.0%) | 366 (100.0%) |
Real Estate & Mortgages in Forestbrook
Real Estate and Mortgage Overview in Forestbrook
| Characteristic | Without Mortgage | With Mortgage |
| Housing Units | 848 | 1,540 |
| Median Property Value | $258,200 | $274,400 |
| Median Household Income | $60,816 | $298 |
| Monthly Housing Costs | $458 | $24 |
| Real Estate Taxes | $793 | $0 |
Property Value by Mortgage Status in Forestbrook
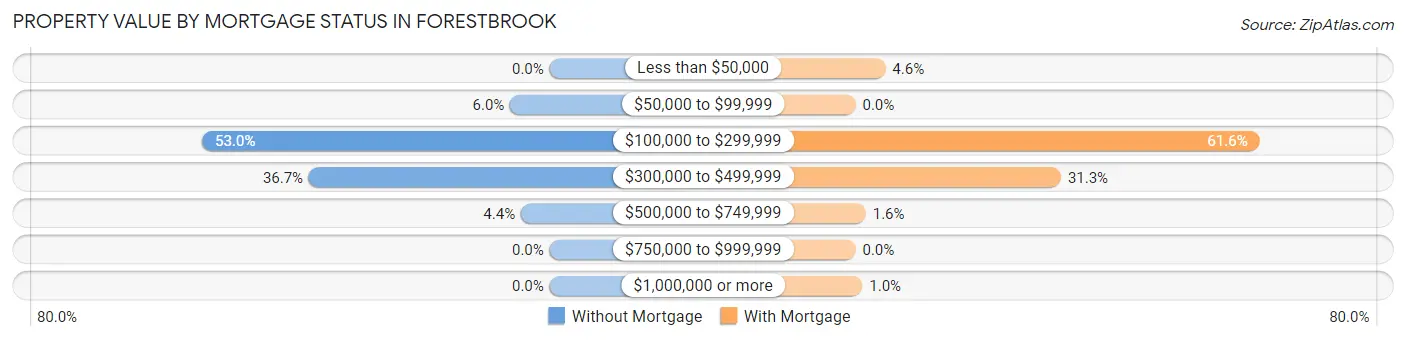
| Property Value | Without Mortgage | With Mortgage |
| Less than $50,000 | 0 (0.0%) | 70 (4.5%) |
| $50,000 to $99,999 | 51 (6.0%) | 0 (0.0%) |
| $100,000 to $299,999 | 449 (52.9%) | 948 (61.6%) |
| $300,000 to $499,999 | 311 (36.7%) | 482 (31.3%) |
| $500,000 to $749,999 | 37 (4.4%) | 24 (1.6%) |
| $750,000 to $999,999 | 0 (0.0%) | 0 (0.0%) |
| $1,000,000 or more | 0 (0.0%) | 16 (1.0%) |
| Total | 848 (100.0%) | 1,540 (100.0%) |
Household Income by Mortgage Status in Forestbrook
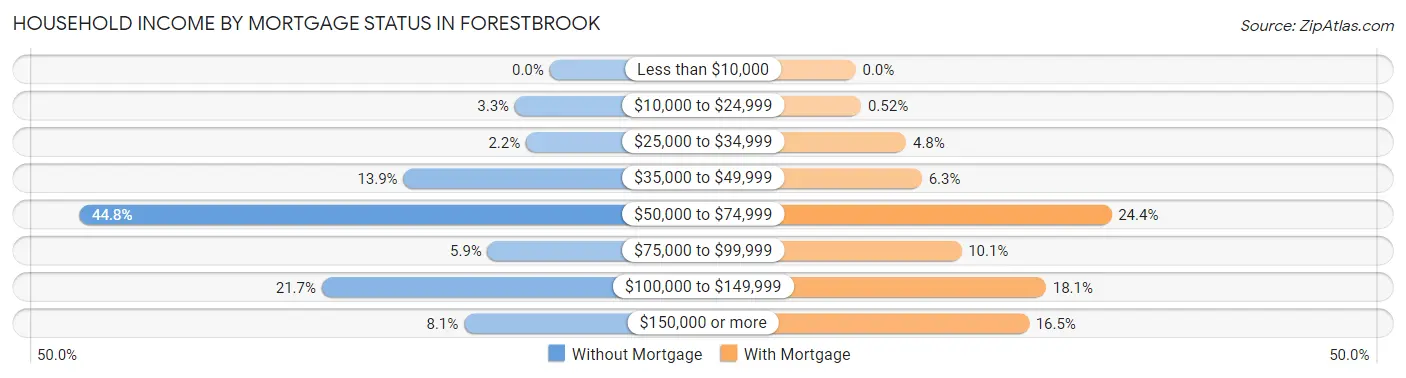
| Household Income | Without Mortgage | With Mortgage |
| Less than $10,000 | 0 (0.0%) | 0 (0.0%) |
| $10,000 to $24,999 | 28 (3.3%) | 8 (0.5%) |
| $25,000 to $34,999 | 19 (2.2%) | 74 (4.8%) |
| $35,000 to $49,999 | 118 (13.9%) | 97 (6.3%) |
| $50,000 to $74,999 | 380 (44.8%) | 375 (24.3%) |
| $75,000 to $99,999 | 50 (5.9%) | 155 (10.1%) |
| $100,000 to $149,999 | 184 (21.7%) | 279 (18.1%) |
| $150,000 or more | 69 (8.1%) | 254 (16.5%) |
| Total | 848 (100.0%) | 1,540 (100.0%) |
Property Value to Household Income Ratio in Forestbrook
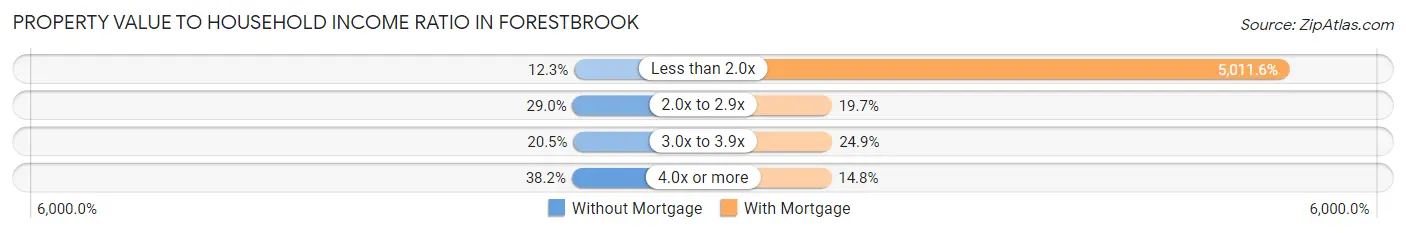
| Value-to-Income Ratio | Without Mortgage | With Mortgage |
| Less than 2.0x | 104 (12.3%) | 77,179 (5,011.6%) |
| 2.0x to 2.9x | 246 (29.0%) | 304 (19.7%) |
| 3.0x to 3.9x | 174 (20.5%) | 384 (24.9%) |
| 4.0x or more | 324 (38.2%) | 228 (14.8%) |
| Total | 848 (100.0%) | 1,540 (100.0%) |
Real Estate Taxes by Mortgage Status in Forestbrook
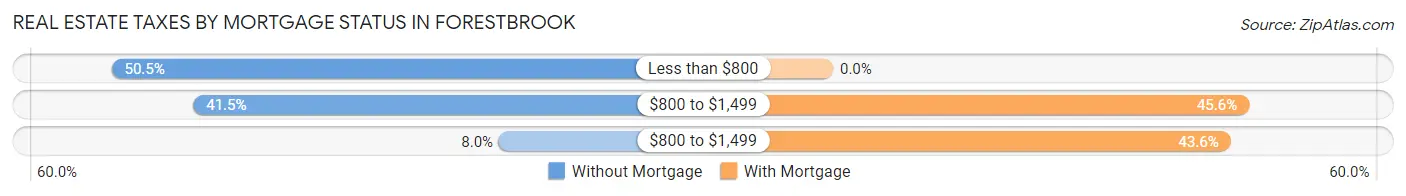
| Property Taxes | Without Mortgage | With Mortgage |
| Less than $800 | 428 (50.5%) | 0 (0.0%) |
| $800 to $1,499 | 352 (41.5%) | 702 (45.6%) |
| $800 to $1,499 | 68 (8.0%) | 671 (43.6%) |
| Total | 848 (100.0%) | 1,540 (100.0%) |
Health & Disability in Forestbrook
Health Insurance Coverage by Age in Forestbrook
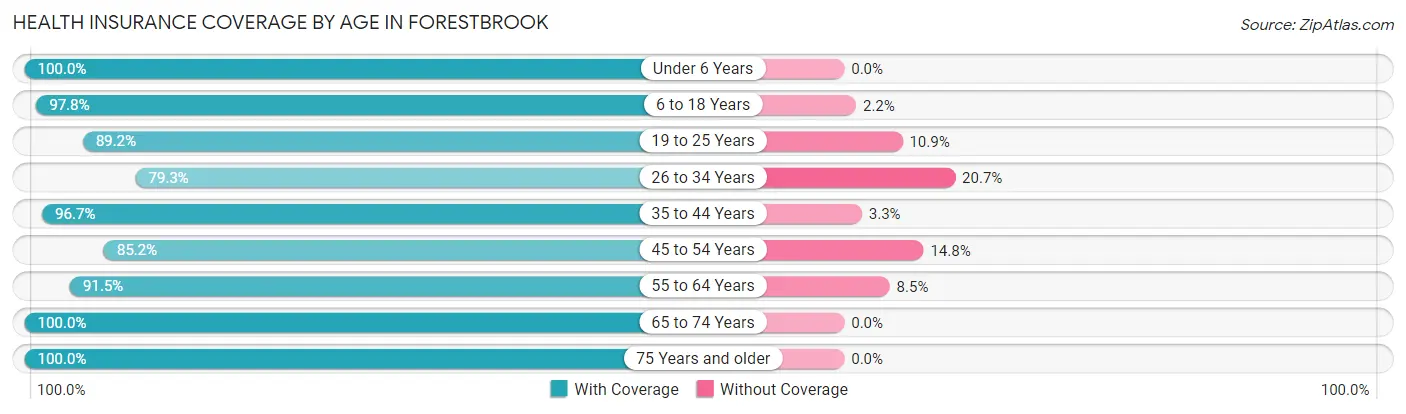
| Age Bracket | With Coverage | Without Coverage |
| Under 6 Years | 303 (100.0%) | 0 (0.0%) |
| 6 to 18 Years | 981 (97.8%) | 22 (2.2%) |
| 19 to 25 Years | 419 (89.1%) | 51 (10.8%) |
| 26 to 34 Years | 737 (79.3%) | 192 (20.7%) |
| 35 to 44 Years | 530 (96.7%) | 18 (3.3%) |
| 45 to 54 Years | 681 (85.2%) | 118 (14.8%) |
| 55 to 64 Years | 1,277 (91.5%) | 118 (8.5%) |
| 65 to 74 Years | 1,165 (100.0%) | 0 (0.0%) |
| 75 Years and older | 778 (100.0%) | 0 (0.0%) |
| Total | 6,871 (93.0%) | 519 (7.0%) |
Health Insurance Coverage by Citizenship Status in Forestbrook
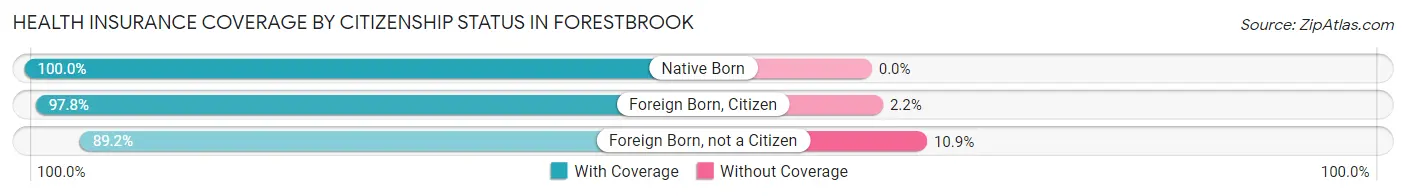
| Citizenship Status | With Coverage | Without Coverage |
| Native Born | 303 (100.0%) | 0 (0.0%) |
| Foreign Born, Citizen | 981 (97.8%) | 22 (2.2%) |
| Foreign Born, not a Citizen | 419 (89.1%) | 51 (10.8%) |
Health Insurance Coverage by Household Income in Forestbrook
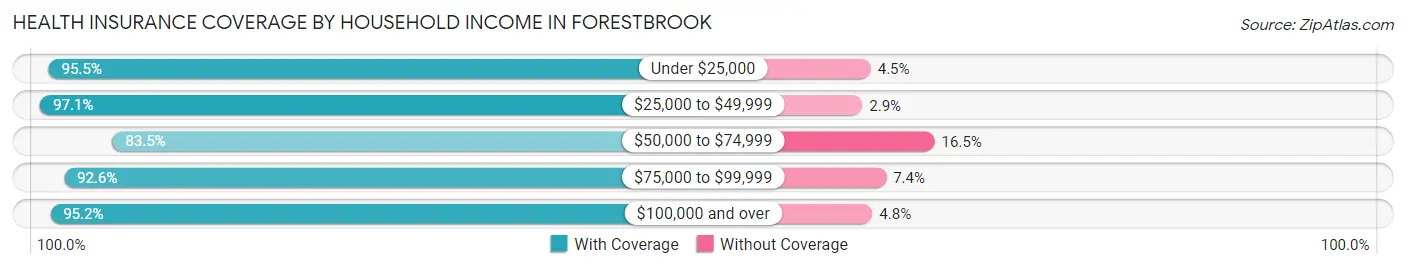
| Household Income | With Coverage | Without Coverage |
| Under $25,000 | 212 (95.5%) | 10 (4.5%) |
| $25,000 to $49,999 | 1,535 (97.1%) | 46 (2.9%) |
| $50,000 to $74,999 | 1,188 (83.5%) | 234 (16.5%) |
| $75,000 to $99,999 | 1,052 (92.6%) | 84 (7.4%) |
| $100,000 and over | 2,877 (95.2%) | 145 (4.8%) |
Public vs Private Health Insurance Coverage by Age in Forestbrook
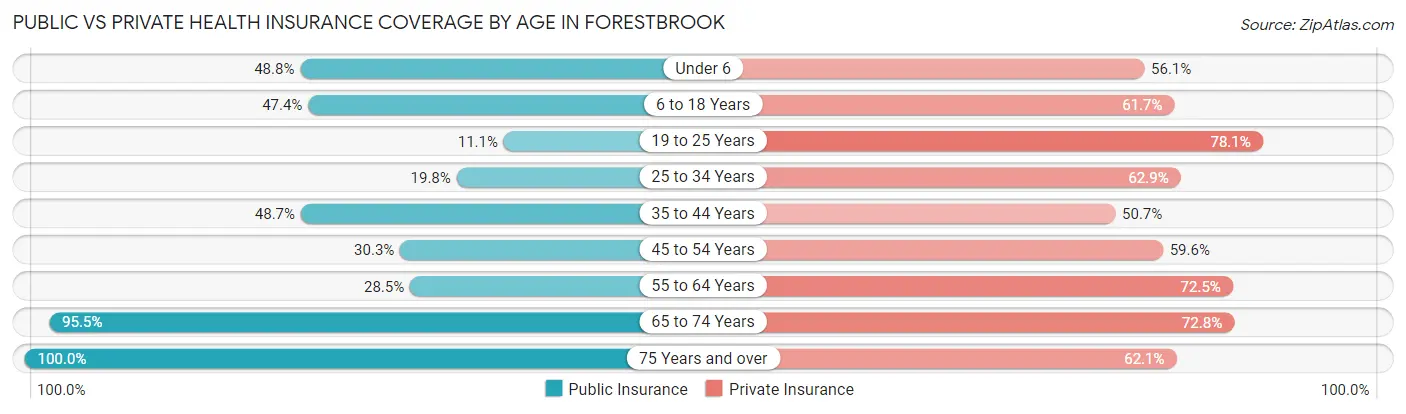
| Age Bracket | Public Insurance | Private Insurance |
| Under 6 | 148 (48.8%) | 170 (56.1%) |
| 6 to 18 Years | 475 (47.4%) | 619 (61.7%) |
| 19 to 25 Years | 52 (11.1%) | 367 (78.1%) |
| 25 to 34 Years | 184 (19.8%) | 584 (62.9%) |
| 35 to 44 Years | 267 (48.7%) | 278 (50.7%) |
| 45 to 54 Years | 242 (30.3%) | 476 (59.6%) |
| 55 to 64 Years | 397 (28.5%) | 1,012 (72.5%) |
| 65 to 74 Years | 1,112 (95.5%) | 848 (72.8%) |
| 75 Years and over | 778 (100.0%) | 483 (62.1%) |
| Total | 3,655 (49.5%) | 4,837 (65.4%) |
Disability Status by Sex by Age in Forestbrook
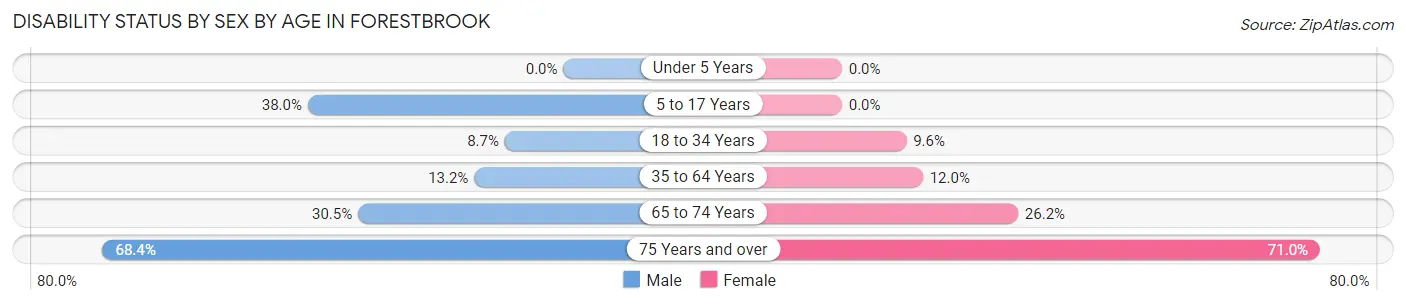
| Age Bracket | Male | Female |
| Under 5 Years | 0 (0.0%) | 0 (0.0%) |
| 5 to 17 Years | 244 (38.0%) | 0 (0.0%) |
| 18 to 34 Years | 75 (8.7%) | 67 (9.6%) |
| 35 to 64 Years | 145 (13.2%) | 198 (12.0%) |
| 65 to 74 Years | 150 (30.5%) | 176 (26.2%) |
| 75 Years and over | 221 (68.4%) | 323 (71.0%) |
Disability Class by Sex by Age in Forestbrook
Disability Class: Hearing Difficulty
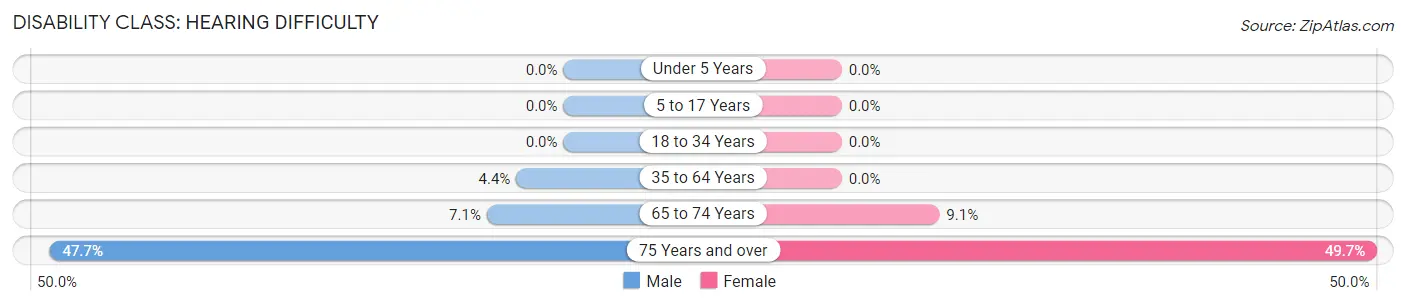
| Age Bracket | Male | Female |
| Under 5 Years | 0 (0.0%) | 0 (0.0%) |
| 5 to 17 Years | 0 (0.0%) | 0 (0.0%) |
| 18 to 34 Years | 0 (0.0%) | 0 (0.0%) |
| 35 to 64 Years | 48 (4.4%) | 0 (0.0%) |
| 65 to 74 Years | 35 (7.1%) | 61 (9.1%) |
| 75 Years and over | 154 (47.7%) | 226 (49.7%) |
Disability Class: Vision Difficulty
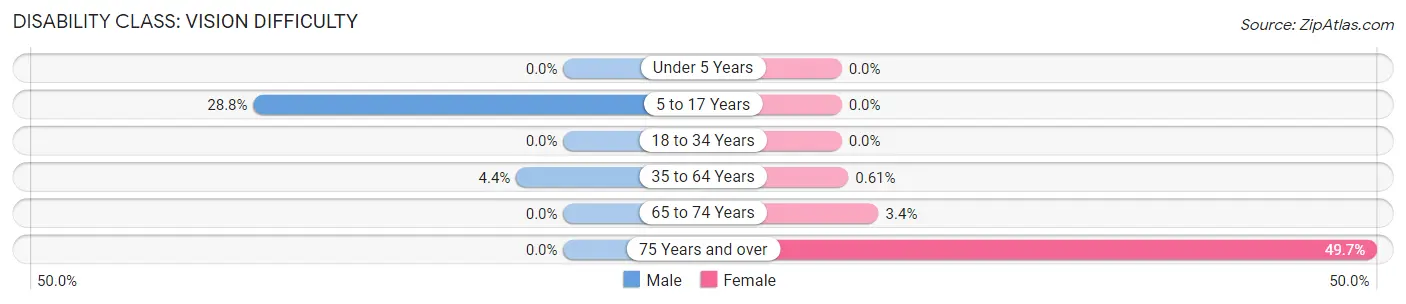
| Age Bracket | Male | Female |
| Under 5 Years | 0 (0.0%) | 0 (0.0%) |
| 5 to 17 Years | 185 (28.8%) | 0 (0.0%) |
| 18 to 34 Years | 0 (0.0%) | 0 (0.0%) |
| 35 to 64 Years | 48 (4.4%) | 10 (0.6%) |
| 65 to 74 Years | 0 (0.0%) | 23 (3.4%) |
| 75 Years and over | 0 (0.0%) | 226 (49.7%) |
Disability Class: Cognitive Difficulty
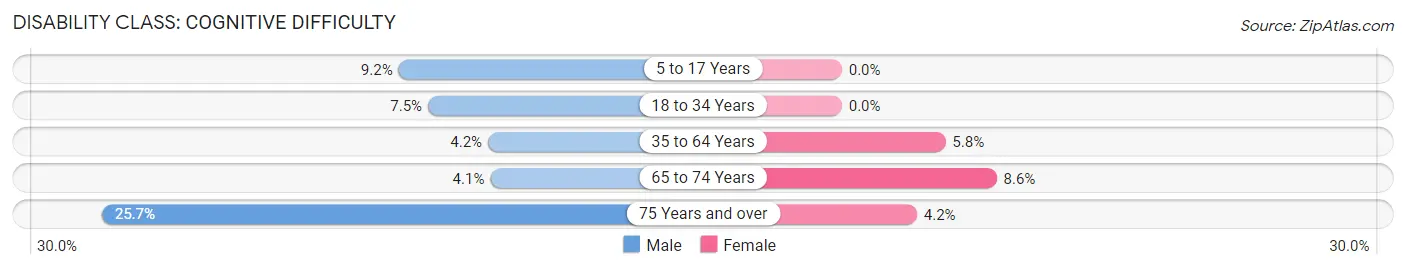
| Age Bracket | Male | Female |
| 5 to 17 Years | 59 (9.2%) | 0 (0.0%) |
| 18 to 34 Years | 65 (7.5%) | 0 (0.0%) |
| 35 to 64 Years | 46 (4.2%) | 95 (5.8%) |
| 65 to 74 Years | 20 (4.1%) | 58 (8.6%) |
| 75 Years and over | 83 (25.7%) | 19 (4.2%) |
Disability Class: Ambulatory Difficulty
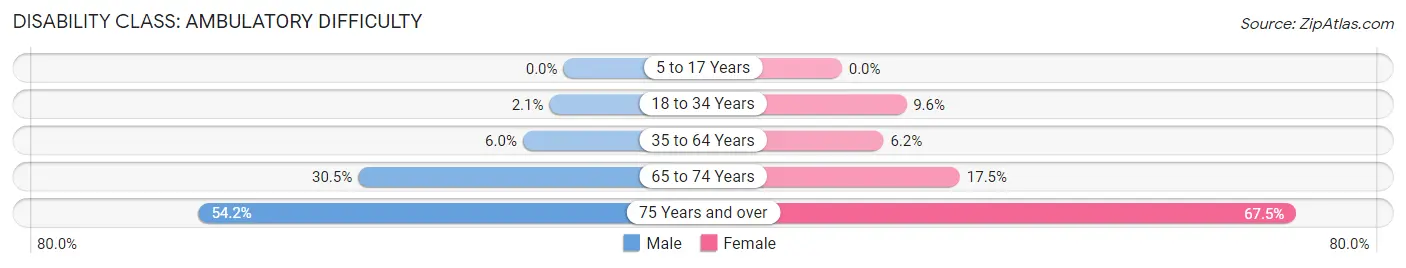
| Age Bracket | Male | Female |
| 5 to 17 Years | 0 (0.0%) | 0 (0.0%) |
| 18 to 34 Years | 18 (2.1%) | 67 (9.6%) |
| 35 to 64 Years | 66 (6.0%) | 102 (6.2%) |
| 65 to 74 Years | 150 (30.5%) | 118 (17.5%) |
| 75 Years and over | 175 (54.2%) | 307 (67.5%) |
Disability Class: Self-Care Difficulty
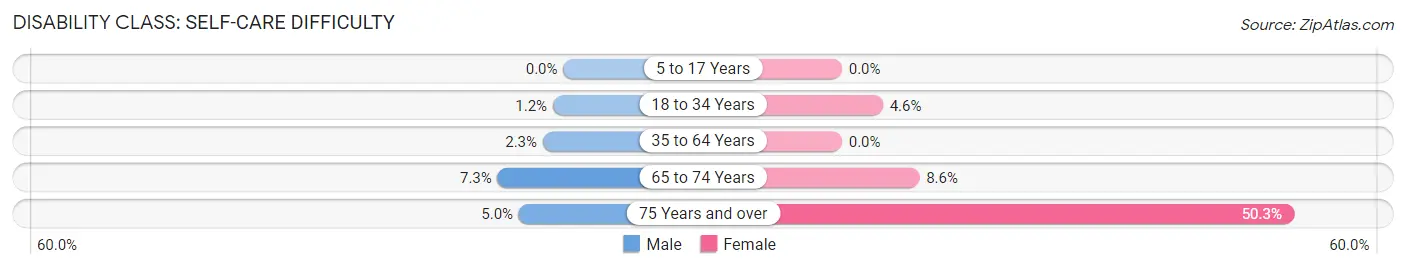
| Age Bracket | Male | Female |
| 5 to 17 Years | 0 (0.0%) | 0 (0.0%) |
| 18 to 34 Years | 10 (1.2%) | 32 (4.6%) |
| 35 to 64 Years | 25 (2.3%) | 0 (0.0%) |
| 65 to 74 Years | 36 (7.3%) | 58 (8.6%) |
| 75 Years and over | 16 (5.0%) | 229 (50.3%) |
Technology Access in Forestbrook
Computing Device Access in Forestbrook
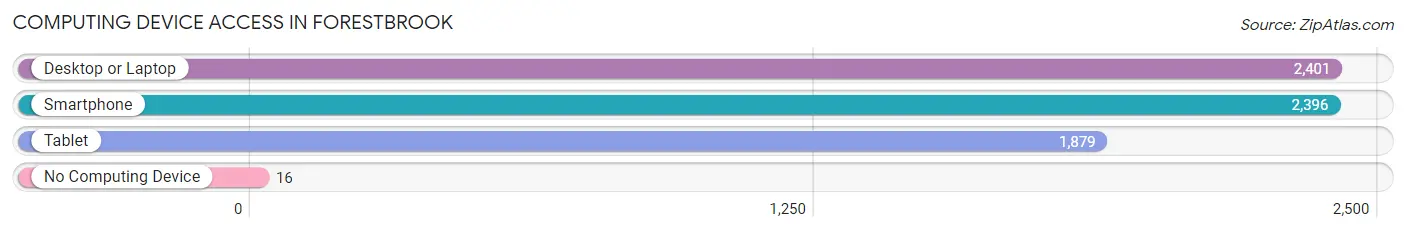
| Device Type | # Households | % Households |
| Desktop or Laptop | 2,401 | 87.2% |
| Smartphone | 2,396 | 87.0% |
| Tablet | 1,879 | 68.2% |
| No Computing Device | 16 | 0.6% |
| Total | 2,754 | 100.0% |
Internet Access in Forestbrook
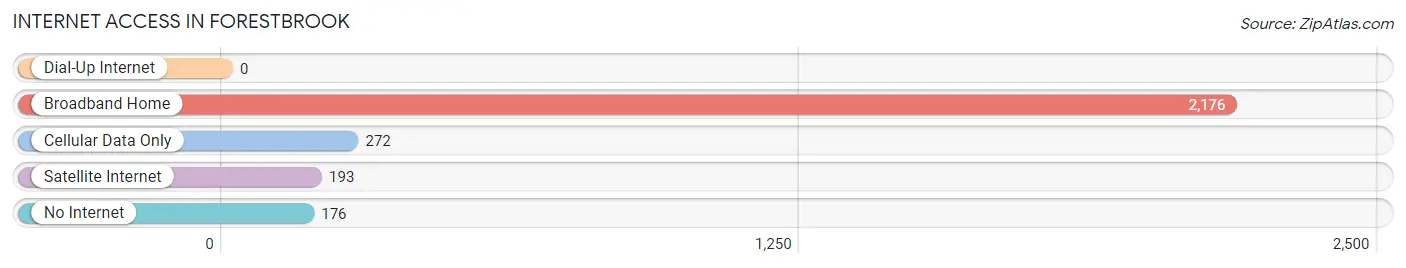
| Internet Type | # Households | % Households |
| Dial-Up Internet | 0 | 0.0% |
| Broadband Home | 2,176 | 79.0% |
| Cellular Data Only | 272 | 9.9% |
| Satellite Internet | 193 | 7.0% |
| No Internet | 176 | 6.4% |
| Total | 2,754 | 100.0% |
Forestbrook Summary
History
Forestbrook is a small unincorporated community located in Horry County, South Carolina. It is situated between Myrtle Beach and Conway, and is part of the Myrtle Beach metropolitan area. The community was first settled in the late 1800s by a group of settlers from North Carolina. The settlers were attracted to the area due to its abundance of timber and its proximity to the Waccamaw River. The community was originally known as “Forest Brook”, but the name was eventually shortened to “Forestbrook”.
The community was largely agricultural in its early years, with the main crops being cotton, corn, and tobacco. The community also had a sawmill and a gristmill, which were important to the local economy. In the early 1900s, the community began to grow as more people moved to the area. The population of Forestbrook peaked in the 1950s, when it had a population of around 500 people.
In the late 1950s, the community began to decline as people moved away in search of better economic opportunities. By the 1970s, the population had dropped to around 200 people. In the 1980s, the community began to experience a resurgence as people moved back to the area. Today, the population of Forestbrook is around 400 people.
Geography
Forestbrook is located in Horry County, South Carolina. It is situated between Myrtle Beach and Conway, and is part of the Myrtle Beach metropolitan area. The community is located on the western side of the Waccamaw River, and is bordered by the towns of Aynor and Galivants Ferry. The community is located in a rural area, and is surrounded by forests and farmland.
The climate in Forestbrook is humid subtropical, with hot, humid summers and mild winters. The average annual temperature is around 70 degrees Fahrenheit, and the average annual precipitation is around 50 inches.
Economy
The economy of Forestbrook is largely based on agriculture and tourism. The main crops grown in the area are cotton, corn, and tobacco. The community also has a sawmill and a gristmill, which are important to the local economy.
In recent years, the community has become a popular tourist destination. The area is home to several golf courses, and is also a popular destination for fishing and boating. The community also has several restaurants and shops, which attract visitors from the surrounding areas.
Demographics
As of the 2010 census, the population of Forestbrook was around 400 people. The racial makeup of the community was 97.5% White, 0.8% African American, 0.3% Native American, 0.3% Asian, and 0.8% from other races. The median household income was $37,500, and the median home value was $125,000. The median age was 44 years.
Common Questions
What is the Total Population of Forestbrook?
Total Population of Forestbrook is 7,414.
What is the Total Male Population of Forestbrook?
Total Male Population of Forestbrook is 3,621.
What is the Total Female Population of Forestbrook?
Total Female Population of Forestbrook is 3,793.
What is the Ratio of Males per 100 Females in Forestbrook?
There are 95.47 Males per 100 Females in Forestbrook.
What is the Ratio of Females per 100 Males in Forestbrook?
There are 104.75 Females per 100 Males in Forestbrook.
What is the Median Population Age in Forestbrook?
Median Population Age in Forestbrook is 47.9 Years.
What is the Average Family Size in Forestbrook
Average Family Size in Forestbrook is 2.8 People.
What is the Average Household Size in Forestbrook
Average Household Size in Forestbrook is 2.7 People.
What is Per Capita Income in Forestbrook?
Per Capita income in Forestbrook is $38,397.
What is the Median Family Income in Forestbrook?
Median Family Income in Forestbrook is $71,835.
What is the Median Household income in Forestbrook?
Median Household Income in Forestbrook is $66,172.
What is Income or Wage Gap in Forestbrook?
Income or Wage Gap in Forestbrook is 12.0%.
Women in Forestbrook earn 88.0 cents for every dollar earned by a man.
What is Inequality or Gini Index in Forestbrook?
Inequality or Gini Index in Forestbrook is 0.40.
How Large is the Labor Force in Forestbrook?
There are 3,748 People in the Labor Forcein in Forestbrook.
What is the Percentage of People in the Labor Force in Forestbrook?
56.4% of People are in the Labor Force in Forestbrook.
What is the Unemployment Rate in Forestbrook?
Unemployment Rate in Forestbrook is 5.9%.