Cities with the Highest Poverty Level Among Married Couples in South Carolina
RELATED REPORTS & OPTIONS
Highest Poverty | Married Couple
South Carolina
Compare Cities
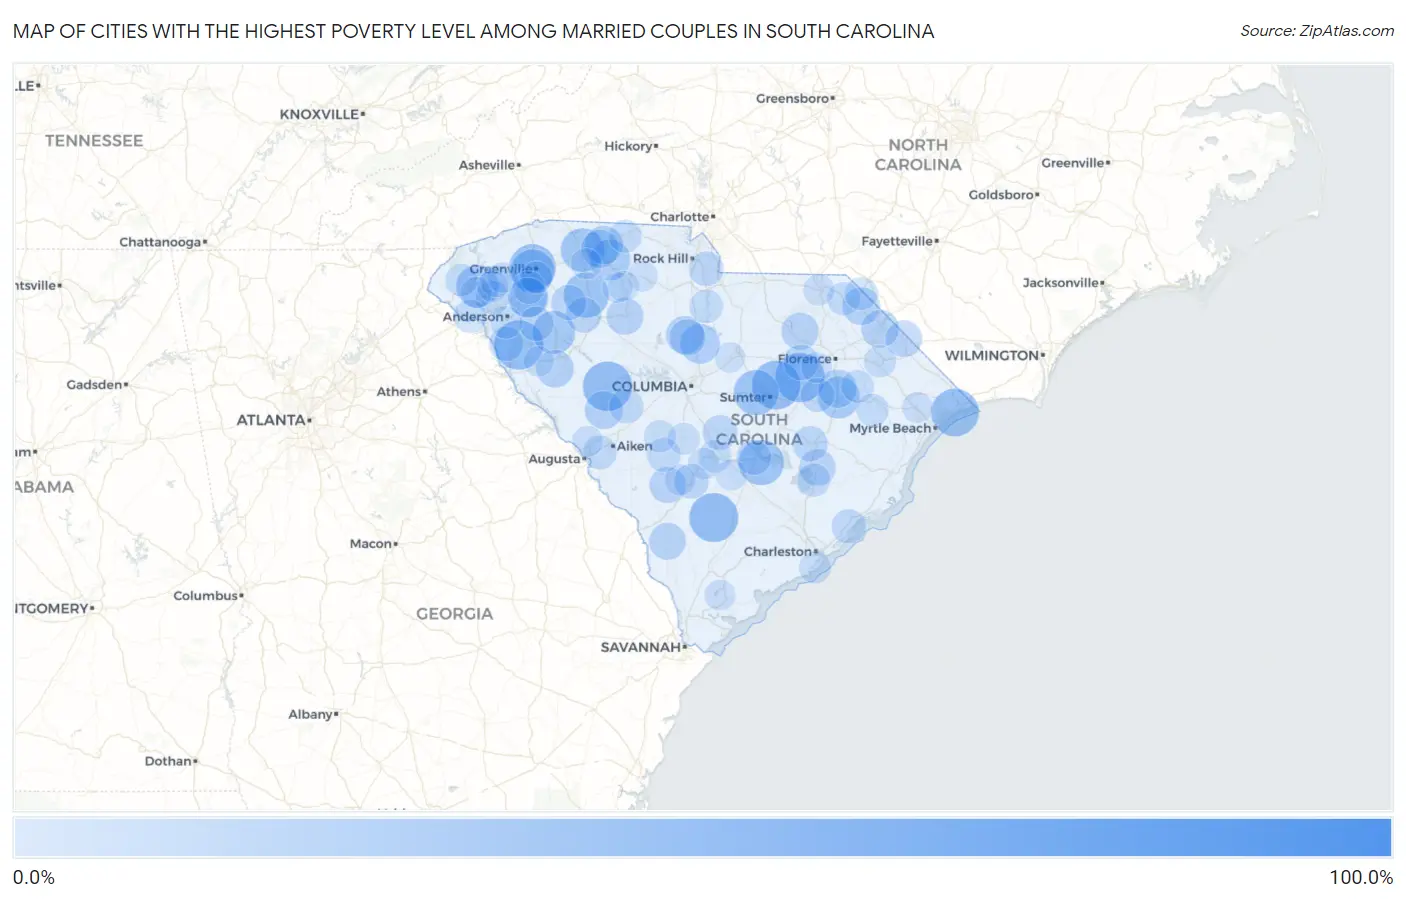
Map of Cities with the Highest Poverty Level Among Married Couples in South Carolina
0.0%
100.0%
Cities with the Highest Poverty Level Among Married Couples in South Carolina
| City | Married Couples Poverty | vs State | vs National | |
| 1. | Olympia | 100.0% | 4.6%(+95.4)#1 | 4.5%(+95.5)#2 |
| 2. | Rains | 100.0% | 4.6%(+95.4)#2 | 4.5%(+95.5)#58 |
| 3. | Zion | 59.5% | 4.6%(+54.9)#3 | 4.5%(+55.0)#277 |
| 4. | Little Rock | 55.0% | 4.6%(+50.4)#4 | 4.5%(+50.5)#321 |
| 5. | Antreville | 48.1% | 4.6%(+43.5)#5 | 4.5%(+43.7)#424 |
| 6. | Saluda | 48.0% | 4.6%(+43.4)#6 | 4.5%(+43.6)#426 |
| 7. | Lynchburg | 48.0% | 4.6%(+43.4)#7 | 4.5%(+43.5)#427 |
| 8. | Williams | 47.2% | 4.6%(+42.6)#8 | 4.5%(+42.8)#439 |
| 9. | Oswego | 46.7% | 4.6%(+42.1)#9 | 4.5%(+42.2)#452 |
| 10. | Atlantic Beach | 44.8% | 4.6%(+40.2)#10 | 4.5%(+40.4)#495 |
| 11. | Dale | 42.9% | 4.6%(+38.3)#11 | 4.5%(+38.4)#535 |
| 12. | City View | 42.7% | 4.6%(+38.0)#12 | 4.5%(+38.2)#552 |
| 13. | Daviston | 42.1% | 4.6%(+37.5)#13 | 4.5%(+37.6)#569 |
| 14. | Enoree | 40.0% | 4.6%(+35.4)#14 | 4.5%(+35.5)#614 |
| 15. | Vance | 40.0% | 4.6%(+35.4)#15 | 4.5%(+35.5)#627 |
| 16. | Cherryvale | 39.6% | 4.6%(+35.0)#16 | 4.5%(+35.1)#650 |
| 17. | Dunbar | 38.1% | 4.6%(+33.5)#17 | 4.5%(+33.6)#703 |
| 18. | Judson | 37.2% | 4.6%(+32.6)#18 | 4.5%(+32.7)#731 |
| 19. | Southern Shops | 36.5% | 4.6%(+31.9)#19 | 4.5%(+32.0)#754 |
| 20. | Ware Shoals | 35.1% | 4.6%(+30.5)#20 | 4.5%(+30.7)#799 |
| 21. | Newry | 34.6% | 4.6%(+30.0)#21 | 4.5%(+30.2)#818 |
| 22. | Scranton | 33.3% | 4.6%(+28.7)#22 | 4.5%(+28.9)#868 |
| 23. | Central Pacolet | 31.2% | 4.6%(+26.6)#23 | 4.5%(+26.8)#966 |
| 24. | Pelzer | 28.9% | 4.6%(+24.3)#24 | 4.5%(+24.4)#1,090 |
| 25. | Ridgeway | 28.8% | 4.6%(+24.2)#25 | 4.5%(+24.4)#1,094 |
| 26. | West Pelzer | 28.0% | 4.6%(+23.4)#26 | 4.5%(+23.5)#1,174 |
| 27. | Centenary | 26.6% | 4.6%(+22.0)#27 | 4.5%(+22.1)#1,278 |
| 28. | Unity | 26.6% | 4.6%(+22.0)#28 | 4.5%(+22.1)#1,282 |
| 29. | Cowpens | 26.4% | 4.6%(+21.7)#29 | 4.5%(+21.9)#1,298 |
| 30. | Coward | 26.3% | 4.6%(+21.7)#30 | 4.5%(+21.8)#1,312 |
| 31. | Winnsboro | 25.7% | 4.6%(+21.1)#31 | 4.5%(+21.2)#1,359 |
| 32. | Converse | 25.6% | 4.6%(+21.0)#32 | 4.5%(+21.2)#1,367 |
| 33. | Johnston | 25.4% | 4.6%(+20.8)#33 | 4.5%(+20.9)#1,381 |
| 34. | Promised Land | 25.0% | 4.6%(+20.4)#34 | 4.5%(+20.5)#1,417 |
| 35. | Clio | 24.6% | 4.6%(+20.0)#35 | 4.5%(+20.2)#1,482 |
| 36. | Dillon | 24.6% | 4.6%(+20.0)#36 | 4.5%(+20.1)#1,486 |
| 37. | North Hartsville | 24.0% | 4.6%(+19.4)#37 | 4.5%(+19.5)#1,546 |
| 38. | Gifford | 23.5% | 4.6%(+18.9)#38 | 4.5%(+19.1)#1,605 |
| 39. | Whitmire | 23.5% | 4.6%(+18.9)#39 | 4.5%(+19.0)#1,615 |
| 40. | Lake View | 22.6% | 4.6%(+18.0)#40 | 4.5%(+18.2)#1,706 |
| 41. | St Stephen | 22.6% | 4.6%(+18.0)#41 | 4.5%(+18.1)#1,713 |
| 42. | North Santee | 22.5% | 4.6%(+17.9)#42 | 4.5%(+18.0)#1,725 |
| 43. | Winnsboro Mills | 22.1% | 4.6%(+17.5)#43 | 4.5%(+17.6)#1,792 |
| 44. | Hilda | 21.9% | 4.6%(+17.3)#44 | 4.5%(+17.5)#1,809 |
| 45. | Lamar | 20.8% | 4.6%(+16.1)#45 | 4.5%(+16.3)#1,935 |
| 46. | Greeleyville | 20.7% | 4.6%(+16.1)#46 | 4.5%(+16.2)#1,943 |
| 47. | Watts Mills | 20.5% | 4.6%(+15.9)#47 | 4.5%(+16.0)#1,987 |
| 48. | Gray Court | 20.2% | 4.6%(+15.6)#48 | 4.5%(+15.7)#2,016 |
| 49. | St Matthews | 19.4% | 4.6%(+14.8)#49 | 4.5%(+14.9)#2,150 |
| 50. | Santee | 19.3% | 4.6%(+14.7)#50 | 4.5%(+14.8)#2,166 |
| 51. | Bamberg | 19.2% | 4.6%(+14.6)#51 | 4.5%(+14.7)#2,182 |
| 52. | Catawba | 19.1% | 4.6%(+14.5)#52 | 4.5%(+14.6)#2,192 |
| 53. | Iva | 19.0% | 4.6%(+14.4)#53 | 4.5%(+14.5)#2,223 |
| 54. | Honea Path | 18.6% | 4.6%(+14.0)#54 | 4.5%(+14.2)#2,283 |
| 55. | Awendaw | 18.2% | 4.6%(+13.6)#55 | 4.5%(+13.7)#2,349 |
| 56. | Monetta | 18.2% | 4.6%(+13.6)#56 | 4.5%(+13.7)#2,365 |
| 57. | Olanta | 17.5% | 4.6%(+12.9)#57 | 4.5%(+13.1)#2,511 |
| 58. | Langley | 17.4% | 4.6%(+12.8)#58 | 4.5%(+12.9)#2,530 |
| 59. | Pendleton | 17.3% | 4.6%(+12.7)#59 | 4.5%(+12.9)#2,545 |
| 60. | Springfield | 17.3% | 4.6%(+12.7)#60 | 4.5%(+12.9)#2,550 |
| 61. | Great Falls | 17.0% | 4.6%(+12.4)#61 | 4.5%(+12.5)#2,625 |
| 62. | Bonneau | 16.2% | 4.6%(+11.6)#62 | 4.5%(+11.8)#2,785 |
| 63. | Bennettsville | 16.2% | 4.6%(+11.6)#63 | 4.5%(+11.7)#2,796 |
| 64. | East Camden | 16.2% | 4.6%(+11.6)#64 | 4.5%(+11.7)#2,799 |
| 65. | Fair Play | 16.1% | 4.6%(+11.5)#65 | 4.5%(+11.6)#2,813 |
| 66. | Mccoll | 16.0% | 4.6%(+11.4)#66 | 4.5%(+11.5)#2,850 |
| 67. | East Gaffney | 15.6% | 4.6%(+11.0)#67 | 4.5%(+11.1)#2,949 |
| 68. | Pamplico | 15.4% | 4.6%(+10.8)#68 | 4.5%(+10.9)#2,992 |
| 69. | Piedmont | 15.1% | 4.6%(+10.5)#69 | 4.5%(+10.6)#3,060 |
| 70. | Wilkinson Heights | 15.0% | 4.6%(+10.4)#70 | 4.5%(+10.5)#3,079 |
| 71. | Walhalla | 14.8% | 4.6%(+10.2)#71 | 4.5%(+10.3)#3,139 |
| 72. | Johnsonville | 14.6% | 4.6%(+9.97)#72 | 4.5%(+10.1)#3,212 |
| 73. | Homeland Park | 14.5% | 4.6%(+9.92)#73 | 4.5%(+10.1)#3,223 |
| 74. | Drayton | 14.4% | 4.6%(+9.83)#74 | 4.5%(+9.97)#3,252 |
| 75. | Marion | 14.0% | 4.6%(+9.40)#75 | 4.5%(+9.54)#3,397 |
| 76. | Gantt | 13.9% | 4.6%(+9.28)#76 | 4.5%(+9.43)#3,428 |
| 77. | North | 13.9% | 4.6%(+9.26)#77 | 4.5%(+9.41)#3,435 |
| 78. | Folly Beach | 13.9% | 4.6%(+9.25)#78 | 4.5%(+9.40)#3,439 |
| 79. | Perry | 13.8% | 4.6%(+9.19)#79 | 4.5%(+9.33)#3,460 |
| 80. | Norris | 13.1% | 4.6%(+8.52)#80 | 4.5%(+8.66)#3,693 |
| 81. | Buford | 13.1% | 4.6%(+8.51)#81 | 4.5%(+8.65)#3,699 |
| 82. | Cordova | 12.9% | 4.6%(+8.30)#82 | 4.5%(+8.44)#3,783 |
| 83. | Utica | 12.7% | 4.6%(+8.08)#83 | 4.5%(+8.23)#3,856 |
| 84. | Cheraw | 12.5% | 4.6%(+7.86)#84 | 4.5%(+8.00)#3,983 |
| 85. | Central | 12.4% | 4.6%(+7.81)#85 | 4.5%(+7.95)#3,994 |
| 86. | Bowman | 11.8% | 4.6%(+7.24)#86 | 4.5%(+7.38)#4,246 |
| 87. | Timmonsville | 11.8% | 4.6%(+7.21)#87 | 4.5%(+7.36)#4,253 |
| 88. | Denmark | 11.8% | 4.6%(+7.19)#88 | 4.5%(+7.34)#4,259 |
| 89. | Edmund | 11.7% | 4.6%(+7.04)#89 | 4.5%(+7.19)#4,336 |
| 90. | Roebuck | 11.6% | 4.6%(+7.03)#90 | 4.5%(+7.17)#4,342 |
| 91. | Laurel Bay | 11.4% | 4.6%(+6.80)#91 | 4.5%(+6.95)#4,446 |
| 92. | Murphys Estates | 11.3% | 4.6%(+6.74)#92 | 4.5%(+6.88)#4,470 |
| 93. | Conway | 11.3% | 4.6%(+6.74)#93 | 4.5%(+6.88)#4,472 |
| 94. | Union | 11.2% | 4.6%(+6.60)#94 | 4.5%(+6.74)#4,533 |
| 95. | Liberty | 10.9% | 4.6%(+6.34)#95 | 4.5%(+6.49)#4,679 |
| 96. | Lugoff | 10.9% | 4.6%(+6.27)#96 | 4.5%(+6.41)#4,723 |
| 97. | Lockhart | 10.8% | 4.6%(+6.24)#97 | 4.5%(+6.38)#4,740 |
| 98. | Buffalo | 10.8% | 4.6%(+6.15)#98 | 4.5%(+6.29)#4,779 |
| 99. | Abbeville | 10.3% | 4.6%(+5.70)#99 | 4.5%(+5.85)#5,067 |
| 100. | Elliott | 10.3% | 4.6%(+5.65)#100 | 4.5%(+5.79)#5,089 |
Common Questions
What are the Top 10 Cities with the Highest Poverty Level Among Married Couples in South Carolina?
Top 10 Cities with the Highest Poverty Level Among Married Couples in South Carolina are:
#1
48.1%
#2
48.0%
#3
48.0%
#4
47.2%
#5
46.7%
#6
44.8%
#7
42.7%
#8
40.0%
#9
40.0%
#10
39.6%
What city has the Highest Poverty Level Among Married Couples in South Carolina?
Antreville has the Highest Poverty Level Among Married Couples in South Carolina with 48.1%.
What is the Poverty Level Among Married Couples in the State of South Carolina?
Poverty Level Among Married Couples in South Carolina is 4.6%.
What is the Poverty Level Among Married Couples in the United States?
Poverty Level Among Married Couples in the United States is 4.5%.