Cities with the Highest Unemployment Rate Amomg Youth Under the Age of 25 in South Carolina
RELATED REPORTS & OPTIONS
Highest Unemployment | Youth < 25
South Carolina
Compare Cities
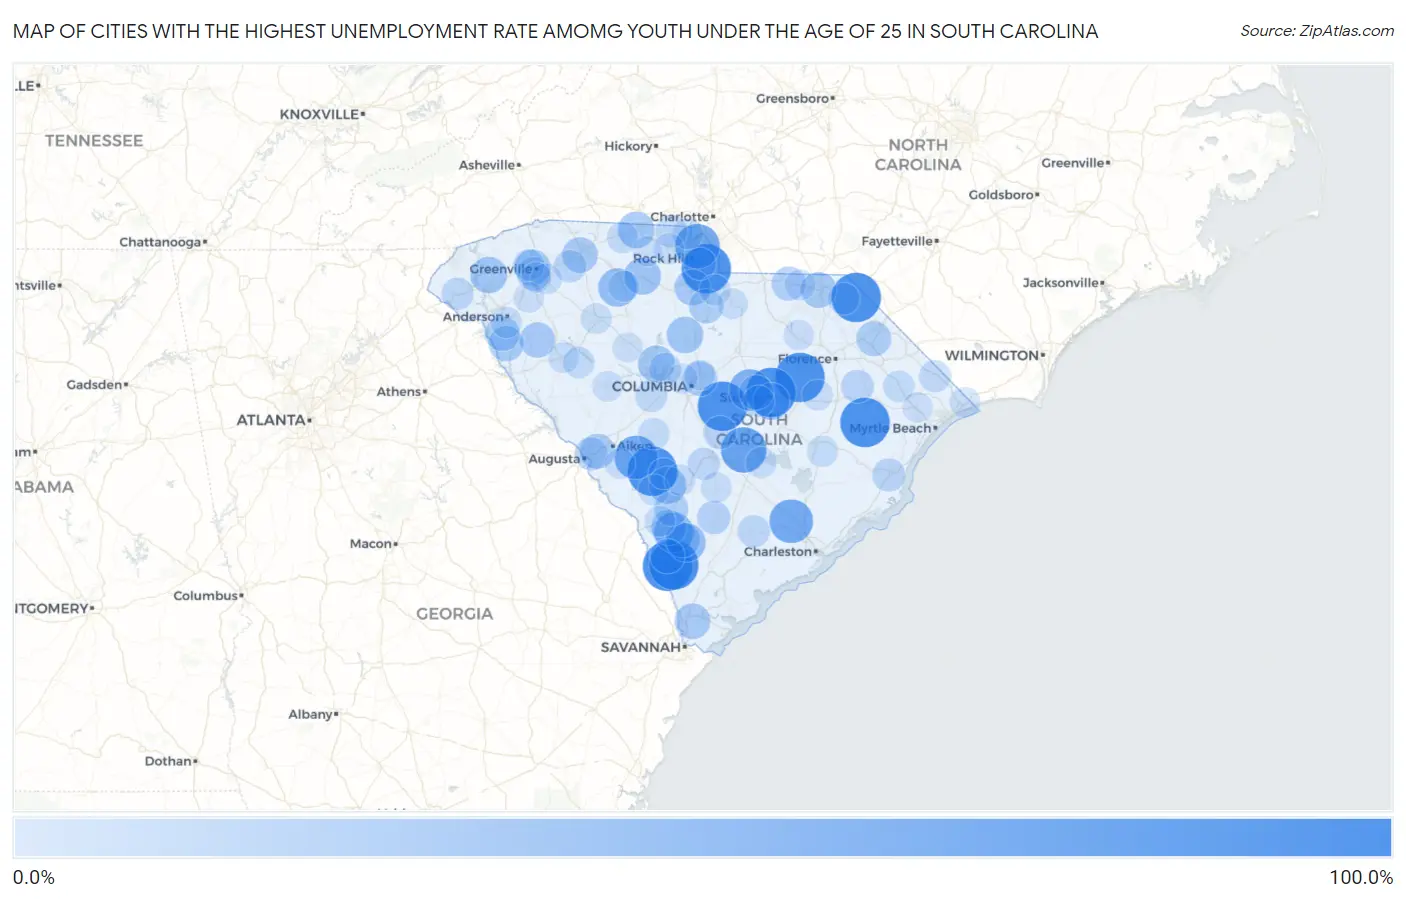
Map of Cities with the Highest Unemployment Rate Amomg Youth Under the Age of 25 in South Carolina
0.0%
100.0%
Cities with the Highest Unemployment Rate Amomg Youth Under the Age of 25 in South Carolina
| City | Youth Unemployment | vs State | vs National | |
| 1. | Gadsden | 100.0% | 11.2%(+88.8)#1 | 10.9%(+89.1)#50 |
| 2. | Chickasaw Point | 100.0% | 11.2%(+88.8)#2 | 10.9%(+89.1)#89 |
| 3. | Lynchburg | 100.0% | 11.2%(+88.8)#3 | 10.9%(+89.1)#164 |
| 4. | Stuckey | 100.0% | 11.2%(+88.8)#4 | 10.9%(+89.1)#167 |
| 5. | Mulberry | 100.0% | 11.2%(+88.8)#5 | 10.9%(+89.1)#194 |
| 6. | Scotia | 100.0% | 11.2%(+88.8)#6 | 10.9%(+89.1)#254 |
| 7. | Tatum | 100.0% | 11.2%(+88.8)#7 | 10.9%(+89.1)#293 |
| 8. | Catawba | 99.9% | 11.2%(+88.7)#8 | 10.9%(+89.0)#327 |
| 9. | Furman | 99.9% | 11.2%(+88.7)#9 | 10.9%(+89.0)#347 |
| 10. | Elko | 99.9% | 11.2%(+88.7)#10 | 10.9%(+89.0)#358 |
| 11. | Elloree | 82.4% | 11.2%(+71.2)#11 | 10.9%(+71.5)#444 |
| 12. | Cateechee | 82.1% | 11.2%(+70.9)#12 | 10.9%(+71.2)#446 |
| 13. | Riverview | 78.4% | 11.2%(+67.2)#13 | 10.9%(+67.5)#476 |
| 14. | Windsor | 73.9% | 11.2%(+62.7)#14 | 10.9%(+63.0)#530 |
| 15. | Lincolnville | 73.8% | 11.2%(+62.6)#15 | 10.9%(+62.9)#533 |
| 16. | Fairview Crossroads | 71.5% | 11.2%(+60.3)#16 | 10.9%(+60.6)#559 |
| 17. | Stateburg | 65.4% | 11.2%(+54.2)#17 | 10.9%(+54.5)#669 |
| 18. | Brunson | 57.6% | 11.2%(+46.4)#18 | 10.9%(+46.7)#834 |
| 19. | Varnville | 53.3% | 11.2%(+42.1)#19 | 10.9%(+42.4)#979 |
| 20. | Buffalo | 51.9% | 11.2%(+40.7)#20 | 10.9%(+41.0)#1,027 |
| 21. | Hilda | 46.1% | 11.2%(+34.9)#21 | 10.9%(+35.2)#1,307 |
| 22. | South Sumter | 45.1% | 11.2%(+33.9)#22 | 10.9%(+34.2)#1,355 |
| 23. | Lockhart | 45.1% | 11.2%(+33.9)#23 | 10.9%(+34.2)#1,359 |
| 24. | Chapin | 43.6% | 11.2%(+32.4)#24 | 10.9%(+32.7)#1,444 |
| 25. | Blacksburg | 43.3% | 11.2%(+32.1)#25 | 10.9%(+32.4)#1,468 |
| 26. | Winnsboro | 43.1% | 11.2%(+31.9)#26 | 10.9%(+32.2)#1,482 |
| 27. | Capitol View | 42.9% | 11.2%(+31.7)#27 | 10.9%(+32.0)#1,492 |
| 28. | Six Mile | 42.8% | 11.2%(+31.6)#28 | 10.9%(+31.9)#1,498 |
| 29. | City View | 41.3% | 11.2%(+30.1)#29 | 10.9%(+30.4)#1,620 |
| 30. | Richburg | 40.6% | 11.2%(+29.4)#30 | 10.9%(+29.7)#1,665 |
| 31. | Cheraw | 39.5% | 11.2%(+28.3)#31 | 10.9%(+28.6)#1,746 |
| 32. | Hardeeville | 39.4% | 11.2%(+28.2)#32 | 10.9%(+28.5)#1,752 |
| 33. | Fairforest | 39.4% | 11.2%(+28.2)#33 | 10.9%(+28.5)#1,754 |
| 34. | Due West | 38.3% | 11.2%(+27.1)#34 | 10.9%(+27.4)#1,830 |
| 35. | Fairfax | 37.7% | 11.2%(+26.5)#35 | 10.9%(+26.8)#1,871 |
| 36. | Hampton | 37.4% | 11.2%(+26.2)#36 | 10.9%(+26.5)#1,906 |
| 37. | Iva | 37.2% | 11.2%(+26.0)#37 | 10.9%(+26.3)#1,926 |
| 38. | Burnettown | 36.7% | 11.2%(+25.5)#38 | 10.9%(+25.8)#1,958 |
| 39. | Latta | 36.5% | 11.2%(+25.3)#39 | 10.9%(+25.6)#1,971 |
| 40. | Arcadia Lakes | 36.3% | 11.2%(+25.1)#40 | 10.9%(+25.4)#1,980 |
| 41. | Cherryvale | 35.5% | 11.2%(+24.3)#41 | 10.9%(+24.6)#2,056 |
| 42. | Estill | 34.9% | 11.2%(+23.7)#42 | 10.9%(+24.0)#2,119 |
| 43. | Starr | 34.7% | 11.2%(+23.5)#43 | 10.9%(+23.8)#2,139 |
| 44. | Great Falls | 34.5% | 11.2%(+23.3)#44 | 10.9%(+23.6)#2,154 |
| 45. | Ruby | 33.3% | 11.2%(+22.1)#45 | 10.9%(+22.4)#2,286 |
| 46. | Ulmer | 33.3% | 11.2%(+22.1)#46 | 10.9%(+22.4)#2,340 |
| 47. | Wyboo | 31.9% | 11.2%(+20.7)#47 | 10.9%(+21.0)#2,453 |
| 48. | Dunean | 29.9% | 11.2%(+18.7)#48 | 10.9%(+19.0)#2,692 |
| 49. | Williams | 29.9% | 11.2%(+18.7)#49 | 10.9%(+19.0)#2,710 |
| 50. | St Matthews | 29.1% | 11.2%(+17.9)#50 | 10.9%(+18.2)#2,800 |
| 51. | Clearwater | 28.8% | 11.2%(+17.6)#51 | 10.9%(+17.9)#2,832 |
| 52. | Georgetown | 28.3% | 11.2%(+17.1)#52 | 10.9%(+17.4)#2,914 |
| 53. | Pamplico | 27.9% | 11.2%(+16.7)#53 | 10.9%(+17.0)#2,977 |
| 54. | Reidville | 25.6% | 11.2%(+14.4)#54 | 10.9%(+14.7)#3,381 |
| 55. | Clover | 25.4% | 11.2%(+14.2)#55 | 10.9%(+14.5)#3,399 |
| 56. | Lesslie | 25.3% | 11.2%(+14.1)#56 | 10.9%(+14.4)#3,420 |
| 57. | Westminster | 25.2% | 11.2%(+14.0)#57 | 10.9%(+14.3)#3,439 |
| 58. | Cottageville | 25.0% | 11.2%(+13.8)#58 | 10.9%(+14.1)#3,466 |
| 59. | Cordova | 25.0% | 11.2%(+13.8)#59 | 10.9%(+14.1)#3,502 |
| 60. | Lake Murray Of Richland | 24.2% | 11.2%(+13.0)#60 | 10.9%(+13.3)#3,659 |
| 61. | Loris | 24.0% | 11.2%(+12.8)#61 | 10.9%(+13.1)#3,699 |
| 62. | Bennettsville | 23.6% | 11.2%(+12.4)#62 | 10.9%(+12.7)#3,784 |
| 63. | Gilbert | 23.2% | 11.2%(+12.0)#63 | 10.9%(+12.3)#3,888 |
| 64. | Cane Savannah | 22.2% | 11.2%(+11.0)#64 | 10.9%(+11.3)#4,128 |
| 65. | Aynor | 22.2% | 11.2%(+11.0)#65 | 10.9%(+11.3)#4,138 |
| 66. | Berea | 21.9% | 11.2%(+10.7)#66 | 10.9%(+11.0)#4,206 |
| 67. | Wagener | 21.8% | 11.2%(+10.6)#67 | 10.9%(+10.9)#4,235 |
| 68. | Gaffney | 21.7% | 11.2%(+10.5)#68 | 10.9%(+10.8)#4,243 |
| 69. | Ninety Six | 21.5% | 11.2%(+10.3)#69 | 10.9%(+10.6)#4,307 |
| 70. | Homeland Park | 21.2% | 11.2%(+10.00)#70 | 10.9%(+10.3)#4,383 |
| 71. | Camp Croft | 20.9% | 11.2%(+9.70)#71 | 10.9%(+10.00)#4,480 |
| 72. | Lake Wylie | 20.7% | 11.2%(+9.50)#72 | 10.9%(+9.80)#4,523 |
| 73. | Union | 20.4% | 11.2%(+9.20)#73 | 10.9%(+9.50)#4,588 |
| 74. | Barnwell | 20.2% | 11.2%(+9.00)#74 | 10.9%(+9.30)#4,645 |
| 75. | Irwin | 20.2% | 11.2%(+9.00)#75 | 10.9%(+9.30)#4,655 |
| 76. | Denmark | 20.1% | 11.2%(+8.90)#76 | 10.9%(+9.20)#4,671 |
| 77. | Lane | 20.0% | 11.2%(+8.80)#77 | 10.9%(+9.10)#4,704 |
| 78. | Mauldin | 19.9% | 11.2%(+8.70)#78 | 10.9%(+9.00)#4,745 |
| 79. | Blackville | 19.9% | 11.2%(+8.70)#79 | 10.9%(+9.00)#4,770 |
| 80. | Vance | 19.9% | 11.2%(+8.70)#80 | 10.9%(+9.00)#4,800 |
| 81. | Greenwood | 19.8% | 11.2%(+8.60)#81 | 10.9%(+8.90)#4,805 |
| 82. | Allendale | 19.6% | 11.2%(+8.40)#82 | 10.9%(+8.70)#4,848 |
| 83. | Clinton | 19.5% | 11.2%(+8.30)#83 | 10.9%(+8.60)#4,865 |
| 84. | York | 19.1% | 11.2%(+7.90)#84 | 10.9%(+8.20)#4,996 |
| 85. | Heath Springs | 19.1% | 11.2%(+7.90)#85 | 10.9%(+8.20)#5,021 |
| 86. | Olanta | 19.0% | 11.2%(+7.80)#86 | 10.9%(+8.10)#5,050 |
| 87. | Chesterfield | 18.9% | 11.2%(+7.70)#87 | 10.9%(+8.00)#5,079 |
| 88. | Branchville | 18.8% | 11.2%(+7.60)#88 | 10.9%(+7.90)#5,117 |
| 89. | Saluda | 18.6% | 11.2%(+7.40)#89 | 10.9%(+7.70)#5,175 |
| 90. | New Ellenton | 18.4% | 11.2%(+7.20)#90 | 10.9%(+7.50)#5,233 |
| 91. | Pelzer | 18.4% | 11.2%(+7.20)#91 | 10.9%(+7.50)#5,237 |
| 92. | Baxter | 18.3% | 11.2%(+7.10)#92 | 10.9%(+7.40)#5,258 |
| 93. | Hartsville | 18.0% | 11.2%(+6.80)#93 | 10.9%(+7.10)#5,375 |
| 94. | Little River | 17.9% | 11.2%(+6.70)#94 | 10.9%(+7.00)#5,412 |
| 95. | Dentsville | 17.5% | 11.2%(+6.30)#95 | 10.9%(+6.60)#5,594 |
| 96. | Gantt | 17.5% | 11.2%(+6.30)#96 | 10.9%(+6.60)#5,597 |
| 97. | Conway | 17.2% | 11.2%(+6.00)#97 | 10.9%(+6.30)#5,714 |
| 98. | St Andrews | 17.2% | 11.2%(+6.00)#98 | 10.9%(+6.30)#5,717 |
| 99. | Hickory Grove | 16.6% | 11.2%(+5.40)#99 | 10.9%(+5.70)#5,964 |
| 100. | Newberry | 16.5% | 11.2%(+5.30)#100 | 10.9%(+5.60)#6,032 |
Common Questions
What are the Top 10 Cities with the Highest Unemployment Rate Amomg Youth Under the Age of 25 in South Carolina?
Top 10 Cities with the Highest Unemployment Rate Amomg Youth Under the Age of 25 in South Carolina are:
What city has the Highest Unemployment Rate Amomg Youth Under the Age of 25 in South Carolina?
Gadsden has the Highest Unemployment Rate Amomg Youth Under the Age of 25 in South Carolina with 100.0%.
What is the Unemployment Rate Amomg Youth Under the Age of 25 in the State of South Carolina?
Unemployment Rate Amomg Youth Under the Age of 25 in South Carolina is 11.2%.
What is the Unemployment Rate Amomg Youth Under the Age of 25 in the United States?
Unemployment Rate Amomg Youth Under the Age of 25 in the United States is 10.9%.