Arcadia Lakes, SC
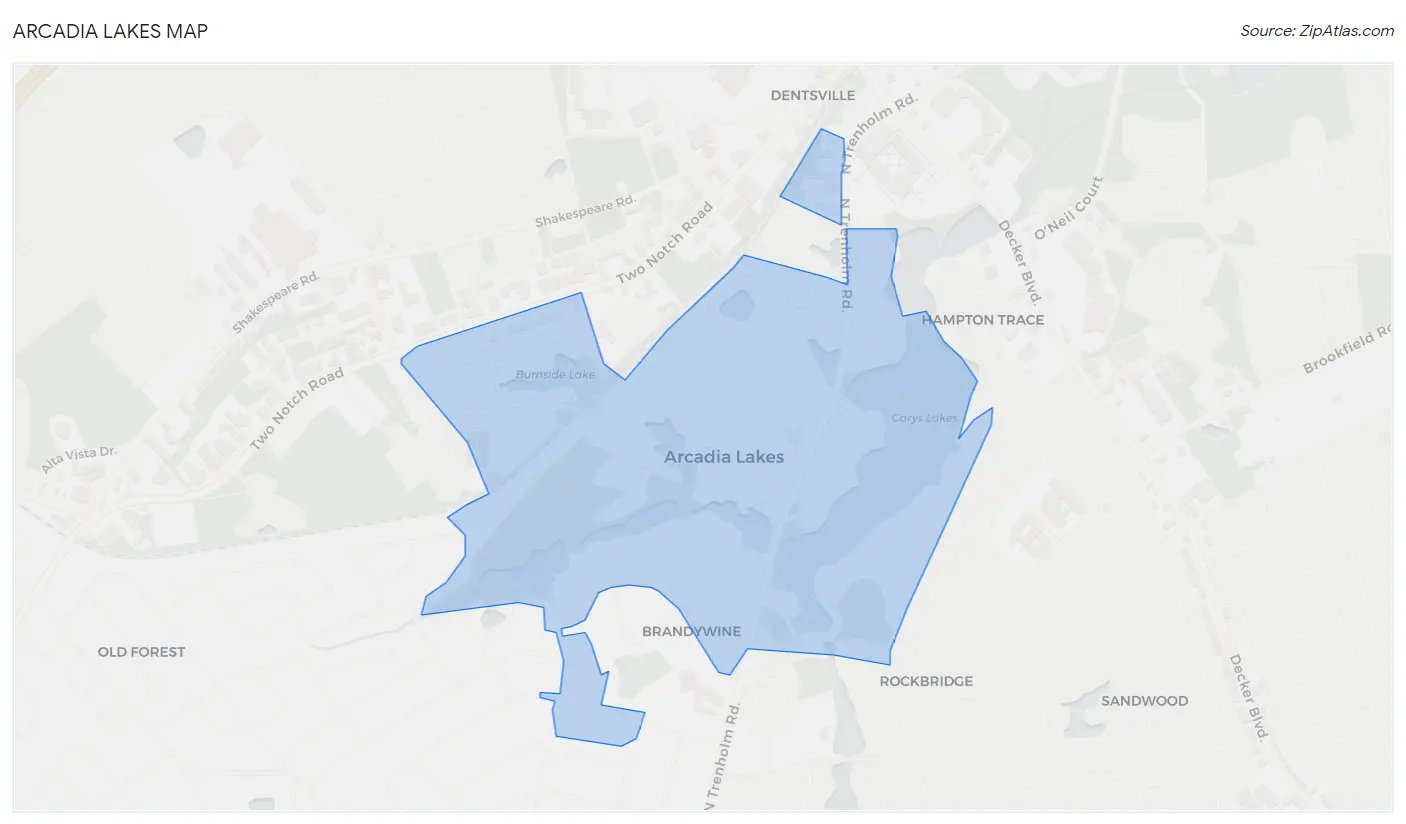
Arcadia Lakes Map
Arcadia Lakes Overview
871
TOTAL POPULATION
411
MALE POPULATION
460
FEMALE POPULATION
89.35
MALES / 100 FEMALES
111.92
FEMALES / 100 MALES
65.1
MEDIAN AGE
2.7
AVG FAMILY SIZE
2.2
AVG HOUSEHOLD SIZE
$59,109
PER CAPITA INCOME
$120,179
AVG FAMILY INCOME
$100,625
AVG HOUSEHOLD INCOME
5.1%
WAGE / INCOME GAP [ % ]
94.9¢/ $1
WAGE / INCOME GAP [ $ ]
0.40
INEQUALITY / GINI INDEX
455
LABOR FORCE [ PEOPLE ]
61.2%
PERCENT IN LABOR FORCE
0.9%
UNEMPLOYMENT RATE
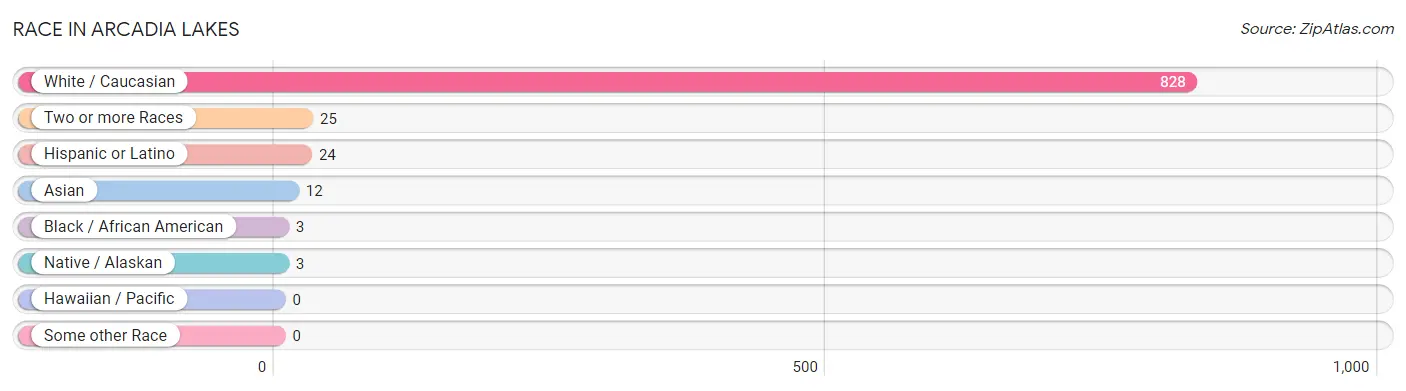
Race in Arcadia Lakes
The most populous races in Arcadia Lakes are White / Caucasian (828 | 95.1%), Two or more Races (25 | 2.9%), and Hispanic or Latino (24 | 2.8%).
| Race | # Population | % Population |
| Asian | 12 | 1.4% |
| Black / African American | 3 | 0.3% |
| Hawaiian / Pacific | 0 | 0.0% |
| Hispanic or Latino | 24 | 2.8% |
| Native / Alaskan | 3 | 0.3% |
| White / Caucasian | 828 | 95.1% |
| Two or more Races | 25 | 2.9% |
| Some other Race | 0 | 0.0% |
| Total | 871 | 100.0% |
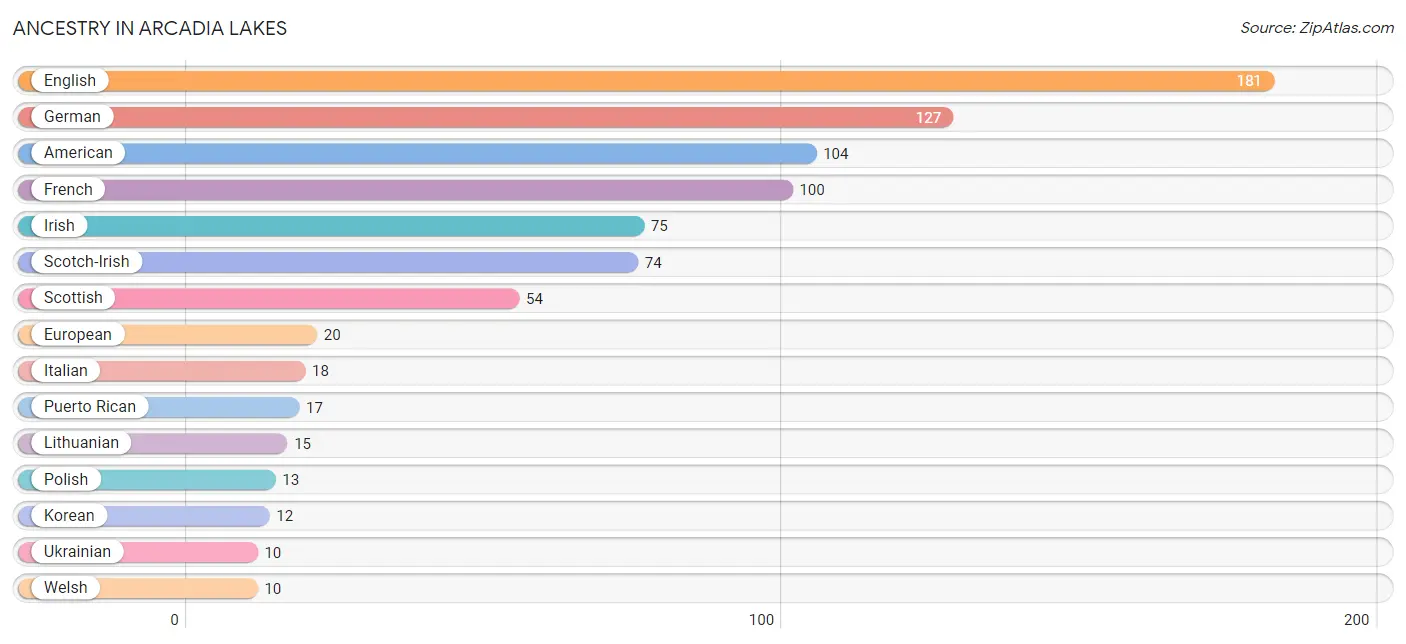
Ancestry in Arcadia Lakes
The most populous ancestries reported in Arcadia Lakes are English (181 | 20.8%), German (127 | 14.6%), American (104 | 11.9%), French (100 | 11.5%), and Irish (75 | 8.6%), together accounting for 67.4% of all Arcadia Lakes residents.
| Ancestry | # Population | % Population |
| American | 104 | 11.9% |
| Arab | 4 | 0.5% |
| Brazilian | 3 | 0.3% |
| British | 6 | 0.7% |
| Cherokee | 4 | 0.5% |
| Dutch | 3 | 0.3% |
| Ecuadorian | 3 | 0.3% |
| English | 181 | 20.8% |
| European | 20 | 2.3% |
| French | 100 | 11.5% |
| French Canadian | 3 | 0.3% |
| German | 127 | 14.6% |
| Greek | 7 | 0.8% |
| Irish | 75 | 8.6% |
| Italian | 18 | 2.1% |
| Korean | 12 | 1.4% |
| Lebanese | 4 | 0.5% |
| Lithuanian | 15 | 1.7% |
| Luxembourger | 2 | 0.2% |
| Norwegian | 8 | 0.9% |
| Polish | 13 | 1.5% |
| Puerto Rican | 17 | 1.9% |
| Romanian | 4 | 0.5% |
| Scotch-Irish | 74 | 8.5% |
| Scottish | 54 | 6.2% |
| South American | 3 | 0.3% |
| South American Indian | 3 | 0.3% |
| Swiss | 4 | 0.5% |
| Ukrainian | 10 | 1.1% |
| Welsh | 10 | 1.1% | View All 30 Rows |
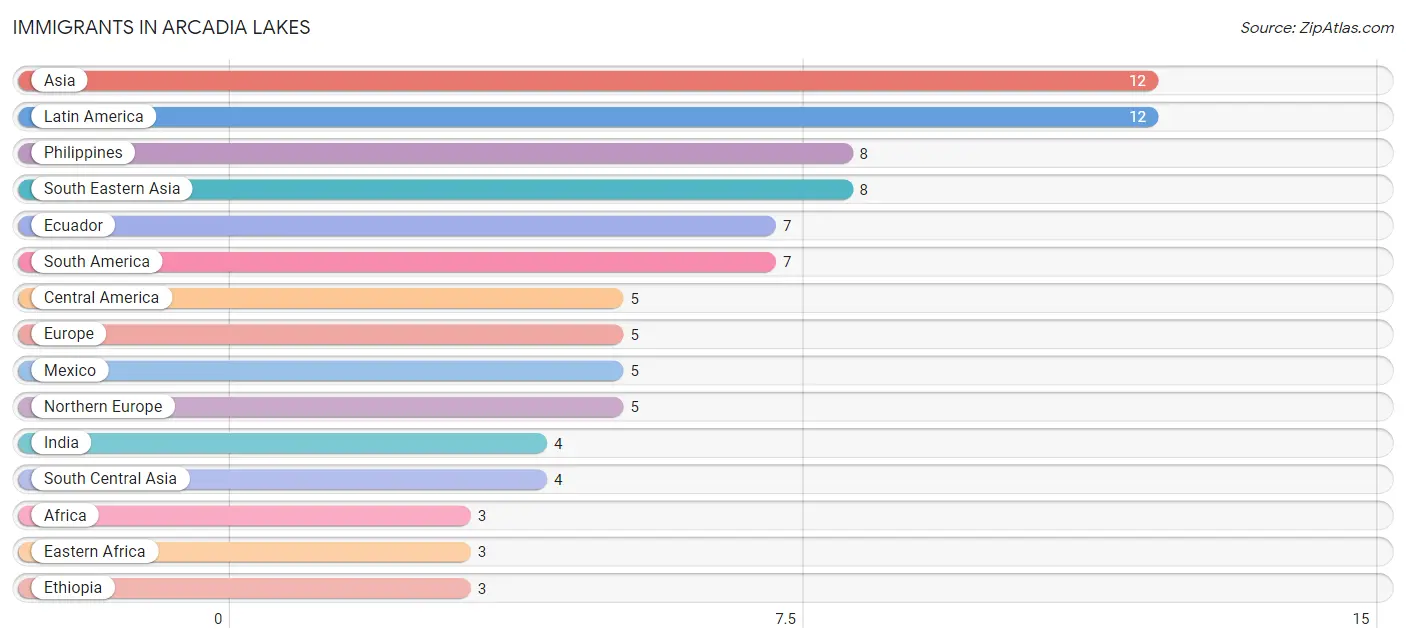
Immigrants in Arcadia Lakes
The most numerous immigrant groups reported in Arcadia Lakes came from Asia (12 | 1.4%), Latin America (12 | 1.4%), Philippines (8 | 0.9%), South Eastern Asia (8 | 0.9%), and Ecuador (7 | 0.8%), together accounting for 5.4% of all Arcadia Lakes residents.
| Immigration Origin | # Population | % Population |
| Africa | 3 | 0.3% |
| Asia | 12 | 1.4% |
| Central America | 5 | 0.6% |
| Eastern Africa | 3 | 0.3% |
| Ecuador | 7 | 0.8% |
| Ethiopia | 3 | 0.3% |
| Europe | 5 | 0.6% |
| India | 4 | 0.5% |
| Latin America | 12 | 1.4% |
| Mexico | 5 | 0.6% |
| Northern Europe | 5 | 0.6% |
| Norway | 2 | 0.2% |
| Philippines | 8 | 0.9% |
| Scotland | 2 | 0.2% |
| South America | 7 | 0.8% |
| South Central Asia | 4 | 0.5% |
| South Eastern Asia | 8 | 0.9% | View All 17 Rows |
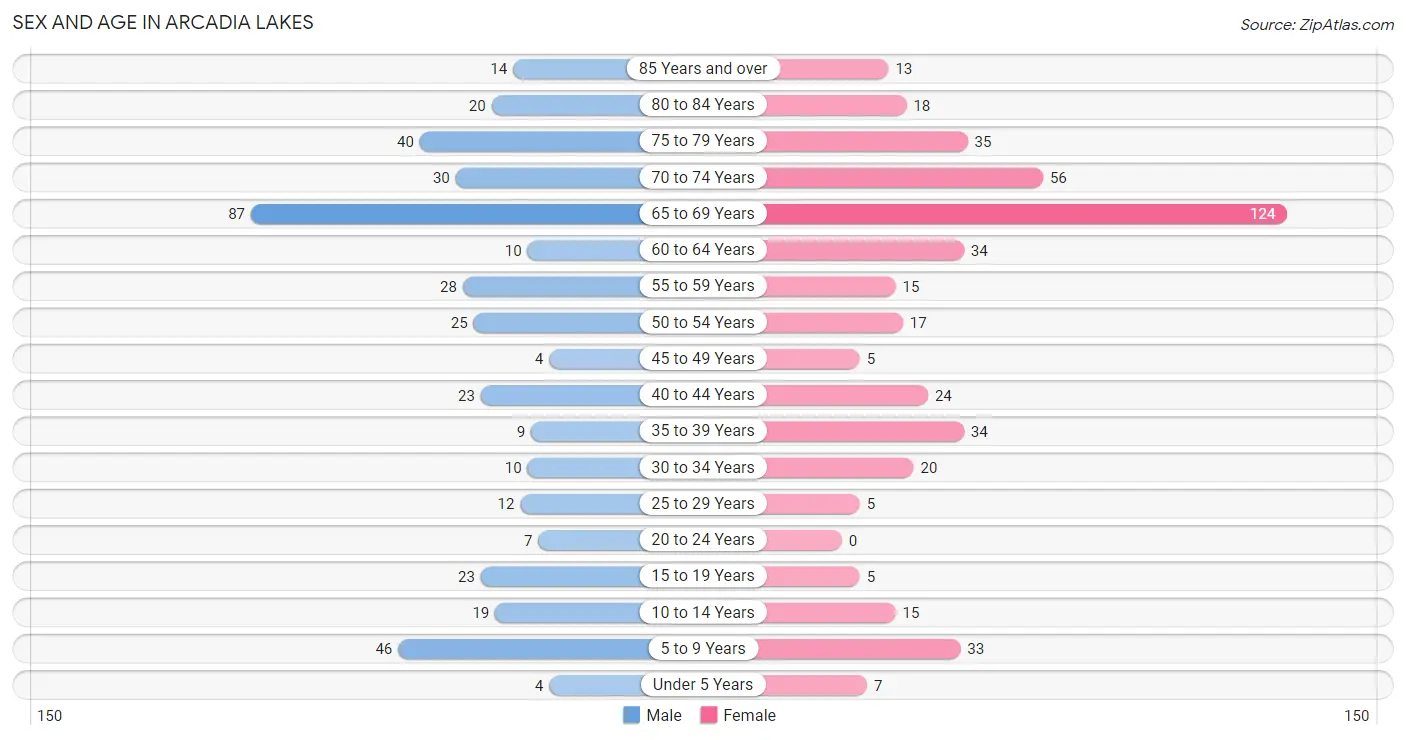
Sex and Age in Arcadia Lakes
Sex and Age in Arcadia Lakes
The most populous age groups in Arcadia Lakes are 65 to 69 Years (87 | 21.2%) for men and 65 to 69 Years (124 | 27.0%) for women.
| Age Bracket | Male | Female |
| Under 5 Years | 4 (1.0%) | 7 (1.5%) |
| 5 to 9 Years | 46 (11.2%) | 33 (7.2%) |
| 10 to 14 Years | 19 (4.6%) | 15 (3.3%) |
| 15 to 19 Years | 23 (5.6%) | 5 (1.1%) |
| 20 to 24 Years | 7 (1.7%) | 0 (0.0%) |
| 25 to 29 Years | 12 (2.9%) | 5 (1.1%) |
| 30 to 34 Years | 10 (2.4%) | 20 (4.3%) |
| 35 to 39 Years | 9 (2.2%) | 34 (7.4%) |
| 40 to 44 Years | 23 (5.6%) | 24 (5.2%) |
| 45 to 49 Years | 4 (1.0%) | 5 (1.1%) |
| 50 to 54 Years | 25 (6.1%) | 17 (3.7%) |
| 55 to 59 Years | 28 (6.8%) | 15 (3.3%) |
| 60 to 64 Years | 10 (2.4%) | 34 (7.4%) |
| 65 to 69 Years | 87 (21.2%) | 124 (27.0%) |
| 70 to 74 Years | 30 (7.3%) | 56 (12.2%) |
| 75 to 79 Years | 40 (9.7%) | 35 (7.6%) |
| 80 to 84 Years | 20 (4.9%) | 18 (3.9%) |
| 85 Years and over | 14 (3.4%) | 13 (2.8%) |
| Total | 411 (100.0%) | 460 (100.0%) |
Families and Households in Arcadia Lakes
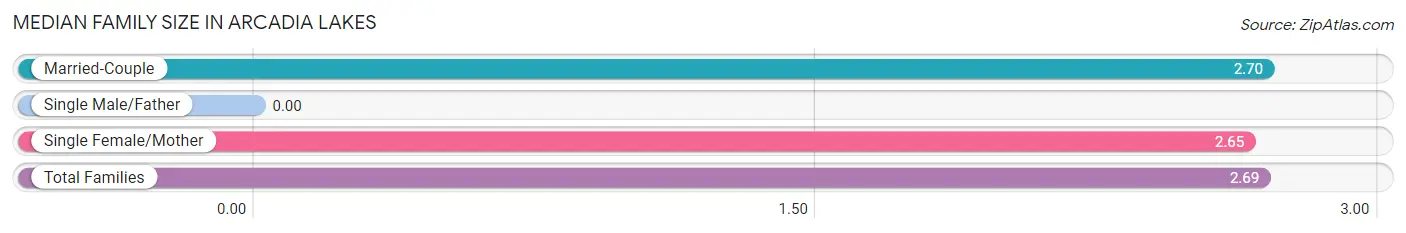
Median Family Size in Arcadia Lakes
| Family Type | # Families | Family Size |
| Married-Couple | 248 (90.5%) | 2.70 |
| Single Male/Father | 0 (0.0%) | - |
| Single Female/Mother | 26 (9.5%) | 2.65 |
| Total Families | 274 (100.0%) | 2.69 |
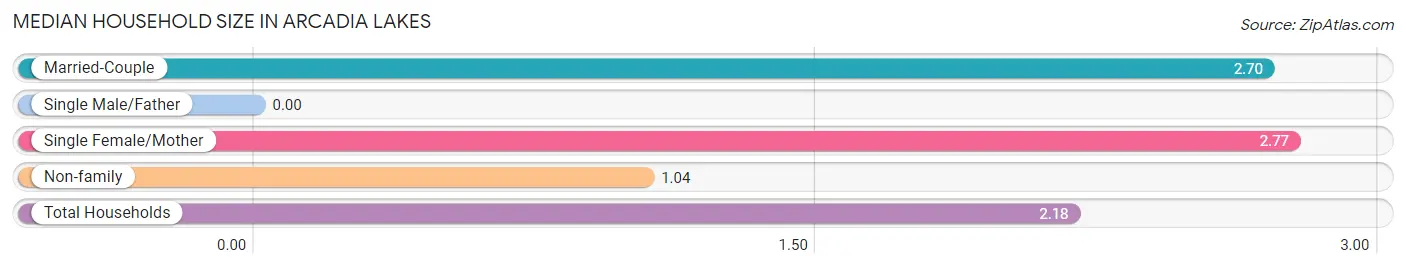
Median Household Size in Arcadia Lakes
| Household Type | # Households | Household Size |
| Married-Couple | 248 (62.2%) | 2.70 |
| Single Male/Father | 0 (0.0%) | - |
| Single Female/Mother | 26 (6.5%) | 2.77 |
| Non-family | 125 (31.3%) | 1.04 |
| Total Households | 399 (100.0%) | 2.18 |
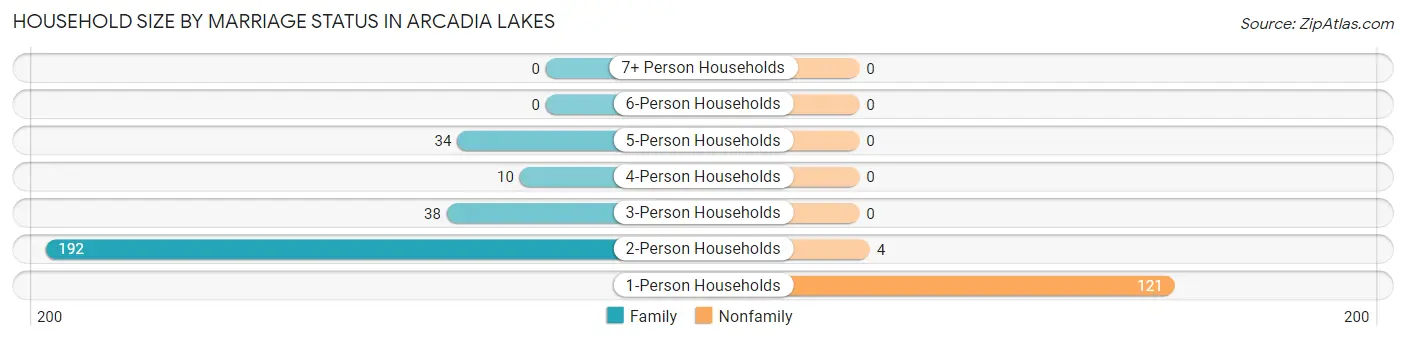
Household Size by Marriage Status in Arcadia Lakes
Out of a total of 399 households in Arcadia Lakes, 274 (68.7%) are family households, while 125 (31.3%) are nonfamily households. The most numerous type of family households are 2-person households, comprising 192, and the most common type of nonfamily households are 1-person households, comprising 121.
| Household Size | Family Households | Nonfamily Households |
| 1-Person Households | - | 121 (30.3%) |
| 2-Person Households | 192 (48.1%) | 4 (1.0%) |
| 3-Person Households | 38 (9.5%) | 0 (0.0%) |
| 4-Person Households | 10 (2.5%) | 0 (0.0%) |
| 5-Person Households | 34 (8.5%) | 0 (0.0%) |
| 6-Person Households | 0 (0.0%) | 0 (0.0%) |
| 7+ Person Households | 0 (0.0%) | 0 (0.0%) |
| Total | 274 (68.7%) | 125 (31.3%) |
Female Fertility in Arcadia Lakes
Fertility by Age in Arcadia Lakes
| Age Bracket | Women with Births | Births / 1,000 Women |
| 15 to 19 years | 0 (0.0%) | 0.0 |
| 20 to 34 years | 0 (0.0%) | 0.0 |
| 35 to 50 years | 0 (0.0%) | 0.0 |
| Total | 0 (0.0%) | 0.0 |
Fertility by Age by Marriage Status in Arcadia Lakes
| Age Bracket | Married | Unmarried |
| 15 to 19 years | 0 (0.0%) | 0 (0.0%) |
| 20 to 34 years | 0 (0.0%) | 0 (0.0%) |
| 35 to 50 years | 0 (0.0%) | 0 (0.0%) |
| Total | 0 (0.0%) | 0 (0.0%) |
Fertility by Education in Arcadia Lakes
| Educational Attainment | Women with Births | Births / 1,000 Women |
| Less than High School | 0 (0.0%) | 0.0 |
| High School Diploma | 0 (0.0%) | 0.0 |
| College or Associate's Degree | 0 (0.0%) | 0.0 |
| Bachelor's Degree | 0 (0.0%) | 0.0 |
| Graduate Degree | 0 (0.0%) | 0.0 |
| Total | 0 (0.0%) | 0.0 |
Fertility by Education by Marriage Status in Arcadia Lakes
| Educational Attainment | Married | Unmarried |
| Less than High School | 0 (0.0%) | 0 (0.0%) |
| High School Diploma | 0 (0.0%) | 0 (0.0%) |
| College or Associate's Degree | 0 (0.0%) | 0 (0.0%) |
| Bachelor's Degree | 0 (0.0%) | 0 (0.0%) |
| Graduate Degree | 0 (0.0%) | 0 (0.0%) |
| Total | 0 (0.0%) | 0 (0.0%) |
Income in Arcadia Lakes
Income Overview in Arcadia Lakes
Per Capita Income in Arcadia Lakes is $59,109, while median incomes of families and households are $120,179 and $100,625 respectively.
| Characteristic | Number | Measure |
| Per Capita Income | 871 | $59,109 |
| Median Family Income | 274 | $120,179 |
| Mean Family Income | 274 | $152,349 |
| Median Household Income | 399 | $100,625 |
| Mean Household Income | 399 | $127,623 |
| Income Deficit | 274 | $0 |
| Wage / Income Gap (%) | 871 | 5.14% |
| Wage / Income Gap ($) | 871 | 94.86¢ per $1 |
| Gini / Inequality Index | 871 | 0.40 |
Earnings by Sex in Arcadia Lakes
Average Earnings in Arcadia Lakes are $49,127, $46,667 for men and $49,198 for women, a difference of 5.1%.
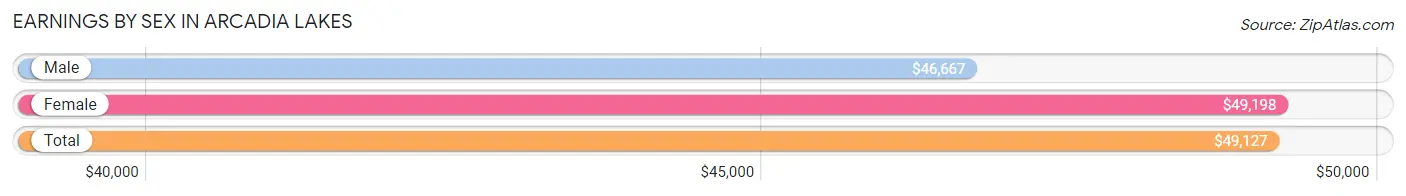
| Sex | Number | Average Earnings |
| Male | 226 (48.3%) | $46,667 |
| Female | 242 (51.7%) | $49,198 |
| Total | 468 (100.0%) | $49,127 |
Earnings by Sex by Income Bracket in Arcadia Lakes
The most common earnings brackets in Arcadia Lakes are $100,000+ for men (51 | 22.6%) and $45,000 to $49,999 for women (81 | 33.5%).
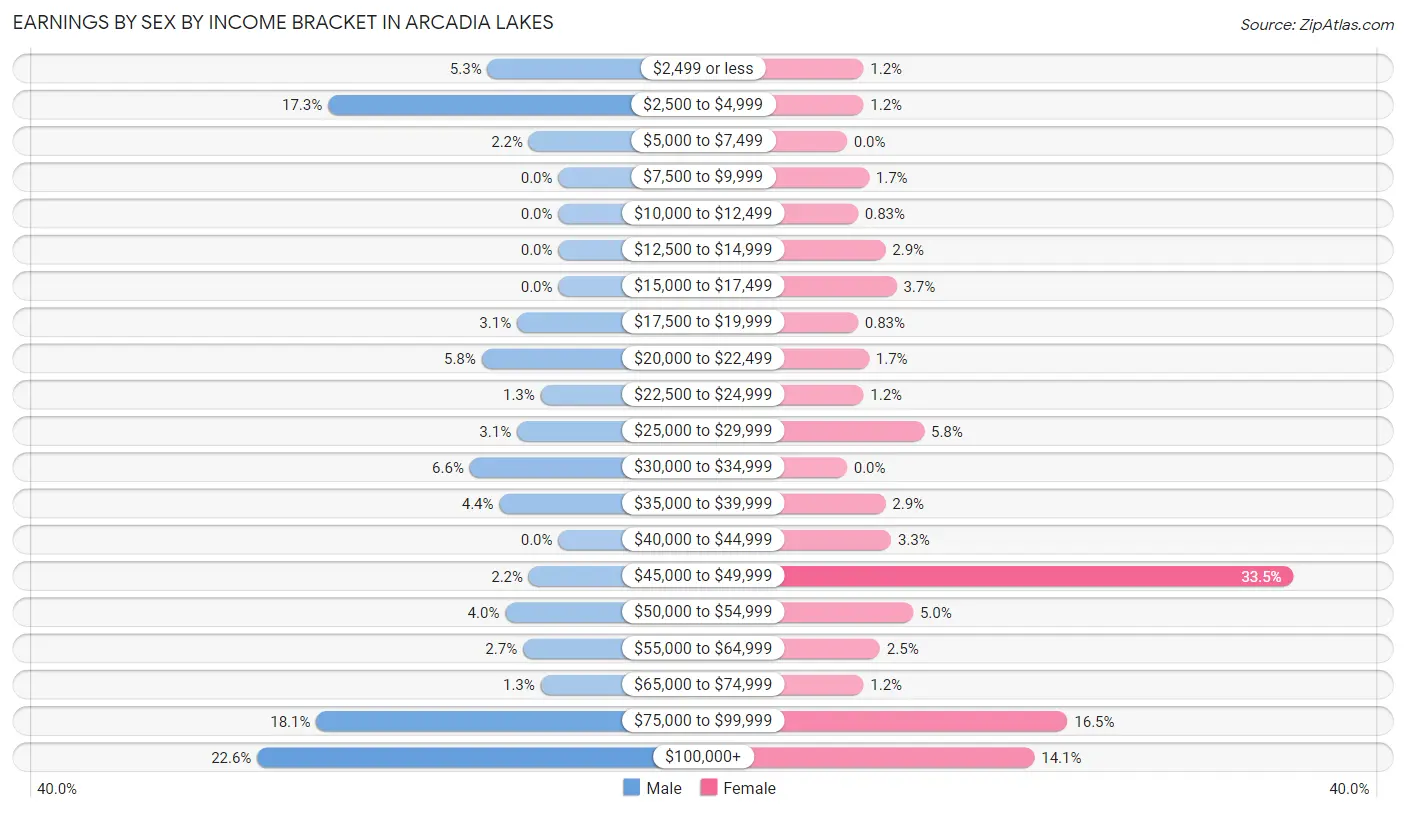
| Income | Male | Female |
| $2,499 or less | 12 (5.3%) | 3 (1.2%) |
| $2,500 to $4,999 | 39 (17.3%) | 3 (1.2%) |
| $5,000 to $7,499 | 5 (2.2%) | 0 (0.0%) |
| $7,500 to $9,999 | 0 (0.0%) | 4 (1.7%) |
| $10,000 to $12,499 | 0 (0.0%) | 2 (0.8%) |
| $12,500 to $14,999 | 0 (0.0%) | 7 (2.9%) |
| $15,000 to $17,499 | 0 (0.0%) | 9 (3.7%) |
| $17,500 to $19,999 | 7 (3.1%) | 2 (0.8%) |
| $20,000 to $22,499 | 13 (5.8%) | 4 (1.7%) |
| $22,500 to $24,999 | 3 (1.3%) | 3 (1.2%) |
| $25,000 to $29,999 | 7 (3.1%) | 14 (5.8%) |
| $30,000 to $34,999 | 15 (6.6%) | 0 (0.0%) |
| $35,000 to $39,999 | 10 (4.4%) | 7 (2.9%) |
| $40,000 to $44,999 | 0 (0.0%) | 8 (3.3%) |
| $45,000 to $49,999 | 5 (2.2%) | 81 (33.5%) |
| $50,000 to $54,999 | 9 (4.0%) | 12 (5.0%) |
| $55,000 to $64,999 | 6 (2.6%) | 6 (2.5%) |
| $65,000 to $74,999 | 3 (1.3%) | 3 (1.2%) |
| $75,000 to $99,999 | 41 (18.1%) | 40 (16.5%) |
| $100,000+ | 51 (22.6%) | 34 (14.1%) |
| Total | 226 (100.0%) | 242 (100.0%) |
Earnings by Sex by Educational Attainment in Arcadia Lakes
Average earnings in Arcadia Lakes are $50,139 for men and $49,198 for women, a difference of 1.9%. Men with an educational attainment of graduate degree enjoy the highest average annual earnings of $90,000, while those with high school diploma education earn the least with $33,542. Women with an educational attainment of graduate degree earn the most with the average annual earnings of $88,295, while those with college or associate's degree education have the smallest earnings of $48,333.
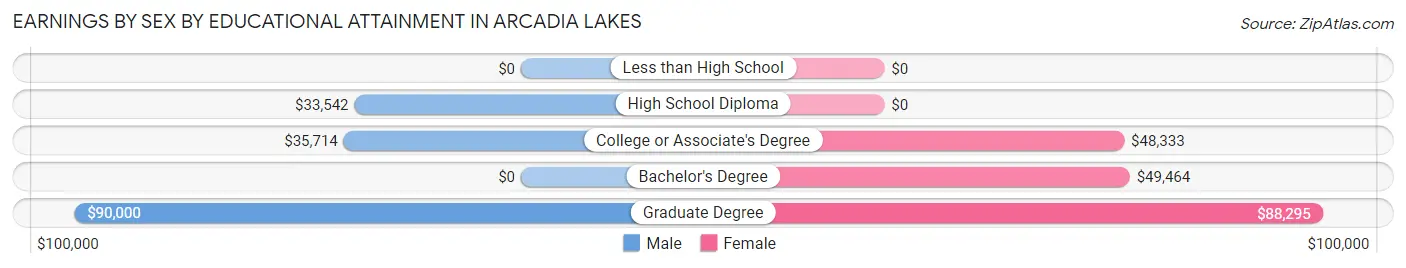
| Educational Attainment | Male Income | Female Income |
| Less than High School | - | - |
| High School Diploma | $33,542 | $0 |
| College or Associate's Degree | $35,714 | $48,333 |
| Bachelor's Degree | - | - |
| Graduate Degree | $90,000 | $88,295 |
| Total | $50,139 | $49,198 |
Family Income in Arcadia Lakes
Family Income Brackets in Arcadia Lakes
According to the Arcadia Lakes family income data, there are 76 families falling into the $75,000 to $99,999 income range, which is the most common income bracket and makes up 27.7% of all families.
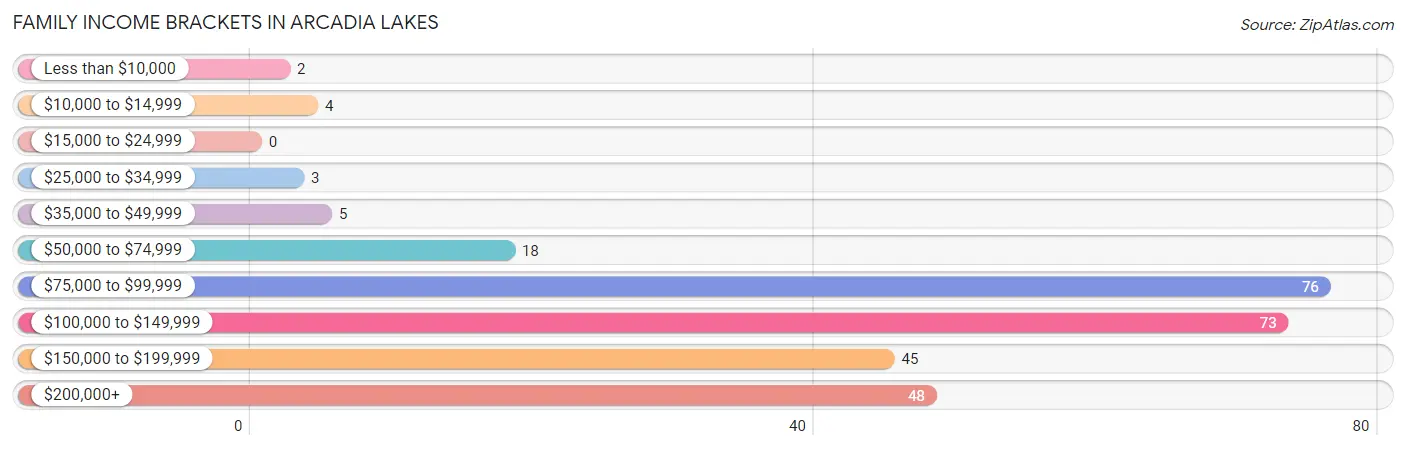
| Income Bracket | # Families | % Families |
| Less than $10,000 | 2 | 0.7% |
| $10,000 to $14,999 | 4 | 1.5% |
| $15,000 to $24,999 | 0 | 0.0% |
| $25,000 to $34,999 | 3 | 1.1% |
| $35,000 to $49,999 | 5 | 1.8% |
| $50,000 to $74,999 | 18 | 6.6% |
| $75,000 to $99,999 | 76 | 27.7% |
| $100,000 to $149,999 | 73 | 26.6% |
| $150,000 to $199,999 | 45 | 16.4% |
| $200,000+ | 48 | 17.5% |
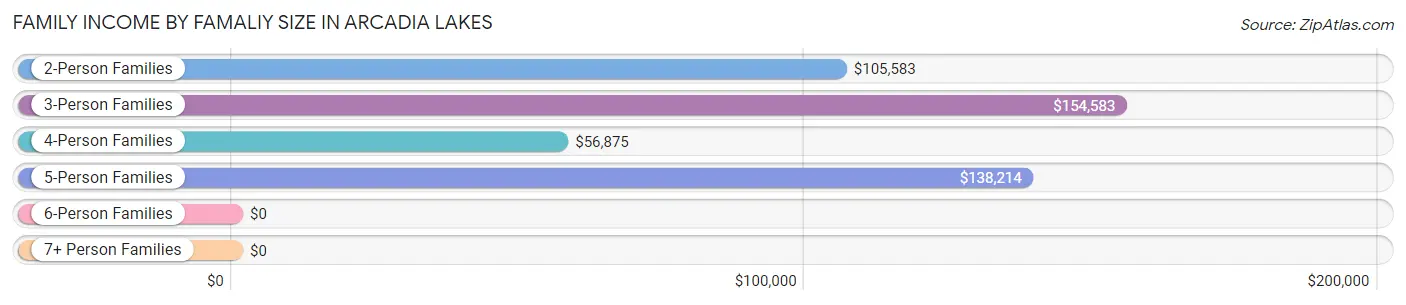
Family Income by Famaliy Size in Arcadia Lakes
3-person families (35 | 12.8%) account for the highest median family income in Arcadia Lakes with $154,583 per family, while 2-person families (195 | 71.2%) have the highest median income of $52,792 per family member.
| Income Bracket | # Families | Median Income |
| 2-Person Families | 195 (71.2%) | $105,583 |
| 3-Person Families | 35 (12.8%) | $154,583 |
| 4-Person Families | 10 (3.6%) | $56,875 |
| 5-Person Families | 34 (12.4%) | $138,214 |
| 6-Person Families | 0 (0.0%) | $0 |
| 7+ Person Families | 0 (0.0%) | $0 |
| Total | 274 (100.0%) | $120,179 |
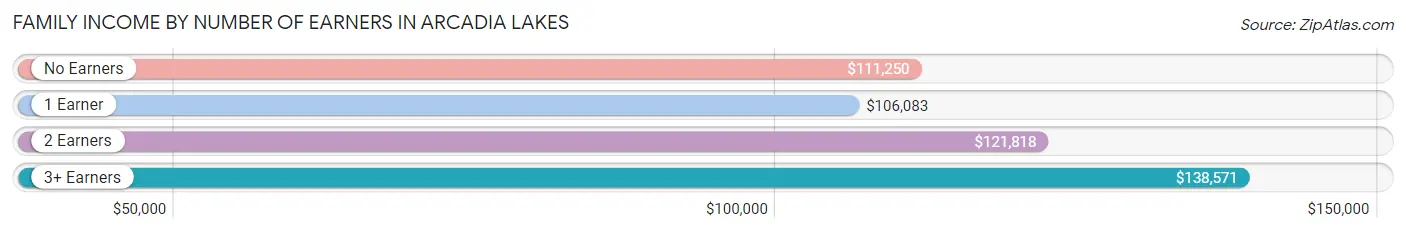
Family Income by Number of Earners in Arcadia Lakes
The median family income in Arcadia Lakes is $120,179, with families comprising 3+ earners (16) having the highest median family income of $138,571, while families with 1 earner (77) have the lowest median family income of $106,083, accounting for 5.8% and 28.1% of families, respectively.
| Number of Earners | # Families | Median Income |
| No Earners | 53 (19.3%) | $111,250 |
| 1 Earner | 77 (28.1%) | $106,083 |
| 2 Earners | 128 (46.7%) | $121,818 |
| 3+ Earners | 16 (5.8%) | $138,571 |
| Total | 274 (100.0%) | $120,179 |
Household Income in Arcadia Lakes
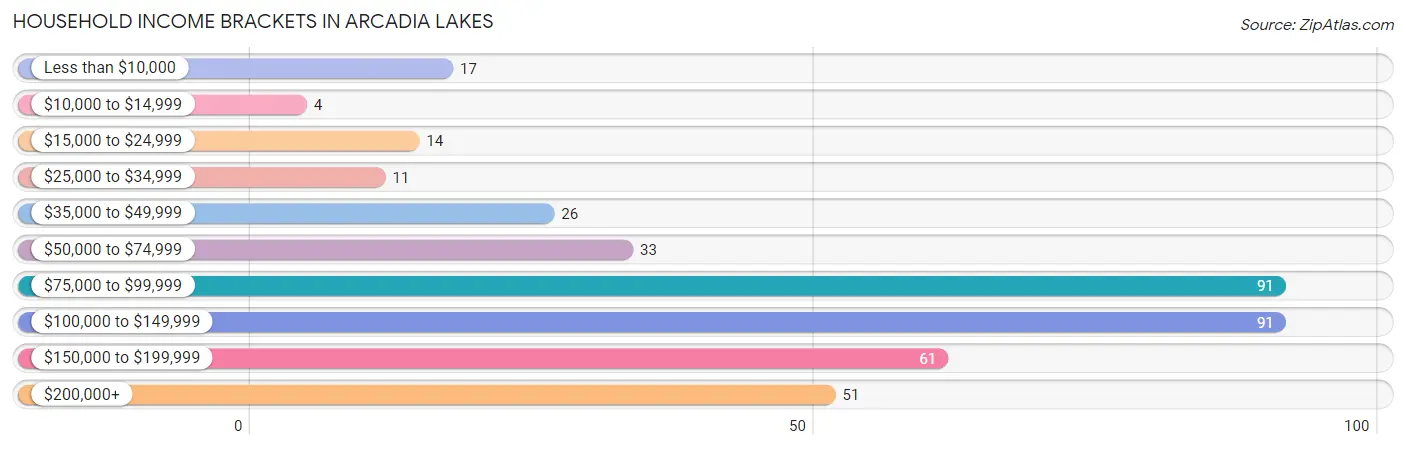
Household Income Brackets in Arcadia Lakes
With 91 households falling in the category, the $75,000 to $99,999 income range is the most frequent in Arcadia Lakes, accounting for 22.8% of all households. In contrast, only 4 households (1.0%) fall into the $10,000 to $14,999 income bracket, making it the least populous group.
| Income Bracket | # Households | % Households |
| Less than $10,000 | 17 | 4.3% |
| $10,000 to $14,999 | 4 | 1.0% |
| $15,000 to $24,999 | 14 | 3.5% |
| $25,000 to $34,999 | 11 | 2.8% |
| $35,000 to $49,999 | 26 | 6.5% |
| $50,000 to $74,999 | 33 | 8.3% |
| $75,000 to $99,999 | 91 | 22.8% |
| $100,000 to $149,999 | 91 | 22.8% |
| $150,000 to $199,999 | 61 | 15.3% |
| $200,000+ | 51 | 12.8% |
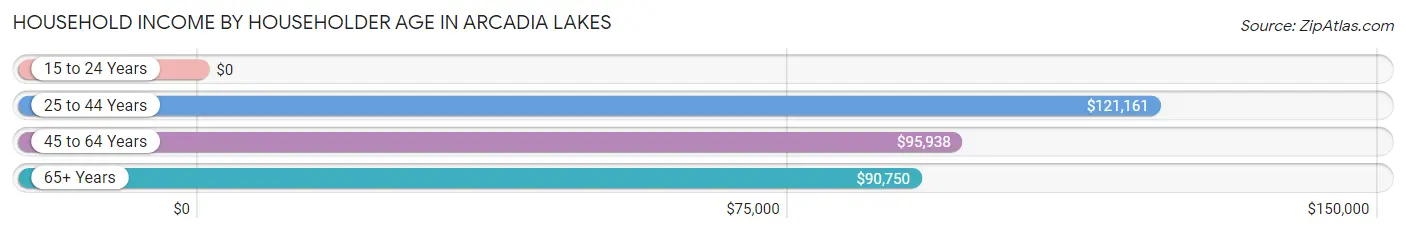
Household Income by Householder Age in Arcadia Lakes
The median household income in Arcadia Lakes is $100,625, with the highest median household income of $121,161 found in the 25 to 44 years age bracket for the primary householder. A total of 79 households (19.8%) fall into this category.
| Income Bracket | # Households | Median Income |
| 15 to 24 Years | 0 (0.0%) | $0 |
| 25 to 44 Years | 79 (19.8%) | $121,161 |
| 45 to 64 Years | 73 (18.3%) | $95,938 |
| 65+ Years | 247 (61.9%) | $90,750 |
| Total | 399 (100.0%) | $100,625 |
Poverty in Arcadia Lakes
Income Below Poverty by Sex and Age in Arcadia Lakes
With 2.2% poverty level for males and 3.9% for females among the residents of Arcadia Lakes, 55 to 64 year old males and 55 to 64 year old females are the most vulnerable to poverty, with 3 males (7.9%) and 4 females (8.2%) in their respective age groups living below the poverty level.
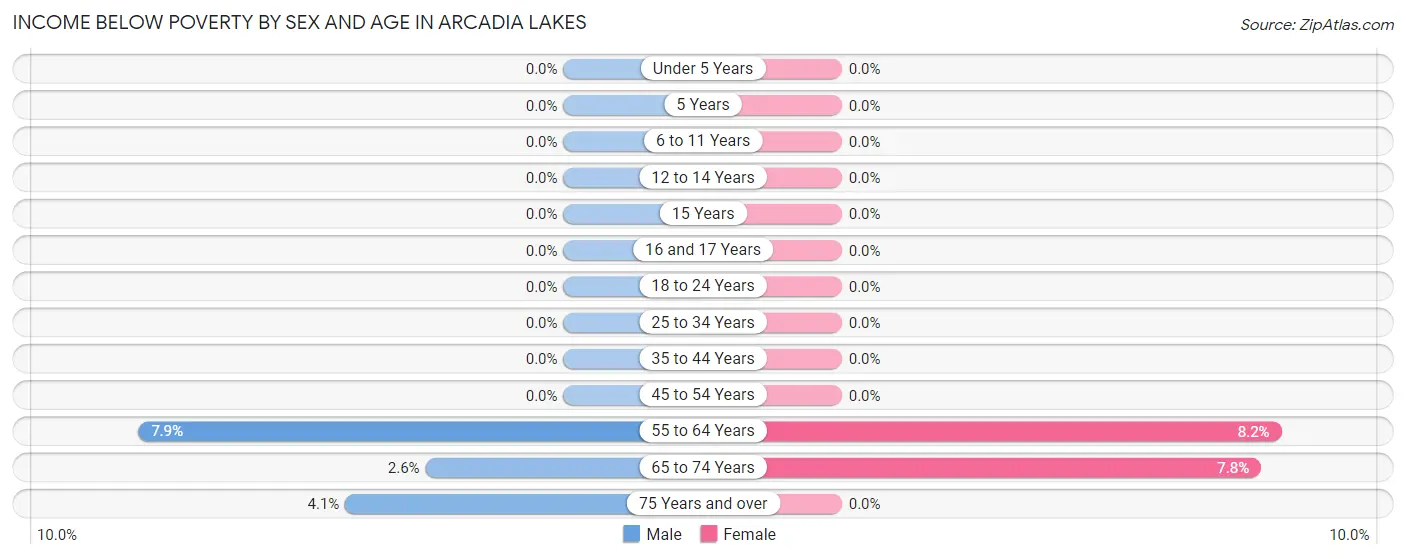
| Age Bracket | Male | Female |
| Under 5 Years | 0 (0.0%) | 0 (0.0%) |
| 5 Years | 0 (0.0%) | 0 (0.0%) |
| 6 to 11 Years | 0 (0.0%) | 0 (0.0%) |
| 12 to 14 Years | 0 (0.0%) | 0 (0.0%) |
| 15 Years | 0 (0.0%) | 0 (0.0%) |
| 16 and 17 Years | 0 (0.0%) | 0 (0.0%) |
| 18 to 24 Years | 0 (0.0%) | 0 (0.0%) |
| 25 to 34 Years | 0 (0.0%) | 0 (0.0%) |
| 35 to 44 Years | 0 (0.0%) | 0 (0.0%) |
| 45 to 54 Years | 0 (0.0%) | 0 (0.0%) |
| 55 to 64 Years | 3 (7.9%) | 4 (8.2%) |
| 65 to 74 Years | 3 (2.6%) | 14 (7.8%) |
| 75 Years and over | 3 (4.1%) | 0 (0.0%) |
| Total | 9 (2.2%) | 18 (3.9%) |
Income Above Poverty by Sex and Age in Arcadia Lakes
According to the poverty statistics in Arcadia Lakes, males aged under 5 years and females aged under 5 years are the age groups that are most secure financially, with 100.0% of males and 100.0% of females in these age groups living above the poverty line.
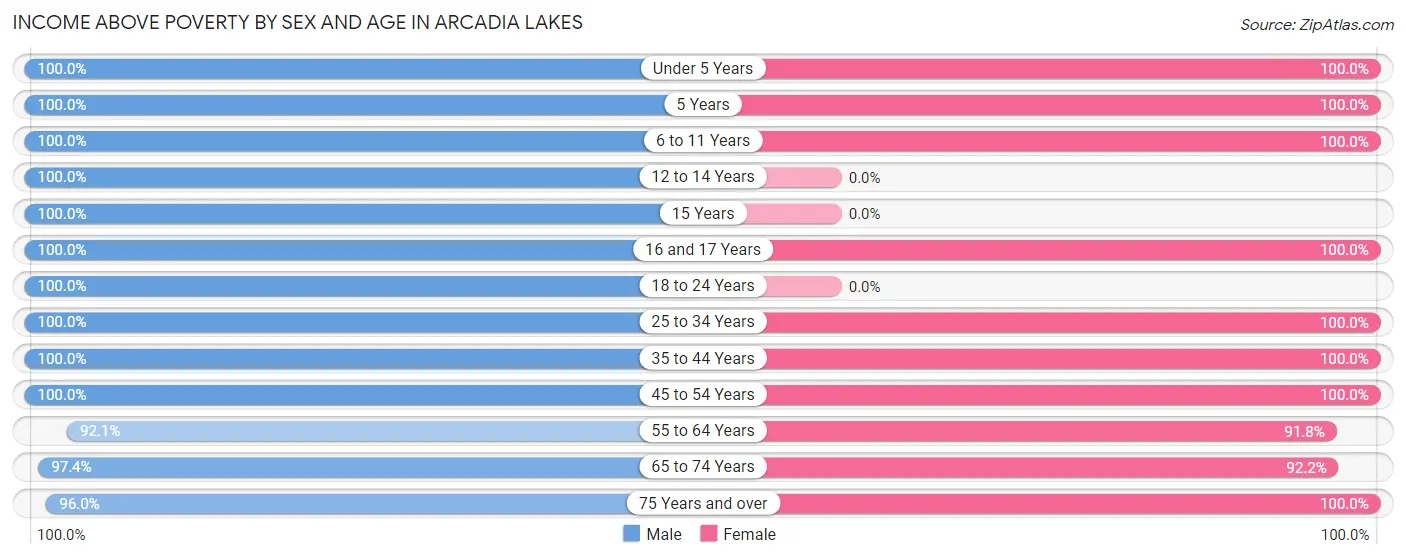
| Age Bracket | Male | Female |
| Under 5 Years | 4 (100.0%) | 7 (100.0%) |
| 5 Years | 17 (100.0%) | 5 (100.0%) |
| 6 to 11 Years | 29 (100.0%) | 43 (100.0%) |
| 12 to 14 Years | 19 (100.0%) | 0 (0.0%) |
| 15 Years | 4 (100.0%) | 0 (0.0%) |
| 16 and 17 Years | 15 (100.0%) | 5 (100.0%) |
| 18 to 24 Years | 11 (100.0%) | 0 (0.0%) |
| 25 to 34 Years | 22 (100.0%) | 25 (100.0%) |
| 35 to 44 Years | 32 (100.0%) | 58 (100.0%) |
| 45 to 54 Years | 29 (100.0%) | 22 (100.0%) |
| 55 to 64 Years | 35 (92.1%) | 45 (91.8%) |
| 65 to 74 Years | 114 (97.4%) | 166 (92.2%) |
| 75 Years and over | 71 (96.0%) | 66 (100.0%) |
| Total | 402 (97.8%) | 442 (96.1%) |
Income Below Poverty Among Married-Couple Families in Arcadia Lakes
The poverty statistics for married-couple families in Arcadia Lakes show that 2.4% or 6 of the total 248 families live below the poverty line. Families with no children have the highest poverty rate of 3.1%, comprising of 6 families. On the other hand, families with 1 or 2 children have the lowest poverty rate of 0.0%, which includes 0 families.
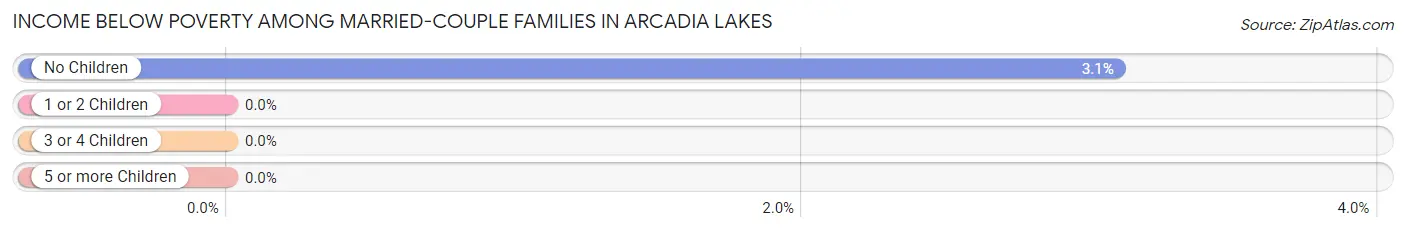
| Children | Above Poverty | Below Poverty |
| No Children | 188 (96.9%) | 6 (3.1%) |
| 1 or 2 Children | 27 (100.0%) | 0 (0.0%) |
| 3 or 4 Children | 27 (100.0%) | 0 (0.0%) |
| 5 or more Children | 0 (0.0%) | 0 (0.0%) |
| Total | 242 (97.6%) | 6 (2.4%) |
Income Below Poverty Among Single-Parent Households in Arcadia Lakes
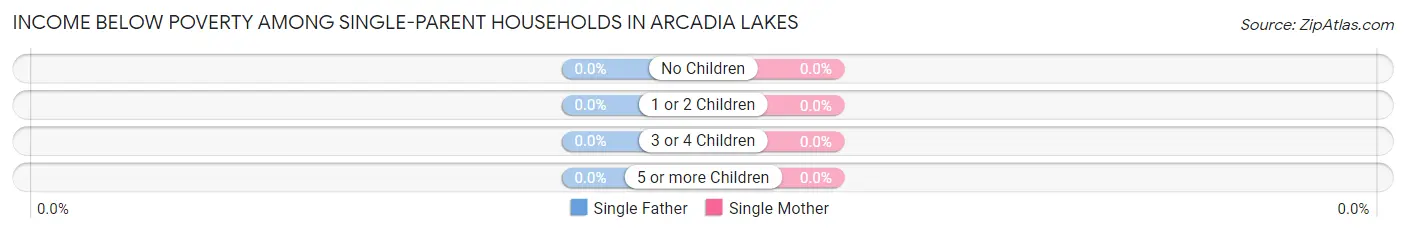
| Children | Single Father | Single Mother |
| No Children | 0 (0.0%) | 0 (0.0%) |
| 1 or 2 Children | 0 (0.0%) | 0 (0.0%) |
| 3 or 4 Children | 0 (0.0%) | 0 (0.0%) |
| 5 or more Children | 0 (0.0%) | 0 (0.0%) |
| Total | 0 (0.0%) | 0 (0.0%) |
Income Below Poverty Among Married-Couple vs Single-Parent Households in Arcadia Lakes
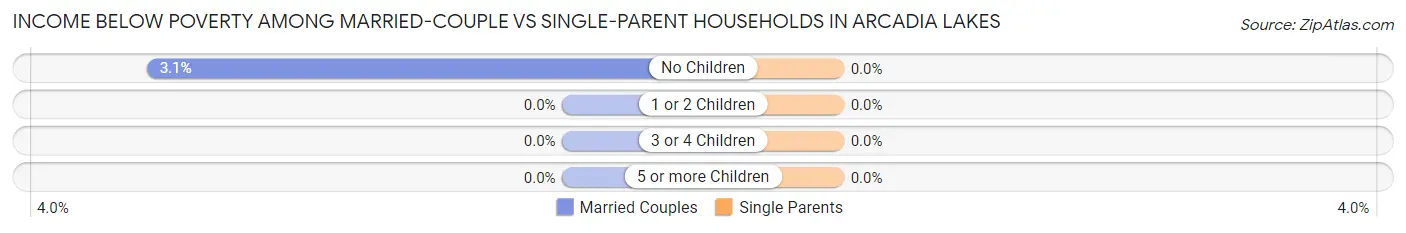
| Children | Married-Couple Families | Single-Parent Households |
| No Children | 6 (3.1%) | 0 (0.0%) |
| 1 or 2 Children | 0 (0.0%) | 0 (0.0%) |
| 3 or 4 Children | 0 (0.0%) | 0 (0.0%) |
| 5 or more Children | 0 (0.0%) | 0 (0.0%) |
| Total | 6 (2.4%) | 0 (0.0%) |
Employment Characteristics in Arcadia Lakes
Employment by Class of Employer in Arcadia Lakes
Among the 446 employed individuals in Arcadia Lakes, private company employees (264 | 59.2%), local government employees (51 | 11.4%), and not-for-profit organizations (38 | 8.5%) make up the most common classes of employment.
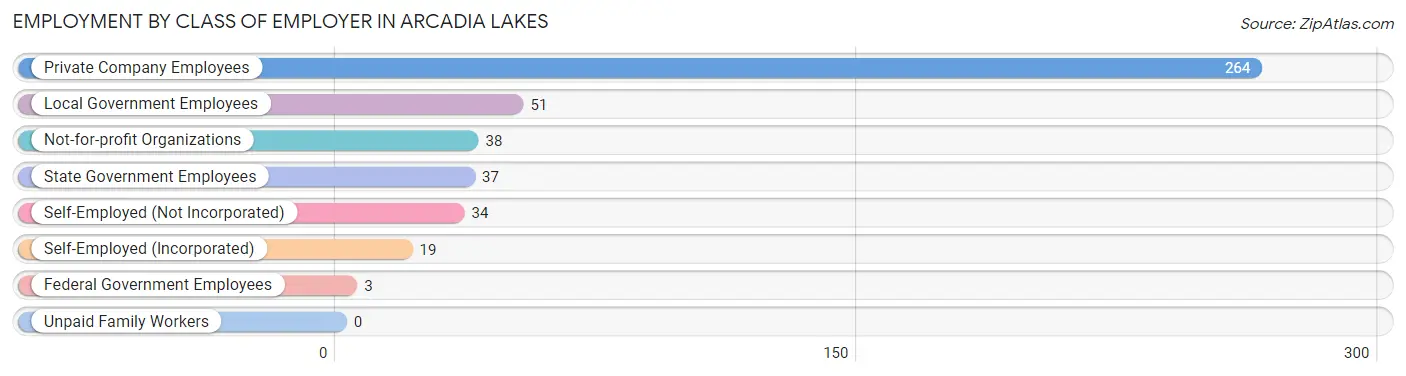
| Employer Class | # Employees | % Employees |
| Private Company Employees | 264 | 59.2% |
| Self-Employed (Incorporated) | 19 | 4.3% |
| Self-Employed (Not Incorporated) | 34 | 7.6% |
| Not-for-profit Organizations | 38 | 8.5% |
| Local Government Employees | 51 | 11.4% |
| State Government Employees | 37 | 8.3% |
| Federal Government Employees | 3 | 0.7% |
| Unpaid Family Workers | 0 | 0.0% |
| Total | 446 | 100.0% |
Employment Status by Age in Arcadia Lakes
According to the labor force statistics for Arcadia Lakes, out of the total population over 16 years of age (743), 61.2% or 455 individuals are in the labor force, with 0.9% or 4 of them unemployed. The age group with the highest labor force participation rate is 20 to 24 years, with 100.0% or 7 individuals in the labor force. Within the labor force, the 20 to 24 years age range has the highest percentage of unemployed individuals, with 57.1% or 4 of them being unemployed.
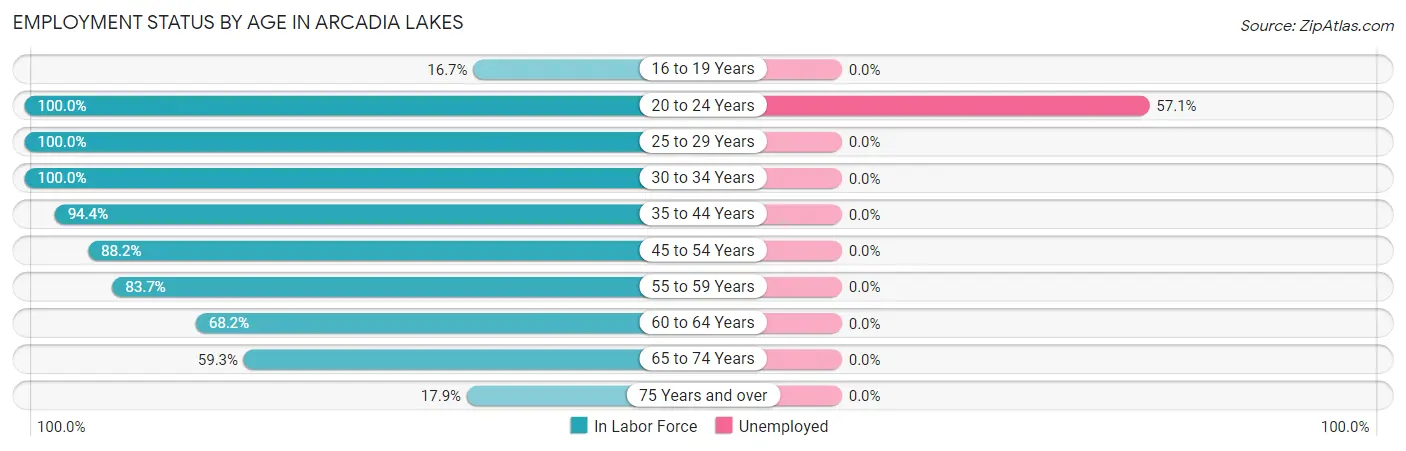
| Age Bracket | In Labor Force | Unemployed |
| 16 to 19 Years | 4 (16.7%) | 0 (0.0%) |
| 20 to 24 Years | 7 (100.0%) | 4 (57.1%) |
| 25 to 29 Years | 17 (100.0%) | 0 (0.0%) |
| 30 to 34 Years | 30 (100.0%) | 0 (0.0%) |
| 35 to 44 Years | 85 (94.4%) | 0 (0.0%) |
| 45 to 54 Years | 45 (88.2%) | 0 (0.0%) |
| 55 to 59 Years | 36 (83.7%) | 0 (0.0%) |
| 60 to 64 Years | 30 (68.2%) | 0 (0.0%) |
| 65 to 74 Years | 176 (59.3%) | 0 (0.0%) |
| 75 Years and over | 25 (17.9%) | 0 (0.0%) |
| Total | 455 (61.2%) | 4 (0.9%) |
Employment Status by Educational Attainment in Arcadia Lakes
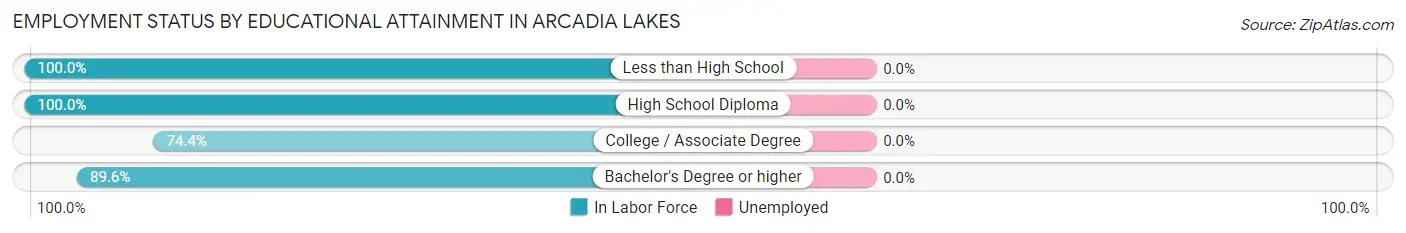
| Educational Attainment | In Labor Force | Unemployed |
| Less than High School | 7 (100.0%) | 0 (0.0%) |
| High School Diploma | 24 (100.0%) | 0 (0.0%) |
| College / Associate Degree | 32 (74.4%) | 0 (0.0%) |
| Bachelor's Degree or higher | 180 (89.6%) | 0 (0.0%) |
| Total | 243 (88.4%) | 0 (0.0%) |
Employment Occupations by Sex in Arcadia Lakes
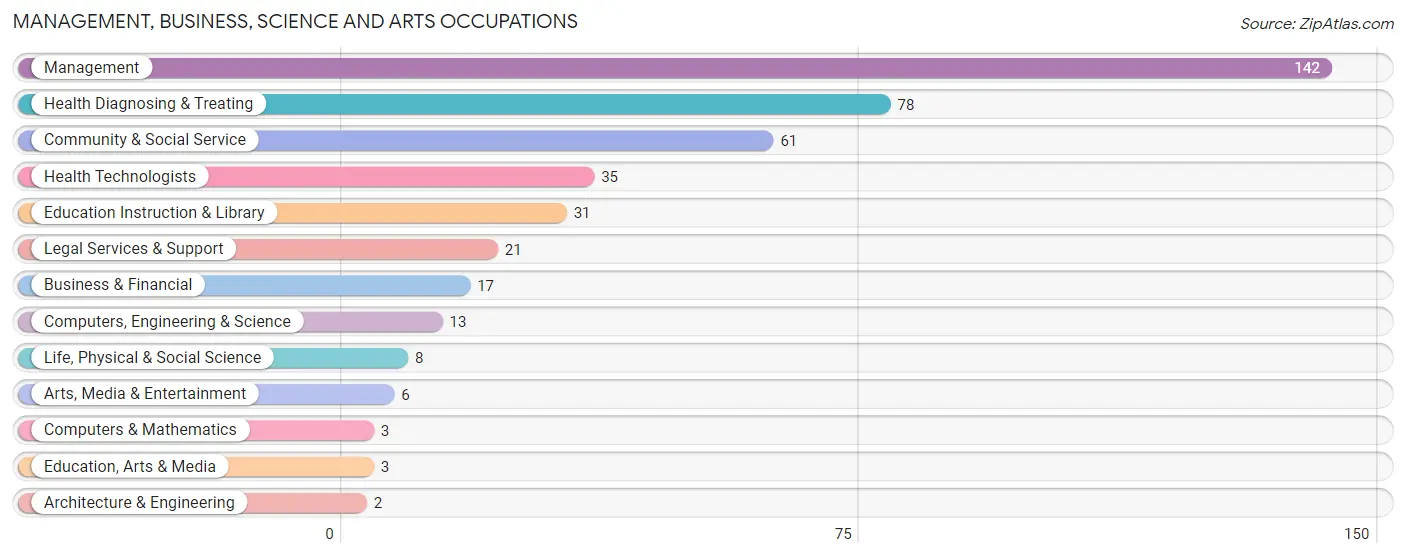
Management, Business, Science and Arts Occupations
The most common Management, Business, Science and Arts occupations in Arcadia Lakes are Management (142 | 31.5%), Health Diagnosing & Treating (78 | 17.3%), Community & Social Service (61 | 13.5%), Health Technologists (35 | 7.8%), and Education Instruction & Library (31 | 6.9%).
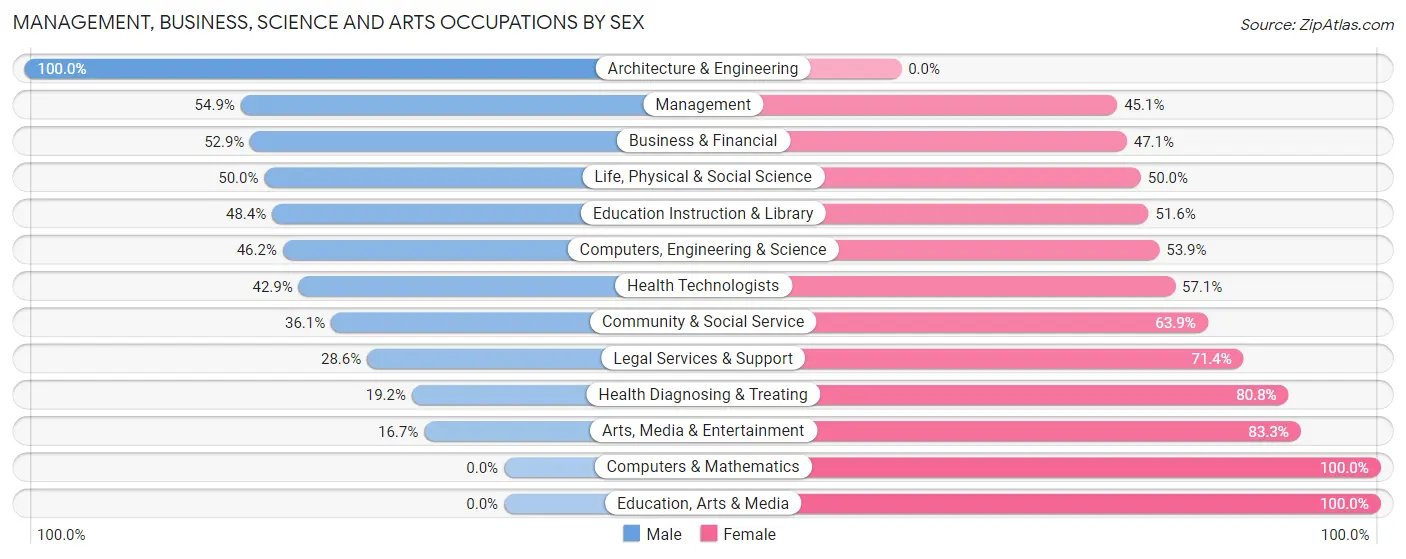
Management, Business, Science and Arts Occupations by Sex
Within the Management, Business, Science and Arts occupations in Arcadia Lakes, the most male-oriented occupations are Architecture & Engineering (100.0%), Management (54.9%), and Business & Financial (52.9%), while the most female-oriented occupations are Computers & Mathematics (100.0%), Education, Arts & Media (100.0%), and Arts, Media & Entertainment (83.3%).
| Occupation | Male | Female |
| Management | 78 (54.9%) | 64 (45.1%) |
| Business & Financial | 9 (52.9%) | 8 (47.1%) |
| Computers, Engineering & Science | 6 (46.2%) | 7 (53.8%) |
| Computers & Mathematics | 0 (0.0%) | 3 (100.0%) |
| Architecture & Engineering | 2 (100.0%) | 0 (0.0%) |
| Life, Physical & Social Science | 4 (50.0%) | 4 (50.0%) |
| Community & Social Service | 22 (36.1%) | 39 (63.9%) |
| Education, Arts & Media | 0 (0.0%) | 3 (100.0%) |
| Legal Services & Support | 6 (28.6%) | 15 (71.4%) |
| Education Instruction & Library | 15 (48.4%) | 16 (51.6%) |
| Arts, Media & Entertainment | 1 (16.7%) | 5 (83.3%) |
| Health Diagnosing & Treating | 15 (19.2%) | 63 (80.8%) |
| Health Technologists | 15 (42.9%) | 20 (57.1%) |
| Total (Category) | 130 (41.8%) | 181 (58.2%) |
| Total (Overall) | 214 (47.4%) | 237 (52.5%) |
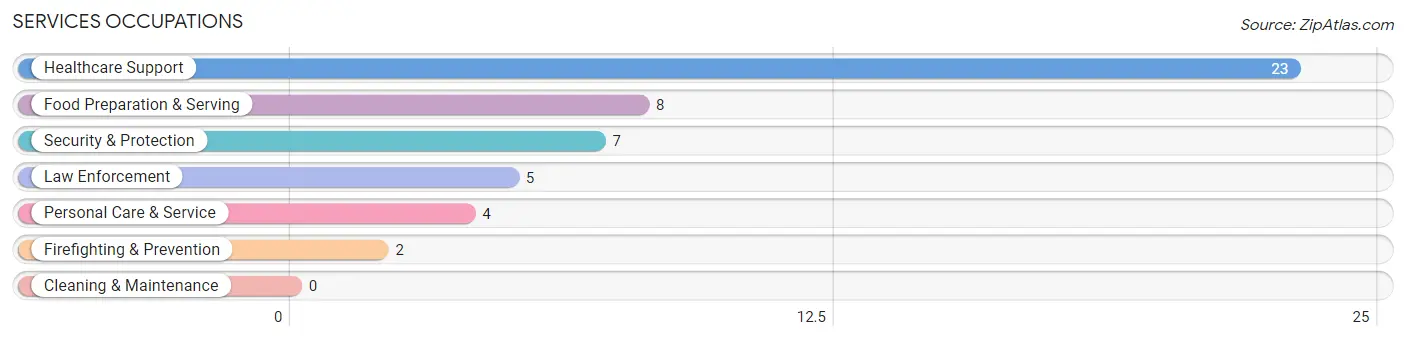
Services Occupations
The most common Services occupations in Arcadia Lakes are Healthcare Support (23 | 5.1%), Food Preparation & Serving (8 | 1.8%), Security & Protection (7 | 1.5%), Law Enforcement (5 | 1.1%), and Personal Care & Service (4 | 0.9%).
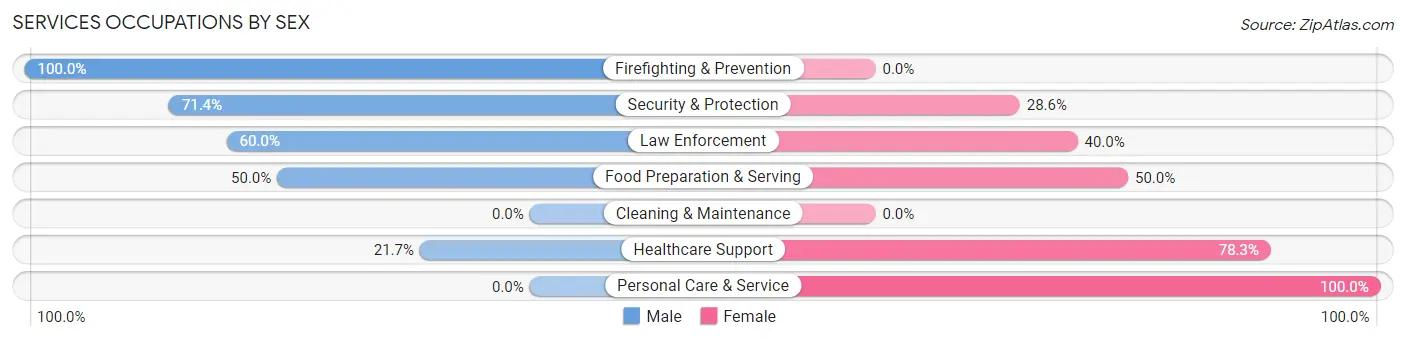
Services Occupations by Sex
Within the Services occupations in Arcadia Lakes, the most male-oriented occupations are Firefighting & Prevention (100.0%), Security & Protection (71.4%), and Law Enforcement (60.0%), while the most female-oriented occupations are Personal Care & Service (100.0%), Healthcare Support (78.3%), and Food Preparation & Serving (50.0%).
| Occupation | Male | Female |
| Healthcare Support | 5 (21.7%) | 18 (78.3%) |
| Security & Protection | 5 (71.4%) | 2 (28.6%) |
| Firefighting & Prevention | 2 (100.0%) | 0 (0.0%) |
| Law Enforcement | 3 (60.0%) | 2 (40.0%) |
| Food Preparation & Serving | 4 (50.0%) | 4 (50.0%) |
| Cleaning & Maintenance | 0 (0.0%) | 0 (0.0%) |
| Personal Care & Service | 0 (0.0%) | 4 (100.0%) |
| Total (Category) | 14 (33.3%) | 28 (66.7%) |
| Total (Overall) | 214 (47.4%) | 237 (52.5%) |
Sales and Office Occupations
The most common Sales and Office occupations in Arcadia Lakes are Sales & Related (32 | 7.1%), and Office & Administration (22 | 4.9%).
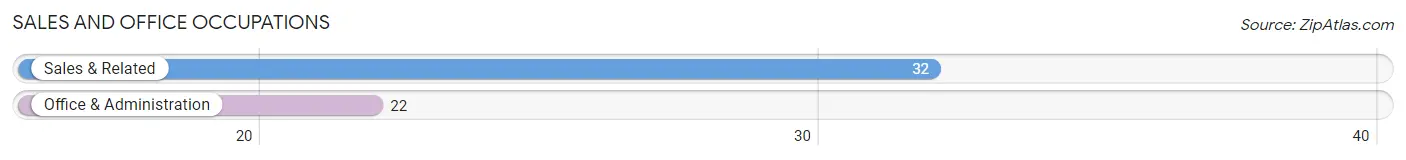
Sales and Office Occupations by Sex
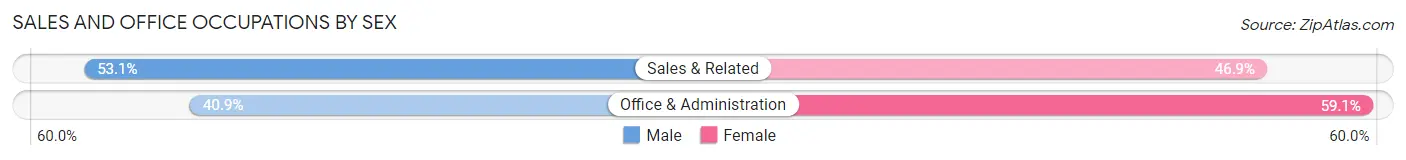
| Occupation | Male | Female |
| Sales & Related | 17 (53.1%) | 15 (46.9%) |
| Office & Administration | 9 (40.9%) | 13 (59.1%) |
| Total (Category) | 26 (48.1%) | 28 (51.8%) |
| Total (Overall) | 214 (47.4%) | 237 (52.5%) |
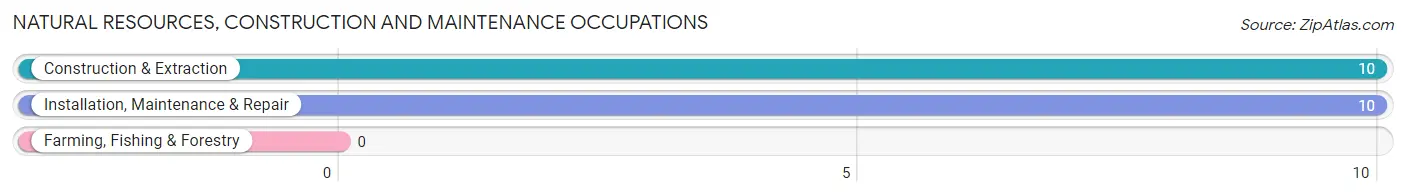
Natural Resources, Construction and Maintenance Occupations
The most common Natural Resources, Construction and Maintenance occupations in Arcadia Lakes are Construction & Extraction (10 | 2.2%), and Installation, Maintenance & Repair (10 | 2.2%).
Natural Resources, Construction and Maintenance Occupations by Sex
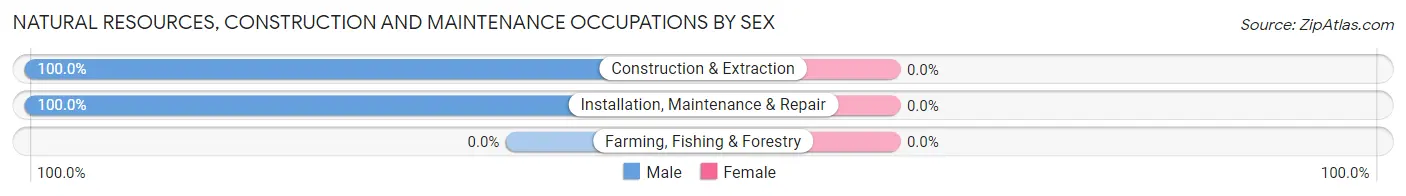
| Occupation | Male | Female |
| Farming, Fishing & Forestry | 0 (0.0%) | 0 (0.0%) |
| Construction & Extraction | 10 (100.0%) | 0 (0.0%) |
| Installation, Maintenance & Repair | 10 (100.0%) | 0 (0.0%) |
| Total (Category) | 20 (100.0%) | 0 (0.0%) |
| Total (Overall) | 214 (47.4%) | 237 (52.5%) |
Production, Transportation and Moving Occupations
The most common Production, Transportation and Moving occupations in Arcadia Lakes are Transportation (15 | 3.3%), Material Moving (7 | 1.5%), and Production (2 | 0.4%).
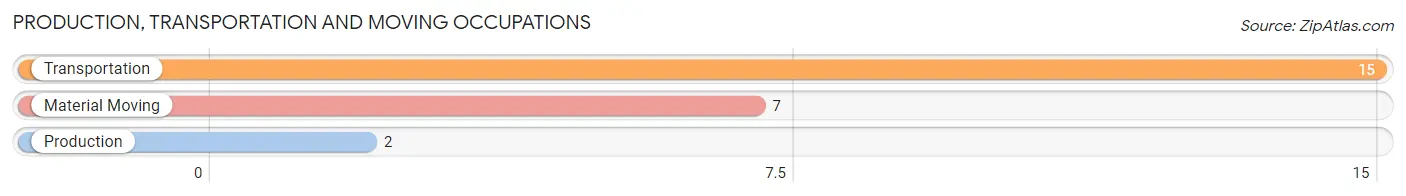
Production, Transportation and Moving Occupations by Sex
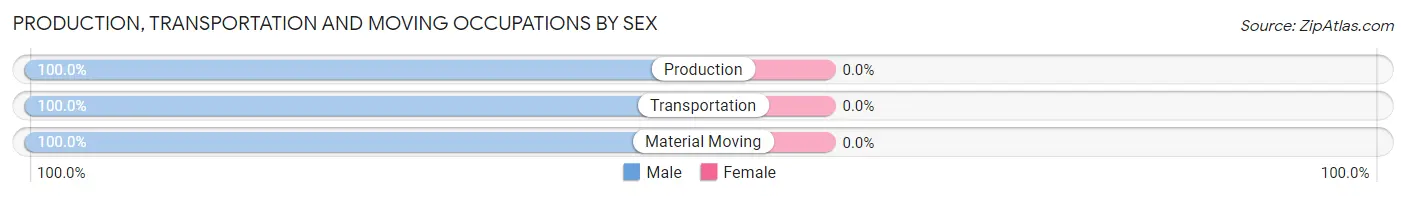
| Occupation | Male | Female |
| Production | 2 (100.0%) | 0 (0.0%) |
| Transportation | 15 (100.0%) | 0 (0.0%) |
| Material Moving | 7 (100.0%) | 0 (0.0%) |
| Total (Category) | 24 (100.0%) | 0 (0.0%) |
| Total (Overall) | 214 (47.4%) | 237 (52.5%) |
Employment Industries by Sex in Arcadia Lakes
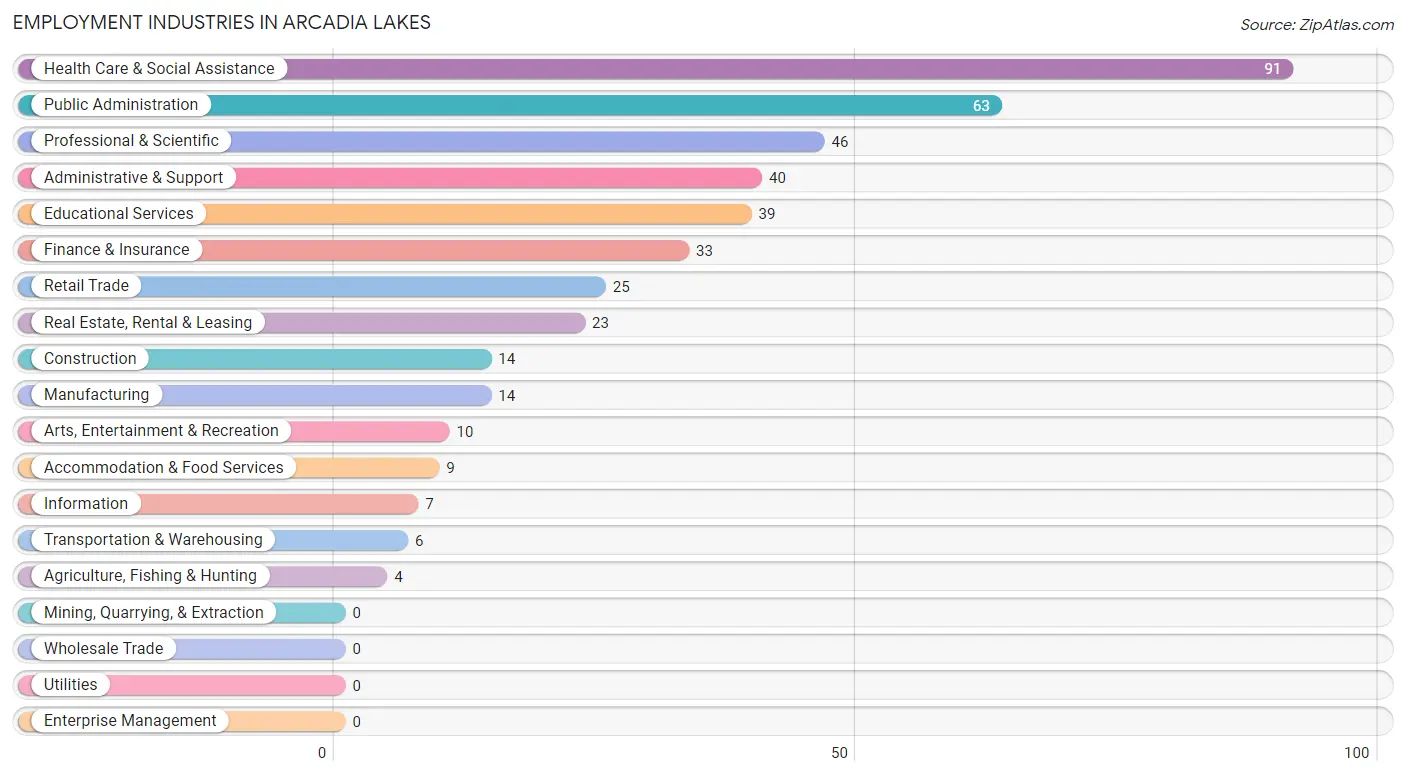
Employment Industries in Arcadia Lakes
The major employment industries in Arcadia Lakes include Health Care & Social Assistance (91 | 20.2%), Public Administration (63 | 14.0%), Professional & Scientific (46 | 10.2%), Administrative & Support (40 | 8.9%), and Educational Services (39 | 8.6%).
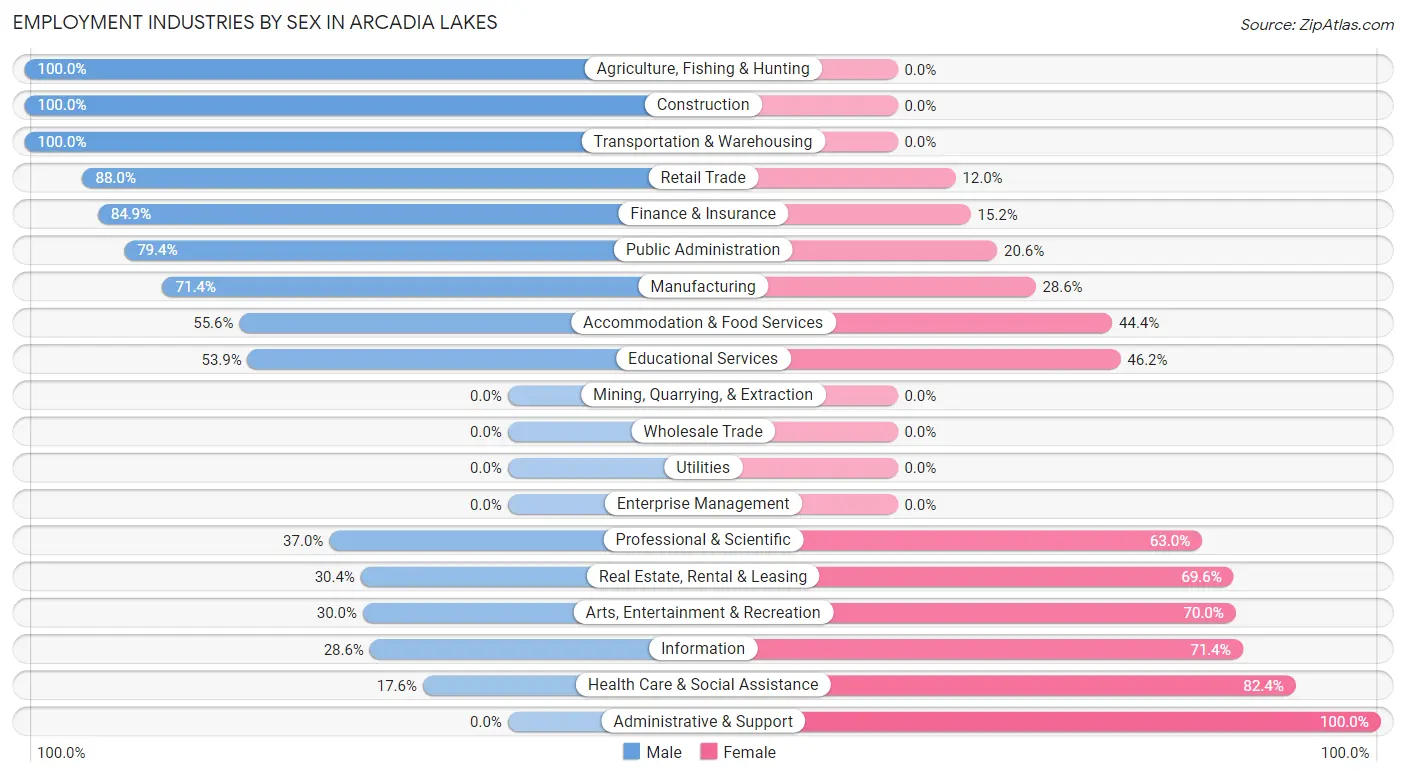
Employment Industries by Sex in Arcadia Lakes
The Arcadia Lakes industries that see more men than women are Agriculture, Fishing & Hunting (100.0%), Construction (100.0%), and Transportation & Warehousing (100.0%), whereas the industries that tend to have a higher number of women are Administrative & Support (100.0%), Health Care & Social Assistance (82.4%), and Information (71.4%).
| Industry | Male | Female |
| Agriculture, Fishing & Hunting | 4 (100.0%) | 0 (0.0%) |
| Mining, Quarrying, & Extraction | 0 (0.0%) | 0 (0.0%) |
| Construction | 14 (100.0%) | 0 (0.0%) |
| Manufacturing | 10 (71.4%) | 4 (28.6%) |
| Wholesale Trade | 0 (0.0%) | 0 (0.0%) |
| Retail Trade | 22 (88.0%) | 3 (12.0%) |
| Transportation & Warehousing | 6 (100.0%) | 0 (0.0%) |
| Utilities | 0 (0.0%) | 0 (0.0%) |
| Information | 2 (28.6%) | 5 (71.4%) |
| Finance & Insurance | 28 (84.9%) | 5 (15.1%) |
| Real Estate, Rental & Leasing | 7 (30.4%) | 16 (69.6%) |
| Professional & Scientific | 17 (37.0%) | 29 (63.0%) |
| Enterprise Management | 0 (0.0%) | 0 (0.0%) |
| Administrative & Support | 0 (0.0%) | 40 (100.0%) |
| Educational Services | 21 (53.8%) | 18 (46.2%) |
| Health Care & Social Assistance | 16 (17.6%) | 75 (82.4%) |
| Arts, Entertainment & Recreation | 3 (30.0%) | 7 (70.0%) |
| Accommodation & Food Services | 5 (55.6%) | 4 (44.4%) |
| Public Administration | 50 (79.4%) | 13 (20.6%) |
| Total | 214 (47.4%) | 237 (52.5%) |
Education in Arcadia Lakes
School Enrollment in Arcadia Lakes
The most common levels of schooling among the 137 students in Arcadia Lakes are elementary school (44 | 32.1%), high school (35 | 25.6%), and kindergarten (24 | 17.5%).
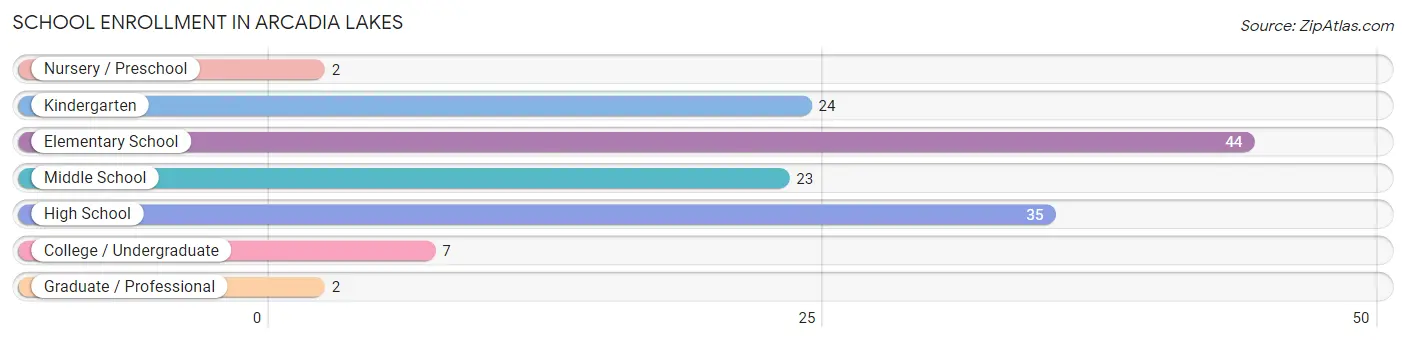
| School Level | # Students | % Students |
| Nursery / Preschool | 2 | 1.5% |
| Kindergarten | 24 | 17.5% |
| Elementary School | 44 | 32.1% |
| Middle School | 23 | 16.8% |
| High School | 35 | 25.6% |
| College / Undergraduate | 7 | 5.1% |
| Graduate / Professional | 2 | 1.5% |
| Total | 137 | 100.0% |
School Enrollment by Age by Funding Source in Arcadia Lakes
Out of a total of 137 students who are enrolled in schools in Arcadia Lakes, 58 (42.3%) attend a private institution, while the remaining 79 (57.7%) are enrolled in public schools. The age group of 3 to 4 year olds has the highest likelihood of being enrolled in private schools, with 2 (100.0% in the age bracket) enrolled. Conversely, the age group of 18 to 19 year olds has the lowest likelihood of being enrolled in a private school, with 4 (100.0% in the age bracket) attending a public institution.
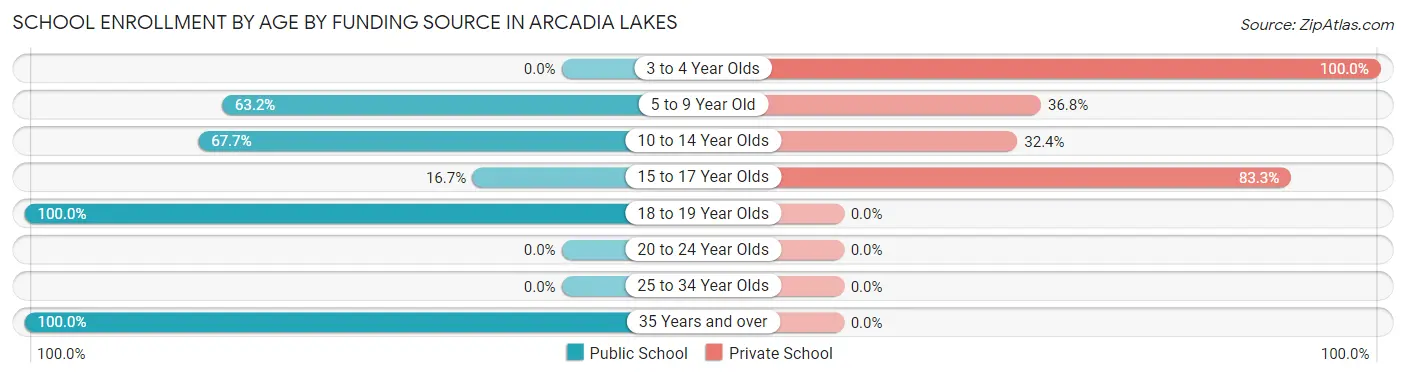
| Age Bracket | Public School | Private School |
| 3 to 4 Year Olds | 0 (0.0%) | 2 (100.0%) |
| 5 to 9 Year Old | 43 (63.2%) | 25 (36.8%) |
| 10 to 14 Year Olds | 23 (67.6%) | 11 (32.4%) |
| 15 to 17 Year Olds | 4 (16.7%) | 20 (83.3%) |
| 18 to 19 Year Olds | 4 (100.0%) | 0 (0.0%) |
| 20 to 24 Year Olds | 0 (0.0%) | 0 (0.0%) |
| 25 to 34 Year Olds | 0 (0.0%) | 0 (0.0%) |
| 35 Years and over | 5 (100.0%) | 0 (0.0%) |
| Total | 79 (57.7%) | 58 (42.3%) |
Educational Attainment by Field of Study in Arcadia Lakes
Education (101 | 18.4%), business (69 | 12.6%), computers & mathematics (63 | 11.5%), liberal arts & history (61 | 11.1%), and literature & languages (55 | 10.0%) are the most common fields of study among 549 individuals in Arcadia Lakes who have obtained a bachelor's degree or higher.
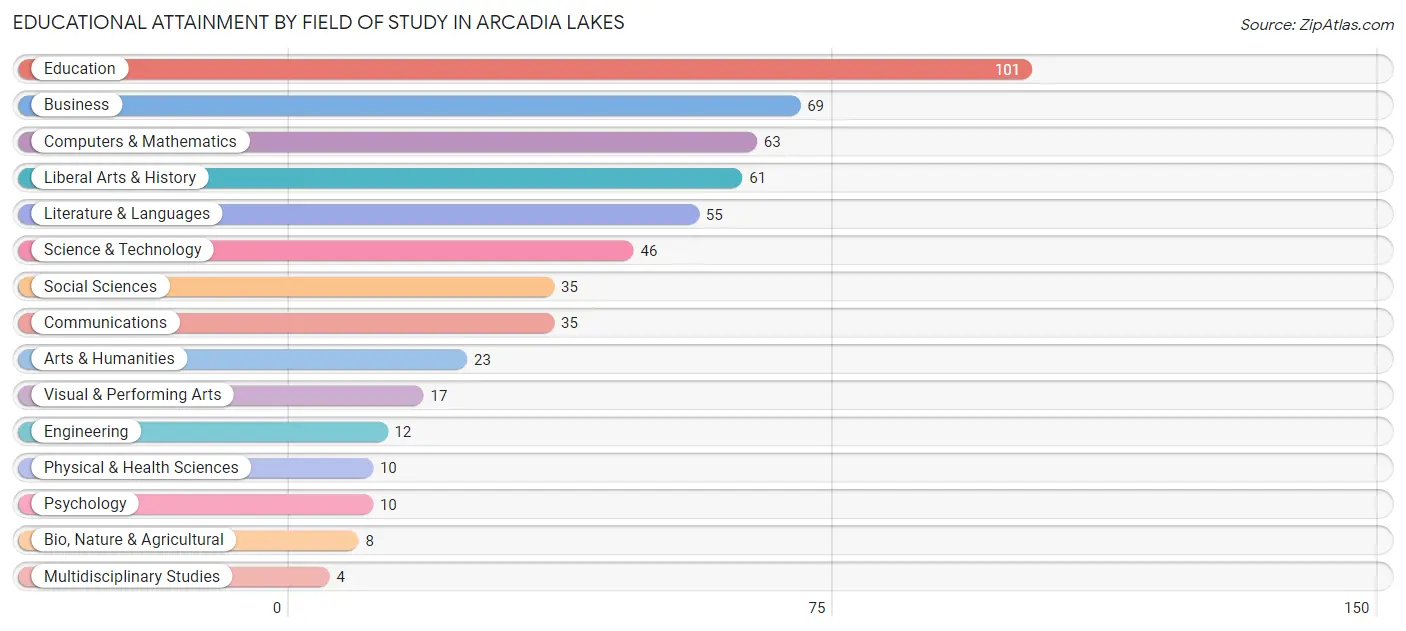
| Field of Study | # Graduates | % Graduates |
| Computers & Mathematics | 63 | 11.5% |
| Bio, Nature & Agricultural | 8 | 1.5% |
| Physical & Health Sciences | 10 | 1.8% |
| Psychology | 10 | 1.8% |
| Social Sciences | 35 | 6.4% |
| Engineering | 12 | 2.2% |
| Multidisciplinary Studies | 4 | 0.7% |
| Science & Technology | 46 | 8.4% |
| Business | 69 | 12.6% |
| Education | 101 | 18.4% |
| Literature & Languages | 55 | 10.0% |
| Liberal Arts & History | 61 | 11.1% |
| Visual & Performing Arts | 17 | 3.1% |
| Communications | 35 | 6.4% |
| Arts & Humanities | 23 | 4.2% |
| Total | 549 | 100.0% |
Transportation & Commute in Arcadia Lakes
Vehicle Availability by Sex in Arcadia Lakes
The most prevalent vehicle ownership categories in Arcadia Lakes are males with 2 vehicles (146, accounting for 69.2%) and females with 2 vehicles (165, making up 62.1%).
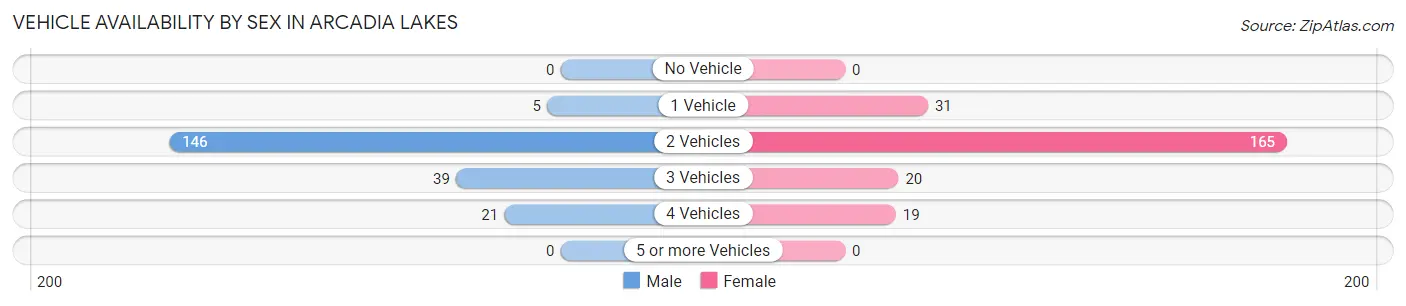
| Vehicles Available | Male | Female |
| No Vehicle | 0 (0.0%) | 0 (0.0%) |
| 1 Vehicle | 5 (2.4%) | 31 (13.2%) |
| 2 Vehicles | 146 (69.2%) | 165 (70.2%) |
| 3 Vehicles | 39 (18.5%) | 20 (8.5%) |
| 4 Vehicles | 21 (10.0%) | 19 (8.1%) |
| 5 or more Vehicles | 0 (0.0%) | 0 (0.0%) |
| Total | 211 (100.0%) | 235 (100.0%) |
Commute Time in Arcadia Lakes
The most frequently occuring commute durations in Arcadia Lakes are 15 to 19 minutes (114 commuters, 35.5%), 20 to 24 minutes (101 commuters, 31.5%), and 5 to 9 minutes (30 commuters, 9.3%).
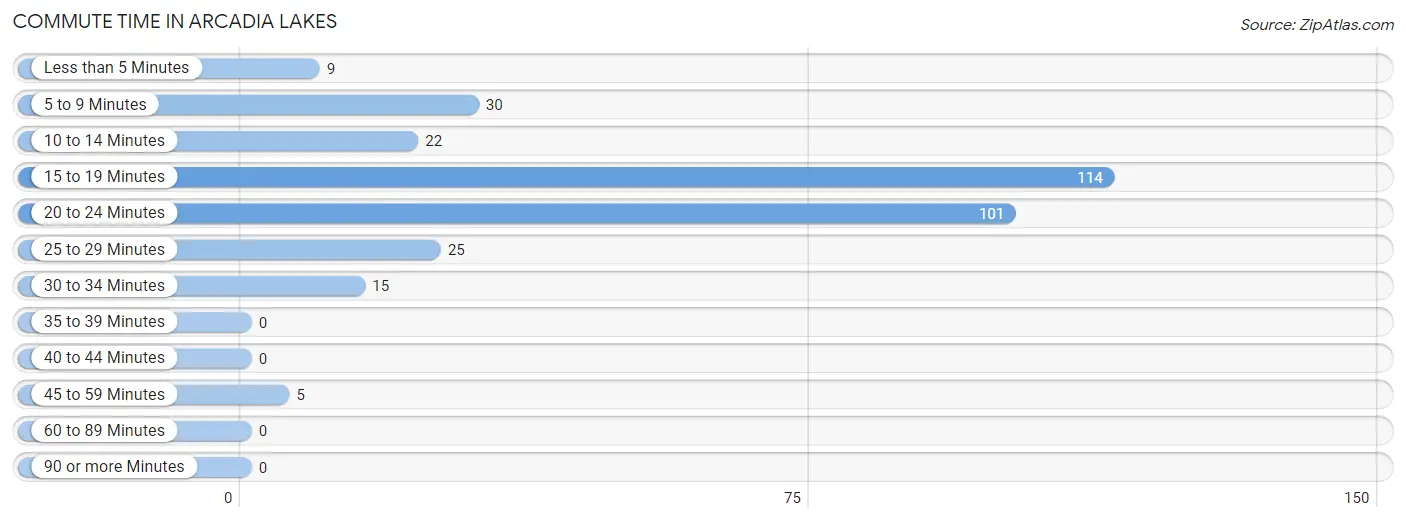
| Commute Time | # Commuters | % Commuters |
| Less than 5 Minutes | 9 | 2.8% |
| 5 to 9 Minutes | 30 | 9.3% |
| 10 to 14 Minutes | 22 | 6.9% |
| 15 to 19 Minutes | 114 | 35.5% |
| 20 to 24 Minutes | 101 | 31.5% |
| 25 to 29 Minutes | 25 | 7.8% |
| 30 to 34 Minutes | 15 | 4.7% |
| 35 to 39 Minutes | 0 | 0.0% |
| 40 to 44 Minutes | 0 | 0.0% |
| 45 to 59 Minutes | 5 | 1.6% |
| 60 to 89 Minutes | 0 | 0.0% |
| 90 or more Minutes | 0 | 0.0% |
Commute Time by Sex in Arcadia Lakes
The most common commute times in Arcadia Lakes are 20 to 24 minutes (70 commuters, 48.3%) for males and 15 to 19 minutes (84 commuters, 47.7%) for females.
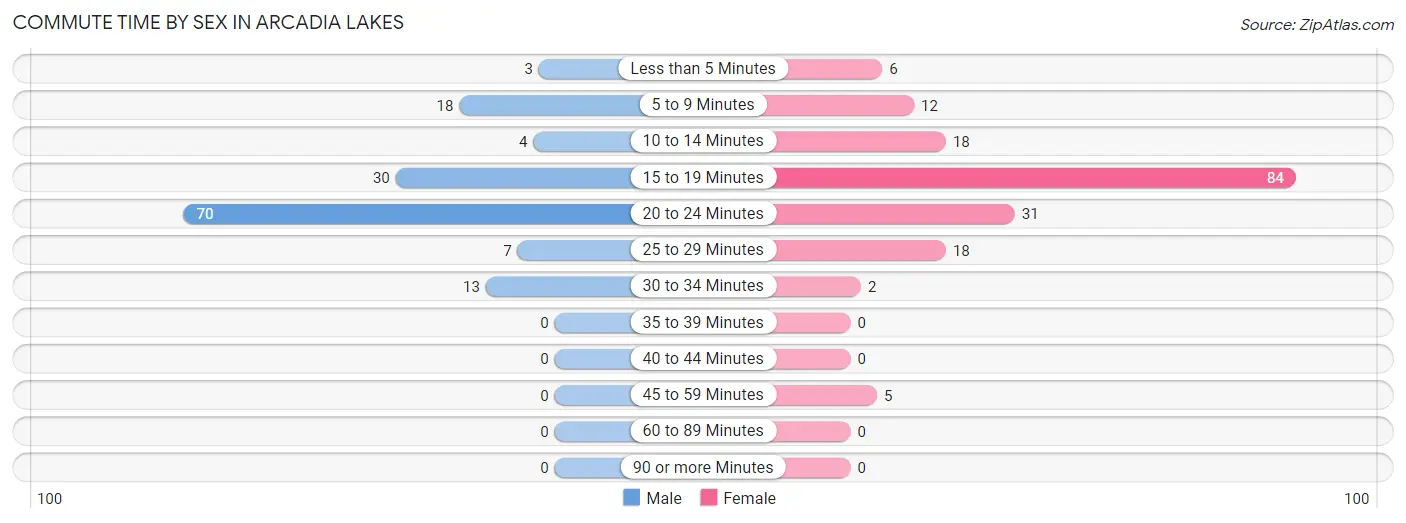
| Commute Time | Male | Female |
| Less than 5 Minutes | 3 (2.1%) | 6 (3.4%) |
| 5 to 9 Minutes | 18 (12.4%) | 12 (6.8%) |
| 10 to 14 Minutes | 4 (2.8%) | 18 (10.2%) |
| 15 to 19 Minutes | 30 (20.7%) | 84 (47.7%) |
| 20 to 24 Minutes | 70 (48.3%) | 31 (17.6%) |
| 25 to 29 Minutes | 7 (4.8%) | 18 (10.2%) |
| 30 to 34 Minutes | 13 (9.0%) | 2 (1.1%) |
| 35 to 39 Minutes | 0 (0.0%) | 0 (0.0%) |
| 40 to 44 Minutes | 0 (0.0%) | 0 (0.0%) |
| 45 to 59 Minutes | 0 (0.0%) | 5 (2.8%) |
| 60 to 89 Minutes | 0 (0.0%) | 0 (0.0%) |
| 90 or more Minutes | 0 (0.0%) | 0 (0.0%) |
Time of Departure to Work by Sex in Arcadia Lakes
The most frequent times of departure to work in Arcadia Lakes are 8:00 AM to 8:29 AM (29, 20.0%) for males and 7:00 AM to 7:29 AM (50, 28.4%) for females.
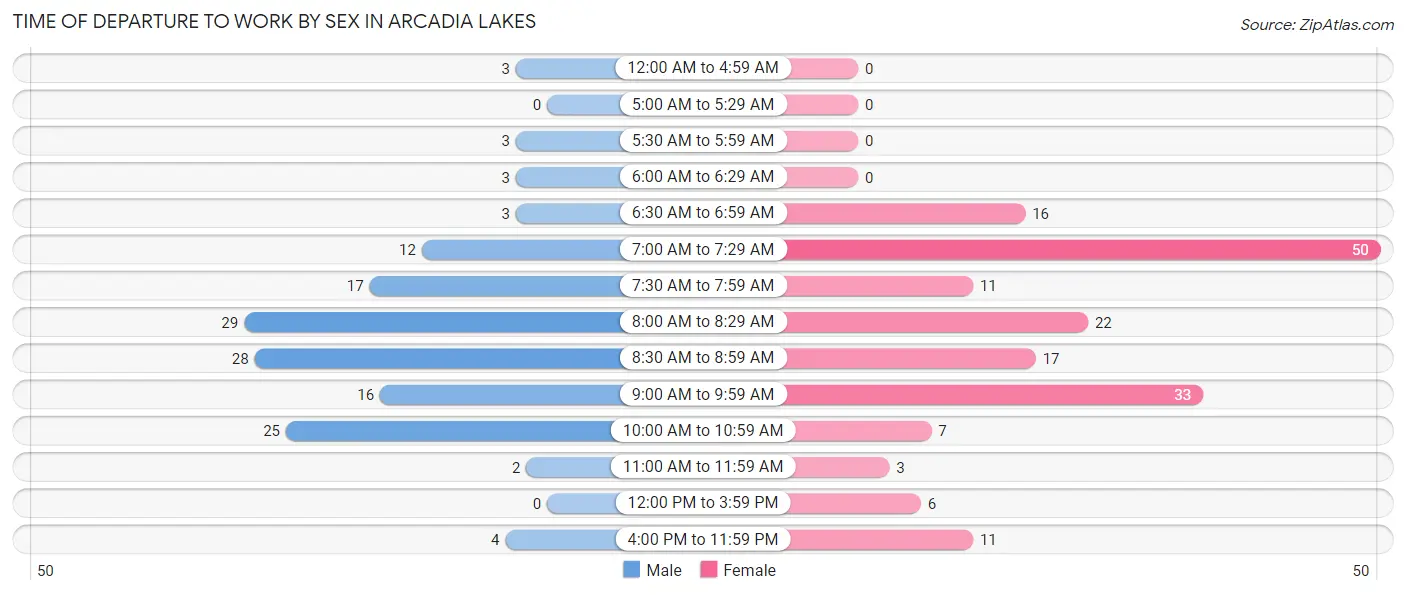
| Time of Departure | Male | Female |
| 12:00 AM to 4:59 AM | 3 (2.1%) | 0 (0.0%) |
| 5:00 AM to 5:29 AM | 0 (0.0%) | 0 (0.0%) |
| 5:30 AM to 5:59 AM | 3 (2.1%) | 0 (0.0%) |
| 6:00 AM to 6:29 AM | 3 (2.1%) | 0 (0.0%) |
| 6:30 AM to 6:59 AM | 3 (2.1%) | 16 (9.1%) |
| 7:00 AM to 7:29 AM | 12 (8.3%) | 50 (28.4%) |
| 7:30 AM to 7:59 AM | 17 (11.7%) | 11 (6.2%) |
| 8:00 AM to 8:29 AM | 29 (20.0%) | 22 (12.5%) |
| 8:30 AM to 8:59 AM | 28 (19.3%) | 17 (9.7%) |
| 9:00 AM to 9:59 AM | 16 (11.0%) | 33 (18.8%) |
| 10:00 AM to 10:59 AM | 25 (17.2%) | 7 (4.0%) |
| 11:00 AM to 11:59 AM | 2 (1.4%) | 3 (1.7%) |
| 12:00 PM to 3:59 PM | 0 (0.0%) | 6 (3.4%) |
| 4:00 PM to 11:59 PM | 4 (2.8%) | 11 (6.2%) |
| Total | 145 (100.0%) | 176 (100.0%) |
Housing Occupancy in Arcadia Lakes
Occupancy by Ownership in Arcadia Lakes
Of the total 399 dwellings in Arcadia Lakes, owner-occupied units account for 369 (92.5%), while renter-occupied units make up 30 (7.5%).
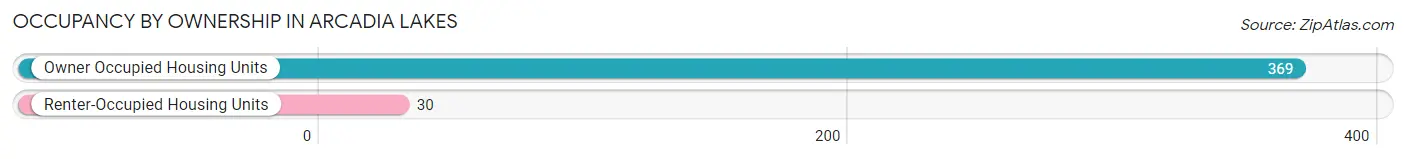
| Occupancy | # Housing Units | % Housing Units |
| Owner Occupied Housing Units | 369 | 92.5% |
| Renter-Occupied Housing Units | 30 | 7.5% |
| Total Occupied Housing Units | 399 | 100.0% |
Occupancy by Household Size in Arcadia Lakes
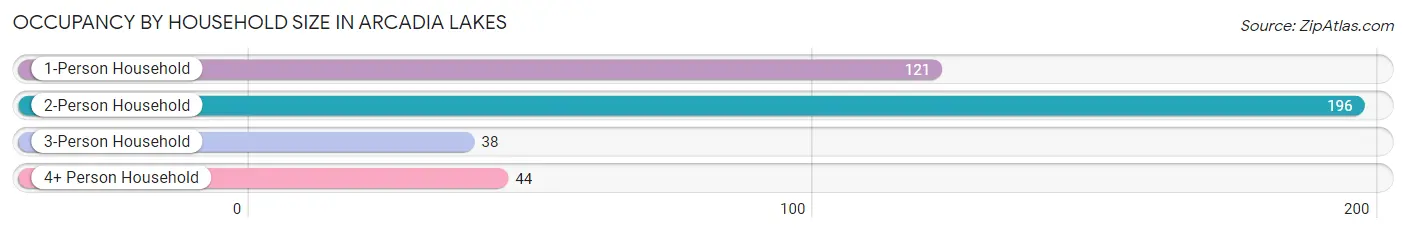
| Household Size | # Housing Units | % Housing Units |
| 1-Person Household | 121 | 30.3% |
| 2-Person Household | 196 | 49.1% |
| 3-Person Household | 38 | 9.5% |
| 4+ Person Household | 44 | 11.0% |
| Total Housing Units | 399 | 100.0% |
Occupancy by Ownership by Household Size in Arcadia Lakes
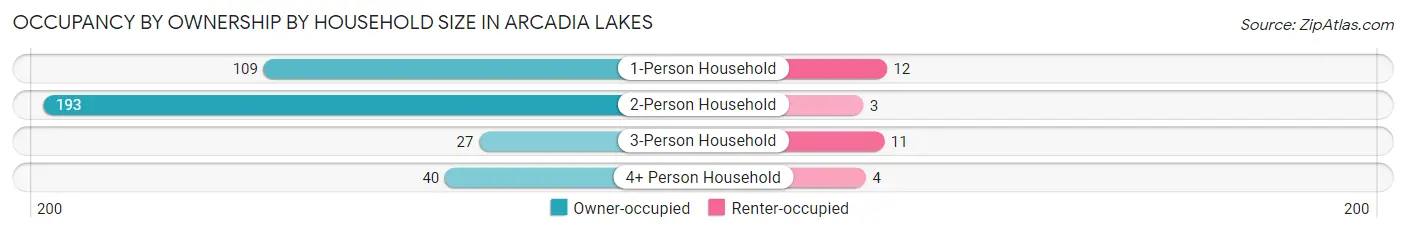
| Household Size | Owner-occupied | Renter-occupied |
| 1-Person Household | 109 (90.1%) | 12 (9.9%) |
| 2-Person Household | 193 (98.5%) | 3 (1.5%) |
| 3-Person Household | 27 (71.1%) | 11 (28.9%) |
| 4+ Person Household | 40 (90.9%) | 4 (9.1%) |
| Total Housing Units | 369 (92.5%) | 30 (7.5%) |
Occupancy by Educational Attainment in Arcadia Lakes
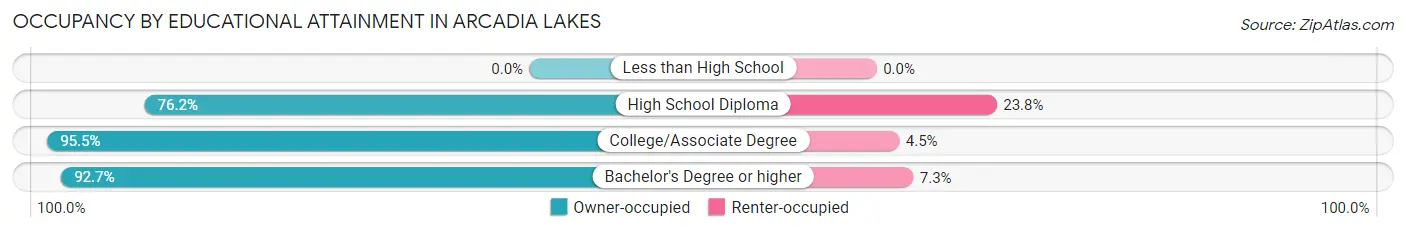
| Household Size | Owner-occupied | Renter-occupied |
| Less than High School | 0 (0.0%) | 0 (0.0%) |
| High School Diploma | 16 (76.2%) | 5 (23.8%) |
| College/Associate Degree | 85 (95.5%) | 4 (4.5%) |
| Bachelor's Degree or higher | 268 (92.7%) | 21 (7.3%) |
Occupancy by Age of Householder in Arcadia Lakes
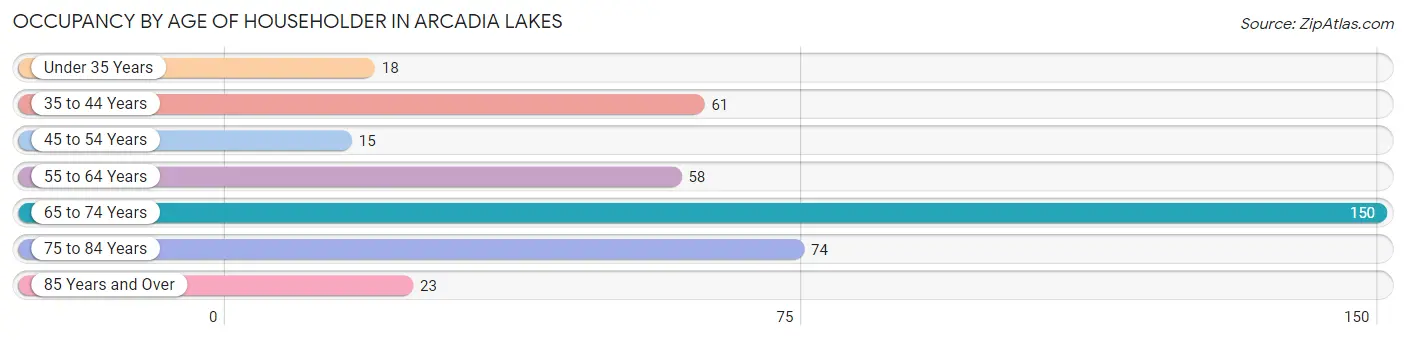
| Age Bracket | # Households | % Households |
| Under 35 Years | 18 | 4.5% |
| 35 to 44 Years | 61 | 15.3% |
| 45 to 54 Years | 15 | 3.8% |
| 55 to 64 Years | 58 | 14.5% |
| 65 to 74 Years | 150 | 37.6% |
| 75 to 84 Years | 74 | 18.5% |
| 85 Years and Over | 23 | 5.8% |
| Total | 399 | 100.0% |
Housing Finances in Arcadia Lakes
Median Income by Occupancy in Arcadia Lakes
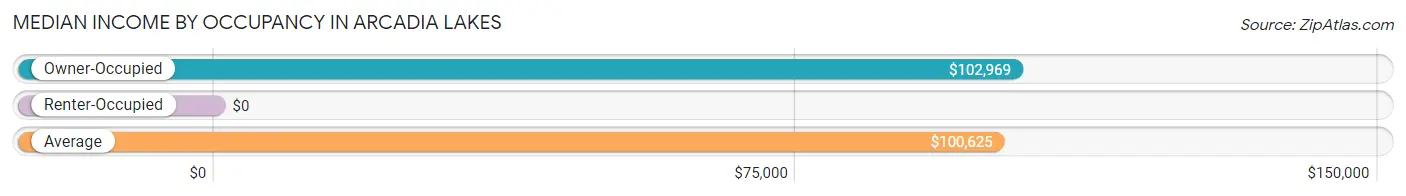
| Occupancy Type | # Households | Median Income |
| Owner-Occupied | 369 (92.5%) | $102,969 |
| Renter-Occupied | 30 (7.5%) | $0 |
| Average | 399 (100.0%) | $100,625 |
Occupancy by Householder Income Bracket in Arcadia Lakes
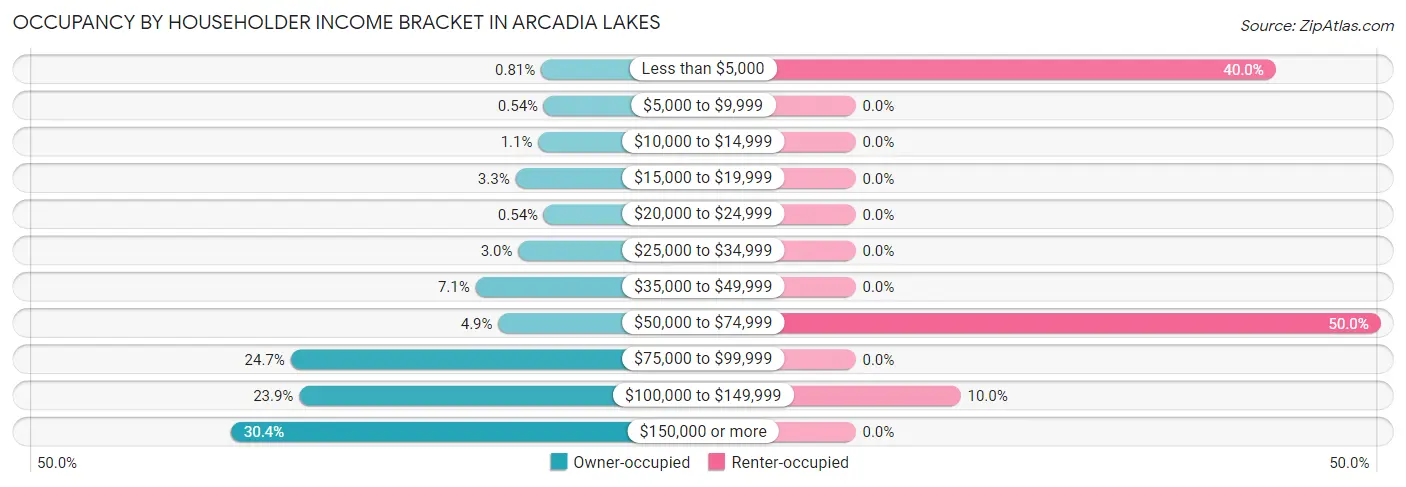
| Income Bracket | Owner-occupied | Renter-occupied |
| Less than $5,000 | 3 (0.8%) | 12 (40.0%) |
| $5,000 to $9,999 | 2 (0.5%) | 0 (0.0%) |
| $10,000 to $14,999 | 4 (1.1%) | 0 (0.0%) |
| $15,000 to $19,999 | 12 (3.3%) | 0 (0.0%) |
| $20,000 to $24,999 | 2 (0.5%) | 0 (0.0%) |
| $25,000 to $34,999 | 11 (3.0%) | 0 (0.0%) |
| $35,000 to $49,999 | 26 (7.0%) | 0 (0.0%) |
| $50,000 to $74,999 | 18 (4.9%) | 15 (50.0%) |
| $75,000 to $99,999 | 91 (24.7%) | 0 (0.0%) |
| $100,000 to $149,999 | 88 (23.8%) | 3 (10.0%) |
| $150,000 or more | 112 (30.3%) | 0 (0.0%) |
| Total | 369 (100.0%) | 30 (100.0%) |
Monthly Housing Cost Tiers in Arcadia Lakes
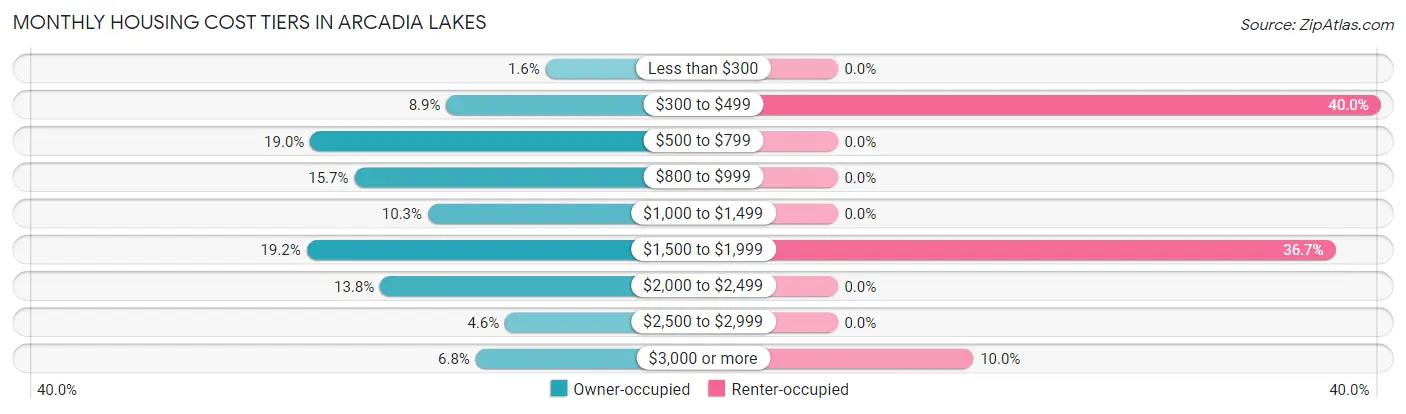
| Monthly Cost | Owner-occupied | Renter-occupied |
| Less than $300 | 6 (1.6%) | 0 (0.0%) |
| $300 to $499 | 33 (8.9%) | 12 (40.0%) |
| $500 to $799 | 70 (19.0%) | 0 (0.0%) |
| $800 to $999 | 58 (15.7%) | 0 (0.0%) |
| $1,000 to $1,499 | 38 (10.3%) | 0 (0.0%) |
| $1,500 to $1,999 | 71 (19.2%) | 11 (36.7%) |
| $2,000 to $2,499 | 51 (13.8%) | 0 (0.0%) |
| $2,500 to $2,999 | 17 (4.6%) | 0 (0.0%) |
| $3,000 or more | 25 (6.8%) | 3 (10.0%) |
| Total | 369 (100.0%) | 30 (100.0%) |
Physical Housing Characteristics in Arcadia Lakes
Housing Structures in Arcadia Lakes
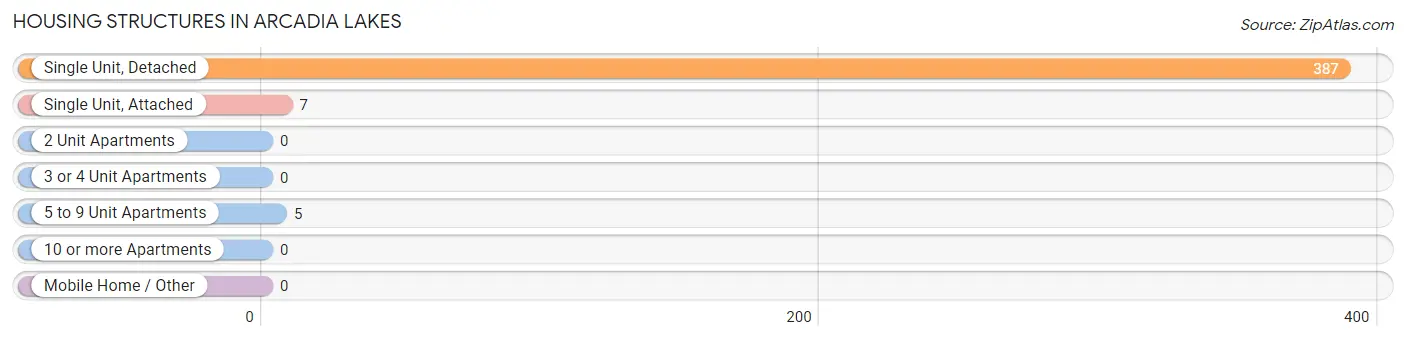
| Structure Type | # Housing Units | % Housing Units |
| Single Unit, Detached | 387 | 97.0% |
| Single Unit, Attached | 7 | 1.8% |
| 2 Unit Apartments | 0 | 0.0% |
| 3 or 4 Unit Apartments | 0 | 0.0% |
| 5 to 9 Unit Apartments | 5 | 1.3% |
| 10 or more Apartments | 0 | 0.0% |
| Mobile Home / Other | 0 | 0.0% |
| Total | 399 | 100.0% |
Housing Structures by Occupancy in Arcadia Lakes
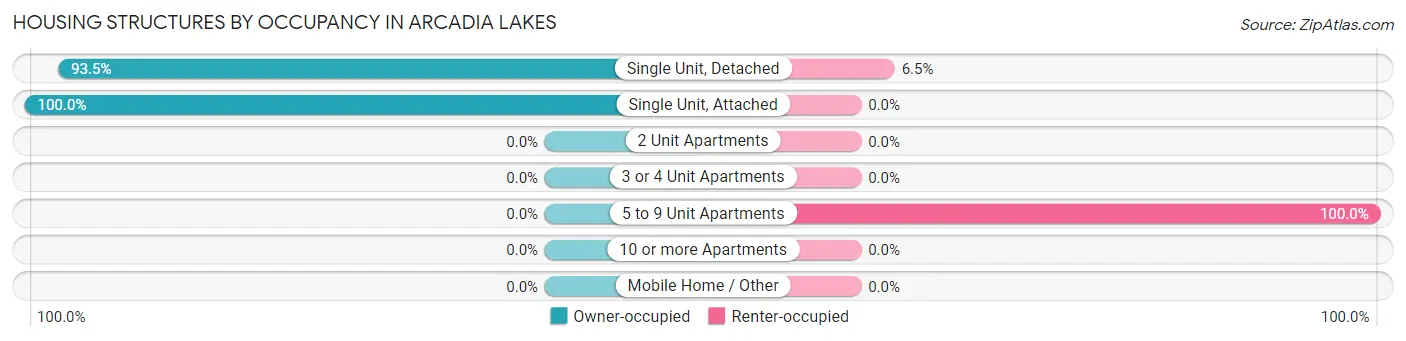
| Structure Type | Owner-occupied | Renter-occupied |
| Single Unit, Detached | 362 (93.5%) | 25 (6.5%) |
| Single Unit, Attached | 7 (100.0%) | 0 (0.0%) |
| 2 Unit Apartments | 0 (0.0%) | 0 (0.0%) |
| 3 or 4 Unit Apartments | 0 (0.0%) | 0 (0.0%) |
| 5 to 9 Unit Apartments | 0 (0.0%) | 5 (100.0%) |
| 10 or more Apartments | 0 (0.0%) | 0 (0.0%) |
| Mobile Home / Other | 0 (0.0%) | 0 (0.0%) |
| Total | 369 (92.5%) | 30 (7.5%) |
Housing Structures by Number of Rooms in Arcadia Lakes
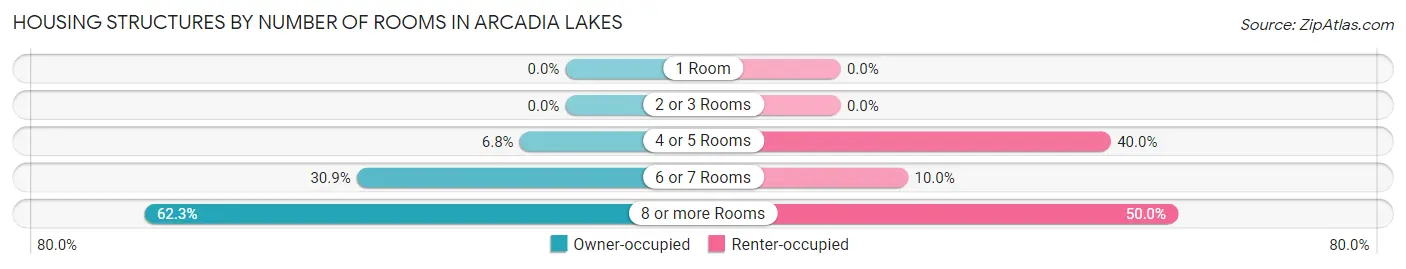
| Number of Rooms | Owner-occupied | Renter-occupied |
| 1 Room | 0 (0.0%) | 0 (0.0%) |
| 2 or 3 Rooms | 0 (0.0%) | 0 (0.0%) |
| 4 or 5 Rooms | 25 (6.8%) | 12 (40.0%) |
| 6 or 7 Rooms | 114 (30.9%) | 3 (10.0%) |
| 8 or more Rooms | 230 (62.3%) | 15 (50.0%) |
| Total | 369 (100.0%) | 30 (100.0%) |
Housing Structure by Heating Type in Arcadia Lakes
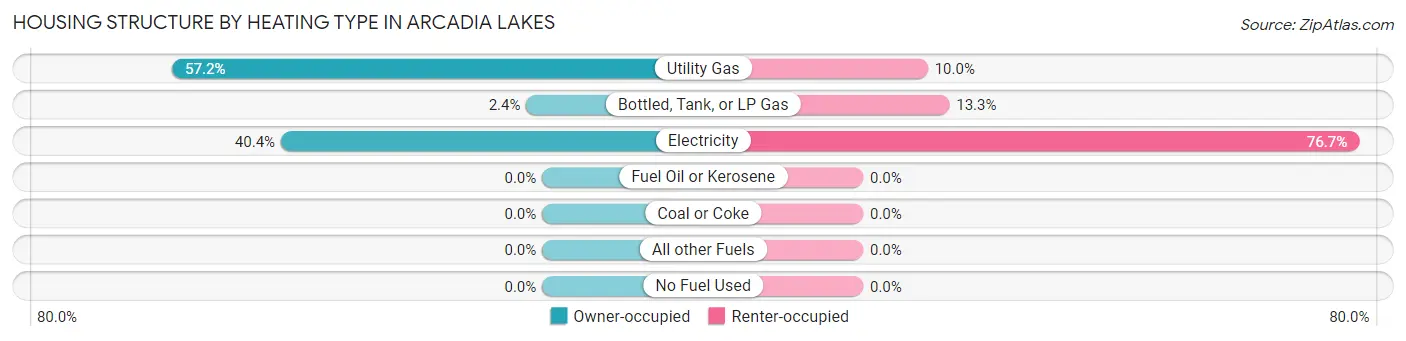
| Heating Type | Owner-occupied | Renter-occupied |
| Utility Gas | 211 (57.2%) | 3 (10.0%) |
| Bottled, Tank, or LP Gas | 9 (2.4%) | 4 (13.3%) |
| Electricity | 149 (40.4%) | 23 (76.7%) |
| Fuel Oil or Kerosene | 0 (0.0%) | 0 (0.0%) |
| Coal or Coke | 0 (0.0%) | 0 (0.0%) |
| All other Fuels | 0 (0.0%) | 0 (0.0%) |
| No Fuel Used | 0 (0.0%) | 0 (0.0%) |
| Total | 369 (100.0%) | 30 (100.0%) |
Household Vehicle Usage in Arcadia Lakes
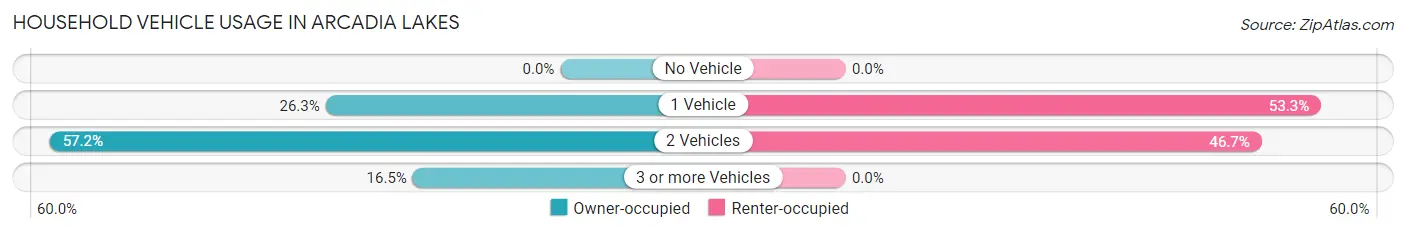
| Vehicles per Household | Owner-occupied | Renter-occupied |
| No Vehicle | 0 (0.0%) | 0 (0.0%) |
| 1 Vehicle | 97 (26.3%) | 16 (53.3%) |
| 2 Vehicles | 211 (57.2%) | 14 (46.7%) |
| 3 or more Vehicles | 61 (16.5%) | 0 (0.0%) |
| Total | 369 (100.0%) | 30 (100.0%) |
Real Estate & Mortgages in Arcadia Lakes
Real Estate and Mortgage Overview in Arcadia Lakes
| Characteristic | Without Mortgage | With Mortgage |
| Housing Units | 160 | 209 |
| Median Property Value | $250,000 | $352,300 |
| Median Household Income | $90,500 | $79 |
| Monthly Housing Costs | $709 | $25 |
| Real Estate Taxes | $2,727 | $0 |
Property Value by Mortgage Status in Arcadia Lakes
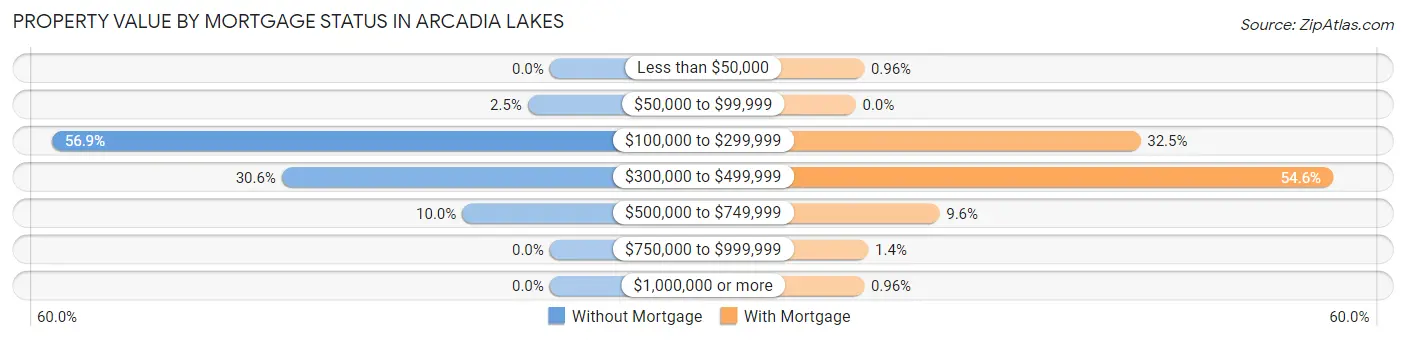
| Property Value | Without Mortgage | With Mortgage |
| Less than $50,000 | 0 (0.0%) | 2 (1.0%) |
| $50,000 to $99,999 | 4 (2.5%) | 0 (0.0%) |
| $100,000 to $299,999 | 91 (56.9%) | 68 (32.5%) |
| $300,000 to $499,999 | 49 (30.6%) | 114 (54.5%) |
| $500,000 to $749,999 | 16 (10.0%) | 20 (9.6%) |
| $750,000 to $999,999 | 0 (0.0%) | 3 (1.4%) |
| $1,000,000 or more | 0 (0.0%) | 2 (1.0%) |
| Total | 160 (100.0%) | 209 (100.0%) |
Household Income by Mortgage Status in Arcadia Lakes
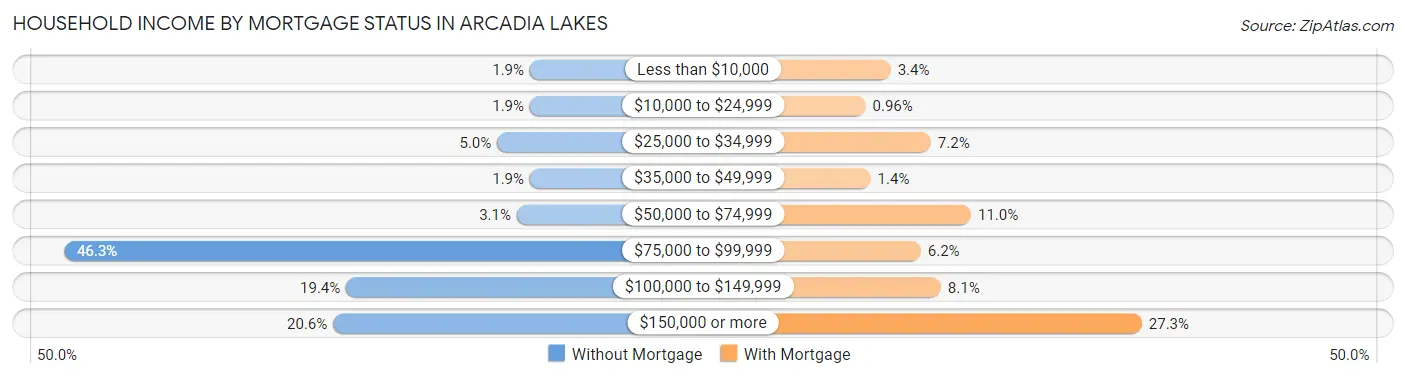
| Household Income | Without Mortgage | With Mortgage |
| Less than $10,000 | 3 (1.9%) | 7 (3.4%) |
| $10,000 to $24,999 | 3 (1.9%) | 2 (1.0%) |
| $25,000 to $34,999 | 8 (5.0%) | 15 (7.2%) |
| $35,000 to $49,999 | 3 (1.9%) | 3 (1.4%) |
| $50,000 to $74,999 | 5 (3.1%) | 23 (11.0%) |
| $75,000 to $99,999 | 74 (46.3%) | 13 (6.2%) |
| $100,000 to $149,999 | 31 (19.4%) | 17 (8.1%) |
| $150,000 or more | 33 (20.6%) | 57 (27.3%) |
| Total | 160 (100.0%) | 209 (100.0%) |
Property Value to Household Income Ratio in Arcadia Lakes
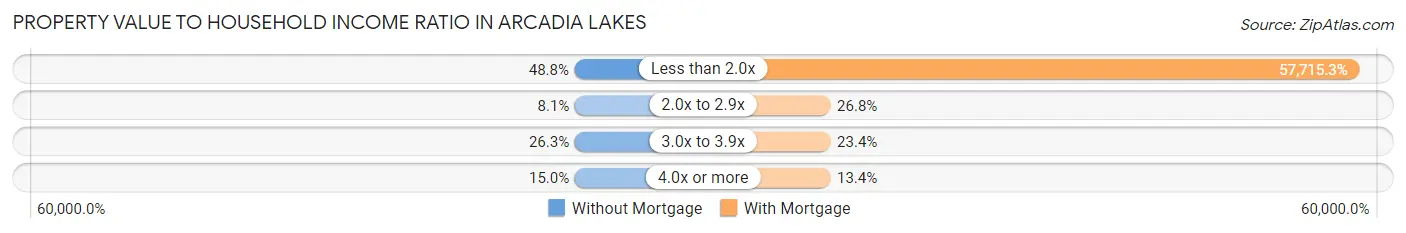
| Value-to-Income Ratio | Without Mortgage | With Mortgage |
| Less than 2.0x | 78 (48.7%) | 120,625 (57,715.3%) |
| 2.0x to 2.9x | 13 (8.1%) | 56 (26.8%) |
| 3.0x to 3.9x | 42 (26.3%) | 49 (23.4%) |
| 4.0x or more | 24 (15.0%) | 28 (13.4%) |
| Total | 160 (100.0%) | 209 (100.0%) |
Real Estate Taxes by Mortgage Status in Arcadia Lakes
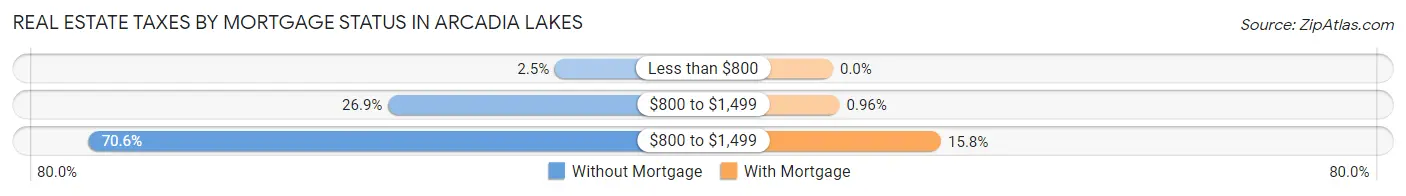
| Property Taxes | Without Mortgage | With Mortgage |
| Less than $800 | 4 (2.5%) | 0 (0.0%) |
| $800 to $1,499 | 43 (26.9%) | 2 (1.0%) |
| $800 to $1,499 | 113 (70.6%) | 33 (15.8%) |
| Total | 160 (100.0%) | 209 (100.0%) |
Health & Disability in Arcadia Lakes
Health Insurance Coverage by Age in Arcadia Lakes
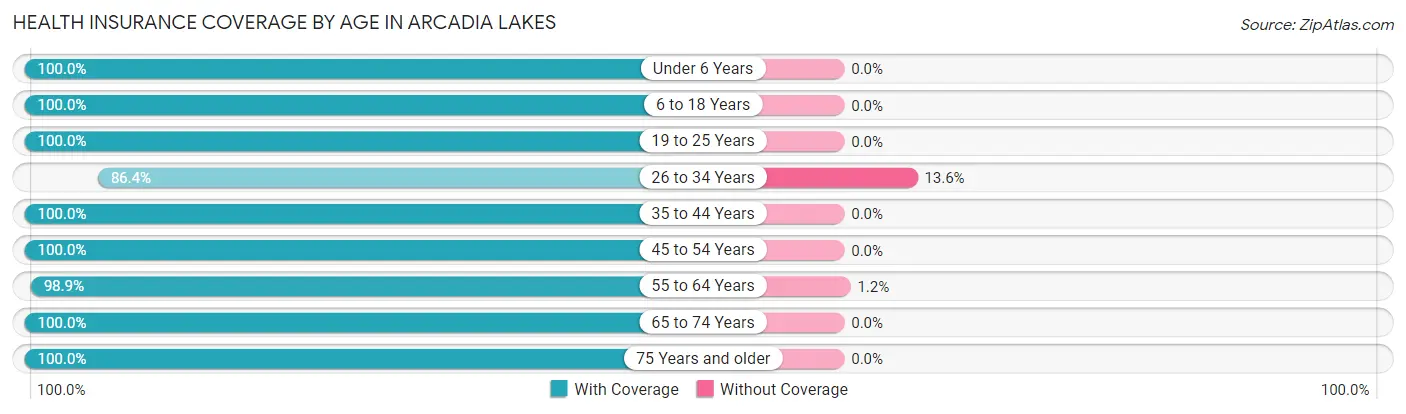
| Age Bracket | With Coverage | Without Coverage |
| Under 6 Years | 33 (100.0%) | 0 (0.0%) |
| 6 to 18 Years | 115 (100.0%) | 0 (0.0%) |
| 19 to 25 Years | 14 (100.0%) | 0 (0.0%) |
| 26 to 34 Years | 38 (86.4%) | 6 (13.6%) |
| 35 to 44 Years | 90 (100.0%) | 0 (0.0%) |
| 45 to 54 Years | 51 (100.0%) | 0 (0.0%) |
| 55 to 64 Years | 86 (98.9%) | 1 (1.1%) |
| 65 to 74 Years | 297 (100.0%) | 0 (0.0%) |
| 75 Years and older | 140 (100.0%) | 0 (0.0%) |
| Total | 864 (99.2%) | 7 (0.8%) |
Health Insurance Coverage by Citizenship Status in Arcadia Lakes
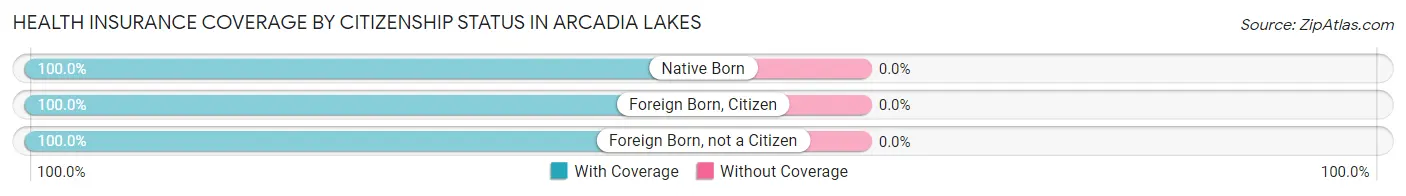
| Citizenship Status | With Coverage | Without Coverage |
| Native Born | 33 (100.0%) | 0 (0.0%) |
| Foreign Born, Citizen | 115 (100.0%) | 0 (0.0%) |
| Foreign Born, not a Citizen | 14 (100.0%) | 0 (0.0%) |
Health Insurance Coverage by Household Income in Arcadia Lakes
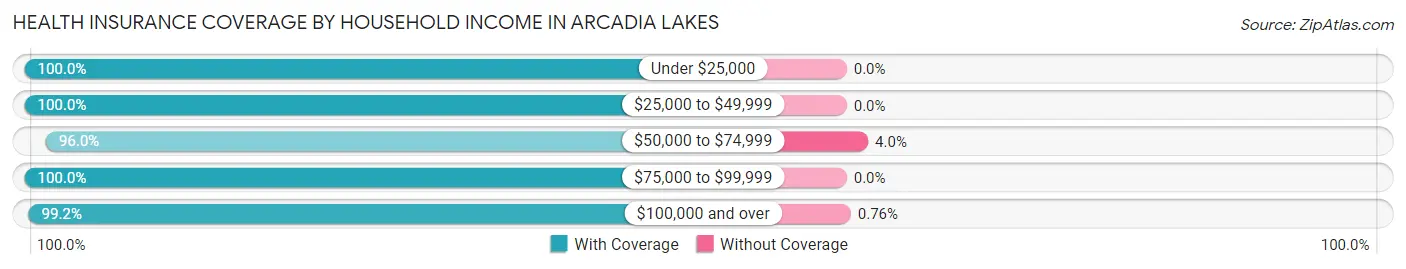
| Household Income | With Coverage | Without Coverage |
| Under $25,000 | 41 (100.0%) | 0 (0.0%) |
| $25,000 to $49,999 | 47 (100.0%) | 0 (0.0%) |
| $50,000 to $74,999 | 72 (96.0%) | 3 (4.0%) |
| $75,000 to $99,999 | 181 (100.0%) | 0 (0.0%) |
| $100,000 and over | 523 (99.2%) | 4 (0.8%) |
Public vs Private Health Insurance Coverage by Age in Arcadia Lakes
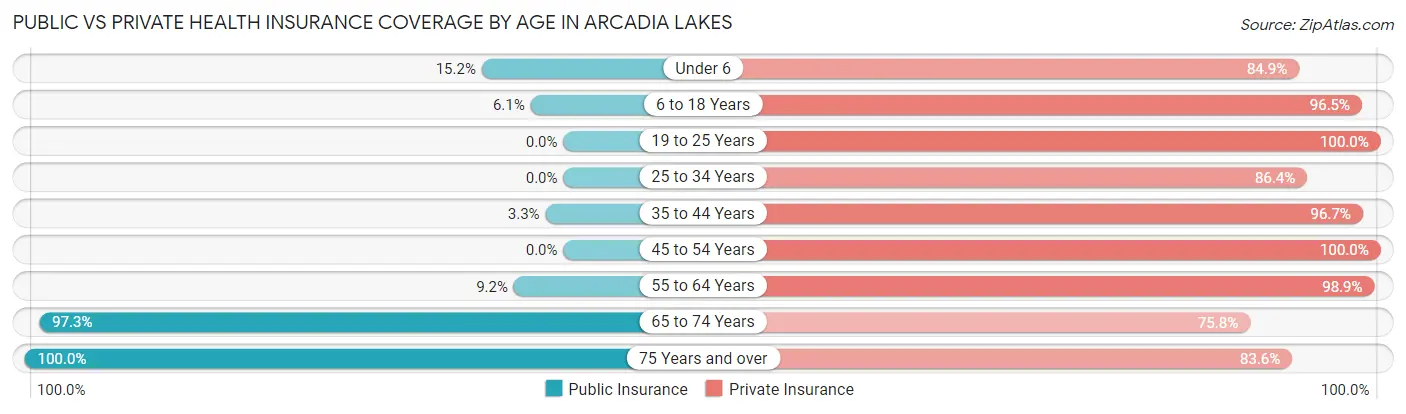
| Age Bracket | Public Insurance | Private Insurance |
| Under 6 | 5 (15.1%) | 28 (84.9%) |
| 6 to 18 Years | 7 (6.1%) | 111 (96.5%) |
| 19 to 25 Years | 0 (0.0%) | 14 (100.0%) |
| 25 to 34 Years | 0 (0.0%) | 38 (86.4%) |
| 35 to 44 Years | 3 (3.3%) | 87 (96.7%) |
| 45 to 54 Years | 0 (0.0%) | 51 (100.0%) |
| 55 to 64 Years | 8 (9.2%) | 86 (98.9%) |
| 65 to 74 Years | 289 (97.3%) | 225 (75.8%) |
| 75 Years and over | 140 (100.0%) | 117 (83.6%) |
| Total | 452 (51.9%) | 757 (86.9%) |
Disability Status by Sex by Age in Arcadia Lakes
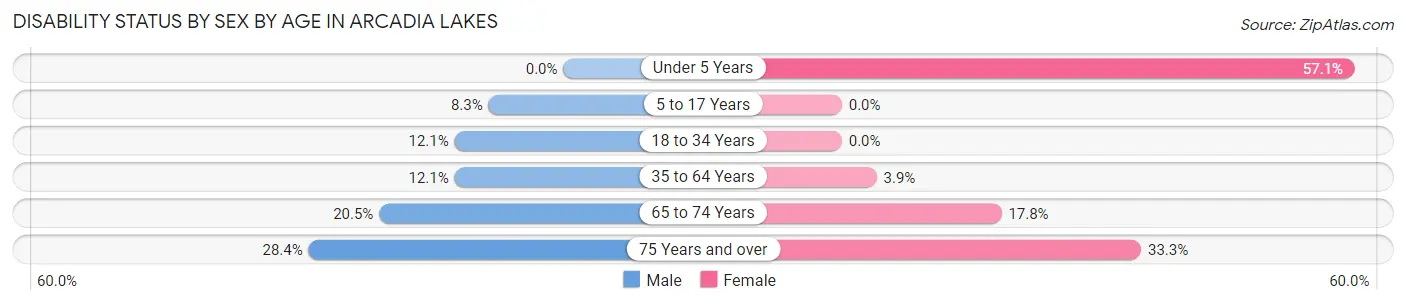
| Age Bracket | Male | Female |
| Under 5 Years | 0 (0.0%) | 4 (57.1%) |
| 5 to 17 Years | 7 (8.3%) | 0 (0.0%) |
| 18 to 34 Years | 4 (12.1%) | 0 (0.0%) |
| 35 to 64 Years | 12 (12.1%) | 5 (3.9%) |
| 65 to 74 Years | 24 (20.5%) | 32 (17.8%) |
| 75 Years and over | 21 (28.4%) | 22 (33.3%) |
Disability Class by Sex by Age in Arcadia Lakes
Disability Class: Hearing Difficulty
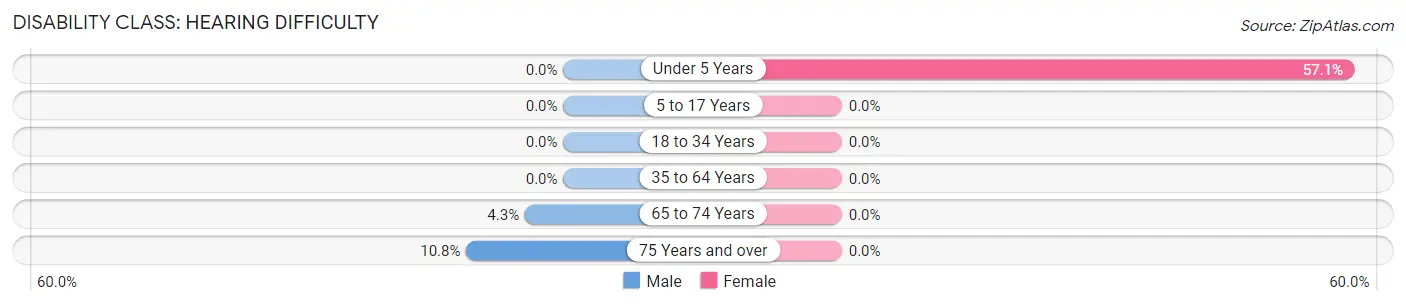
| Age Bracket | Male | Female |
| Under 5 Years | 0 (0.0%) | 4 (57.1%) |
| 5 to 17 Years | 0 (0.0%) | 0 (0.0%) |
| 18 to 34 Years | 0 (0.0%) | 0 (0.0%) |
| 35 to 64 Years | 0 (0.0%) | 0 (0.0%) |
| 65 to 74 Years | 5 (4.3%) | 0 (0.0%) |
| 75 Years and over | 8 (10.8%) | 0 (0.0%) |
Disability Class: Vision Difficulty
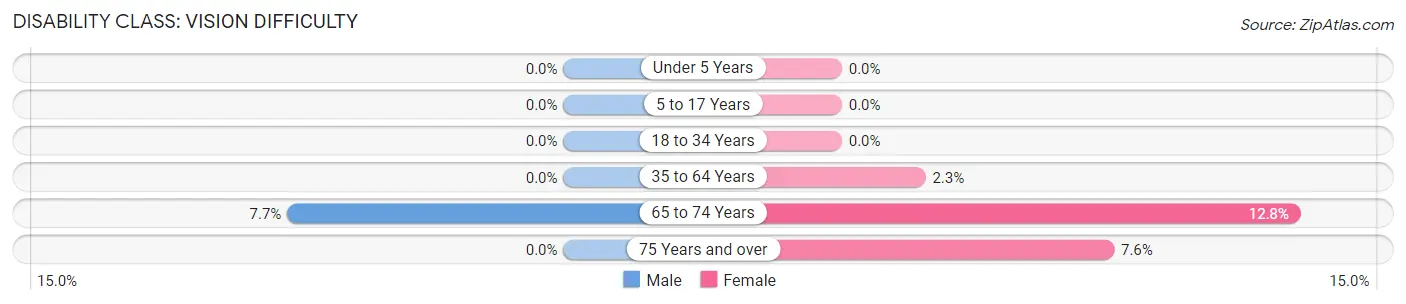
| Age Bracket | Male | Female |
| Under 5 Years | 0 (0.0%) | 0 (0.0%) |
| 5 to 17 Years | 0 (0.0%) | 0 (0.0%) |
| 18 to 34 Years | 0 (0.0%) | 0 (0.0%) |
| 35 to 64 Years | 0 (0.0%) | 3 (2.3%) |
| 65 to 74 Years | 9 (7.7%) | 23 (12.8%) |
| 75 Years and over | 0 (0.0%) | 5 (7.6%) |
Disability Class: Cognitive Difficulty
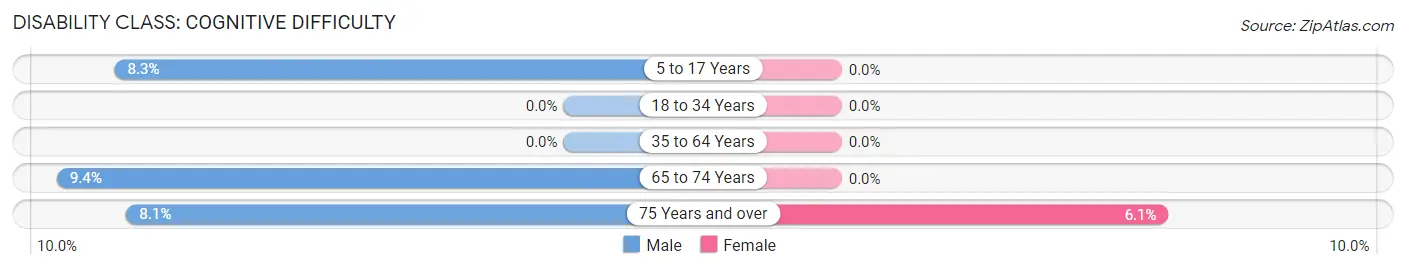
| Age Bracket | Male | Female |
| 5 to 17 Years | 7 (8.3%) | 0 (0.0%) |
| 18 to 34 Years | 0 (0.0%) | 0 (0.0%) |
| 35 to 64 Years | 0 (0.0%) | 0 (0.0%) |
| 65 to 74 Years | 11 (9.4%) | 0 (0.0%) |
| 75 Years and over | 6 (8.1%) | 4 (6.1%) |
Disability Class: Ambulatory Difficulty
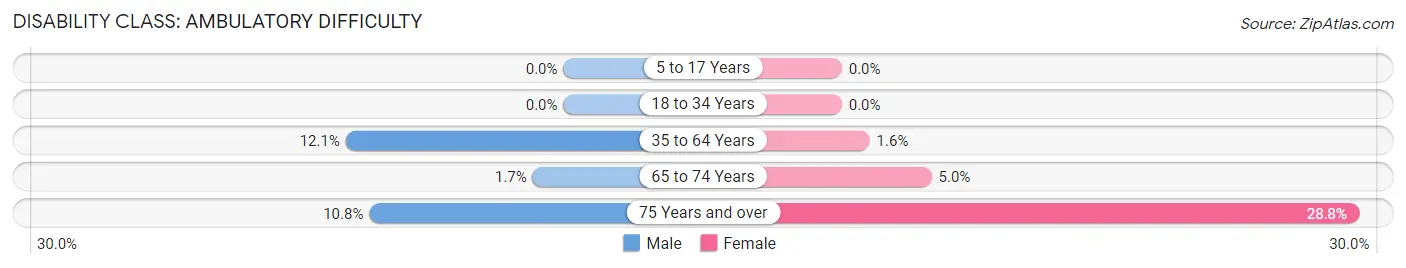
| Age Bracket | Male | Female |
| 5 to 17 Years | 0 (0.0%) | 0 (0.0%) |
| 18 to 34 Years | 0 (0.0%) | 0 (0.0%) |
| 35 to 64 Years | 12 (12.1%) | 2 (1.5%) |
| 65 to 74 Years | 2 (1.7%) | 9 (5.0%) |
| 75 Years and over | 8 (10.8%) | 19 (28.8%) |
Disability Class: Self-Care Difficulty
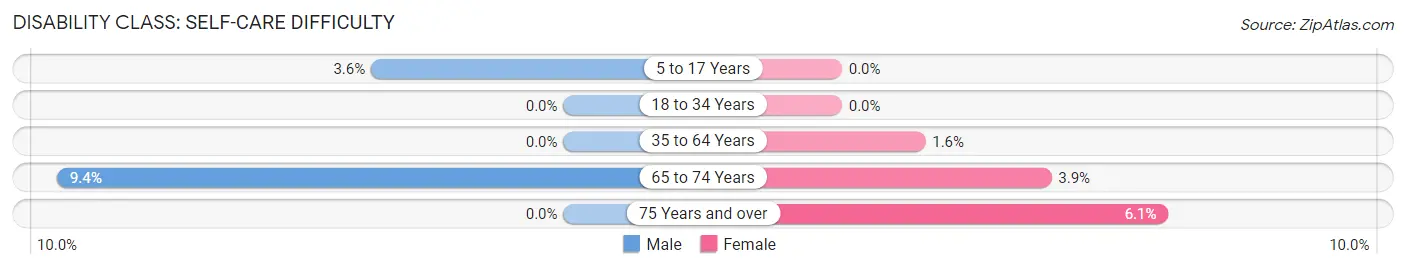
| Age Bracket | Male | Female |
| 5 to 17 Years | 3 (3.6%) | 0 (0.0%) |
| 18 to 34 Years | 0 (0.0%) | 0 (0.0%) |
| 35 to 64 Years | 0 (0.0%) | 2 (1.5%) |
| 65 to 74 Years | 11 (9.4%) | 7 (3.9%) |
| 75 Years and over | 0 (0.0%) | 4 (6.1%) |
Technology Access in Arcadia Lakes
Computing Device Access in Arcadia Lakes
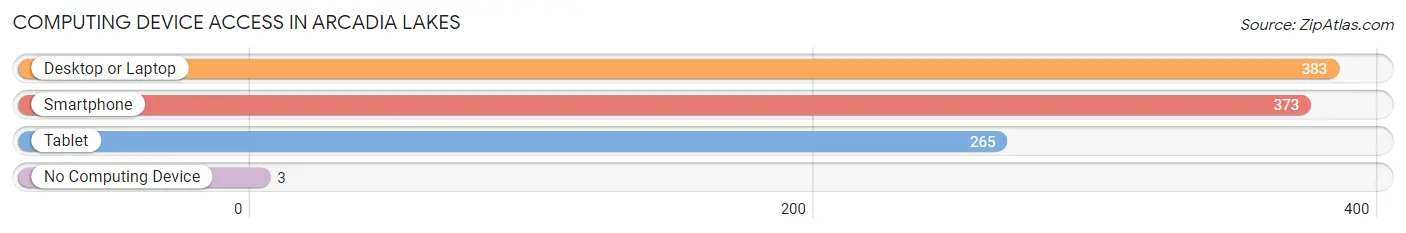
| Device Type | # Households | % Households |
| Desktop or Laptop | 383 | 96.0% |
| Smartphone | 373 | 93.5% |
| Tablet | 265 | 66.4% |
| No Computing Device | 3 | 0.7% |
| Total | 399 | 100.0% |
Internet Access in Arcadia Lakes
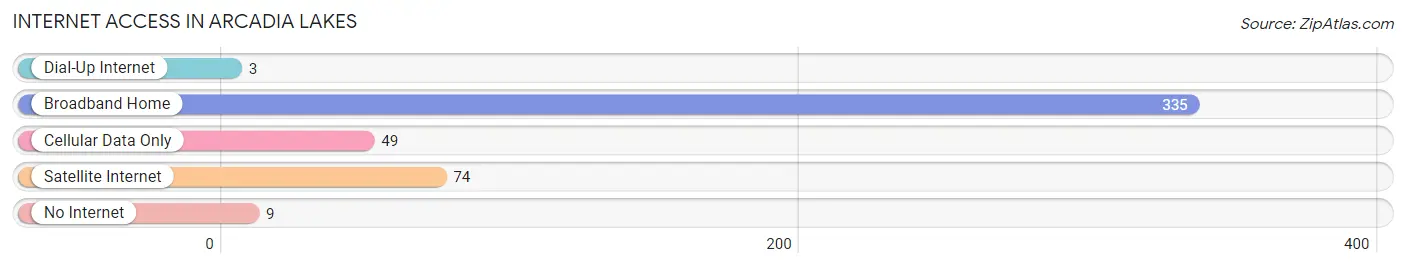
| Internet Type | # Households | % Households |
| Dial-Up Internet | 3 | 0.7% |
| Broadband Home | 335 | 84.0% |
| Cellular Data Only | 49 | 12.3% |
| Satellite Internet | 74 | 18.5% |
| No Internet | 9 | 2.3% |
| Total | 399 | 100.0% |
Arcadia Lakes Summary
Arcadia Lakes is a small town located in Richland County, South Carolina. It is situated just south of the city of Columbia, the state capital. The town was founded in the late 19th century and has a population of approximately 1,500 people.
Geography
Arcadia Lakes is located in the Midlands region of South Carolina, approximately 10 miles south of Columbia. The town is situated on the banks of the Congaree River, which flows through the area. The town is surrounded by a number of small lakes, which give the town its name. The town is located in a rural area, with the nearest major city being Columbia.
The town is located in a humid subtropical climate zone, with hot summers and mild winters. The average annual temperature is around 70 degrees Fahrenheit, with the average high temperature in the summer months reaching around 90 degrees Fahrenheit. The average low temperature in the winter months is around 40 degrees Fahrenheit.
Economy
The economy of Arcadia Lakes is largely based on agriculture and tourism. The town is home to a number of small farms, which produce a variety of crops, including corn, soybeans, and cotton. The town is also home to a number of small businesses, including restaurants, retail stores, and service providers.
The town is also a popular tourist destination, with a number of attractions in the area. These include the Congaree National Park, the South Carolina State Museum, and the Columbia Zoo. The town is also home to a number of festivals and events throughout the year, including the Arcadia Lakes Festival and the Arcadia Lakes Arts and Crafts Fair.
Demographics
As of the 2010 census, the population of Arcadia Lakes was 1,500 people. The racial makeup of the town was 79.2% White, 16.2% African American, 0.7% Native American, 0.7% Asian, 0.1% Pacific Islander, and 2.3% from other races. The median household income was $37,500, and the median family income was $45,000.
Conclusion
Arcadia Lakes is a small town located in Richland County, South Carolina. It is situated on the banks of the Congaree River and is surrounded by a number of small lakes, giving the town its name. The town has a population of approximately 1,500 people and is largely based on agriculture and tourism. The town is home to a number of small businesses, attractions, and festivals throughout the year. The racial makeup of the town is 79.2% White, 16.2% African American, 0.7% Native American, 0.7% Asian, 0.1% Pacific Islander, and 2.3% from other races. The median household income was $37,500, and the median family income was $45,000.
Common Questions
What is the Total Population of Arcadia Lakes?
Total Population of Arcadia Lakes is 871.
What is the Total Male Population of Arcadia Lakes?
Total Male Population of Arcadia Lakes is 411.
What is the Total Female Population of Arcadia Lakes?
Total Female Population of Arcadia Lakes is 460.
What is the Ratio of Males per 100 Females in Arcadia Lakes?
There are 89.35 Males per 100 Females in Arcadia Lakes.
What is the Ratio of Females per 100 Males in Arcadia Lakes?
There are 111.92 Females per 100 Males in Arcadia Lakes.
What is the Median Population Age in Arcadia Lakes?
Median Population Age in Arcadia Lakes is 65.1 Years.
What is the Average Family Size in Arcadia Lakes
Average Family Size in Arcadia Lakes is 2.7 People.
What is the Average Household Size in Arcadia Lakes
Average Household Size in Arcadia Lakes is 2.2 People.
What is Per Capita Income in Arcadia Lakes?
Per Capita income in Arcadia Lakes is $59,109.
What is the Median Family Income in Arcadia Lakes?
Median Family Income in Arcadia Lakes is $120,179.
What is the Median Household income in Arcadia Lakes?
Median Household Income in Arcadia Lakes is $100,625.
What is Income or Wage Gap in Arcadia Lakes?
Income or Wage Gap in Arcadia Lakes is 5.1%.
Women in Arcadia Lakes earn 94.9 cents for every dollar earned by a man.
What is Inequality or Gini Index in Arcadia Lakes?
Inequality or Gini Index in Arcadia Lakes is 0.40.
How Large is the Labor Force in Arcadia Lakes?
There are 455 People in the Labor Forcein in Arcadia Lakes.
What is the Percentage of People in the Labor Force in Arcadia Lakes?
61.2% of People are in the Labor Force in Arcadia Lakes.
What is the Unemployment Rate in Arcadia Lakes?
Unemployment Rate in Arcadia Lakes is 0.9%.