Cities with the Most Immigrants from El Salvador in South Carolina
RELATED REPORTS & OPTIONS
El Salvador
South Carolina
Compare Cities
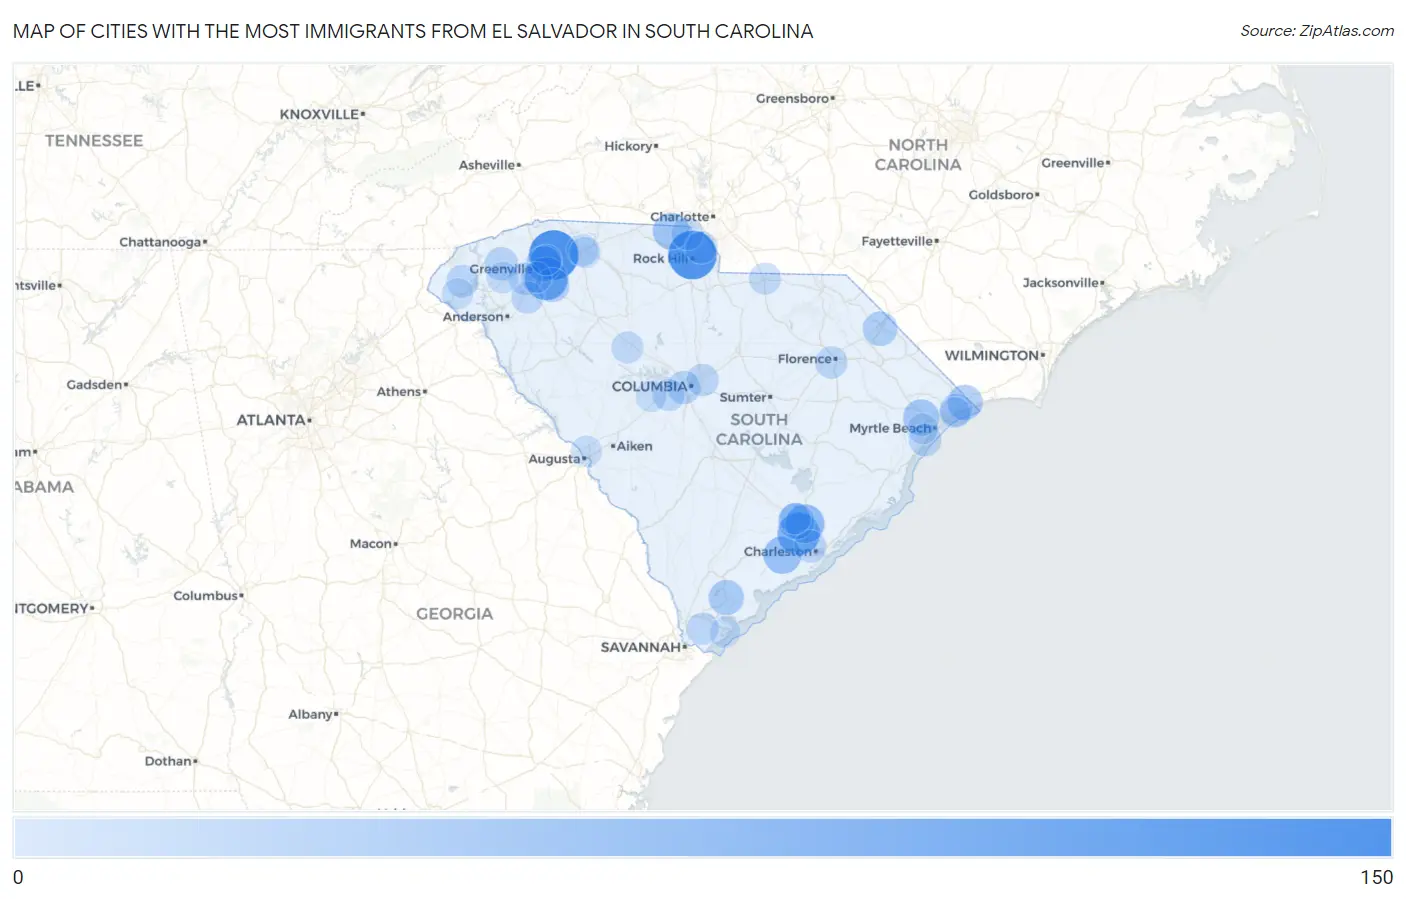
Map of Cities with the Most Immigrants from El Salvador in South Carolina
0
150
Cities with the Most Immigrants from El Salvador in South Carolina
| City | El Salvador | vs State | vs National | |
| 1. | Greer | 147 | 2,998(4.90%)#1 | 1,408,349(0.01%)#1,042 |
| 2. | Rock Hill | 139 | 2,998(4.64%)#2 | 1,408,349(0.01%)#1,078 |
| 3. | East Camden | 108 | 2,998(3.60%)#3 | 1,408,349(0.01%)#1,251 |
| 4. | Mauldin | 96 | 2,998(3.20%)#4 | 1,408,349(0.01%)#1,333 |
| 5. | North Charleston | 91 | 2,998(3.04%)#5 | 1,408,349(0.01%)#1,373 |
| 6. | Goose Creek | 66 | 2,998(2.20%)#6 | 1,408,349(0.00%)#1,633 |
| 7. | Carolina Forest | 60 | 2,998(2.00%)#7 | 1,408,349(0.00%)#1,726 |
| 8. | Hollywood | 56 | 2,998(1.87%)#8 | 1,408,349(0.00%)#1,789 |
| 9. | Clover | 49 | 2,998(1.63%)#9 | 1,408,349(0.00%)#1,904 |
| 10. | Red Hill | 45 | 2,998(1.50%)#10 | 1,408,349(0.00%)#1,975 |
| 11. | Ladson | 45 | 2,998(1.50%)#11 | 1,408,349(0.00%)#1,976 |
| 12. | Wade Hampton | 39 | 2,998(1.30%)#12 | 1,408,349(0.00%)#2,092 |
| 13. | Little River | 38 | 2,998(1.27%)#13 | 1,408,349(0.00%)#2,116 |
| 14. | Beaufort | 37 | 2,998(1.23%)#14 | 1,408,349(0.00%)#2,140 |
| 15. | Dillon | 32 | 2,998(1.07%)#15 | 1,408,349(0.00%)#2,248 |
| 16. | Simpsonville | 29 | 2,998(0.97%)#16 | 1,408,349(0.00%)#2,329 |
| 17. | West Columbia | 23 | 2,998(0.77%)#17 | 1,408,349(0.00%)#2,523 |
| 18. | Pickens | 23 | 2,998(0.77%)#18 | 1,408,349(0.00%)#2,545 |
| 19. | North Myrtle Beach | 21 | 2,998(0.70%)#19 | 1,408,349(0.00%)#2,610 |
| 20. | Lake Wylie | 18 | 2,998(0.60%)#20 | 1,408,349(0.00%)#2,749 |
| 21. | Surfside Beach | 18 | 2,998(0.60%)#21 | 1,408,349(0.00%)#2,759 |
| 22. | Charleston | 17 | 2,998(0.57%)#22 | 1,408,349(0.00%)#2,767 |
| 23. | Columbia | 17 | 2,998(0.57%)#23 | 1,408,349(0.00%)#2,768 |
| 24. | Fort Mill | 17 | 2,998(0.57%)#24 | 1,408,349(0.00%)#2,777 |
| 25. | Powdersville | 17 | 2,998(0.57%)#25 | 1,408,349(0.00%)#2,786 |
| 26. | West Union | 17 | 2,998(0.57%)#26 | 1,408,349(0.00%)#2,810 |
| 27. | Florence | 16 | 2,998(0.53%)#27 | 1,408,349(0.00%)#2,815 |
| 28. | Red Bank | 15 | 2,998(0.50%)#28 | 1,408,349(0.00%)#2,888 |
| 29. | West Pelzer | 15 | 2,998(0.50%)#29 | 1,408,349(0.00%)#2,916 |
| 30. | Bluffton | 14 | 2,998(0.47%)#30 | 1,408,349(0.00%)#2,931 |
| 31. | Newberry | 13 | 2,998(0.43%)#31 | 1,408,349(0.00%)#3,009 |
| 32. | Pageland | 13 | 2,998(0.43%)#32 | 1,408,349(0.00%)#3,031 |
| 33. | Southern Shops | 11 | 2,998(0.37%)#33 | 1,408,349(0.00%)#3,142 |
| 34. | Liberty | 11 | 2,998(0.37%)#34 | 1,408,349(0.00%)#3,143 |
| 35. | Sangaree | 9 | 2,998(0.30%)#35 | 1,408,349(0.00%)#3,266 |
| 36. | Saxon | 8 | 2,998(0.27%)#36 | 1,408,349(0.00%)#3,369 |
| 37. | Westminster | 8 | 2,998(0.27%)#37 | 1,408,349(0.00%)#3,379 |
| 38. | North Augusta | 7 | 2,998(0.23%)#38 | 1,408,349(0.00%)#3,417 |
| 39. | Gilbert | 7 | 2,998(0.23%)#39 | 1,408,349(0.00%)#3,472 |
| 40. | Hilton Head Island | 6 | 2,998(0.20%)#40 | 1,408,349(0.00%)#3,482 |
| 41. | Gantt | 6 | 2,998(0.20%)#41 | 1,408,349(0.00%)#3,501 |
| 42. | Socastee | 5 | 2,998(0.17%)#42 | 1,408,349(0.00%)#3,571 |
| 43. | Atlantic Beach | 5 | 2,998(0.17%)#43 | 1,408,349(0.00%)#3,636 |
| 44. | Taylors | 4 | 2,998(0.13%)#44 | 1,408,349(0.00%)#3,644 |
Common Questions
What are the Top 10 Cities with the Most Immigrants from El Salvador in South Carolina?
Top 10 Cities with the Most Immigrants from El Salvador in South Carolina are:
#1
147
#2
139
#3
96
#4
91
#5
66
#6
56
#7
49
#8
45
#9
45
#10
39
What city has the Most Immigrants from El Salvador in South Carolina?
Greer has the Most Immigrants from El Salvador in South Carolina with 147.
What is the Total Immigrants from El Salvador in the State of South Carolina?
Total Immigrants from El Salvador in South Carolina is 2,998.
What is the Total Immigrants from El Salvador in the United States?
Total Immigrants from El Salvador in the United States is 1,408,349.